X-ray spectral variations of Circinus X-1 observed with NICER throughout an entire orbital cycle
Abstract
Circinus X-1 (Cir X-1) is a neutron star binary with an elliptical orbit of 16.6 days. The source is unique for its extreme youth, providing a key to understanding early binary evolution. However, its X-ray variability is too complex to reach a clear interpretation. We conducted the first high cadence (every 4 hours on average) observations covering one entire orbit using the NICER X-ray telescope. The X-ray flux behavior can be divided into stable, dip, and flaring phases. The X-ray spectra in all phases can be described by a common model consisting of a partially covered disk black body emission and the line features from a highly-ionized photo-ionized plasma. The spectral change over the orbit is attributable to rapid changes of the partial covering medium in the line-of-sight and gradual changes of the disk black body emission. Emission lines of the H-like and He-like Mg, Si, S, and Fe are detected, most prominently in the dip phase. The Fe emission lines change to absorption in the course of the transition from the dip phase to the flaring phase. The estimated ionization degree indicates no significant changes, suggesting that the photo-ionized plasma is stable over the orbit. We propose a simple model in which the disk black body emission is partially blocked by such a local medium in the line-of-sight that has spatial structures depending on the azimuth of the accretion disk. Emission lines upon the continuum emission are from the photo-ionized plasma located outside of the blocking material.
1 Introduction
Circinus X-1 (Cir X-1) is an X-ray binary system containing a neutron star (Margon et al., 1971) and a companion of an unidentified nature (Jonker et al., 2007; Johnston et al., 2001). It is unique for its extreme youth among all the known X-ray binaries; its association with the remnant of the supernova that produced the neutron star puts it at an estimated age of 4600 yr (Heinz et al., 2013). It is also the first X-ray binary from which the P Cygni profiles are clearly observed in the X-ray spectra (Brandt & Schulz, 2000; Schulz & Brandt, 2002), indicating the presence of disk winds around the neutron star. Such disk winds can contribute to the dissipation of the mass and angular momentum of the system, thereby influencing the evolution of the binary system (Begelman et al., 1983).
Despite the importance of Cir X-1 in many astrophysical contexts, the understanding of the system has been hampered by the notoriously wild behavior of the X-ray flux across various time scales. It has an orbital period of 16.6 days (Kaluzienski et al., 1976; Jonker et al., 2007) and a significant eccentricity of 0.45 (Jonker et al., 2007). Across time scales longer than the orbital period, it shows drastic flux changes over a few orders of magnitude from a milli-Crab to a super-Crab. In time scales shorter than the orbital period, the X-ray flux changes as a function of the orbital phase in a regular (Kaluzienski et al., 1976) or an irregular (Asai et al., 2014) fashion. On the shortest time scales, it exhibits the twin kHz quasi-periodic oscillations (Tennant, 1987) and type I bursts (Tennant et al., 1986; Linares et al., 2010), both of which are signatures of the accreting neutron stars with a low magnetic field (van der Klis, 2006). Among these variations across different time scales, the X-ray flux/spectral variations throughout the orbital phases are most critical for understanding the accretion disk states around the compact object.
Many studies have been made on the X-ray spectral components and their changes over the orbital period (e..g., Shirey et al. 1996; Brandt et al. 1996; Iaria et al. 2001, 2002; Schulz & Brandt 2002; Ding et al. 2006a, b; D’Ai et al. 2007; Schulz et al. 2008; Ding et al. 2012; Schulz et al. 2020). An important work among them is the detection of the emission and absorption lines of highly ionized metals in the high energy transmission grating (HETG) spectra with the Chandra X-ray Observatory, and a successful application of the photo-ionized plasma model in a low flux state (Schulz et al., 2008, 2020). Because Chandra observations are costly to cover the entire orbital cycle, the high-resolution spectra were obtained only at limited orbital phases including the periastron and apastron. An obvious next step is to cover the entire orbital phase with a spectral resolution capable of detecting the photo-ionized plasma emission and absorption features and constructing a model of the X-ray emitting objects. This is the goal of this paper using the new data set obtained with the Neutron Star Interior Composition Explorer (NICER; Gendreau et al. 2012, 2016) telescope covering an entire orbital period with a high cadence.
We start with the observation and data reduction in § 2 and present the X-ray light curve and spectral analysis in § 3. We then discuss an interpretation of the observed results with a simple model in § 4 and summarize the study in § 5. Throughout the paper, we adopt the following; the distance to Cir X-1 of 9.4 kpc (Heinz et al., 2015), and the ephemerises of the periastron (Nicolson, 2007) given by
| (1) |
in which is the cycle number since MJD 43076.32.
2 Observations and Data Reduction
NICER is an experiment located on the International Space Station (ISS) in near-Earth orbit at an altitude of 400 km. The X-ray Timing Instrument (XTI) onboard NICER consists of 56 sets of the X-Ray Concentrator optics (XRC; Okajima et al. 2016) and the Silicon Drift Detector (SDD; Prigozhin et al. 2012). It has the capability of fast pointing with a robotic mechanism. XTI’s large effective area (600 cm2 at 6 keV), moderate energy resolution (an FWHM of 137 eV at 6 keV), fast absolute timing precision ( 300 ns), and operational agility and flexibility opened an unexplored field for the timely X-ray spectroscopy of variable sources, uncompromised by photon statistics and dynamic range. These features are particularly suited for X-ray binaries, in which fast variability of up to a few kHz and orbital flux changes are commonly observed.
NICER usually conducts observations consisting of a short (500 s) snapshot with many targets in one ISS orbit of 90 minutes. Cir X-1 was observed with 103 snapshots totaling 61 ks (ObsID 357801XX01, where XX02 to 17 and 3578011502, which we hereafter identify with a sequential number from 0 to 102) over an orbital period with 0.54–1.48 from 2020-08-01 to 2020-08-16 (MJD59062–59078). The average revisit time is 3.9 hours, which corresponds to 1 % of the 16.6 day orbit.
We retrieved the level 2 products from the archive and processed them into the level 3 products using the nicerl3 tools in HEAsoft version 6.31.1 and the calibration database version 20221001. The level 3 products include the X-ray light curves and spectra along with the redistribution matrix functions, the auxiliary response files, and background spectra, which we used for the timing and spectroscopy analysis. We modeled the background by SCORPEON model111https://heasarc.gsfc.nasa.gov/docs/nicer/analysis_threads/scorpeon-overview/.. The SCORPEON model produces a background model fitted along with the source spectrum including the following components; South Atlantic Anomaly (S), Cosmic Rays (COR), Polar and Precipitating Electrons (PE), cOnstant terms (O), and Noise peak (N) of NICER.
3 Analysis
We first explain the historical context of the NICER observation and present the X-ray light curve to define phases of the orbit based on flux changes (§ 3.1). We then select several representative spectra in each phase to construct spectral models and show that a common model can be applied to all phases despite apparent diversity (§ 3.2). Finally, we apply this common model to the entire data set and present the change in the spectral parameters across its orbit (§ 3.3) separately for the continuum (§ 3.3.1) and line (§ 3.3.2) components.
3.1 X-ray light curve

X-ray flux of Cir X-1 has been monitored for half a century. Light curves across three decades from 1968 to 2001 are given in (Parkinson et al., 2003), which we extended for two more decades up to 2023 in Figure 1. In the late 1990s and early 2000s, the observed flux exceeded a Crab, during which P Cygni profiles of highly-ionized metals were observed in X-ray grating spectra with Chandra (Brandt & Schulz, 2000; Schulz & Brandt, 2002). The flux declined to the 10 mCrab level throughout the 2010s, during which emission-dominated spectra were observed (Schulz et al., 2020). From around 2018, the flux recovered to a few hundred mCrab at a similar level as in the 1980s. This is when repeated NICER observations were made in its AO1–4 cycles (green lines). We present the result of the data taken in the AO2 cycle in 2020.

After the flux recovered in 2018, the light curve folded by became more reproducible than that during the low-flux period, in which irregular flux changes specific to an orbit were often observed (Asai et al., 2014). Figure 2 shows the NICER light curve covering one orbit (top) compared to the Monitor of All-sky X-ray Image (MAXI) light curve (Matsuoka et al., 2009) of five preceding orbits (bottom). Before the periastron at , the flux drops by an order of magnitude for 0.15, which is often called “long dips” in the literature (e.g., Asai et al. 2014). After the periastron, the flux suddenly increases and becomes unstable for 0.3. The flux decreases gradually thereafter. The NICER data revealed these features at a higher significance and a finer time resolution than any previous data. The sharp ingress and egress of the dips at 0.83 and 0.97, the rapid fluctuations at 1.0–1.3, and small dips at 0.61, 0.81, and 1.32 (“short dips”) in a single orbit would not have been detected without the NICER’s flexible and photon-rich observations.
We divide the NICER light curve into three phases using the Bayesian blocking method (Scargle et al., 2013). The boundaries are shown with the dotted horizontal lines in Figure 2. We label them the “dip” ( 0.84–1.0), “flaring” ( 1.0–1.29), and “stable” ( 0.54–0.84 and 1.29–1.48) phases. This division is consistent with the ASCA result (Iaria et al., 2001), in which three (dips, flaring, and stable) phases are recognized at 0.78–0.97, 0.93–0.3, and 0.3–0.7 based on observations covering one orbit in March 1998.
3.2 Modeling of X-ray spectra
We constructed the X-ray spectra in the 0.9–-10.5 keV range for each of the 103 snapshots. This energy range was chosen to obtain a high signal-to-noise ratio. As for the representative spectra, we selected six spectra in the three phases and characterize them in § 3.2.1 (stable), § 3.2.2 (dip), and § 3.2.3 (flaring). For the spectral modeling, we included the attenuation by photo-electric absorption (Verner et al., 1996) from the interstellar medium (ISM) of the solar abundance (Wilms et al., 2000). The spectra were rebinned to have at least 30 counts per energy bin and ensure the use of statistics.
3.2.1 Stable phase
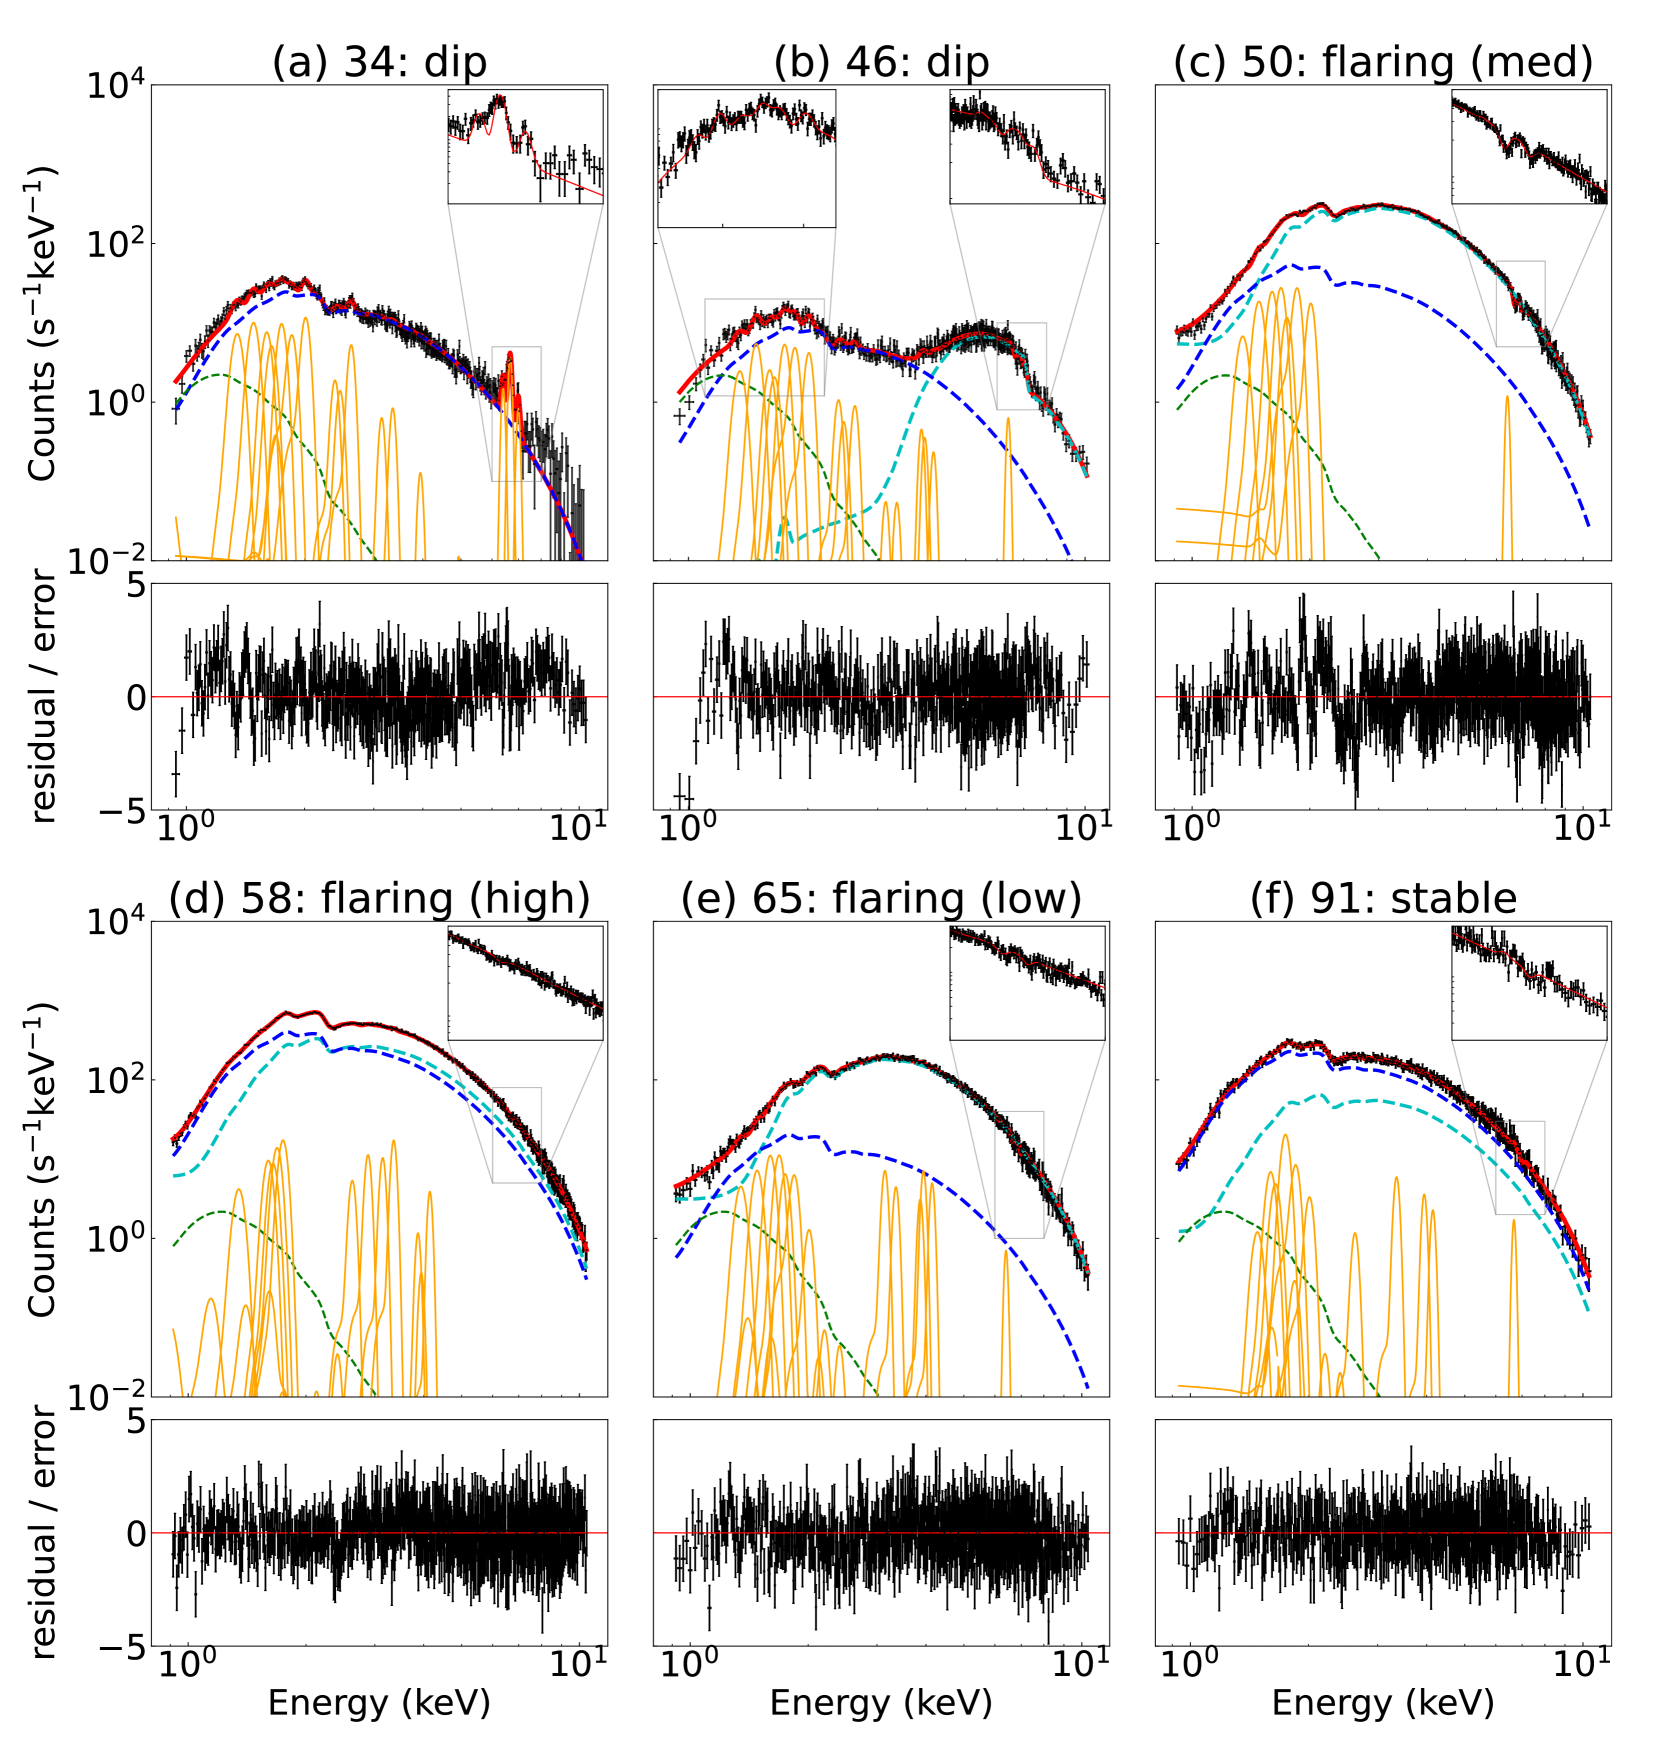
We start with the stable phase. The continuum spectral shape shows only a gradual decrease in flux. This is shown in snapshot 91’s data in Figure 3 (f). The continuum emission can be modeled with a simple disk black body component (Mitsuda et al., 1984; Makishima et al., 1986) with two fitting parameters (the normalization and the innermost disk temperature ), partially covered by a neutral cloud with two parameters (the covering fraction and the H-equivalent column density ) and interstellar absorption with a fixed column density of 2.0 cm-2. Schulz et al. (2008) showed that there can be several types of covering matter with different degrees of ionization along the line-of-sight. Our data did not allow us to distinguish these different types, thus we only assumed neutral matter. We further added the Gaussian model to account for the Fe K fluorescence line at 6.4 keV.
3.2.2 Dip phase
We next investigate the dip phase. The spectral shape changed in the middle of the dip phase. During the period of the first ten data points (hereafter “the early dip” period), the spectral shape exhibits one peak, which we represent with snapshot 34 (Fig. 3a). In contrast, during the period of the remaining six data points (hereafter ”the late dip” period), the shape exhibits two peaks, which we represent with snapshot 46 (Fig. 3b). Despite the difference, both can be described with different parameters of the same model. The two peaks are, in fact, reproduced by uncovered and covered components of the partially covered disk black body emission. The spectra in this phase are also characterized by numerous emission lines, most notably in highly ionized Fe, but also in lighter metals such as Mg, Si, and S. We fit them with Gaussian lines likely originating from a photo-ionized plasma. The plasma emission should accompany continuum emission in the soft band. In fact, we did observe excess emission in the softest end of the spectrum, which we phenomenologically represented with a power-law model.
3.2.3 Flaring phase
There are significant flux variations in the flaring phase (Fig. 2). We chose three snapshots representing high, medium, and low flux (snapshot 58, 50, and 65), respectively). The flux varies by a factor of 5, but the spectral shape does vary as much. We thus applied the same model (partially covered disk black body emission) and we were able to model the spectra through variations in the covering fraction and column density of the partial covering component. Several Gaussian lines were added, both positive and negative in flux, to account for the emission and absorption features, respectively.
3.2.4 All the phases
To summarize the result in § 3.2.1–§ 3.2.3, despite the variety of the spectral shapes, the spectra of the six selected snapshots were described well with the same approach; the disk black body emission partially covered by neutral cloud and fully covered by the ISM photo-electric absorption. Some minor differences remain, such as the soft excess emission required for the late dip phase (Fig. 3b) and the Gaussian lines observed either positive (emission) or negative (absorption) in different phases.
We thus constructed a common model to encompass these minor differences. The soft excess was required only in the dip phase, but we included this component in all phases with the parameters fixed to the parameter values derived from the dip phase. This does not influence the fitting in other phases, as the soft excess is overwhelmed by the uncovered disk black body emission. We also added Gaussian lines at the energies of Ly and He transitions of H-like and He-like ions of Mg, Si, S, and Fe plus Fe I K fluorescence. Here, the He line refers to all unresolved lines of (1s)(2p) or (1s)(2s) (1s)2 transitions, while the Ly line refers to (2p) (1s) transitions. We allowed both positive and negative values in the fit to account for both emission and absorption. No significant Doppler shift or broadening was observed in any of these lines, thus we fixed the line energy shift and width to 0. The best-fit models shown in Figure 3 are the results of applying this common model.
In the previous work of Cir X-1, the X-ray continuum spectra were often explained by a combination of multiple spectral components of a black body, disk black body, and Comptonized emission (e.g., Shirey et al. 1999; Iaria et al. 2005; D’Aì et al. 2012). We argue that a single disk black body component is sufficient to explain the variety of spectra for the present data set. The partial coverage of the disk black body emission alone can make two continuum peaks for the covered and uncovered parts. The addition of a black body component was not required in all spectra throughout the orbit. We note that the actual emission would be a mixture of emissions from the neutron star surface, the boundary layer, and the accretion disk, but a single disk black body component is sufficient to explain the data.
3.3 Change of X-ray spectra
Having constructed a common spectral model using the six selected snapshots, we apply it uniformly to the spectra of all 103 snapshots. Although the fitting did not work for some individual spectra, the overall variation of the spectral parameters throughout the orbit could be characterized with this method. We first track the phase-dependent change of the parameters of the continuum components (§ 3.3.1) and then those of the line components (§ 3.3.2).
3.3.1 Continuum
The phase-dependent change of the spectral model parameters for the continuum components is given in green symbols in Figure 4. The free parameters are the normalization and for the disk black body emission and and for the partial covering absorption. To mitigate a degeneracy in the parameters space, firstly we fitted the data only above 4 keV, obtained the best-fit values. We then fitted using all the available energy range with the fixed values.
In the stable phase, the parameters change gradually. Some spectra do not require the partial covering material, thus we fixed both and to null. In the flaring phase, we found that the fitting results widely vary, in particular, for normalization. As this parameter represents the entire disk luminosity, it is inconceivable that it changes as rapidly as the revisit time of 4 hours. We thus constrained its variation with a low-pass-filtered trend as shown with red symbols in Figure 4. The rapid variation is now attributed mostly to the changes in the partial coverage.
The trend of the normalization was further extrapolated backward to the late dip phase, which yielded acceptable fits. However, this did not work for the early dip phase. This is because of the different appearance of the spectral shape as exemplified in the spectra from snapshot 34 and 46 (Fig. 3). In the late dip, we observe both the partially covered and uncovered disk black body emission. In the early dip, we only observe the uncovered component, as the covered component is attenuated too much to be visible in the NICER energy band. The degeneracy between the following two cases cannot be broken in the fitting: (a) a large value of the partial covering column or (b) a small value of the disk normalization with a small covering column. The solution (b) yields fitted results with a large scatter in the disk black body parameters ( and normalization), which is unlikely. We thus opted for (a) by constraining the partial covering column to be cm-2 for the best-fit parameter. For this reason We include large error estimates in the early dip phase in Figure 4. The NICER data do not allow us to track the trend of the disk black body parameters during the early dip phase.

3.3.2 Lines
The phase-dependent change of the line normalization parameter is given in Figure 5 separately for Mg, Si, S, and Fe. Different colors are used for the H-like and He-like ions.

For Mg, Si, and S, emission lines were detected in almost all the snapshots mainly during the dip phase. During the dip phase, their normalization decreases, particularly, in the late dip phase.
For Fe, a more stringent constraint was obtained, revealing changes between the emission and absorption features. In the dip phase, the line appears as emission at the beginning for the early dip, but the line normalization decreases in the late dip similar to the other elements. In the end, the line feature changed from emission to absorption, which continues for the flaring phase and reverts back to emission in the stable phase.
4 Discussion
Based on the characterization of the entire data set in § 3, we discuss the interpretation. We first present the assumed geometry (§ 4.1), which we rationalize by using a suite of observed results (§ 4.2), then we make some quantitative assessment of the geometry (§ 4.3).
4.1 Proposed Model
Our assumed geometry is shown in Figure 6, in which the optically-thin plasma extends away from the accretion disk. This picture is different from the conventional interpretation of the “(hot) accretion disk corona”, in which an optically-thin plasma exists on the surface of the disk. The plasma is produced by being illuminated by the incident X-ray emission from the surface of the neutron star and the accretion disk around it. The plasma emits diffuse emission through radiative de-excitation and recombination. The incident X-ray emission transmits through the plasma, in which absorption lines and edges are imprinted by radiative excitation and ionization. The balance between them depends on the ratio of the transmitted and diffuse emission determined by the geometry in the line-of-sight and the incident X-ray flux.
We assume that a geometrically-flared optically-thick medium exists locally in the outer part of the accretion disk. Such a structure is called the “bulge” in some literatures (e.g., White & Swank, 1982). We speculate that this is the accretion spot of the material from the companion star, which is hinted at observationally (e.g.,Groot et al. 2001; Hynes et al. 2001; Hellier 1996; Casares et al. 2003) and envisioned theoretically (Armitage & Livio, 1998). We do not delve into the detailed interpretation of what the covering media are. All we need is a localized structure that can provide a complete or partial covering of the X-ray emission from the neutron star and accretion disk, in which the covering column and fraction change as the sight line changes along the binary orbit.
4.2 Rationale
We use four results to rationalize the proposed model. The first result is the presence of the disk black body emission throughout the orbital cycle. Its parameters change only gradually on the orbital time scale. The flux variations are much faster than the orbital period primarily due to covering by the medium outside the disk blackbody radiation region. (Fig. 4).
The second result is the presence of the dip and flaring phases. The local covering medium should have some density and clumpy structure depending on the disk’s azimuth, so that it creates changes in the line-of-sight as a function of the orbital phase. The X-ray flux dip starts when the densest part of the covering medium comes in the line-of-sight. The total covering column decreases, resulting in the spectral changes between the early and the late halves of the dip phase (§ 3.2.2). This dense material is broken into pieces in the tail part, which creates the rapid flux variation during the flaring phase (§ 3.2.3).
The third result is the appearance of the Fe line feature either as emission or absorption in addition to the disk emission (§ 3.3.2). The feature is made by highly-ionized Fe in the photo-ionized plasma. When it appears as absorption, the incident disk emission transmitted through the photo-ionized plasma surpasses the diffuse emission from the plasma. When it appears as emission, the transmitted emission is insignificant by being blocked in the line-of-sight, and the diffuse emission from the plasma is dominant.
The fourth result is the stability of the emission line strength compared to the total flux. The total flux decreases by an order of magnitude in the dip phase (Fig. 2), while the emission lines do not (Fig. 5). This indicates that most of the photo-ionized plasma is not blocked by the local medium, unlike the disk black body emission.
When all these are combined, we came to a model depicted in Figure 6. The edge-on view for the early dip, late dip flaring, and stable phases are shown in (a), (b), and (c), respectively.

4.3 Assessments
We make two quantitative assessments based on the geometry proposed in Figure 6. One is the ionization parameter of the photo-ionized plasma (§ 4.3.1) and the other is the system scale (§ 4.3.2).
4.3.1 Ionization parameter
We use the emission or absorption line features to derive ionization parameters. We calculate the intensity ratio between the Ly and He lines when both of them are detected. The emission line pair was detected for Mg in the dip phase and for Fe throughout orbit, while the absorption line pair was detected for Fe from the end of the dip phase to the flaring phase.
We employ the xstar code (Kallman & Bautista, 2001) to numerically estimate the expected line ratio of the pairs. The code solves the radiative transfer equation for the non-local thermal equilibrium condition for the charge and level populations in the photo-ionized plasma by balancing radiative cooling and heating, ionization and recombination, and excitation and de-excitation. It uses the two-stream approximation solver in the inward and outward directions. The energy input (incident emission) is given and the outputs (transmitted emission and diffuse emission inward and outward) are calculated.
Because the xstar code is only for one-dimensional geometry, we approximated the photo-ionized plasma as a plane-parallel slab. The slab is static, uniform, and optically thin for the electron scattering with hydrogen density of cm-3 and column density of cm-2. The incident emission has the shape of the disk black body with representative parameters over the stable phase.
For the emission lines, they are mainly produced as a result of the recombination cascades of e.g., Fe26+ and Fe25+ for Fe. The Ly to He ratio is thus very sensitive to the ionization parameter , in which is the electron density and is the distance from the incident source to the slab. We took into account the effect of radiative excitation by the incident emission, which is known to alter the line strength when a large fraction of the incident emission is outside of the beam (Kinkhabwala et al., 2002) as in the dip phase. The expected line ratio was calculated as a function of (erg s-1 cm) over 0–5 in increments of 0.1 and a value was selected that matches the observed ratio.
For the absorption lines, we followed the same procedure but evaluated the column density of Fe25+ and Fe24+ through the slab that is responsible for the absorption lines respectively of Ly and He by absorbing the incident emission at each transition energy. These column densities are related to the observed equivalent width through the curve of growth. We selected the best value to reproduce the observed ratio between the two lines.

The result is shown in Figure 7. The values using the Mg, Si, S emission, Fe emission and Fe absorption pair are, respectively, , , , and for the means and standard deviations. They differ to some extent, which indicates that the actual photo-ionized plasma has a stratified ionization structure of varying as suggested in Schulz et al. (2008). However, they are stable across different phases. This suggests that the photo-ionized plasma remains mostly unchanged throughout the orbital cycle. The values using the Fe emission and absorption features match well, indicating that the differences are created by changes in the viewing geometry and/or the incident X-ray flux, not by changes in the photoionized plasma itself.
In the dip phase, it should be noted that the Fe line pairs changed from emission to absorption in the middle at before this phase ends (Fig. 5). Since the emission from the photo-ionized plasma is considered stable over orbit, this change should be created by an increase in the fraction of the incident emission through the photo-ionized plasma, which contributes to the absorption lines. This is presumably made by the increase of both the normalization of the disk black body emission and the decrease of the partial covering fraction in the line-of-sight as shown in Figure 4(d) and depicted in Figure 6.
4.3.2 System scale
The size of the system can be estimated by assuming the electron density . The NICER data are incapable of constraining this value, so we used the estimate of the upper limit ( cm-3) given by the Chandra grating spectroscopy of the triplet lines of He-like ions (Schulz et al., 2020).
We estimate the size of the photo-ionized plasma. The inner radius cm for the best-fit parameter for Fe emission and the observed disk luminosity of . The value is a lower limit as we used an upper limit for .
The outer radius () is constrained by the observed the maximum total amount of Fe absorption column by
| (2) |
in which is the observed absorption column of the Fei+ ions (), is the charge fraction of the ion among all Fe, is the assumed solar Fe abundance relative to H, and is the H density, which we approximate as . The Fe column is derived from the observed equivalent width through the curve of growth. The charge fraction and the curve of growth are derived from an XSTAR simulation, in which the column density of the slab cm-2 was changed 15–25 in increments of 1 for the ionization degree of erg s-1 cm. We used snapshot 50 and 65 (Fig. 3 c and e, respectively) where the Fe absorption features were strong. For both H-like () and He-like () ions, the result is in the range of cm. The photo-ionized plasma has some structures for different values for different elements (§ 3.3.2). The part contributing to the Fe features is relatively thin with .
This still yields strong emission lines from the plasma. XSTAR calculates that Fe XXV He will be 6–120 erg s-1 for cm-2, which is much larger than the observed value of erg s-1. This is the case in the dip phase when there is no significant absorption features imprinted in the disk black body emission that cancels the emission. Therefore, we consider that the volume filling factor of the photo-ionized plasma is small in comparison to the xstar assumption of a spherical medium.
We further compare the inner and outer radius of the photo-ionized plasma ( and ) with those of the accretion disk ( and ). In our spectral analysis, the normalization of the disk black body emission is related to as , in which is the viewing angle. For a complete edge-on and the normalization of 100 (the largest in the trend in Fig. 4b when a large fraction of the disk is considered to be exposed), we obtain 106 cm. The value is close to a typical value of a neutron star radius since the accretion disk is thought to stretch inward almost close to the neutron star surface (e.g., Frank et al. 2002).
We cannot constrain from the present data. At least, it must be smaller than the effective Roche lobe radius of the binary of cm (Begelman et al., 1983). If we assume that a typical value for low mass X-ray binaries of cm (Jimenez‐Garate et al., 2002) is applicable to Cir X-1, , suggesting that the photo-ionized plasma is located outside of the accretion disk.
5 Summary
We present the result of NICER observations covering an entire orbital period of Cir X-1. Thanks to its operational flexibility and unprecedent large collecting area with moderate energy resolution, we obtained well-exposed spectra along the orbital phase with sufficient cadence, energy resolution, and uniform quality. Using this unique data set, we obtained the following results and implications.
-
1.
The flux change over an orbit is repeated reproducibly by comparing to the MAXI light curves of preceding orbits. It is divided into three parts; dip, flaring, and stable phases.
-
2.
We constructed spectral models for representative spectra in each phase. Despite the apparent changes, we argue that they can be described by a common model with different parameters.
-
3.
The continuum emission is explained by a variable disk black body component over the entire orbit, with a minor invariable soft-excess component expected from the photo-ionized plasma.
-
4.
The variety of the X-ray flux changes and the continuum spectral shape is mostly attributable to rapid changes of the partial covering material in the line-of-sight and gradual changes of the accretion disk temperature and luminosity.
-
(a)
The dip phase, which occupies 15% of the orbit before and at the periastron, is characterized by a sudden decrease in the X-ray flux. It is attributable to a sudden increase in the absorption column of the partial covering material in the line-of-sight provided that the disk black body emission gradually changes.
-
(b)
The following flaring phase for 30% of the orbit is characterized by rapid changes of the X-ray flux, which is mostly attributable to rapid changes of the covering fraction of the partially covering medium in the line-of-sight.
-
(c)
The stable phase is characterized by a gradual decrease of the X-ray flux. This is governed by the gradual change of the disk black body emission.
-
(a)
-
5.
Upon the continuum emission, we found emission and absorption features from the H-like and He-like ions of Mg, Si, S, and Fe. They are presumably from the extended photo-ionized plasma. They are most evident during the dip phase when the continuum emission of the disk black body is most attenuated. The Fe line feature turns from emission to absorption in the middle of the dip phase.
-
6.
Using a pair of Ly and He lines respectively of H-like and He-like Mg, Si, S, and Fe, we derived the change of the ionization parameter as a function of the orbital phase. The ionization parameter value remains stable, regardless of whether the pair appears in emission or absorption, suggesting that the photo-ionized plasma remains almost unchanged over an orbit.
-
7.
We proposed an interpretation to explain these findings. A photo-ionized plasma illuminated by the incident X-ray emission from the accretion disk and the neutron star is located radially outside of the accretion disk, not on its surface. The disk black body emission is blocked in the early dip phase due to a geometrically flared medium which is present only for a subtended small azimuth angle range of the accretion disk. The medium has some density and fragmentation structure, the variation of which generates the X-ray flux and spectral changes in the late dip and flaring phases.
-
8.
We estimated the scales of these structures. The photo-ionized plasma responsible for the Fe line features is estimated to be located adjacently outside of the accretion disk.
The sampling frequency of the orbital spectral variation presented in this study is much denser than in the previous Cir X-1 studies. Yet, we presented a much simpler spectral model. We recognize that a few spectra yielded bad fitting, but they do not alter the overall interpretation presented here. A geometry was proposed to explain these findings. We argue that the proposal will help disentangle the complex behaviors of this source observed in other instruments at different flux ranges and energy ranges and guide toward a better understanding of the unique binary system.
References
- Armitage & Livio (1998) Armitage, P. J., & Livio, M. 1998, The Astronomical Journal, 493, 898
- Arnaud (1996) Arnaud, K. A. 1996, Astronomical Data Analysis Software and Systems V , A.S.P. Conference Series, 101, 17
- Asai et al. (2014) Asai, K., Mihara, T., Matsuoka, M., et al. 2014, Publications of the Astronomical Society of Japan, 66, 79, doi: 10.1093/pasj/psu054
- Begelman et al. (1983) Begelman, M. C., McKee, C. F., & Shields, G. A. 1983, The Astrophysical Journal, 271, 70, doi: 10.1086/161178
- Brandt et al. (1996) Brandt, W. N., Fabian, A. C., Dotani, T., et al. 1996, Monthly Notices of the Royal Astronomical Society, 283, 1071, doi: 10.1093/mnras/283.3.1071
- Brandt & Schulz (2000) Brandt, W. N., & Schulz, N. S. 2000, The Astrophysical Journal, 544, L123, doi: 10.1086/317313
- Casares et al. (2003) Casares, J., Steeghs, D., Hynes, R. I., Charles, P. A., & O’Brien, K. 2003, The Astrophysical Journal, 590, 1041, doi: 10.1086/375055
- D’Ai et al. (2007) D’Ai, A., Iaria, R., Di Salvo, T., et al. 2007, The Astrophysical Journal, 671, 2006, doi: 10.1086/522565
- D’Aì et al. (2012) D’Aì, A., Bozzo, E., Papitto, A., et al. 2012, Astronomy & Astrophysics, 543, A20, doi: 10.1051/0004-6361/201118577
- Ding et al. (2012) Ding, G., Huang, C., & Qu, J. 2012, International Journal of Astronomy and Astrophysics, 02, 256, doi: 10.4236/ijaa.2012.24033
- Ding et al. (2006a) Ding, G. Q., Qu, J. L., & Li, T. P. 2006a, The Astronomical Journal, 131, 1693, doi: 10.1086/499921
- Ding et al. (2006b) Ding, G. Q., Zhang, S. N., Li, T. P., & Qu, J. L. 2006b, The Astrophysical Journal, 645, 576, doi: 10.1086/504308
- Frank et al. (2002) Frank, J., King, A., & Raine, D. 2002, Accretion Power in Astrophysics, 2nd edn. (Cambridge University Press), xi–xii, doi: 10.1017/CBO9781139164245
- Gendreau et al. (2012) Gendreau, K. C., Arzoumanian, Z., & Okajima, T. 2012, in Proceedings of SPIE, ed. T. Takahashi, S. S. Murray, & J.-W. A. den Herder, 844313, doi: 10.1117/12.926396
- Gendreau et al. (2016) Gendreau, K. C., Arzoumanian, Z., Adkins, P. W., et al. 2016, in Proceedings of SPIE, ed. J.-W. A. den Herder, T. Takahashi, & M. Bautz, 99051H, doi: 10.1117/12.2231304
- Groot et al. (2001) Groot, P. J., Rutten, R. G. M., & van Paradijis, J. 2001, Astronomy and Astrophysics, 368, 183
- Heinz et al. (2013) Heinz, S., Sell, P., Fender, R. P., et al. 2013, The Astrophysical Journal, 779, 171, doi: 10.1088/0004-637X/779/2/171
- Heinz et al. (2015) Heinz, S., Burton, M., Braiding, C., et al. 2015, The Astrophysical Journal, 806, 265, doi: 10.1088/0004-637X/806/2/265
- Hellier (1996) Hellier, C. 1996, Astrophysical Journal, 471, 949, doi: 10.1086/178021
- Hynes et al. (2001) Hynes, R. I., Charles, P. A., Haswell, C. A., Casares, J., & Zurita, C. 2001, Astrotomography. Lecture Notes in Physics, 573, doi: https://doi.org/10.1007/3-540-45339-3_26
- Iaria et al. (2001) Iaria, R., Burderi, L., Di Salvo, T., La Barbera, A., & Robba, N. R. 2001, The Astrophysical Journal, 547, 412, doi: 10.1086/318366
- Iaria et al. (2002) Iaria, R., Di Salvo, T., Robba, N. R., & Burderi, L. 2002, The Astrophysical Journal, 567, 503, doi: 10.1086/338507
- Iaria et al. (2005) Iaria, R., Spano, M., Di Salvo, T., et al. 2005, The Astrophysical Journal, 619, 503, doi: 10.1086/426422
- Jimenez‐Garate et al. (2002) Jimenez‐Garate, M. A., Raymond, J. C., & Liedahl, D. A. 2002, The Astrophysical Journal, 581, 1297, doi: 10.1086/344364
- Johnston et al. (2001) Johnston, H. M., Wu, K., Fender, R., & Cullen, J. G. 2001, Monthly Notices of the Royal Astronomical Society, 328, 1193, doi: 10.1046/j.1365-8711.2001.04963.x
- Jonker et al. (2007) Jonker, P. G., Nelemans, G., & Bassa, C. G. 2007, Monthly Notices of the Royal Astronomical Society, 374, 999, doi: 10.1111/j.1365-2966.2006.11210.x
- Kallman & Bautista (2001) Kallman, T., & Bautista, M. 2001, The Astrophysical Journal Supplement Series, 133, 221, doi: 10.1086/319184
- Kallman et al. (2004) Kallman, T. R., Palmeri, P., Bautista, M. A., Mendoza, C., & Krolik, J. H. 2004, The Astrophysical Journal Supplement Series, 155, 675, doi: 10.1086/424039
- Kaluzienski et al. (1976) Kaluzienski, L. J., Holt, S. S., Boldt, E. A., & Serlemitsos, P. J. 1976, The Astrophysical Journal, 208, 71
- Kinkhabwala et al. (2002) Kinkhabwala, A., Sako, M., Behar, E., et al. 2002, The Astrophysical Journal, 575, 732, doi: 10.1086/341482
- Linares et al. (2010) Linares, M., Watts, A., Altamirano, D., et al. 2010, The Astrophysical Journal, 719, L84, doi: 10.1088/2041-8205/719/1/L84
- Makishima et al. (1986) Makishima, K., Maejima, Y., Mitsuda, K., et al. 1986, The Astrophysical Journal, 308, 635, doi: 10.1086/164534
- Margon et al. (1971) Margon, B., Lampton, M., Bowyer, S., & Cruddace, R. 1971, The Astrophysical Journal, 169, L23, doi: 10.1086/180806
- Matsuoka et al. (2009) Matsuoka, M., Kawasaki, K., Ueno, S., et al. 2009, Publications of the Astronomical Society of Japan, 61, 999, doi: 10.1093/pasj/61.5.999
- Mitsuda et al. (1984) Mitsuda, K., Inoue, H., Koyama, K., et al. 1984, Publications of the Astronomical Society of Japan, 36, 741
- Nasa High Energy Astrophysics Science Archive Research Center (2014) (Heasarc) Nasa High Energy Astrophysics Science Archive Research Center (Heasarc). 2014, HEAsoft: Unified Release of FTOOLS and XANADU. https://ui.adsabs.harvard.edu/abs/2014ascl.soft08004N
- Nicolson (2007) Nicolson, G. D. 2007, The Astronomer’s Telegram, 985, 1
- Okajima et al. (2016) Okajima, T., Soong, Y., Balsamo, E. R., et al. 2016, in Proceedings of SPIE, ed. J.-W. A. den Herder, T. Takahashi, & M. Bautz, 99054X, doi: 10.1117/12.2234436
- Parkinson et al. (2003) Parkinson, P. M. S., Tournear, D. M., Bloom, E. D., et al. 2003, The Astrophysical Journal, 595, 333, doi: 10.1086/377193
- Prigozhin et al. (2012) Prigozhin, G., Gendreau, K., Foster, R., et al. 2012, in Proceedings of SPIE, ed. A. D. Holland & J. W. Beletic, 845318, doi: 10.1117/12.926667
- Scargle et al. (2013) Scargle, J. D., Norris, J. P., Jackson, B., Chiang, J., & Hansen, W. W. 2013, The Astrophysical Journal, 764, 167, doi: 10.1088/0004-637X/764/2/167
- Schulz & Brandt (2002) Schulz, N. S., & Brandt, W. N. 2002, The Astrophysical Journal, 572, 971, doi: 10.1086/340369
- Schulz et al. (2008) Schulz, N. S., Kallman, T. E., Galloway, D. K., & Brandt, W. N. 2008, The Astrophysical Journal, 672, 1091, doi: 10.1086/523809
- Schulz et al. (2020) Schulz, N. S., Kallman, T. E., Heinz, S., et al. 2020, The Astrophysical Journal, 891, 150, doi: 10.3847/1538-4357/ab6dc8
- Shirey et al. (1996) Shirey, R. E., Bradt, H. V., Levine, A. M., & Morgan, E. H. 1996, The Astrophysical Journal, 469, L21, doi: 10.1086/310264
- Shirey et al. (1999) Shirey, R. E., Levine, A. M., & Bradt, H. V. 1999, The Astrophysical Journal, 524, 1048, doi: 10.1086/307849
- Tennant (1987) Tennant, A. F. 1987, Monthly Notices of the Royal Astronomical Society, 226, 971, doi: 10.1093/mnras/226.4.971
- Tennant et al. (1986) Tennant, A. F., Fabian, A. C., & Shafer, R. A. 1986, Monthly Notices of the Royal Astronomical Society, 221, 27P, doi: 10.1093/mnras/221s.1.27P
- van der Klis (2006) van der Klis, M. 2006, in Compact stellar X-ray sources. Edited by Walter Lewin & Michiel van der Klis. Cambridge Astrophysics Series, No. 39. Cambridge, UK: Cambridge University Press, 39 – 112, doi: 10.2277/0521826594
- Verner et al. (1996) Verner, D. A., Ferland, G. J., Korista, K. T., & Yakovlev, D. G. 1996, The Astrophysical Journal, 465, 487, doi: 10.1086/177435
- White & Swank (1982) White, N. E., & Swank, J. H. 1982, The Astrophysical Journal, 253, L61, doi: 10.1086/183737
- Wilms et al. (2000) Wilms, J., Allen, A., & McCray, R. 2000, The Astrophysical Journal, 542, 914, doi: 10.1086/317016