2021
1]\orgdivDepartment of Mathematics and Statistics, \orgnameUniversity of Nevada, Reno, \orgaddress1664 \streetN. Virginia Street, \cityReno, \postcode89557, \stateNevada, \countryUSA
Withdrawal Success Optimization in a Pooled Annuity Fund
Abstract
Consider a closed pooled annuity fund investing in assets with discrete-time rebalancing. At time 0, each annuitant makes an initial contribution to the fund, committing to a predetermined schedule of withdrawals. Require annuitants to be homogeneous in the sense that their initial contributions and predetermined withdrawal schedules are identical, and their mortality distributions are identical and independent. Under the forementioned setup, the probability for a particular annuitant to complete the prescribed withdrawals until death is maximized over progressively measurable portfolio weight functions. Applications consider fund portfolios that mix two assets: the S&P Composite Index and an inflation-protected bond. The maximum probability is computed for annually rebalanced schedules consisting of an initial investment and then equal annual withdrawals until death. A considerable increase in the maximum probability is achieved by increasing the number of annuitants initially in the pool. For example, when the per-annuitant initial contribution and annual withdrawal amount are held constant, starting with 20 annuitants instead of just 1 can increase the maximum probability (measured on a scale from 0 to 1) by as much as .15.
keywords:
Withdrawals1 Introduction
After a lump sum investment, suppose an investor wishes to complete a pre-determined schedule of withdrawals. In practice, the total amount intended to be withdrawn is usually larger than the lump sum. To overcome this disparity, the lump sum must be invested in various assets having positive expected log-returns, with the goal of maximizing the probability to complete the schedule of withdrawals. Note that this maximization occurs over the time-adapted portfolio weight functions, which control the proportion of available wealth invested in each asset. For the case where rebalancing and withdrawals are made discretely in time, this maximization problem is studied for an individual investor in Brown (2023). The goal here is to extend the results of Brown (2023) to a pool of investors, all hoping to make the same schedule of withdrawals. Of particular interest is the schedule having a constant annual withdrawal until death.
The basic idea of the pooled annuity fund is as follows. At time 0, collect the same lump sum investment from each individual in the pool. Invest the combined funds into a fixed number of assets, rebalancing and withdrawing periodically. When a member of the pool dies, no funds are removed from the pool for a beneficiary. Instead, the dead member’s share of the combined funds is kept in the fund to benefit the remaining living members of the pool. In effect, the members of the pool are mutual beneficiaries, coming together to insure against longevity risk.
These pooled annuity funds can also be called tontines. The word tontine is used to describe a variety of insurance products that pool investors and are structured such that the death of one member benefits the remaining living members. Tontines are ideal for individuals looking to insure against longevity risk, especially those lacking a beneficiary. Obviously, there is concern for such a product to maliciously take advantage of death, ultimately providing a few members with obscene and unfair profits. So tontines must be approached with care. For a brief history of tontines, see McKeever (2009). For some ideas on the modern implementation and regulation of tontines, see Milevsky (2022).
The pooled annuity funds considered here offer investors an increase in the probability to complete a schedule of withdrawals. In other words, the probability available through the pool is larger than what an individual can achieve alone. For the problem of maximizing this probability, only closed pooled annuity funds are considered. In a closed fund, members can only receive the scheduled withdrawals without any exceptions.
Since this lack of liquidity is offputting to many investors, note that if living members are allowed to withdraw the present value of their initial contribution to the fund at any time, a remaining member’s share of the combined funds is at least as large as that present value. This is because a remaining member’s share takes into account the leftover contributions resulting from prior member deaths. A more detailed explanation of this logic, including how this present value is computed, is given in section 5. Allowing a living member to withdraw the present value of their contribution can result in a probability of withdrawal success that differs from the closed pool case. However, this probability will still be larger than if the member had decided to invest alone instead of join the pool, all the while following the same portfolio weights as the pool.
1.1 Literature Review
Much of the research on pooled annuity funds uses a pool of annuitants that is homogeneous in contribution and mortality distribution. In the discrete-time setting with constant, deterministic returns and random times of death, consumption is set to be the amount a fair life annuity would pay if purchased with an annuitant’s share of the current fund value (Bernhardt and Donnelly, 2021). Then the relationship between pool size and stability of consumption over time is measured. In general, increasing the pool size offers a significant improvement to consumption stability. However, the improvement gained from each addition to the pool decreases as the pool size increases (i.e. consumption stability is a concave, increasing function of pool size). This positive relationship between pool size and consumption stability is supported by Piggott et al (2005). In the continuous-time setting, where consumption and rebalancing is continuous in time, pooled annuity funds offer a significant increase to expected consumption (Stamos, 2008). There, consumption is optimized with respect to a (time-discounted) utility function supporting constant relative risk aversion. In contrast, the problem considered here fixes a schedule of consumption at time 0, and the goal is to optimize the probability of completing that schedule.
The consumption stability of annuitants with different initial contributions to the fund is studied in Bernhardt and Qu (2023). The impact of allowing a new generation to enter the pool at each time step (for a finite number of time steps) is studied in Donnelly (2022). Consumption stability is improved for earlier generations, but later generations face some instability. Instability results because their contributions are used to supplement earlier generations’ consumption, and they cannot rely as heavily on the contributions of future generations to supplement their own consumption. The problem considered here is also concerned with consumption stability, but in a different way compared to the forementioned results. In particular, consumption amounts are fixed at time 0, and the goal is to maximize the probability of completing the consumption schedule. So stability here refers to whether or not the schedule is completed.
The issue of actuarial fairness is addressed in Donnelly (2015). In general, a pooled annuity fund is actuarial fair if all members recieve the same (relative) prospects in consumption. For example, in a pool of annuitants that is heterogeneous in age or contribution, the younger or poorer members should not have superior (relative) prospects in consumption. For heterogeneous pools, the number of members must be sufficiently large to minimize unfairness. In the homogeneous pool considered here, consumption increases with lifespan, but all members with a particular lifespan have the same consumption. So it is actuarially fair in this per-lifespan sense.
A mutual fund version of the pooled annuity fund has been proposed in Goldsticker (2007). While individuals have access to pooled annuity funds through particular employers Klaristenfeld (2007), access is otherwise limited. Since pooled annuity funds can offer better deals compared to traditional annuities Chen and Rach (2023), it is worthwhile to consider making pooled annuity funds more accessible. For more information on this recent push to make pooled annuity funds more accessible, see Milevsky (2022).
Use terminal wealth to refer to the combined funds remaining in a pooled annuity fund after all members have expired. A schedule of withdrawals can be completed if and only if the terminal wealth is non-negative. So maximizing the probability of completing a schedule of withdrawals is equivalent to maximizing the probability that terminal wealth is non-negative. Note that this is a version of the safety first principle, pioneered by Roy (1952). Furthermore, this safety first maximization problem can be solved using dynamic programming. In particular, it is handled under a framework similar to the Borel setting of the discrete-time stochastic dynamic programming problem detailed in (Bertsekas and Shreve, 1996). Here, asset prices and portfolio weights are progressively measurable with respect to a filtration that represents the evolution of information over time. Moreover, the filtration can be continuous in time while the rebalancing and withdrawals are discrete in time.
1.2 Summary of Main Results
First the major assumptions are outlined. The pool is established at time 0, at which time each member contributes the same amount to the fund. The withdrawal schedule is determined at time 0, and it is the same for every member in the pool. Afterward, no additional individuals can join the pool, and no withdrawals can be made outside the predetermined withdrawal schedule. Assume the mortality distribution of each member in the pool is independent and identically distributed.
Fix a sequence of rebalancing times so they are a superset of the withdrawal times. Using time-adapted portfolio weight functions, invest the combined funds in assets having independent increments in their log-returns (between rebalancing times). The probability for a particular member to complete the withdrawal schedule until death is maximized over those portfolio weight functions.
Applications use two assets, rebalanced on an annual basis: the S&P Composite Index and an inflation protected bond. Only withdrawal schedules having equal annual withdrawals are considered. Note that the rebalancing and withdrawal times are set to coincide in this setting. The forementioned maximum probability is compared across various pool sizes, initial contributions and starting ages of members. In general, the maximum probability is an increasing function of pool size, initial contribution and starting age. The bulk of the (significant) benefit gained from joining a pool instead of investing alone is achieved with a surprisingly small pool, say 20 members. The additional benefit gained from joining a pool with more than 20 members is relatively small.
1.3 Organization
Section 2 provides the problem set-up. Theoretical results are given in section 3. Proofs are omitted, since they are only slight modifications of the proofs given in Brown (2023). Section 4 provides applications of theoretical results using data. Data is described in section 4.1. Closing remarks and a discussion of related future research ideas are given in section 5.
2 Preliminaries
Introduce the filtered probability space , where denotes a filtration of and , . Consider assets available for investment, each denoted by an index from 1 to . For each , let be an -adapted process. When convenient, write in place of , understanding that is an -measurable function on . In this setting, denotes the value of asset at time . Let be an increasing sequence in with . Require that for each and , is independent of .
Introduce a pool of annuitants with independent and identically distributed life distributions. By agreeing to be in this pool, each annuitant invests into a closed pooled annuity fund at time . The fund is then invested in the forementioned assets, rebalancing only at those times . If an annuitant is alive at time , where , then the annuitant withdraws from the fund at time . No other withdrawals are allowed - not even on a dead annuitants behalf. Note that in this set-up, rebalancing can occur at time with .
After accounting for , denote the combined wealth in the fund at time with . At each time , rebalance according to the -measurable portfolio weight vector , where . When convenient, write , understanding that and each is an -measurable function on . In particular, at each time , invest in asset for each .
Track the number of annuitants as follows. Suppose an annuitant’s status as alive or dead at time depends only on the annuitant’s age and status at time . Let denote the starting age of all annuitants, and let denote the probability of an annuitant aged at time dying by time . For and , define the -measurable random variable . Require that each is independent of and for every and . Then the number of living annuitants at time is given by , where
| (1) |
To simplify notation, let for and . When convenient, write . Let for . Then the pooled wealth at time step is given by , where the are computed recursively via
| (2) |
Again, note that wealth at time step is computed after accounting for the withdrawal of by all living annuitants at time step . Furthermore, observe that each , and is an -measurable function on .
Observe that implies for each . This guarantees that a failure to execute the scheduled withdrawals up to time , indicated by , will be carried over to time and indicated by .
Observe that is a function of each for . The notation
is used to denote the supremum of over all -measurable portfolio weight vectors , where . This kind of abbreviation is used in similar situations where there is a -like function that is constructed using the -measurable .
Use to denote the expectation with respect to . Denote the smallest -algebra containing the family of sets with . Use to denote the real numbers, and let . Given and , use to denote . Given sets , and , use to denote the pointwise supremum of the , meaning for each , . Let denote the -dimensional vector of 1s, and use to indicate the dot product.
3 Theoretical Results
Introduce the recursion starting with
and for ,
| (3) |
Here, is a flag indicating whether a particular annuitant is alive () or dead () at time . In this setup, as long as . If , then iff . In words, is non-negative if and only if the combined funds in the pool are not exhausted after executing the scheduled withdrawals for those times, up to and including , at which the annuitant is alive.
Define such that
Then indicates the index of the first time step at which the annuitant has expired. The goal is to find
| (4) |
In words, (10) is the sumpremal probability of the annuitant completing the schedule of withdrawals until death, and the supremum is taken over the portfolio vectors , where .
By the law of total probability,
| (5) |
Observe from (3) that if , then
It follows that
| (6) |
If , then (5) and (6) coincide. Alternatively, can be chosen large enough such that is sufficiently close to , in which case (5) is approximated by (6). It follows that for sufficiently large,
| (7) |
From here, the goal is to compute the left side of (7).
First define the function such that
| (8) |
Let , , denote the functions satisfying
| (9) |
For each and , is non-decreasing and upper semicontinuous over . Moreover, the left side of (7) is given by , which can be computed recursively, starting with (8) and then using (9). Proofs of the previous statements are only slight modifications of the proofs given in Brown (2023) for the unpooled case, so they are left out. A simple inductive argument also shows that for , and . Furthermore, for and .
In a similar fashion, it is possible to maximize the probability for all annuitants to complete the schedule of withdrawals until death. First define such that
Then indicates the index of the first time step at which all members of the pool have expired. The goal is to find
| (10) |
In words, (10) is the sumpremal probability for every annuitant to complete the schedule of withdrawals until death, and the supremum is taken over the portfolio vectors , where . Like before, a sufficiently large gives
| (11) |
Using the same kind of logic as before, it follows that the left side of (11) is given by , where is such that , and for , is such that
3.1 Computing with stock-bond portfolios
Fix and . Let denote the value of the stock at time . Assume the are continuous in the sense that for each and . Let , meaning denotes the value of the bond, with interest , at time . Let be the natural filtration generated by .
For , let , and for , let
| (12) |
Require that , meaning there is a positive withdrawal at the last time step.
A simple inducetive argument shows that if , then . Recall that in addition, for . Therefore
| (13) |
where .
The recursion can also be kick-started at , since for ,
| (14) |
4 Applications
Like in Brown (2023), theoretical results are applied in the case where . The two assets used are the S&P Composite Index and an inflation-protected bond. The annual real returns of the S&P Composite Index appear to be historically stable in the sense that they are approximately iid (Normal with mean 1.083 and standard deviation .1753) over the past 150 years (Brown, 2023). For the optimization is more difficult to compute, and it is not easy to find other assets like the S&P Composite Index that have such historical stability.
To construct the mortality distribution of annuitants, applications use the 2017 per-age death rates of the US Social Security area population. Section 4.1 describes the S&P Composite Index data and the mortality distribution data. Section 4.2 details the set-up needed to apply theoretical results and describes the algorithms used in applications. Results of applications are given in section 4.3.
4.1 Data
Annual data from the S&P Composite Index and Comsumer Price Index is taken from http://www.econ.yale.edu/~shiller/data.htm, collected for easy access at https://github.com/HaydenBrown/Investing. The data spans 1871 to 2020 and is described in table 1. Note that S&P Composite Index refers to Cowles and Associates from 1871 to 1926, Standard & Poor 90 from 1926 to 1957 and Standard & Poor 500 from 1957 to 2020. Cowles and Associates and the S&P 90 are used here as backward extensions of the S&P 500.
The data is transformed so that annual returns incorporate dividends and are adjusted for inflation. In particular, returns are computed using the consumer price index, the S&P Composite Index price and the S&P Composite Index dividend. Use the subscript to denote the th year of , and from Table 1. The return for year is computed as . The justification for treating S&P returns as independent and identically distributed Normal random variables with mean 1.083 and standard deviation .1753 is given in Brown (2023). To give a brief visual of this justification, Figure 1 shows the autocorrelation function of sample returns and how the sample quantiles align with the Normal quantiles.

| Notation | Description |
|---|---|
| I | Average monthly close of the S&P composite index |
| D | Dividend per share of the S&P composite index |
| C | January consumer price index |
Death rates are taken from https://www.ssa.gov, the official website of the Social Security Administration. In particular, the female per-age death rates of the US Social Security area population are taken from the 2017 period life table. Female death rates are used because they are generally lower than male death rates. The female death rates are illustrated in figure 2.
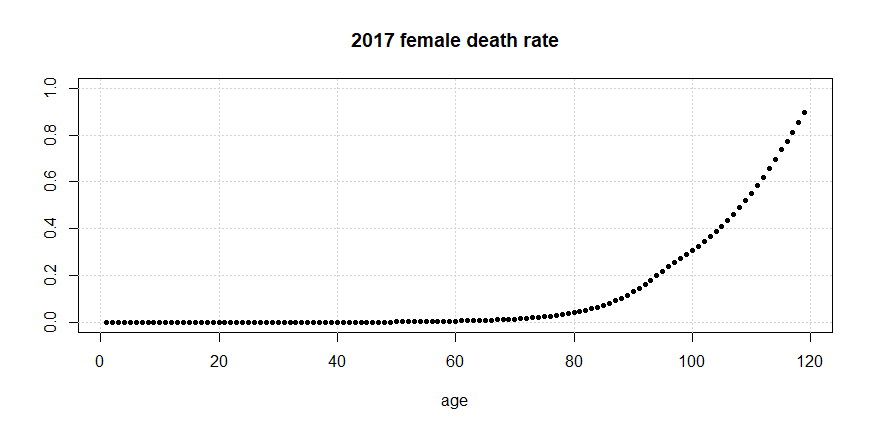
Let denote the 2017 female death rate for age , and let denote the starting age for a given schedule of investments and withdrawals. Applications use and
4.2 Set-up
In order to apply theoretical results, , , for , and need to be specified. Set and . Let denote the inflation-adjusted value of the S&P Composite Index at time , and let , meaning denotes the inflation-adjusted value of an inflation-protected bond, with interest , at time . Set for . Let be the natural filtration generated by . Then define as follows.
Since and are inflation-adjusted, it follows that the and are also inflation-adjusted. For example, if and inflation is 5% from time 0 to time , then the actual amount withdrawn at time is . In other words, 2 is the inflation-adjusted amount withdrawn, and is the actual amount withdrawn.
Theoretical results also require the to be independent of . It suffices to have iid . The treatment of S&P returns as iid has already been addressed, and the returns of the inflation protected bond are clearly iid because they are deterministic.
4.2.1 Computing
Let be a sufficiently large postive integer. In algorithm 2, is computed recursively for , where
The following elaborates on the details behind algorithm 2.
Recall that is given by (8). Observe that the set-up detailed at the top of section 4.2 aligns with that of section 3.1. So for and . Furthermore, can be computed using (14) for .
Denote the pdf and cdf of the iid with and , respectively. Then (13) implies that for each and , is given by
| (15) |
where indicates the proportion invested in the stock at time and
Transforming the integral in (15) with the substitution
yields
| (16) |
Algorithm 2 approximates (16) with
| (17) |
Note that the fraction (right side) in (17) approximates the expectation of given , where has pdf
Furthermore, is given by the big parenthesis in (17). Summarizing, for and , algorithm 2 approximates with
Now recall from (9) that , where
| (18) |
In algorithm 2, is computed using an iterated grid search, where the grid is refined at each iteration. In particular, the first grid tests in . Let denote the in that produces the maximum of . The next grid is . Let denote the in that produces the maximum of . From here, algorithm 2 uses the approximation
Then algorithm 2 compares said approximation with to approximate .
4.2.2 Simulating
Algorithm 1 computes via simulation. It uses that are defined in the following way using Borel measurable .
First, realizations of are simulated. Then is computed as the number of non-negative realizations, divided by .
When simulating with the optimal portfolio weight functions, do the following. Execute algorithm 2 and return the for and . The values of for are computed via linear interpolation. Set
For , let denote the largest element of that is less than or equal to , and set
To simulate the maximum simply follow algorithm 1 using this filled-in in place of .
4.3 Results
First, is computed using algorithm 2 with , , and and for . The interest rate is set at 0 because returns are already inflation adjusted, and any additional interest obtained from an inflation protected bond is likely to be low. After experimenting with different values of , 100 appears to produce accurate results in a reasonable amount of time. For example, computing for takes under ten hours. A starting age of 65 is selected because it is a common age to begin retirement. Equal annual withdrawals of one unit are chosen to focus on annuitants looking to have a constant and reliable income until death.
Figures 3 and 4 show how changes over and . In general, increases as or increases. is also concave with respect to . Looking at figure 3, observe that a noticeable increase in is obtained with just two annuitants instead of one. The two annuitant case could be implemented without an insurance company, between two friends or family members who are close in age. Looking at figure 4, 3 (7) annuitants can achieve 95% (90%) confidence in withdrawing () of the initial contribution, annually, until death.


Figure 5 illustrates the necessary and sufficient per-annuitant initial investment () to complete the forementioned withdrawal schedule with confidence for various starting ages () and initial pool sizes (). Call this necessary and sufficient initial investment . When holding constant, decreases by roughly 2 to 2.5 for each 5 year increase in starting age. Increasing from 1 to 2 decreases by about 2 regardless of starting age. In general the decrease in resulting from an increase in is constant over various starting ages. Not much of a decrease in is available from increasing over 30.
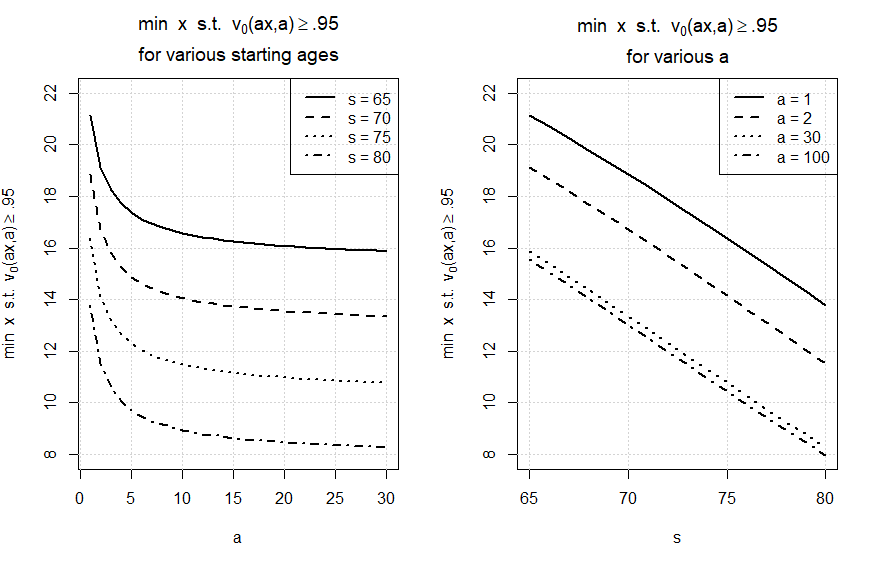
Figure 6 shows how changes when the confidence level is varied between .9, .95 and .99. In general, the magnitude of this change is larger for smaller . In terms of , 99% confidence costs quite a bit more than 95% confidence, and the extra 4$ of confidence may not be worth the additional cost.

Figure 7 shows how compares with for various constant portfolio weight function, using and a starting age of 65. In general going all-in on the S&P Composite Index gives the closest to . However, the difference is noticeable (as much as .04) for .

Figure 21 illustrates the maximum difference (with respect to ) between and for from 1 to 100. The effect of pooling on withdrawal success probability is clearly significant. In particular, a small pool (10 to 20 annuitants) can achieve a withdrawal success probability that is .14 to .15 higher than what an individual can achieve alone. Larger pools improve on this maximum difference, but not by much.

| (21) |
Following the apparrent trend in figure 9, for there is
Furthermore, observe that
So it appears that when is sufficiently large, can only be slightly larger than when . To give an idea of how large should be to avoid missing out on a potentially large increase in over , see table 2.
| 100 | .0055 |
|---|---|
| 250 | .0027 |
| 500 | .0016 |
| 1000 | .0009 |
| 2000 | .0005 |
| 4000 | .0003 |

| (23) |
Figure 10 shows how changes to and affect the optimal withdrawal success probability, provided . Figure 10 also shows that the maximum withdrawal success probability for can be nearly achieved using the optimal portfolio weights coming from Normal with a slightly different mean and variance. So knowing the approximate distribution of the appears to be sufficient to achieve a withdrawal success probability that is nearly optimal.

5 Conclusion
Applications show that there is a worthwhile benefit to be gained from joining a pooled annuity fund instead of trying to complete a schedule of withdrawals independently. Moreover, the size of the pool does not have to be very large to reap most of the benefit available. If such a pooled annuity fund ever becomes available to the public, the provider will only need a small number of individuals, say 20, to establish an attractive pool.
Here, only a single contribution, followed by a schedule of withdrawals, is studied. Note that it is also possible to study multiple contributions, occurring at different times, preceding the schedule of withdrawals. For example, each annuitant could make the same annual contribution for 20 years, and then the withdrawal schedule could start after that. This falls more in line with how pensions are structured. However, the heterogeneity of employees contributing to the same pension fund can complicate the kind of analysis conducted here. The emphasis placed here on a single contribution at time 0 is because it appeals directly to those retirement-age individuals looking to insure against longevity risk. The multiple contribution case appeals more to younger individuals planning for retirement.
In applications, the benefit of using optimal instead of constant portfolio weights was demonstrated for a special case. Remaining fully invested in the S&P Composite Index gave a withdrawal success probability that was close to the optimum. On one hand, the difference between the two can be noticeable - as much as .04. On the other hand, this difference is relatively small and may not be considered worth the extra effort that comes with implementing the optimal portfolio weights. Out of curiosity, the author tested the effect of changing the mean and standard deviation of S&P annual returns on this apparent closeness in the success probabilities between the portfolio that remains fully invested in the S&P Composite Index and the optimal portfolio. The closeness remained. So if it is difficult to get annuitants to buy in to this idea of optimal portfolio weights, fund providers can rest somewhat easily knowing that annuitants will not miss out on much by investing in just the S&P Composite Index.
One downside of the pooled annuity funds considered here is that they are closed. This lack of liquidity could easily turn away an interested individual. If living members are allowed the option of withdrawing all of the present value of their initial contribution from the combined funds, at any time, then this can change the probability of withdrawal success for the members who choose to remain in the pool until death. Future research could study the effect of this option on the success probability for those members who choose to remain in the pool until death. Regardless of whether this option is allowed, the success probability for an individual who remains in a pool until death is at least as high as if the individual invests independently, but follows the same portfolio weights as the pool. So if the pool is going all-in on the S&P Composite Index, and this option is allowed, the success probability for an individual who remains in a pool until death is at least as high as if the individual invests independently in just the S&P Composite Index. The logic is as follows.
At time , the present value of a living member’s contribution to the combined funds is given by , where
For , the present value is
Use to denote the number of living members in the pool at time , where members can only join the pool at time 0, but they can leave the pool by either dying or exercising the forementioned option. Use to denote the resulting value of the combined funds at time . Then since at most members can exercise the option between times and ,
An inductive argument reveals that whenever . So
This ultimately means that if an individual can complete the withdrawal schedule alone, then that individual could have completed the withdrawal schedule as a member of a pool instead, even if the pool allows living members to withdraw all of the present value of their initial contribution to the combined funds at any time.
References
- \bibcommenthead
- Bernhardt and Donnelly (2021) Bernhardt T, Donnelly C (2021) Quantifying the trade-off between income stability and the number of members in a pooled annuity fund. ASTIN Bulletin: The Journal of the IAA 51(1):101–130
- Bernhardt and Qu (2023) Bernhardt T, Qu G (2023) Wealth heterogeneity in a closed pooled annuity fund. Scandinavian Actuarial Journal pp 1–28
- Bertsekas and Shreve (1996) Bertsekas D, Shreve SE (1996) Stochastic optimal control: the discrete-time case, vol 5. Athena Scientific
- Brown (2023) Brown H (2023) Withdrawal success optimization. 2311.06665
- Chen and Rach (2023) Chen A, Rach M (2023) The tontine puzzle. Available at SSRN 4106903
- Donnelly (2015) Donnelly C (2015) Actuarial fairness and solidarity in pooled annuity funds. ASTIN Bulletin: The Journal of the IAA 45(1):49–74
- Donnelly (2022) Donnelly C (2022) Practical analysis of a pooled annuity fund with integrated bequest. Tech. rep., Technical report, Heriot-Watt University. Research commissioned by Institute …
- Goldsticker (2007) Goldsticker R (2007) A mutual fund to yield annuity-like benefits. Financial Analysts Journal 63(1):63–67
- Klaristenfeld (2007) Klaristenfeld H (2007) “a mutual fund to yield annuity-like benefits”: A comment. Financial Analysts Journal 63(3):10–10
- McKeever (2009) McKeever K (2009) A short history of tontines. Fordham J Corp & Fin L 15:491
- Milevsky (2022) Milevsky MA (2022) Managing a competitive tontine business. How to Build a Modern Tontine: Algorithms, Scripts and Tips pp 119–127
- Piggott et al (2005) Piggott J, Valdez EA, Detzel B (2005) The simple analytics of a pooled annuity fund. Journal of Risk and Insurance 72(3):497–520
- Roy (1952) Roy AD (1952) Safety first and the holding of assets. Econometrica: Journal of the econometric society pp 431–449
- Stamos (2008) Stamos MZ (2008) Optimal consumption and portfolio choice for pooled annuity funds. Insurance: Mathematics and Economics 43(1):56–68