Very High Energy Flat Spectral Radio Quasar Candidates
Abstract
The attenuation of very high energy (VHE) photons by the extragalactic background light (EBL) prevents the observation of high redshift flat spectrum radio quasars (FSRQs). However, the correlation of VHE spectral index with source redshift suggests that EBL intensity may be less than what is predicted. This deviation can draw new constraints on opacity of the universe to VHE gamma-rays. Therefore, more FSRQs may fall above the sensitivity of the forthcoming VHE telescopes than the ones predicted by the existing EBL models. In order to account for the lower EBL intensity predicted by the index-redshift correlation, we introduce a redshift dependent correction factor to the opacity estimated from commonly used cosmological EBL model. Considering this modified opacity, we identify the plausible VHE FSRQ candidates by linearly extrapolating the Fermi gamma-ray spectrum at 10 GeV to VHE regime. Our study suggests among 744 FSRQs reported in Fermi fourth catalog-Data release 2 (4FGL-DR2), 32 FSRQs will be detectable by Cherenkov Telescope Array Observatory (CTAO). Since the FSRQS are proven to be highly variable, we assume a scenario where the average Fermi gamma-ray flux increases by a factor of 10 and this predicts additional 90 FSRQs that can be detected by CTAO.
keywords:
gamma rays: galaxies – galaxies: active – cosmic background radiation1 Introduction
Very high-energy (VHE, E100GeV) gamma-ray astronomy have the potential to provide unique insights on open issues related to cosmology and particle physics. Additionally, it serves as an important probe for multi-wavelength and multi-messenger astronomy. VHE emission from the astrophysical sources can be observed from the ground by studying the shower of secondary charged particles initiated through the interaction of the primary gamma-rays with the atmosphere (de Naurois & Mazin, 2015). Among various techniques employed, the Imaging Atmospheric Cherenkov Telescopes (IACTs) detect the primary gamma-rays through the image of the Cherenkov pool caused by the secondary shower. The current-generation IACTs, which include HESS (Aharonian et al., 2006), MAGIC (Aleksić et al., 2012), and VERITAS (Holder et al., 2006), have been contributing extensively to VHE astrophysics for nearly two decades. In tandem with the telescopes operating at other energies (e.g. Fermi-LAT (Atwood et al., 2009), Swift (Burrows et al., 2005), NuSTAR (Harrison et al., 2013) and XMM-Newton (Jansen et al., 2001)), IACTs have provided clues to understand the non-thermal emission processes in blazars (Knödlseder, 2016).
The advent of new generation ground-based VHE telescopes, including the proposed Cherenkov Telescope Array Observatory (CTAO) (Cherenkov Telescope Array Consortium et al., 2019), the gamma-ray astronomy is entering into a new era. Operating from a few tens of GeV to the multi-TeV energy band, the CTAO is designed to be the largest and the most sensitive gamma-ray observatory in this energy range (Gueta, 2021). It will be configured as two sets of Cherenkov telescope arrays, one in each of the Earth’s hemispheres, and it is expected to start science operations at full capacity within few years. CTAO along with other upcoming VHE experiments, the Large High Altitude Air Shower Observatory (LHAASO) (Cao, 2021) , ASTRI Mini-Array (ASTRI MA) (Antonelli, 2021), Southern Wide-field Gamma-ray Observatory (SWGO) (Barres de Almeida et al., 2021), Major Atmospheric Cherenkov Experiments (MACE) (HiGRO Collaboration et al., 2021) etc, will be able to explore the gamma-ray sky with unprecedented performance, notably in the multi-TeV energy range.
Blazars dominate the extragalactic sky at VHE energies. These objects are the subclass of Radio loud active galactic nuclei (AGNs) having a relativistic jet pointing close to the line of sight of the observer on earth (Urry & Padovani, 1995). The spectral energy distribution (SED) of blazars is dominated by the non thermal emission from the jet and consists of two broad peaks. The low energy component extends from radio-to-X-rays and is attributed to the synchrotron emission, while the high energy component is commonly interpreted as the inverse Compton (IC) scattering of low energy photons by the relativistic electron distribution in the jet (Urry & Padovani, 1995). Blazars are further classified into BL Lac objects and Flat spectrum radio Quasars (FSRQs) based on the presence/absence of broad emission/absorption line features in their optical spectra. The synchrotron SED of BL Lacs generally peaks at optical-to-X-ray energies; whereas, for FSRQs this spectral peak fall in infrared-optical energy range. Besides the variation in peak location, the IC component of blazars is significantly different for BL Lacs and FSRQs. Particularly, the IC luminosity for FSRQs is larger than the synchrotron luminosity, commonly referred as Compton dominance, while it is of similar order in case of BL Lacs (Sikora et al., 1994). The target photon field for the IC process is also different for these two class of blazars. The IC scattering of synchrotron photons (synchrotron self Compton mechanism: SSC) is quite successful in explaining the Compton spectral component of BL Lacs. However, modelling the high energy SED of FSRQs through IC mechanism demands additional photon field other than synchrotron emission. This photon field can be external to the jet and the plausible sources are the thermal photons from the accretion disc (Dermer & Schlickeiser, 1993), broad emission line photons (Błażejowski et al., 2000) and/or the IR photons from the dusty torus (Sikora et al., 1994).
The interaction of VHE gamma-rays with the extragalactic background light (EBL) results in the formation of electron/positron pairs (Dwek & Krennrich, 2013). The amount of attenuation depends on the redshift of the source and the energy of the VHE photons. For distant blazars, this causes the observed VHE spectra to steepen, causing the flux to fall below the telescope sensitivity. Consequently this makes the Universe opaque above few tens of GeV for objects having larger redshifts (gamma-ray horizon) which was initially predicted at z > 0.1 (Gould & Schréder, 1967). Improved sensitivity of the current generation Cherenkov telescopes and better estimation of EBL intensity have significantly modified the gamma-ray horizon; nevertheless, detection of the FSRQs 4FGL J0221.1+3556 and 4FGL J1443.9+2501 located at redshifts 0.954 (Ahnen et al., 2016) and 0.939 (Abeysekara et al., 2015; Ahnen et al., 2015) suggest the EBL intensity may still be less than the prediction.
Knowledge of EBL intensity and the intrinsic source VHE spectrum is crucial in identifying the VHE blazar candidates. The latter is often estimated by extrapolating the Fermi high energy gamma-ray spectrum to VHE energies (Paiano et al., 2021; Zhu et al., 2021). The VHE blazar candidates are then obtained by convolving the extrapolated spectrum with EBL induced opacity predicted through cosmological models. However, such candidates are put forth only for BL Lacs (Massaro et al., 2013; Foffano et al., 2019; Balmaverde et al., 2019; Costamante, 2019; Paiano et al., 2021; Zhu et al., 2021) and no such study have been performed for FSRQs. The primary reason being, the Fermi spectrum of FSRQs generally deviate from a power-law and is often represented by a log-parabolic function, and extending this function to VHE energies roll off the spectrum significantly. Additionally, the FSRQs are populated at higher redshifts and the current EBL models disfavour them as probable candidates. Besides this, most VHE detections of FSRQs have been during enhanced flux states and hence the flux variability plays a crucial role in VHE studies of these sources.
In our earlier study (Malik et al., 2022) (hereafter Paper I), using the correlation between observed VHE spectral index with the redshift, we have highlighted the deviation of different cosmological EBL models from the observations. The important assumptions in the earlier study are: a) The average intrinsic VHE spectral index is consistent with the regression line extrapolated to redshift, z=0, b) The spectral index variation of the individual source is much smaller than the steepening introduced by EBL at large redshifts, and c) The cosmological evolution of the source do not modify the intrinsic VHE spectral indices. This study suggests the EBL intensity may be much less intense than the ones predicted by the cosmological models. Consistently, this also suggests the gamma-ray horizon may fall at much larger redshifts than the one presumed. Moreover, from the X-ray spectral studies of blazars it is known that the log-parabolic function is successful in reproducing only a narrow energy band (Massaro et al., 2004). Hence, it may not be judicious to expect the Fermi log-parabolic spectral shape to extend up to VHE. In this work, we predict the plausible VHE FSRQ candidates considering these discrepancies. We perform a linear extrapolation of the high energy spectrum of FSRQs listed in 4FGL-DR2 catalog (Ballet et al., 2020) to VHE as a prediction for the intrinsic VHE spectra. To account for the reduction in EBL intensity, suggested by VHE observations of FSRQs (Paper I), we add a redshift dependent correction factor to the EBL opacity provided by Franceschini & Rodighiero (2017) (hereafter FM). These modifications are then used to predict the list of VHE FSRQs that can be studied by CTAO and other operational Cherenkov telescopes. In the next section §2 we first introduce a correction factor to the existing EBL estimates (using Paper I) followed by intrinsic VHE flux estimations using Fermi spectral information. The section concludes by over-plotting the sensitivity curves of present and upcoming VHE telescopes to look for the possible VHE FSRQ candidates. Finally the Results are summarised and discussed in section §3. In this work we adopt a cosmology with , , and .
2 VHE FSRQ Candidates
2.1 Modified EBL Photon Density
The VHE detection of large redshift FSRQs indicate the Universe may be more transparent to VHE gamma-rays than anticipated. A similar conclusion is also drawn from the correlation study between the observed VHE spectral index and the redshift (Paper I). These results suggest, the predicted EBL intensity at large redshifts may be considerably larger than the actual value. To account for this excess, we introduce a redshift dependent correction factor to the commonly used EBL opacity by FM,
| (1) |
where, is the corrected opacity (hereafter modified FM; MFM) and is the VHE photon energy. This correction factor will result in a harder observed VHE spectral index for a putative intrinsic spectrum (Figure 1) given by Paper I,
| (2) |
where, is the intrinsic VHE spectral index and . Estimation of demands the knowledge of which is obtained from the y-intercept of the best fit straight line to and distribution (Paper I).

2.2 Intrinsic VHE Source Flux
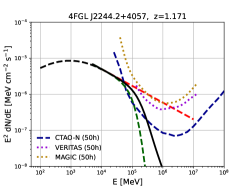
The opacity of VHE photons, along with the correction factor, equation (1), let us to derive the observed flux of FSRQs provided the intrinsic flux is known. To estimate the latter we perform a linear extrapolation of the high energy spectrum of FSRQs to VHE. The information regarding the high energy spectrum is obtained from the fourth Fermi catalog, 4FGL-DR2 (Ballet et al., 2020). The data used in this catalog was collected over the period of ten years, starting from August 4 (15:43 UTC) in 2008 to August 2 in 2018 (19:13 UTC). It employs the same analysis methods as of 4FGL catalog (Abdollahi et al., 2020) in the energy range of 50 MeV to 1 TeV. Among 5788 sources listed in the catalog, 744 fall into the list of FSRQs. The attenuation due to EBL depends upon the source redshift and this is obtained from the online databases NED111https://ned.ipac.caltech.edu/ and SIMBAD222http://simbad.cfa.harvard.edu/simbad/. These databases provide the redshifts of 586 FSRQs listed in 4FGL-DR2 and hence only these sources are considered for the present study. The information regarding the high energy spectrum of these FSRQs is extracted from the xml file available online333https://fermi.gsfc.nasa.gov/ssc/data/access/lat/10yr_catalog/gll_psc_v26.xml and the same is plotted as a black dotted line in Figure 2.
The Fermi spectral behaviour for the selected sample of FSRQs is restricted to three distinct shapes. Among the 586 individual spectra of the sources, 263 are logparabola, 321 power-law and 2 sources exhibit a power-law with exponential cutoff. For the extrapolation to VHE band, we assume a power-law extension with index consistent with the spectral slope at 10 GeV (See Table 1 & 2). This energy is chosen since attenuation due to EBL is minimal below this energy for the range of redshifts considered (Ackermann et al., 2012), and the Fermi spectrum can be treated as true intrinsic spectrum. For 8 sources, we find the terminal Fermi power-law index is harder ( 2). Such hard indices suggest the Compton peak of these sources lie beyond the Fermi energy range and the VHE spectra can be much steeper than the one predicted by the power-law extrapolation. Hence we exclude these sources from this study. The extrapolated power law from the Fermi fit to the VHE band for the rest of sources is shown in Figure 2 as a red dotted line and this serves as the intrinsic VHE spectra for the present study. The observed VHE spectrum is then obtained using from equation (1) (MFM)
| (3) |
The EBL attenuated VHE spectrum for the selected FSRQs using MFM is shown as solid black line in Figure 2. The attenuated spectrum considering FM is shown as green dotted line.
2.3 Comparison with IACT sensitivity
To identify the FSRQ candidates detectable by the operational and upcoming IACTs, we compare the predicted EBL attenuated VHE spectrum with the available sensitivity curves. The sensitivity curves of CTAO-South and North (Zenith Angle, ZA 20 deg) are obtained from the CTAO webpage444https://www.cta-observatory.org/science/cta-performance/ while the sensitivity curve for VERITAS (ZA 40 deg) is obtained from VERITAS webpage555https://veritas.sao.arizona.edu/about-veritas/veritas-specifications/. For other instruments such as MAGIC (ZA 35 deg) and H.E.S.S (ZA 18 deg), the sensitivity curves are obtained from Aleksić et al. (2016) and Holler et al. (2016) respectively. These sensitivities are calculated at 5 significance for 50 hours exposure time and are shown in Figure 2 with legends.
Comparing sensitivity of the IACTs and the predicted VHE spectrum of Fermi detected FSRQs, we identify the plausible VHE FSRQ candidates and list them in Table 1. Our study suggest, 32 FSRQs would fall within the detection threshold of CTAO’s Omega configuration (full-scope configuration), while the detection status with CTAO’s first construction phase (Alpha configuration) will be 29 using opacity estimates from MFM. Considering FM, the number of sources falling under the detection status of CTAO reduce to 23 and 20 for Omega and Alpha configurations of CTAO respectively. With the operational IACTs, the number of FSRQs falling within the detection threshold are 5 for VERITAS and 2 sources each for MAGIC and HESS using opacity estimates from MFM, while using FM the number of sources reduce to 2, 1 and 1 for VERITAS, MAGIC and HESS respectively (Table 1).
Blazars being extremely variable (Abdo et al., 2010; Meyer et al., 2019; Rajput et al., 2020), the intrinsic VHE flux derived from cumulative Fermi observations may portray only the average spectrum. To account for this variability, we assume a scenario where the VHE flux enhances by a factor of 10 above the prediction. Further, to be consistent with the rapid variability we use the CTAO sensitivity corresponding to 5 hour exposure time only. We refer the FSRQs which fall within the detection threshold of CTAO under this assumption as marginally detectable. In Table 2, we list the FSRQs which are marginally detectable and find additional 82 sources can be detected under Aplha configuration of CTAO for the opacity estimated by MFM. This number increases to 90 under Omega configuration of CTAO. For the opacity estimated from FM, the number of sources falling under the marginal detection list are 43 and 40 with Omega and Alpha configurations of CTAO respectively.
3 Summary & Discussion
The IACTs are narrow angle telescopes and require long duration observation of distant faint sources for significant detection. Hence, identification of plausible candidate FSRQs can provide a guideline for the upcoming VHE telescopes. Our earlier study, based on correlation between observed VHE spectral index with redshift (Paper I) suggests the universe may be more transparent to VHE photons than those predicted by cosmological EBL models. Taking cue from this, we predict the observed VHE fluxes of Fermi detected FSRQs and compare the same with the sensitivity of operational/upcoming telescopes. We find a significant number of FSRQs, listed in Table 1 and Table 2, can be studied by CTAO while few of them even with the operational IACTs. The sources which fall within the sensitivity limits of operational IACTs and are not reported in VHE yet are 4FGL J0043.8+3425 (VERITAS) and 4FGL J0957.6+5523 (VERITAS, MAGIC) (see Table 1). Among them 4FGL J0043.8+3425, is located at which will be the second distant FSRQ if detected and only next to the newly announced 4FGL J0348.5-2749 at z = 0.991 (Wagner et al., 2021). However, the 10 GeV spectral index for this source is 2.08. Though this satisfies our selection criteria, the hard index suggests the Compton spectral peak may fall close to 10 GeV and hence the extrapolation can be questionable. Interestingly, the VHE emission from the FSRQ 4FGL J1159.5+2914, newly announced by VERITAS (Mukherjee & VERITAS Collaboration, 2017) and MAGIC (Mirzoyan, 2017) is also predicted to be a candidate source in this work (see Table 1). We also examined the detection status for SWGO, LHAASO and MACE, however we did not find any source falling within the detection threshold of these instruments.
Among the FSRQs predicted for CTAO, we find 11 sources at fall under the detectable list and 33 under marginally detectable list (see Table 1,2). If detected, these high redshift sources may pose challenges to the existing cosmological EBL models. Alternatively, it can also play an important role in understanding the cosmology. Limits on EBL is mainly obtained through numerical models of the galaxy formation and/or their evolution with appropriate cosmological initial conditions (Domínguez et al., 2011). The model parameters are fine tuned to reproduce the observed universe. VHE identification of the sources at large redshifts can therefore be an important element to constrain the EBL which in turn can provide a better understanding about the galaxy formation and evolution. These identifications can also be used to test the alternate theories involving oscillation of photons and axion like particles proposed by the standard model (Irastorza & Redondo, 2018; Galanti & Roncadelli, 2018).
Considering the fact that the blazars are extremely variable (Abdo et al., 2010; Meyer et al., 2019; Rajput et al., 2020), certain FSRQs may still be detectable by operational/upcoming telescopes even though our study suggests otherwise. For instance, the FSRQ 4FGL J1422.3+3223 falls below our criteria for detection though it is detected at VHE (MAGIC Collaboration et al., 2021). This probably indicates that during the flaring epoch, the flux of this source can enhance more than 10 of its average flux. Consistently, we find the Fermi flux of 4FGL J1422.3+3223 during the VHE detection is typically more than 100 times larger than the average flux quoted in 4FGL catalog (Ciprini & Cheung, 2020). Considering a similar factor of flux enhancement in the present work would make this source also as detectable by the operational IACTs MAGIC and VERITAS. Similar conclusion can be arrived for the newly announced FSRQ 4FGL J0348.5-2749 where the increase in Fermi flux, contemporaneous to the VHE detection, was 200 times compared to average flux reported in Fermi 4FGL catalog (Wagner et al., 2021).
The VHE FSRQ candidates predicted in this work depend on the choice of and the robustness of the regression line. However, the regression line is obtained by fitting merely 7 data points and this may deviate with future detections. Since the estimation of assumes the intrinsic VHE index to be the y-intercept of the regression line, any deviation in the fit parameters can modify these predictions considerably. Conversely, a better regression analysis needs more FSRQs to be detected in VHE and the prediction based on the available information can facilitate this requirement. Detection of more VHE FSRQs with precise index measurements will also let us fit the redshift-index dependence with non-linear functions. Such a study will also have a major role in constraining the cosmological models.
VHE spectrum of FSRQs is better explained by a power-law function and hence we have assumed the intrinsic source spectrum also to be a power-law. If we consider the EC interpretation for the VHE emission, the Klein-Nishina effects will be substantial and the spectrum will deviate from a simple power-law (Dermer & Schlickeiser, 1993). In addition, emission at VHE may involve high energy electrons that may fall close to the cut-off energy of the underlying electron distribution (Kirk et al., 1998). Under these conditions, the intrinsic VHE spectrum may deviate significantly from a powerlaw and hence the powerlaw extrapolation to VHE energies can be an overestimate. Therefore these predictions on stringent conditions should be treated as an upper limit. The Klein-Nishina effect will depend upon the energy of the target photons and under extreme limits the VHE spectrum will be very steep with the photon spectrum nearly following the electron distribution (Blumenthal & Gould, 1970). Hence, VHE study of FSRQs can also have the potential to understand the photon field environment of FSRQs.
4 Acknowledgement
The authors thank the anonymous referee for valuable comments and suggestions. M.Z, S.S, N.I & A.M acknowledge the financial support provided by Department of Atomic energy (DAE), Board of Research in Nuclear Sciences (BRNS), Govt of India via Sanction Ref No.: 58/14/21/2019-BRNS. SZ is supported by the Department of Science and Technology, Govt. of India, under the INSPIRE Faculty grant (DST/INSPIRE/04/2020/002319). This research has made use of the CTA instrument response functions provided by the CTA Consortium and Observatory, see https://www.cta-observatory.org/science/cta-performance/ (version prod3b-v2; https://doi.org/10.5281/zenodo.5163273 and version prod5 v0.1; https://doi.org/10.5281/zenodo.5499840) for more details.
5 Data Availability
The codes and model used in this work will be shared on a reasonable request to to the corresponding author Malik Zahoor (email: [email protected]).


| Sourcename (4FGL-DR2) | R.A. | Decl. | Redshift | Spectral Slope | CTAO (Omega) | CTA (Alpha) | VERITAS | MAGIC | HESS | |||||
| (10 GeV) | MFM | FM | MFM | FM | MFM | FM | MFM | FM | MFM | FM | ||||
| 4FGL J0043.8+3425 | 00 43 53.2 | +34 25 54 | 0.966 | 2.08 | D | D | D | D | D | N | N | N | N | N |
| 4FGL J0102.8+5824 | 01 02 48.2 | +58 24 33 | 0.644 | 2.53 | D | D | D | D | N | N | N | N | N | N |
| 4FGL J0221.1+3556 | 02 21 07.4 | +35 56 09 | 0.96 | 2.50 | D | D | D | D | N | N | N | N | N | N |
| 4FGL J0237.8+2848 | 02 37 53.7 | +28 48 16 | 1.206 | 2.74 | D | N | D | N | N | N | N | N | N | N |
| 4FGL J0348.5-2749 | 03 48 34.0 | -27 49 49 | 0.99 | 2.44 | D | D | D | N | N | N | N | N | N | N |
| 4FGL J0457.0-2324 | 04 57 02.6 | -23 24 54 | 1.00 | 2.56 | D | D | D | D | N | N | N | N | N | N |
| 4FGL J0510.0+1800 | 05 10 04.3 | +18 00 49 | 0.42 | 2.51 | D | D | D | D | N | N | N | N | N | N |
| 4FGL J0515.6-4556 | 05 15 37.4 | -45 56 54 | 0.194 | 2.42 | D | N | N | N | N | N | N | N | N | N |
| 4FGL J0730.3-1141 | 07 30 18.6 | -11 41 20 | 1.59 | 2.70 | D | N | D | N | N | N | N | N | N | N |
| 4FGL J0808.2-0751 | 08 08 15.6 | -07 51 20 | 1.84 | 2.57 | D | N | N | N | N | N | N | N | N | N |
| 4FGL J0957.6+5523 | 09 57 39.9 | +55 23 02 | 0.902000 | 2.30 | D | D | D | D | D | D | D | N | N | N |
| 4FGL J1048.4+7143 | 10 48 25.6 | +71 43 47 | 1.1500 | 2.66 | D | N | D | N | N | N | N | N | N | N |
| 4FGL J1127.0-1857 | 11 27 03.2 | -18 57 50 | 1.05 | 2.56 | D | D | D | D | N | N | N | N | N | N |
| 4FGL J1159.5+2914 | 11 59 32.2 | +29 14 41 | 0.72475 | 2.47 | D | D | D | D | D | N | N | N | N | N |
| 4FGL J1224.9+2122 | 12 24 54.6 | +21 22 53 | 0.43383 | 2.57 | D | D | D | D | D | N | N | N | N | N |
| 4FGL J1256.1-0547 | 12 56 10.0 | -05 47 19 | 0.53620 | 2.65 | D | D | D | D | D | D | D | D | D | N |
| 4FGL J1427.9-4206 | 14 27 56.8 | -42 06 22 | 1.52 | 2.58 | D | D | D | D | N | N | N | N | N | N |
| 4FGL J1443.9+2501 | 14 43 58.4 | +25 01 45 | 0.9397 | 2.46 | D | D | D | D | N | N | N | N | N | N |
| 4FGL J1504.4+1029 | 15 04 24.8 | +10 29 52 | 1.83795 | 2.71 | D | D | D | D | N | N | N | N | N | N |
| 4FGL J1512.8-0906 | 15 12 51.5 | -09 06 23 | 0.36 | 2.66 | D | D | D | D | N | N | N | N | D | D |
| 4FGL J1553.6-2422 | 15 53 36.6 | -24 22 07 | 0.33 | 2.30 | D | D | D | D | N | N | N | N | N | N |
| 4FGL J1642.9+3948 | 16 42 56.2 | +39 48 59 | 0.59541 | 2.40 | D | N | D | N | N | N | N | N | N | N |
| 4FGL J1722.7+1014 | 17 22 44.6 | +10 14 05 | 0.732 | 2.20 | D | N | D | N | N | N | N | N | N | N |
| 4FGL J1924.8-2914 | 19 24 51.3 | -29 14 48 | 0.35263 | 2.38 | D | D | D | N | N | N | N | N | N | N |
| 4FGL J2000.9-1748 | 20 00 56.3 | -17 48 59 | 0.65 | 2.27 | D | D | D | N | N | N | N | N | N | N |
| 4FGL J2025.6-0735 | 20 25 41.3 | -07 35 40 | 1.388000 | 2.72 | D | N | D | N | N | N | N | N | N | N |
| 4FGL J2158.1-1501 | 21 58 06.6 | -15 01 25 | 0.67 | 2.18 | D | N | D | N | N | N | N | N | N | N |
| 4FGL J2232.6+1143 | 22 32 36.6 | +11 43 50 | 1.032 | 2.93 | D | D | D | D | N | N | N | N | N | N |
| 4FGL J2244.2+4057 | 22 44 14.7 | +40 57 35 | 1.171 | 2.46 | D | D | D | D | N | N | N | N | N | N |
| 4FGL J2253.9+1609 | 22 53 59.1 | +16 09 02 | 0.859001 | 3.24 | D | D | D | D | N | N | N | N | N | N |
| 4FGL J2329.3-4955 | 23 29 19.1 | -49 55 57 | 0.518 | 2.80 | D | D | D | D | N | N | N | N | N | N |
| 4FGL J2345.2-1555 | 23 45 12.7 | -15 55 06 | 0.621 | 2.55 | D | D | D | D | N | N | N | N | N | N |
| Sourcename (4FGL-DR2) | R.A. | Decl. | Redshift | Spectral Slope | CTAO (Omega) | CTAO (Alpha) | ||
| (10 GeV) | MFM | FM | MFM | FM | ||||
| 4FGL J0038.2-2459 | 00 38 15.6 | -24 59 24 | 0.49806 | 2.64 | M | N | M | N |
| 4FGL J0050.4-0452 | 00 50 26.9 | -04 52 50 | 0.922 | 2.38 | M | N | M | N |
| 4FGL J0108.6+0134 | 01 08 40.7 | +01 34 55 | 2.108898 | 2.89 | M | M | M | M |
| 4FGL J0112.8+3208 | 01 12 53.4 | +32 08 24 | 0.6100 | 2.65 | M | M | M | M |
| 4FGL J0113.4+4948 | 01 13 28.4 | +49 48 19 | 0.39 | 2.45 | M | M | M | M |
| 4FGL J0116.0-1136 | 01 16 00.1 | -11 36 22 | 0.671 | 2.36 | M | M | M | M |
| 4FGL J0118.9-2141 | 01 18 54.1 | -21 41 41 | 1.16 | 2.65 | M | M | M | M |
| 4FGL J0128.5+4440 | 01 28 34.5 | +44 40 40 | 0.228 | 2.13 | M | N | N | N |
| 4FGL J0132.7-1654 | 01 32 42.2 | -16 54 37 | 1.02 | 2.64 | M | N | M | N |
| 4FGL J0133.1-5201 | 01 33 10.5 | -52 01 13 | 0.02 | 2.69 | M | M | M | M |
| 4FGL J0137.0+4751 | 01 37 02.5 | +47 51 49 | 0.86 | 2.72 | M | M | M | M |
| 4FGL J0206.4-1151 | 02 06 24.4 | -11 51 27 | 1.663 | 2.40 | M | N | N | N |
| 4FGL J0210.7-5101 | 02 10 46.7 | -51 01 18 | 1.003 | 2.76 | M | M | M | M |
| 4FGL J0217.8+0144 | 02 17 50.9 | +01 44 05 | 1.72 | 2.51 | M | N | M | N |
| 4FGL J0236.8-6136 | 02 36 48.5 | -61 36 38 | 0.466569 | 2.35 | M | M | M | M |
| 4FGL J0252.8-2219 | 02 52 48.2 | -22 19 13 | 1.419 | 2.80 | M | N | M | N |
| 4FGL J0253.5+3216 | 02 53 31.9 | +32 16 57 | 0.859 | 2.17 | M | N | M | N |
| 4FGL J0259.4+0746 | 02 59 25.9 | +07 47 00 | 0.89 | 2.41 | M | M | M | M |
| 4FGL J0312.8+0134 | 03 12 53.3 | +01 34 21 | 0.664 | 2.33 | M | N | N | N |
| 4FGL J0339.5-0146 | 03 39 30.5 | -01 46 37 | 0.85 | 2.72 | M | M | M | M |
| 4FGL J0423.3-0120 | 04 23 18.2 | -01 20 03 | 0.91609 | 2.73 | M | M | M | M |
| 4FGL J0442.6-0017 | 04 42 38.7 | -00 17 46 | 0.845 | 2.78 | M | N | M | N |
| 4FGL J0449.2+6329 | 04 49 16.4 | +63 29 40 | 0.781 | 2.60 | M | N | M | N |
| 4FGL J0505.3+0459 | 05 05 22.3 | +04 59 58 | 0.59 | 2.85 | M | M | M | M |
| 4FGL J0509.4+1012 | 05 09 24.2 | +10 12 03 | 0.621 | 2.41 | M | N | M | N |
| 4FGL J0526.2-4830 | 05 26 17.1 | -48 30 54 | 1.3041 | 2.55 | M | M | M | M |
| 4FGL J0532.6+0732 | 05 32 41.3 | +07 32 57 | 1.254 | 2.78 | M | M | M | M |
| 4FGL J0532.9-8325 | 05 32 58.9 | -83 25 57 | 0.774 | 2.07 | M | N | M | N |
| 4FGL J0654.4+4514 | 06 54 25.4 | +45 14 41 | 0.928 | 2.57 | M | N | M | N |
| 4FGL J0709.7-0255 | 07 09 46.8 | -02 55 48 | 1.472 | 2.54 | M | N | M | N |
| 4FGL J0719.3+3307 | 07 19 21.6 | +33 07 24 | 0.779 | 2.63 | M | M | M | M |
| 4FGL J0725.2+1425 | 07 25 17.8 | +14 25 16 | 1.038 | 2.58 | M | M | M | M |
| 4FGL J0739.2+0137 | 07 39 16.8 | +01 37 18 | 0.19 | 2.89 | M | M | M | M |
| 4FGL J0742.6+5443 | 07 42 41.2 | +54 43 37 | 0.723 | 2.70 | M | N | M | N |
| 4FGL J0748.6+2400 | 07 48 39.3 | +24 01 00 | 0.40932 | 2.34 | M | M | M | M |
| 4FGL J0829.4+0857 | 08 29 24.8 | +08 57 22 | 0.866 | 2.06 | M | N | M | N |
| 4FGL J0850.1-1212 | 08 50 09.9 | -12 12 44 | 0.87 | 2.69 | M | M | M | M |
| 4FGL J0909.7-0230 | 09 09 47.1 | -02 30 51 | 0.957000 | 2.73 | M | N | N | N |
| 4FGL J0921.6+6216 | 09 21 40.4 | +62 16 15 | 1.447000 | 2.69 | M | N | M | N |
| 4FGL J0922.4-0528 | 09 22 27.0 | -05 28 29 | 0.974 | 2.14 | M | M | M | N |
| 4FGL J1006.7-2159 | 10 06 46.3 | -21 59 28 | 0.33 | 2.57 | M | M | M | M |
| 4FGL J1016.0+0512 | 10 16 02.2 | +05 12 32 | 1.701000 | 2.22 | M | N | M | N |
| 4FGL J1033.1+4115 | 10 33 06.0 | +41 15 43 | 1.118000 | 2.41 | M | N | M | N |
| 4FGL J1033.9+6050 | 10 33 56.4 | +60 50 57 | 1.408000 | 2.56 | M | M | M | M |
| 4FGL J1037.4-2933 | 10 37 25.5 | -29 33 24 | 0.31 | 2.41 | M | N | N | N |
| 4FGL J1043.2+2408 | 10 43 13.3 | +24 08 46 | 0.560000 | 2.32 | M | M | M | M |
| Sourcename (4FGL-DR2) | R.A. | Decl. | Redshift | Spectral Slope | CTAO (Omega) | CTAO (Alpha) | ||
| (10 GeV) | MFM | FM | MFM | FM | ||||
| 4FGL J1106.0+2813 | 11 06 00.5 | +28 13 31 | 0.84434 | 2.37 | M | N | M | N |
| 4FGL J1123.4-2529 | 11 23 28.4 | -25 29 17 | 0.146 | 2.24 | M | M | M | N |
| 4FGL J1127.8+3618 | 11 27 51.3 | +36 18 50 | 0.8841 | 2.37 | M | N | M | N |
| 4FGL J1146.9+3958 | 11 46 57.7 | +39 58 39 | 1.087885 | 2.71 | M | M | M | M |
| 4FGL J1153.4+4931 | 11 53 24.1 | +49 31 01 | 0.33364 | 2.41 | M | M | M | M |
| 4FGL J1154.0+4037 | 11 54 03.5 | +40 37 55 | 0.92834 | 2.11 | M | N | M | N |
| 4FGL J1246.7-2548 | 12 46 45.3 | -25 48 06 | 0.63 | 2.85 | M | M | M | M |
| 4FGL J1310.5+3221 | 13 10 31.8 | +32 21 17 | 0.99725 | 2.59 | M | M | M | M |
| 4FGL J1316.1-3338 | 13 16 06.0 | -33 38 11 | 1.21 | 2.62 | M | N | M | N |
| 4FGL J1322.2+0842 | 13 22 12.2 | +08 42 13 | 0.326 | 2.26 | M | N | N | N |
| 4FGL J1345.5+4453 | 13 45 34.6 | +44 53 04 | 2.542000 | 2.65 | M | M | M | M |
| 4FGL J1349.5-1131 | 13 49 32.9 | -11 31 08 | 0.340000 | 2.49 | M | N | M | N |
| 4FGL J1401.2-0915 | 14 01 13.5 | -09 15 28 | 0.667 | 2.08 | M | N | M | N |
| 4FGL J1419.4-0838 | 14 19 26.4 | -08 38 30 | 0.903 | 2.56 | M | M | M | M |
| 4FGL J1459.5+1527 | 14 59 33.0 | +15 27 51 | 0.370 | 2.10 | M | N | M | N |
| 4FGL J1512.2+0202 | 15 12 16.8 | +02 02 25 | 0.21945 | 2.68 | M | M | M | M |
| 4FGL J1522.1+3144 | 15 22 10.9 | +31 44 22 | 1.4886 | 2.79 | M | M | M | M |
| 4FGL J1549.5+0236 | 15 49 32.4 | +02 36 30 | 0.41421 | 2.41 | M | M | M | M |
| 4FGL J1625.7-2527 | 16 25 46.9 | -25 27 54 | 0.79 | 2.90 | M | M | M | M |
| 4FGL J1635.2+3808 | 16 35 16.0 | +38 08 24 | 1.814000 | 3.07 | M | N | M | N |
| 4FGL J1637.7+4717 | 16 37 44.2 | +47 17 29 | 0.735000 | 2.43 | M | N | M | N |
| 4FGL J1640.4+3945 | 16 40 28.6 | +39 45 45 | 1.672000 | 2.42 | M | N | M | N |
| 4FGL J1728.0+1216 | 17 28 04.8 | +12 16 32 | 0.586 | 2.45 | M | N | N | N |
| 4FGL J1733.0-1305 | 17 33 03.2 | -13 05 09 | 0.90 | 2.86 | M | M | M | M |
| 4FGL J1734.3+3858 | 17 34 23.6 | +38 58 35 | 0.975 | 2.67 | M | N | M | N |
| 4FGL J1740.0+4737 | 17 40 05.4 | +47 37 11 | 0.95 | 2.10 | M | N | M | N |
| 4FGL J1740.5+5211 | 17 40 32.6 | +52 11 34 | 1.383 | 2.47 | M | N | M | N |
| 4FGL J1802.6-3940 | 18 02 41.1 | -39 40 07 | 1.319 | 2.90 | M | N | M | N |
| 4FGL J1830.1+0617 | 18 30 08.7 | +06 17 16 | 0.745 | 2.37 | M | N | M | N |
| 4FGL J1833.6-2103 | 18 33 38.4 | -21 03 27 | 2.507 | 2.99 | M | N | M | N |
| 4FGL J1849.2+6705 | 18 49 16.6 | +67 05 27 | 0.66 | 2.71 | M | M | M | M |
| 4FGL J1852.4+4856 | 18 52 27.8 | +48 56 06 | 1.250 | 2.29 | M | M | M | M |
| 4FGL J2023.6-1139 | 20 23 36.8 | -11 39 31 | 0.698 | 2.51 | M | M | M | M |
| 4FGL J2025.2+0317 | 20 25 14.0 | +03 17 21 | 2.210 | 2.18 | M | N | M | N |
| 4FGL J2121.0+1901 | 21 21 02.4 | +19 01 57 | 2.180 | 2.43 | M | N | M | N |
| 4FGL J2143.5+1743 | 21 43 34.6 | +17 43 50 | 0.21 | 2.69 | M | M | M | M |
| 4FGL J2147.3-7536 | 21 47 18.4 | -75 36 09 | 1.14 | 2.77 | M | N | M | N |
| 4FGL J2156.3-0036 | 21 56 19.1 | -00 36 14 | 0.495 | 2.25 | M | M | M | M |
| 4FGL J2203.4+1725 | 22 03 29.3 | +17 25 54 | 1.076 | 2.65 | M | N | M | N |
| 4FGL J2225.7-0457 | 22 25 43.7 | -04 57 13 | 1.404 | 2.42 | M | N | N | N |
| 4FGL J2321.9+2734 | 23 21 58.1 | +27 34 18 | 1.25 | 2.15 | M | N | M | N |
| 4FGL J2321.9+3204 | 23 21 54.7 | +32 04 25 | 1.489 | 2.76 | M | N | M | N |
| 4FGL J2323.5-0317 | 23 23 33.2 | -03 17 24 | 1.41 | 2.69 | M | M | M | N |
| 4FGL J2348.0-1630 | 23 48 03.8 | -16 30 58 | 0.58 | 2.57 | M | M | M | M |
References
- Abdo et al. (2010) Abdo A. A., et al., 2010, ApJ, 722, 520
- Abdollahi et al. (2020) Abdollahi S., et al., 2020, ApJS, 247, 33
- Abeysekara et al. (2015) Abeysekara A. U., et al., 2015, ApJ, 815, L22
- Ackermann et al. (2012) Ackermann M., et al., 2012, Science, 338, 1190
- Aharonian et al. (2006) Aharonian F., et al., 2006, A&A, 457, 899
- Ahnen et al. (2015) Ahnen M. L., et al., 2015, ApJ, 815, L23
- Ahnen et al. (2016) Ahnen M. L., et al., 2016, A&A, 595, A98
- Aleksić et al. (2012) Aleksić J., et al., 2012, Astroparticle Physics, 35, 435
- Aleksić et al. (2016) Aleksić J., et al., 2016, Astroparticle Physics, 72, 76
- Antonelli (2021) Antonelli L. A., 2021, PoS, ICRC2021, 897
- Atwood et al. (2009) Atwood W. B., et al., 2009, ApJ, 697, 1071
- Ballet et al. (2020) Ballet J., Burnett T. H., Digel S. W., Lott B., 2020, arXiv e-prints, p. arXiv:2005.11208
- Balmaverde et al. (2019) Balmaverde B., et al., 2019, Monthly Notices of the Royal Astronomical Society, 492, 3728
- Barres de Almeida et al. (2021) Barres de Almeida U., Giacinti G., Longo F., 2021, PoS, ICRC2021, 893
- Błażejowski et al. (2000) Błażejowski M., Sikora M., Moderski R., Madejski G. M., 2000, The Astrophysical Journal, 545, 107
- Blumenthal & Gould (1970) Blumenthal G. R., Gould R. J., 1970, Reviews of Modern Physics, 42, 237
- Burrows et al. (2005) Burrows D. N., et al., 2005, Space Sci. Rev., 120, 165
- Cao (2021) Cao Z., 2021, PoS, ICRC2021, 011
- Cherenkov Telescope Array Consortium et al. (2019) Cherenkov Telescope Array Consortium et al., 2019, Science with the Cherenkov Telescope Array, doi:10.1142/10986.
- Ciprini & Cheung (2020) Ciprini S., Cheung C. C., 2020, The Astronomer’s Telegram, 13382, 1
- Costamante (2019) Costamante L., 2019, Monthly Notices of the Royal Astronomical Society, 491, 2771
- Dermer & Schlickeiser (1993) Dermer C. D., Schlickeiser R., 1993, ApJ, 416, 458
- Domínguez et al. (2011) Domínguez A., et al., 2011, MNRAS, 410, 2556
- Dwek & Krennrich (2013) Dwek E., Krennrich F., 2013, Astroparticle Physics, 43, 112
- Foffano et al. (2019) Foffano L., Prandini E., Franceschini A., Paiano S., 2019, Monthly Notices of the Royal Astronomical Society, 486, 1741
- Franceschini & Rodighiero (2017) Franceschini A., Rodighiero G., 2017, Astronomy & Astrophysics, 603, A34
- Galanti & Roncadelli (2018) Galanti G., Roncadelli M., 2018, Journal of High Energy Astrophysics, 20, 1
- Gould & Schréder (1967) Gould R. J., Schréder G. P., 1967, Physical Review, 155, 1404
- Gueta (2021) Gueta O., 2021, arXiv e-prints, p. arXiv:2108.04512
- Harrison et al. (2013) Harrison F. A., et al., 2013, ApJ, 770, 103
- HiGRO Collaboration et al. (2021) HiGRO Collaboration et al., 2021, arXiv e-prints, p. arXiv:2107.04297
- Holder et al. (2006) Holder J., et al., 2006, Astroparticle Physics, 25, 391
- Holler et al. (2016) Holler M., De Naurois M., Zaborov D., Balzer A., Chalmé-Calvet R., 2016, PoS, ICRC2015, 980
- Irastorza & Redondo (2018) Irastorza I. G., Redondo J., 2018, Progress in Particle and Nuclear Physics, 102, 89
- Jansen et al. (2001) Jansen F., et al., 2001, A&A, 365, L1
- Kirk et al. (1998) Kirk J. G., Rieger F. M., Mastichiadis A., 1998, A&A, 333, 452
- Knödlseder (2016) Knödlseder J., 2016, Comptes Rendus Physique, 17, 663
- MAGIC Collaboration et al. (2021) MAGIC Collaboration et al., 2021, A&A, 647, A163
- Malik et al. (2022) Malik Z., Sahayanathan S., Shah Z., Iqbal N., Manzoor A., Bhatt N., 2022, MNRAS, 511, 994
- Massaro et al. (2004) Massaro E., Perri M., Giommi P., Nesci R., 2004, A&A, 413, 489
- Massaro et al. (2013) Massaro F., Paggi A., Errando M., D'Abrusco R., Masetti N., Tosti G., Funk S., 2013, The Astrophysical Journal Supplement Series, 207, 16
- Meyer et al. (2019) Meyer M., Scargle J. D., Blandford R. D., 2019, ApJ, 877, 39
- Mirzoyan (2017) Mirzoyan R., 2017, The Astronomer’s Telegram, 11061, 1
- Mukherjee & VERITAS Collaboration (2017) Mukherjee R., VERITAS Collaboration 2017, The Astronomer’s Telegram, 11075, 1
- Paiano et al. (2021) Paiano S., Treves A., Franceschini A., Falomo R., 2021, MNRAS, 508, 6128
- Rajput et al. (2020) Rajput B., Stalin C. S., Rakshit S., 2020, A&A, 634, A80
- Sikora et al. (1994) Sikora M., Begelman M. C., Rees M. J., 1994, ApJ, 421, 153
- Urry & Padovani (1995) Urry C. M., Padovani P., 1995, Publications of the Astronomical Society of the Pacific, 107, 803
- Wagner et al. (2021) Wagner S., Rani B., H. E. S. S. Collaboration 2021, The Astronomer’s Telegram, 15020, 1
- Zhu et al. (2021) Zhu K. R., Kang S. J., Zhou R. X., Zheng Y. G., 2021, ApJ, 916, 93
- de Naurois & Mazin (2015) de Naurois M., Mazin D., 2015, Comptes Rendus Physique, 16, 610