Using thymine-18 for enhancing dose delivery and localizing the Bragg peak in proton-beam therapy
Abstract
Therapeutic protons acting on O18-substituted thymidine increase cytotoxicity in radio-resistant human cancer cells. We consider here the physics behind the irradiation during proton beam therapy and diagnosis using O18-enriched thymine in DNA, with attention to the effect of the presence of thymine-18 on cancer cell death.
I introduction
This technical report presents the physics background behind a proposal for proton-beam therapy (PT) using doped DNA in which one of the oxygen atoms in the thymine bases have been replaced by oxygen-18 (a stable isotope), for the purpose of enhanced dose to tumors and for the side benefit of localization of the peak-dose delivery region.
Proton therapy delivers radiation to cancers to cause malignant-cell death, principally by radical formation causing unrepairable damage to their DNA and thereby slowing or stopping tumor growth. Therapeutic protons, in passing through tissue, will scatter electrons and generate ions and radicals, such as hydroxyl. Through chemical reactions, the radicals can cause single-strand breaks (SSB) in DNA. Two such nearby breaks can generate a double-strand break (DSB). With a much lower probability, a direct DSB can be caused by a beam proton passing through the DNA helix itself, producing a ‘clustered’ pair of SSBs. Beam protons can also activate nuclei, such as those of oxygen, carbon and nitrogen atoms. These, in turn, can release, through strong-interaction decay, gammas and fast-moving secondary particles such as protons, neutrons, deuterons, tritium and alpha particles, and through weak-interaction decay, electrons, positrons, and neutrinos. Those secondaries with a charge can also produce localized damage to the functioning of tumor cells.
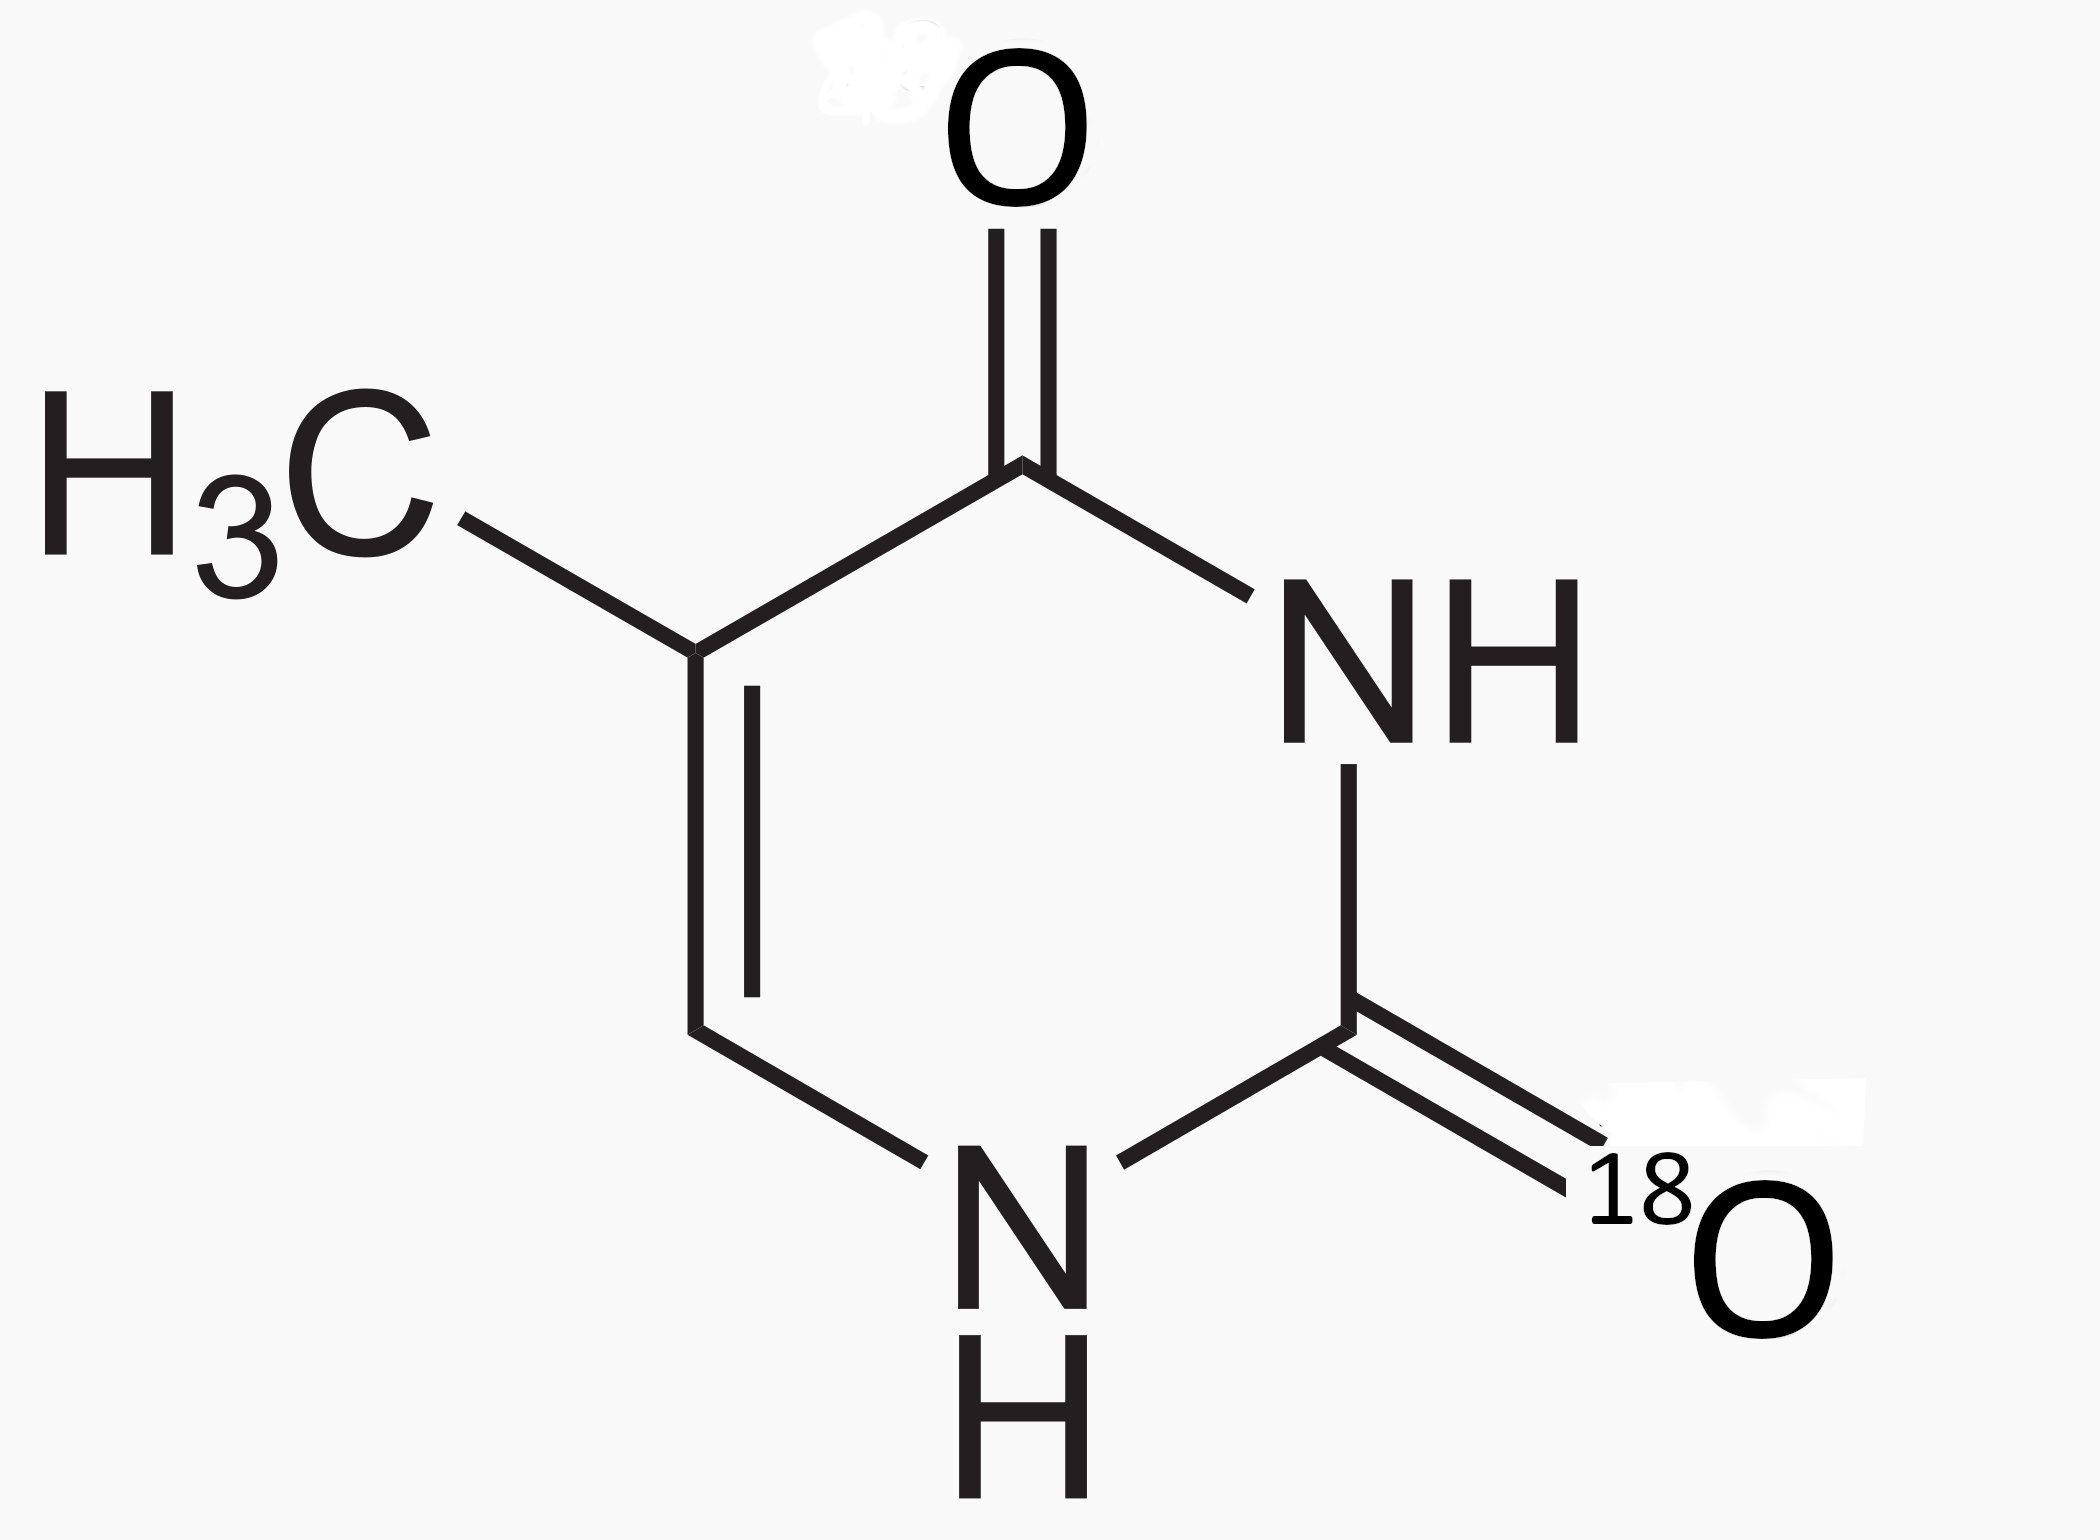
A recent project [33]) at the Georgetown University Hospital initiated a study of the lethality enhancement of irradiated cells due to modified DNA, replacing the O16 with O18 in thymine (see Figure 1). Upon proton irradiation, some O18 is transformed to F18, producing a DNA breakage mechanism and a positron-emission tomography (PET) signal, which can be monitored to help track where the proton beam Bragg peak occurred in the doped tissue. The Georgetown group exposed SQ20-B squamous carcinoma cells to physiologic O-thymidine concentration of 5 M for 48 hours followed by to Gy graded doses of proton radiation given hours later. Survival analysis showed a dose modification factor () of 1.2 due to the substituted thymidine.
Here we wish to estimate the rate of O18 conversion to F18 for a given proton beam and fixed amount of doped DNA, and the subsequent resulting DNA breakage induced. Also, we want to assess the use of the PT-produced F18 to better localize the PT beam region of maximum dose via a post-PT PET scanning.
II Physics Analysis
II.1 Proton beams in tissue
When an energetic proton (initial kinetic energy from 50 to 250 MeV) enters tissue, the atoms and molecules in the tissue will slow the beam protons, largely through scattering and ionization of tissue electrons. Because the proton is 1836 times more massive than the electron, the direction of the proton is not significantly changed by electron encounters. (Appendix B.2 shows that for each encounter of a proton with a quasi-free electron, the proton deviates from a straight line no more than deg, where is the mass of the electron and is the mass of the proton.) The scattered electrons (‘delta’ electrons) spread the beam ionization over nearby tissue, but not more than about mm for 200 MeV protons. The ‘stopping power’ (loss of beam-proton kinetic energy with distance, ) depends on the density of the tissue, largely because of the electron density. Fluences in the range of protons per square centimeter are typical for proton-beam therapy. The fluence rate of protons in the beam decreases as protons are taken from the beam, with interaction of beam protons with nuclei in the tissue a large contributor to the fluence loss. These nuclear events are relatively rare because of the small size of the nuclei, but can widely deflect beam protons by nuclear-Coulomb elastic and inelastic scattering. Nonelastic nuclear reactions also occur when the beam protons have sufficient energy to penetrate the nuclear Coulomb barrier, making fast-moving reaction products, generally moving away from the proton beam axis.111We will take elastic collision to mean that the incoming and outgoing particles are the same, and that all the initial kinetic energy is returned to the outgoing particles. A quasi-elastic collision occurs if the incoming particle knocks out a particle in a bound state of a target, with little energy being transferred to the other particles in the target. In an inelastic collision, some of the initial kinetic energy is converted into internal energy in one or more of the outgoing particles. For a noneleastic collision, the set of outgoing particles differs in internal structure from the incoming ones.
The physical dose delivered by the beam within some small volume of tissue, i.e. the energy deposited in that volume per unit mass of tissue
| (1) |
comes from electron ionizations (producing chemical transformations and radical formation), but is also affected by the energy deposited by the products of nuclear reactions. For a proton beam with an initial energy of MeV, % of the beam energy loss from the beam comes from inelastic nuclear reactions ([36]).
The ‘biologically effective dose’ (), , with units sievert (Sv), defined as the physical dose times a unitless factor called the ‘relative biological effectiveness’ (), attempts to make the have the same biologically damaging effect as photons with about the same energy. The overall of proton beams is around , while for carbon ions, its about and for neutrons exceeds . However, the of a proton beam depends on its energy, reaching values as much as 4 or 5 when the beam’s rate of energy loss is about 100 keV per micrometer ([36]) because of a larger number of atomic electron excitation and ionization, but also having contributions from a greater number proton-nuclei reactions making ionizing secondaries. A over Sv will frequently be fatal to living cells (lethality is % with a of 4 to 5 Sv delivered over a few minutes).
In tissue, the released neutrons are likely to bounce around among the nearby nuclei until absorbed by a nucleus or thermalized. The energy loss is slow relative to protons, because there is no Coulomb interaction, so the neutron must get within about a fermi of a nucleus to scatter. For neutrons in the 1 to 20 MeV energy range, scattering against a high Z nucleus can cause that nucleus to be excited, but this has a lower probability than elastic scattering. At lower energies, the neutron is likely to be absorbed, even by hydrogen protons making deuterium. The neutron attenuation coefficient depends on the inverse of its relative speed for energies below about 1 eV. The time for diffusive thermalization ranges from about 200 microseconds (water) to 20 milliseconds (graphite). A thermalized neutron is then likely to be absorbed by a nearby nucleus. Without a nuclear-absorption event, the neutron will beta decay (with a half-life time of min) to a proton, electron, and anti-neutrino, those products sharing MeV in kinetic energy. The neutrinos exit with practically no interaction with matter on their path. (A MeV electron anti-neutrino has a mean-free path through water of light-years!)
The fluence of secondary neutrons produced by proton beams in tissue is low [7], but because these neutrons are easily spread, and their relative biological effectiveness can be 10 to 20 times higher than the protons, their presence cannot be ignored. However, with proper strategies, the neutron-generated dose to healthy tissue is still low with proton beam therapy when compared to the dose to healthy tissue under photon beam therapy[35].
II.2 Using Oxygen-18
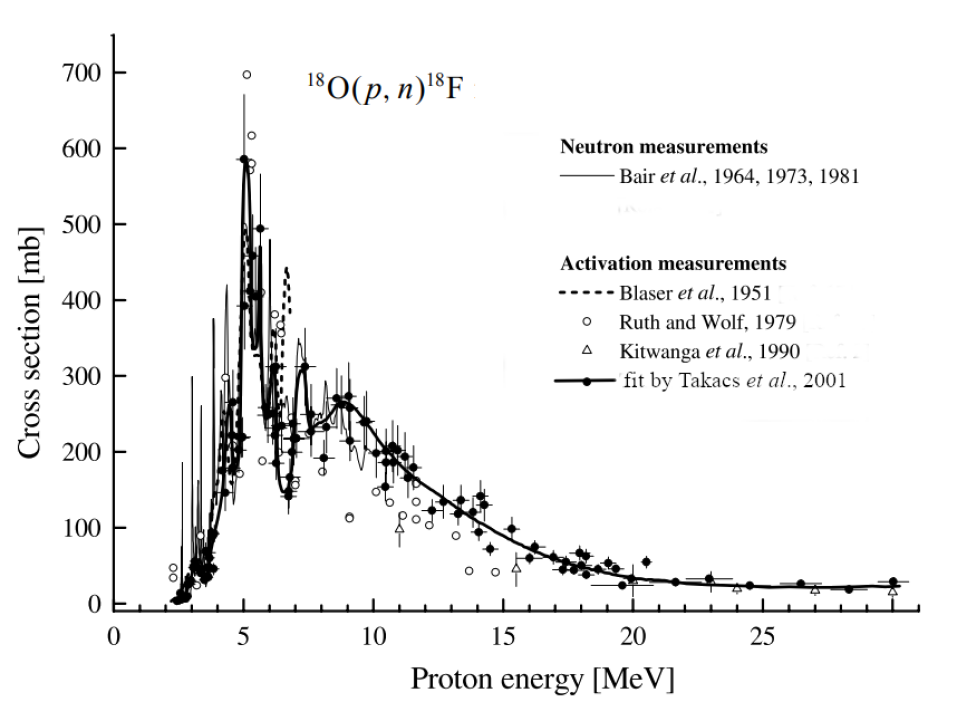
Among the many reactions of an energetic proton-beam with a thymine-18 doped target, the reaction
has a relatively large cross section (hundreds of millibarns) in the to MeV proton kinetic energy range. The presence of this reaction can be monitored because of the subsequent beta decay of fluorine-18. The beta decay produces a positron, which may scatter with local nuclei and electrons, and then annihilate with an electron, making two oppositely-directed MeV gamma rays. Using the techniques of a PET scan, the location near (within a fraction of a millimeter with high probability) where the reacted thymine resided can be found. We will see later that the location for maximal production of F18 is typically a fraction of a millimeter behind a pristine Bragg peak location. (See end of Appendix H.)
The beta decay of the fluorine,
| (2) |
is the dominant (97%) cause of the finite lifetime of ( min), with about 3% occurrence of electron capture (also via a weak interaction). (The parenthesis in the displayed reaction ‘equation’ indicates the atom rather than just the nucleus.)
Both the reaction (2) and the electron capture reaction
| (3) |
are transitions of directly to the nuclear ground state of (so there will be no subsequent gamma emission). The bracketed notation shows the spin-parity of the nucleus. For the beta-decay reaction, with the nuclear angular momentum in the final state, the positron-neutrino system will be in a triplet (negative parity) spin state, so the nuclear transition must be mediated by an odd parity operator, making this reaction an allowed Gamow-Teller transition.
Generally, a nuclear beta decay can be represented as a reaction:
| (4) |
where, for positron emission, , i.e. a left-handed neutrino with lepton number , while for electron emission, , i.e. a right-handed anti-neutrino with lepton number . is the ‘parent’ nucleus with mass number (the number of protons plus the number of neutrons; used as an isotope label) and nuclear charge , while is the daughter nucleus. If the daughter nucleus is produced in an excited state, a ’prompt’ gamma ray is also likely to be emitted from the daughter, although other channels for the fast nuclear decay of an excited nucleus are possible, such as -particle emission, proton or neutron emission, or even fission. (These daughter decays into nuclear particles are referred to as ‘beta-delayed’ nuclear decays.) Daughters may also undergo another beta decay.
In the case of F18 decay, the experimentally-measured maximum positron kinetic energy is MeV, with an average of about a third of this maximum. This kinetic energy can be calculated using energy-momentum conservation, as shown in Appendix F. Including the Coulomb repulsion that the positron feels on exiting the daughter nucleus, the number of positrons produced in the weak decay in a given energy interval , when the positron energies have energy centered on is given by (Wu and Moszkowski, [41]):
| (5) |
Here, is a coupling constant, and is the Coulomb Fermi function (coming from the magnitude squared of the overlap of the wave functions for the two leptons), with Figure 2 shows the probability per unit energy, , for the emission of a positron.

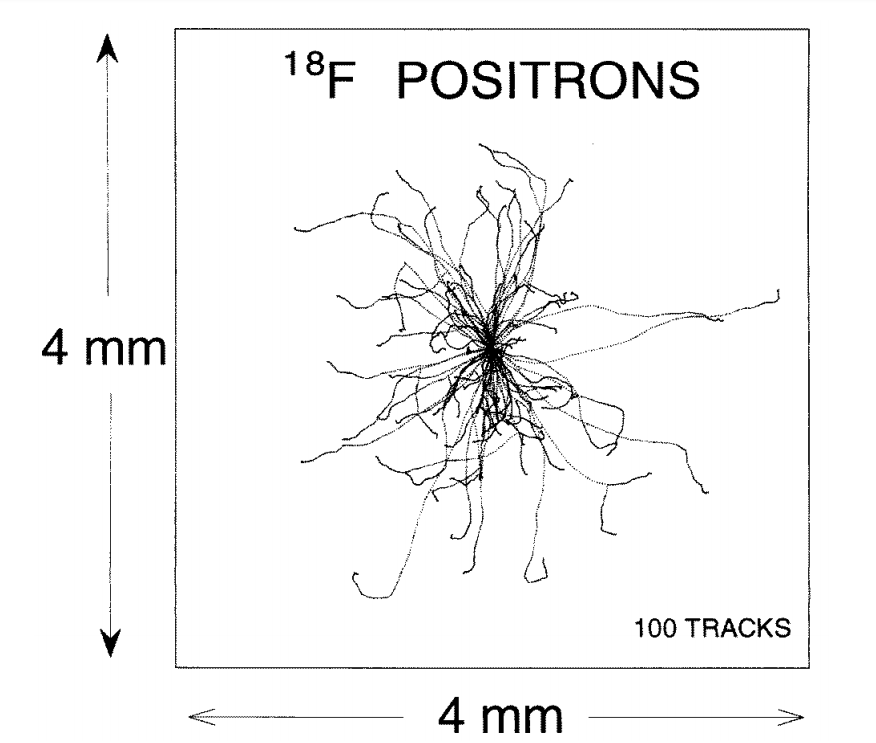
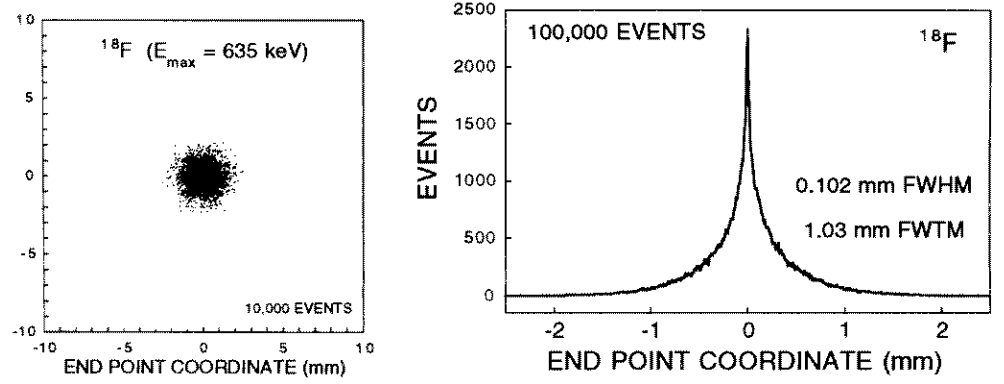
Figure 3 shows simulated positron tracks from a series of beta decays at one localized point. At the end of each track, the positron combines with a local electron to make two gamma rays (oppositely directed) of energy MeV each. These gamma rays have an inverse attenuation coefficient of about cm (Kinahan et al., [22]) in water and soft tissue, so, if produced in a body, they will likely exit and can be simultaneously detected in a PET scanner.
After the proton-beam induces O18 (in a double-covalent bond with carbon #2 in the thymine ring) to become F18 with the release of a neutron, the recoiling fluorine has sufficient energy to directly or indirectly break both backbone strands of the nearby DNA (see Appendix E), or, if it remains in the nucleotide, causes the nitrogen #3 in the thymine ring to form a double bond with carbon #2, and drop the hydrogen at the nitrogen #1. That hydrogen formed one of two hydrogen bonds that kept the thymidine attached to adenocine. Each of the possible actions disrupt the DNA. With a F18 half-life of min, the electrons around the new fluorine nucleus have plenty of time to settle into stable orbits. Later, the fluorine nucleus beta decays, with the positron quickly leaving the scene. Now the atomic electrons find themselves in orbit around the new oxygen nucleus, with one more electron than needed to make the atomic states of neutral oxygen, and with transient energies lower than those for the new stable oxygen orbits, since the number of protons at the core of the atom is one less. As the electrons settle up, they will have to release their excess energy to adjacent atoms, directly or by radiation (in the range). From the complete ionization energies of fluorine and oxygen (106,434 keV and 84.078 keV) and by estimating the binding energy of the last electron in negatively charged oxygen (electron affinity of about 1.46 eV), there will be about 22 keV released by the new charged oxygen in becoming neutral.
III Nuclear reactions along the proton beam
Protons and secondary neutrons in the PT beam can undergo nuclear interaction with the tissue nuclei via elastic, inelastic, and nonelastic collisions. For proton beams entering biological tissue, collisions with H1, O16, C12, and N14 will dominate, as these are the most abundant nuclides. At the highest beam energies (MeV), a beam particle has time to interact with only one or two nuclei before reaching its range in the tissue. Because of Lorentz contraction, the beam particle acts as if the nucleus were flattened (perpendicular to the beam-particle’s momentum), and the particles within as hardly moving and weakly held small-target dots. Bremsstrahlung photon emission is negligible for therapeutic proton beams. At intermediate energies (tens of MeV), the beam protons and secondary neutrons can knock out protons, neutrons, and alpha particles, and multiple scattering within the nucleus can occur. Even nuclear fission can be induced.
The cross sections for proton-proton scattering and nuclear reactions produced by the proton beam are much smaller than the electron-proton scattering cross sections, and even more so when the proton energy is much above the resonance region of the nuclear cross sections. However, when the protons are slowed into the lower MeV range, i.e. in front of the Bragg peak, nuclear scattering and transmutations occur with higher probability. Near the end of the beam-protons range, the nuclear reactions largely produce ‘compound’ nuclides, wherein the proton energy is shared among a number of nucleons in the nucleus before that nucleus decays. Excitation of collective motion of the nucleons is possible, producing ‘giant resonances’ in the cross sections.
The proton fluence drops with depth in the tissue because of these reactions. In addition, proton-proton scattering causes a spread of the beam. The radial spread has a standard deviation of about % of the beam range, causing a spread in dose delivery. Beam intensities can produce over Gy/min within the Bragg peak. Because protons at the far end of their range lose energy faster than at any other location, uncertainties in the range of the proton beam can cause a large uncertainty (estimated to be about % of the range [28]) in the dose delivery at the far end of the Bragg peak.
An indication of the relative importance of nuclear secondaries is the fraction of the initial proton energy that is apportioned to each kind of secondary. For inelastic nuclear interactions, using a Monte Carlo calculation, Seltzer [36] finds the following fractions for the reaction secondaries:
| beam proton | secondary particles | ||||||
|---|---|---|---|---|---|---|---|
| energy | recoils | ||||||
| MeV | |||||||
| MeV | |||||||
| MeV | |||||||
| MeV | |||||||
the remaining energy fraction going to elastic recoils and gamma rays. The emitted photons and the neutrons are likely to travel a distance much larger than the transverse dimension of the proton beam.
Table III.1 shows nonelastic nuclear reactions that can occur for O16 and O18 in tissue:
| Nuclear Reaction | MeV | Decay of N∗ | Half-life | MeV | MeV | ||
|---|---|---|---|---|---|---|---|
| sec | |||||||
| MeV | |||||||
| min | |||||||
| sec | |||||||
| min | |||||||
| min | |||||||
| sec | |||||||
| sec | |||||||
| min | |||||||
| sec | |||||||
| sec | |||||||
| msec | |||||||
| sec | |||||||
| sec | |||||||
The values in Table III.1, i.e. the energy released from mass, are given using atomic masses, not fully ionized isotopes. (See Appendix D. The values come from Wang et al., [39] as reported by [32].) Any of these reactions may involve the release of a gamma ray, but gammas are unlikely to ionize locally.
The production of tritium and helium-3 occurs at a much lower rate, as the nucleons in these products do not form tight clusters in heavier nuclei, and so these clusters are not as likely to be knocked out as a particle. Slow neutrons with tissue hydrogen will also make deuterium, but this will occur most often outside the target tissue. As the table shows, many of the daughter nuclei () after the ‘strong’ nuclear interaction are radioactive.
Note the striking difference in the reaction values between the list of O16 vs O18 reactions shown in Table III.1. Corresponding reactions of the proton with O18 show far less energy loss in the release of the reaction products. Two of the O18 reactions are strongly exoergic and these are among the largest in cross section, while for the proton-O16 reactions, only the direct capture is exoergic, but with only 600 keV released compared to almost MeV for O18. Overall, far more energy will be available for kinetic energy of ionizing particles in the case of than for . The root cause is the tighter binding of O16, being a doubly ‘magic’ nucleus, with the lowest lying nuclear states for neutrons and protons being fully occupied, and with an energy gap to the next level.
The reactions that produce radionuclides that are positron emitters may add MeV gamma emissions during a PET scan, indistinguishable from the F18 decay gammas. (See Appendix K.) Beside the ones listed above, there are other nuclear reactions in tissue that contribute to positron production. Important ones are shown in Table III.2.
| Nuclear Reaction | Decay of | Half-life | ||
|---|---|---|---|---|
| min | ||||
| min | ||||
| min | ||||
| min | ||||
| sec | ||||
| min | ||||
| min | ||||
| min | ||||
| min | ||||
| min | ||||
| min | ||||
| yrs | ||||
| yrs | ||||
| yrs | ||||
| hrs | ||||
| hrs | ||||
| hrs | ||||
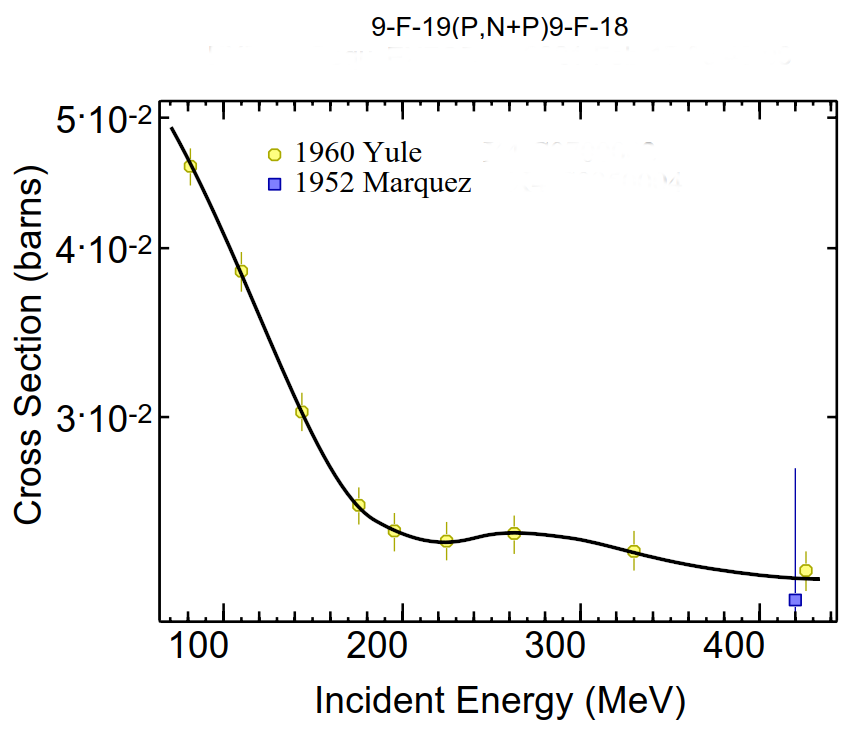
When a tumor is doped with O18, the reaction O18F18 will occur in PT therapy. The produced F18 half-life is min. If a PET scan occurs an hour or so past the PT therapy, -induced gamma emissions from the radionuclides in the above table will have died down except for the F18 produced from fluorine in the tissue, and from Na22. The concentration of natural sodium Na23 in tissue is low (% by atoms or ions/cm3), and Na22 has a long half-life (years), indicating that Na23 activity will be low compared to F18. The production of F18 from the fluorine in tissue would directly interfere with PET after PT with doped DNA. However, the concentration of fluorine in tissue is about atoms/cm3. As shown in Table A.5, the number density of F18 after a full PT is about to per cubic centimeter. Moreover, the cross section for F19F18 is about times lower than O18F18 (see Fig. 8). The reaction F19F18 contributes even less, since the neutron flux is lower than the proton beam flux. Thus, the PET signal from fully exposed thymine-18 should be far larger than that from the F18 produced by proton-converted naturally-occurring F19.
IV Cross section for O18 F18
The cross section for O18F18 is shown in the two graphs below.
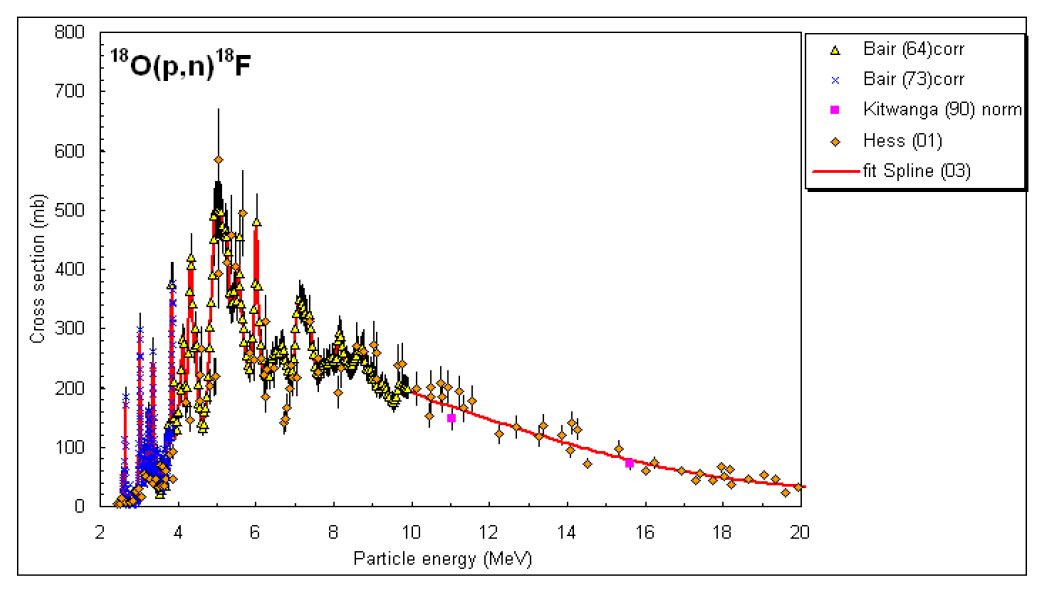
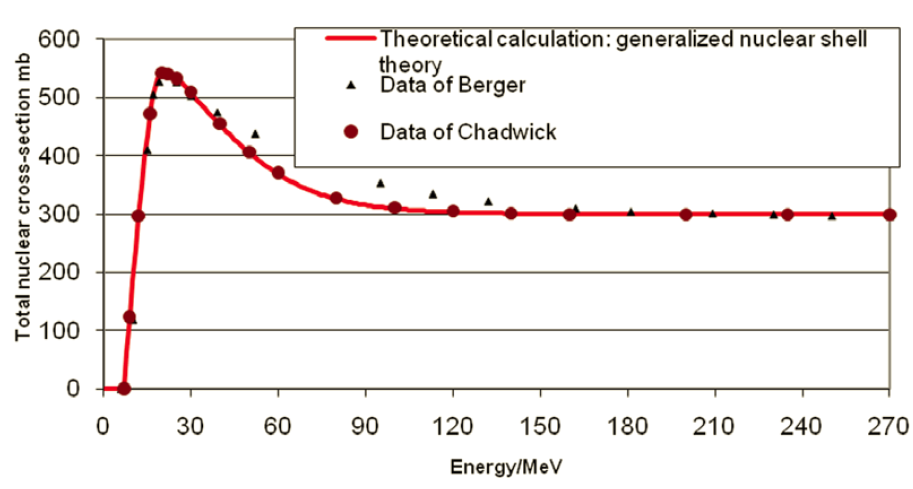
For comparison, Fig. 7 shows the total cross section for protons impinging on oxygen-16.
Among all the reactions shown in Table III.1, the cross section for O18F19 is large due to a number of resonances in the proton energy region of to MeV.
V Estimating the increase in dose with O18 substituted for 16O in DNA thymine
To estimate the increase in dose due to inelastic nuclear reactions with O18 instead of O16, one can first calculate the LET due to the reaction O18 and compare to O16. This is an integration over energy for each reaction cross section as a function of energy times an average energy given to charged-particles in that reaction times the number density of the reactant times the flux rate of the beam protons at the reaction location.
There are several important factors that must be considered:
-
•
The energy and flux of protons in the beam at the location of the reaction;
-
•
The cross section for the reactions O18;
-
•
The density of O18 in the exposed tissue;
-
•
The energies of the released charged particles.
The consequent LET per unit area per unit time per length along the beam has the general form:
| (6) |
where is the cross section for the reaction with reactant index and exiting particle at beam energy ; is the kinetic energy of a released charged particle labeled by and exiting into solid angle . The quantity is the number density of reactants in the tissue and is the number current density of protons in the beam, both at the location where the beam has energy . The expression Eq. (6) can be handled in a computer calculation, drawing on a database of reactions and cross sections, such as GEANT4 [1].
VI Summary
The substitution of O18 for O16 in tissue thymine causes a greater PT dose to be delivered to cancer cells, a conclusion one can draw from the fact that the important inelastic nuclear reactions with O16 are far more endoergic than the corresponding reactions with O18. The delayed beta decay of F18 adds more to the dose delivered, and makes it possible to know, within about a millimeter, where the delivery occurred, using PET. Given these facts, a full calculation of the numerical with O18 is justified.
Appendix A Some Relevant Data
Some selected physical masses are given in Table A.1 in daltons and energy units of MeV (with time units to make ). The column labeled ”Complete Ionization” comes from the CRC “Ionization energies of atoms and atomic ions” data [24], converted to eV. The values for the bare isotopes of O16, O18 and F18 are calculated from the complete ionization energy and the atomic mass-energy using
| (7) |
where is the number of protons in the nucleus and is the complete ionization energy of the atom (energy to remove all the atom’s electrons).
The daughter nucleus of oxygen-18 is created with an extra atomic electron close-by. As such, that electron will have an attractive Coulomb force acting on it. The extra electron will likely take energy from other atomic electrons as they all shuffle to new stable oxygen-18 orbitals, higher in energy than the fluorine-18 orbitals they initially occupied.
| Mass | Complete | ||
| (Daltons) | (MeV) | Ionization (eV) | |
| 1.072764667 | 938.272088 | ||
| 0.000548579909 | 0.51099895 | ||
| atom | |||
| (O16) | 15.99491461957 | 14899.1686 | 871.4101 |
| (O18) | 17.99915961286 | 16766.111 | 871.4101 |
| (F18) | 18.00093733 | 16767.767 | 1103.1176 |
| bare nucleus | |||
| O16 | 14895.0815 | ||
| O18 | 16672.0239 | ||
| F18 | 16763.1691 | ||
| 1 Dalton | = 931.49410242(28) | MeV |
In addition, the following facts are relevant:
The isotope O18 occurs naturally with a number ratio O18/O16 ([17]) that varies from to . The greater amount is in seawater due to slower evaporation of water containing O18 compared to O16. Thus, the percent of O18 in a patient depends on the diet of that patient. A vegetable diet would favor an atmospheric abundance in tissue about for O18/O16, while a dominance of sea food will make for O18/O16. The density of O16 in soft tissue is dominated by that in the tissue water. Specific element mass densities in tissue are given in Table A.4.
The F18 nucleus is a spin-parity system; the O18 nucleus is a spin-parity system. These mean that the weak decay proceeds via an allowed Gamov-Teller transition, with the transition probability proportional to the magnitude square of the nuclear transition matrix element, a sum over all the nucleons, giving
with the nucleon spin operator , lepton spin operator and the nucleon isospin lowering operator . The symbol labels individual nucleons in the nucleus. The are lepton spin states. After summing over the unobserved spin states of the leptons, the transition probability is proportional to
where a vector dot-product is implied between the two matrix-element factors. We see that this beta decay will change a proton into a neutron, and, given the spin-parity of O18 and F18, will flip its spin.
The lifetime of F18 is min, % by positron emission, % by electron capture. Other positron emitters that can be used in PET scans are shown in Table A.2. Kmax and Kmean refer to the positron kinetic energy maximum and mean. Rmax and Rmean are ranges of the positron. Of those shown, F18 has the best combination of half-life and positron range for PET scan application.
| Isotope | Half-life | Branching () | Kmax (MeV) | Kmean (MeV) | Rmax (mm) | R mean (mm) |
|---|---|---|---|---|---|---|
| C | 20.4 min | 99.8 % | 0.960 | 0.386 | 4.2 | 1.2 |
| N | 10.0 min | 99.8 % | 1.199 | 0.492 | 5.5 | 1.8 |
| O | 2 min | 99.9 % | 1.732 | 0.735 | 8.4 | 3.0 |
| F | 110 min | 96.9 % | 0.634 | 0.250 | 2.4 | 0.6 |
| Cu | 12.7 h | 17.5 % | 0.653 | 0.278 | 2.5 | 0.7 |
| Zr | 78.4 h | 22.7 % | 0.902 | 0.396 | 3.8 | 1.3 |
Table A.3 shows the most important positron emitters created by a proton beam in tissue.
| Reaction | Threshold energy | Half-life | Positron energy |
|---|---|---|---|
| MeV | min | MeV | |
| (p,pn)15O | 16.79 | 2.037 | 1.72 |
| (p,)N | 5.66 | 9.965 | 1.19 |
| N(p,pn)13N | 11.44 | 9.965 | 1.19 |
| C(p,pn)11C | 20.61 | 20.390 | 0.96 |
| N(p,)C | 3.22 | 20.390 | 0.96 |
| O(p,pn)11C | 59.64 | 20.390 | 0.96 |
| Material | [g/cm3] | H | C | N | O | Ca | P | I [eV] |
|---|---|---|---|---|---|---|---|---|
| Lung deflated | 0.26 | 10.4 | 10.6 | 3.1 | 75.7 | 0 | 0.2 | 74.54 |
| Yellow marrow | 0.98 | 11.5 | 64.6 | 0.7 | 23.2 | 0 | 0 | 63.72 |
| Mammary gland1 | 0.99 | 10.9 | 50.8 | 2.3 | 35.9 | 0 | 0.1 | 66.73 |
| Mammary gland2 | 1.02 | 10.6 | 33.3 | 3 | 52.9 | 0 | 0.1 | 70.05 |
| Mammary gland3 | 1.06 | 10.2 | 15.9 | 3.7 | 70.1 | 0 | 0.1 | 73.78 |
| Red marrow | 1.03 | 10.6 | 41.7 | 3.4 | 44.2 | 0 | 0.1 | 68.7 |
| Brain Cerebrospinal fluid | 1.01 | 11.2 | 0 | 0 | 88.8 | 0 | 0 | 75.3 |
| Adrenal gland | 1.03 | 10.7 | 28.5 | 2.6 | 58.1 | 0 | 0.1 | 70.92 |
| Smallintestine wall | 1.03 | 10.7 | 11.6 | 2.2 | 75.5 | 0 | 0.1 | 73.98 |
| Urine | 1.02 | 11.1 | 0.5 | 1 | 87.2 | 0 | 0.1 | 75.21 |
| Gall bladder bile | 1.03 | 10.9 | 6.1 | 0.1 | 82.9 | 0 | 0 | 74.81 |
| Lymph | 1.03 | 10.9 | 4.1 | 1.1 | 83.9 | 0 | 0 | 75 |
| Pancreas | 1.04 | 10.7 | 17 | 2.2 | 69.9 | 0 | 0.2 | 73 |
| Brain white matter | 1.04 | 10.7 | 19.6 | 2.5 | 66.8 | 0 | 0.4 | 72.5 |
| Prostate | 1.04 | 10.6 | 9 | 2.5 | 77.9 | 0 | 0.1 | 74.58 |
| Testis | 1.04 | 10.7 | 10 | 2 | 77.2 | 0 | 0.1 | 74.23 |
| Brain gray matter | 1.04 | 10.8 | 9.6 | 1.8 | 77.5 | 0 | 0.3 | 74.17 |
| Muscle skeletal1 | 1.05 | 10.2 | 17.3 | 3.6 | 68.7 | 0 | 0.2 | 73.69 |
| Muscle skeletal2 | 1.05 | 10.3 | 14.4 | 3.4 | 71.6 | 0 | 0.2 | 74.03 |
| Muscle skeletal3 | 1.05 | 10.3 | 11.3 | 3 | 75.2 | 0 | 0.2 | 74.66 |
| Heart1 | 1.05 | 10.4 | 17.6 | 3.1 | 68.6 | 0 | 0.2 | 73.32 |
| Heart2 | 1.05 | 10.5 | 14 | 2.9 | 72.4 | 0 | 0.2 | 73.8 |
| Heart3 | 1.05 | 10.5 | 10.4 | 2.7 | 76.2 | 0 | 0.2 | 74.49 |
| Heart blood filled | 1.06 | 10.4 | 12.2 | 3.2 | 74.1 | 0 | 0.1 | 74.22 |
| Blood whole | 1.06 | 10.3 | 11.1 | 3.3 | 75.2 | 0 | 0.1 | 74.61 |
| Kidney1 | 1.05 | 10.3 | 16.1 | 3.4 | 69.9 | 0.1 | 0.2 | 73.79 |
| Kidney2 | 1.05 | 10.4 | 13.3 | 3 | 73 | 0.1 | 0.2 | 74.16 |
| Kidney3 | 1.05 | 10.5 | 10.7 | 2.7 | 75.8 | 0.1 | 0.2 | 74.48 |
| Stomach | 1.05 | 10.5 | 14 | 2.9 | 72.5 | 0 | 0.1 | 73.81 |
| Thyroid | 1.05 | 10.5 | 12 | 2.4 | 75 | 0 | 0.1 | 74.24 |
| Liver1 | 1.05 | 10.4 | 15.8 | 2.7 | 70.8 | 0 | 0.3 | 73.72 |
| Liver2 | 1.06 | 10.3 | 14 | 3 | 72.3 | 0 | 0.3 | 74.18 |
| Liver3 | 1.07 | 10.2 | 12.7 | 3.3 | 73.4 | 0 | 0.3 | 74.58 |
| Aorta | 1.05 | 10 | 14.8 | 4.2 | 70.2 | 0.4 | 0.4 | 74.78 |
| Ovary | 1.05 | 10.6 | 9.4 | 2.4 | 77.4 | 0 | 0.2 | 74.52 |
| Eye lens | 1.07 | 9.6 | 19.6 | 5.7 | 64.9 | 0 | 0.1 | 73.97 |
| Spleen | 1.06 | 10.4 | 11.4 | 3.2 | 74.7 | 0 | 0.3 | 74.47 |
| Trachea | 1.06 | 10.2 | 14 | 3.3 | 72 | 0 | 0.4 | 74.38 |
| Skin1 | 1.09 | 10.1 | 25.2 | 4.6 | 59.9 | 0 | 0.1 | 72.25 |
| Skin2 | 1.09 | 10.1 | 20.6 | 4.2 | 65 | 0 | 0.1 | 73.17 |
| Skin3 | 1.09 | 10.2 | 15.9 | 3.7 | 70.1 | 0 | 0.1 | 73.89 |
| Connective tissue | 1.12 | 9.5 | 21 | 6.3 | 63.1 | 0 | 0 | 73.79 |
| Cartilage | 1.1 | 9.8 | 10.1 | 2.2 | 75.7 | 0 | 2.2 | 76.96 |
| Sternum | 1.25 | 7.8 | 31.8 | 3.7 | 44.1 | 8.6 | 4 | 81.97 |
| Sacrummale | 1.29 | 7.4 | 30.4 | 3.7 | 44.1 | 9.9 | 4.5 | 84.19 |
| Femur conical trochanter | 1.36 | 6.9 | 36.7 | 2.7 | 34.8 | 12.9 | 5.9 | 86.69 |
| Sacrum female | 1.39 | 6.6 | 27.3 | 3.8 | 43.8 | 12.6 | 5.8 | 89.11 |
| Humerus whole specimen | 1.39 | 6.7 | 35.3 | 2.8 | 35.3 | 13.6 | 6.2 | 88.06 |
| Ribs 2nd to 6th | 1.41 | 6.4 | 26.5 | 3.9 | 43.9 | 13.2 | 6 | 90.28 |
| Vert colC4 excl cartilage | 1.42 | 6.3 | 26.3 | 3.9 | 43.9 | 13.4 | 6.1 | 90.78 |
| Femur total bone | 1.42 | 6.3 | 33.4 | 2.9 | 36.3 | 14.4 | 6.6 | 90.24 |
| Femur whole specism | 1.43 | 6.3 | 33.2 | 2.9 | 36.4 | 14.5 | 6.6 | 90.34 |
| Innominate female | 1.46 | 6 | 25.2 | 3.9 | 43.8 | 14.4 | 6.6 | 92.76 |
| Humerus total bone | 1.46 | 6 | 31.5 | 3.1 | 37 | 15.3 | 7 | 92.23 |
| Clavicle scapula | 1.46 | 6 | 31.4 | 3.1 | 37.1 | 15.3 | 7 | 92.26 |
| Humerus cylindrical shaft | 1.49 | 5.8 | 30.3 | 3.2 | 37.6 | 15.9 | 7.2 | 93.56 |
| Ribs10th | 1.52 | 5.6 | 23.7 | 4 | 43.7 | 15.7 | 7.3 | 95.42 |
| Cranium | 1.61 | 5 | 21.3 | 4 | 43.8 | 17.7 | 8.1 | 99.69 |
| Mandible | 1.68 | 4.6 | 20 | 4.1 | 43.8 | 18.8 | 8.7 | 102.35 |
| Femur cylindrical shaft | 1.75 | 4.2 | 20.5 | 3.8 | 41.8 | 20.3 | 9.4 | 105.13 |
| Cortical bone | 1.92 | 3.4 | 15.6 | 4.2 | 43.8 | 22.6 | 10.4 | 111.63 |
| Mass of DNA | male 6.41 pgram, female 6.51 pgram | |
| Todal DNA length | male: 205.0 cm, female 208.23 cm | |
| Total base pairs | male: 6.27, female 6.37 | |
| A-T base pairs in DNA | % | |
| Thymines in one cell | ||
| Cell diameter/nucleus diameter | ||
| Tissue cell number density | 1 to 3 billion cells per cm3 | |
| Density of thymine in tissue | 4 to 12 per cm3 | |
| Density of O18 in dopped tissue | 4 to 12 per cm3 | |
| Cross section each O18 | barn cm2 | |
| Extinction length | cm |
Appendix B Maximum energy loss of a proton scattering from an electron and the largest scattering angle
The proton beam loses energy traversing tissue largely by Coulomb interactions with material electrons. Consider the Coulomb scattering of a relativistic proton with electrons in tissue. As electrons bound to atoms and molecules have energies much lower than the initial protons in a proton beam, they will recoil much like free electrons until the beam proton energies are much below MeV. In this quasi-free region (ahead of the Bragg peak), the upper limit to the scattered electron’s energy is determined by energy-momentum conservation. Denote the energy and momentum of the initial and final particles as and the mass of the proton as .
B.1 Maximum delta-electron energy
We will find the maximum electron energy after a collision with a beam proton. Label the incoming particles with the indices , and outgoing particles . We will distinguish the electron magnitude of its 3-mommentum with the symbol .
Conservation of energy and momentum reads
| (8) | |||||
| (9) |
The electron receives its greatest energy for head-on collisions. In the ‘Lab’ frame, . We will use for the electron. Then
| (10) |
and
| (11) |
Solving for , and dropping the solution, we have
| (12) |
There follows the maximum electron total energy
| (13) | |||||
| (14) |
The maximum energy loss of a proton by electron scattering will by the maximum electron kinetic energy given to the electron. For MeV incoming protons, Eq. (14) gives
| (15) |
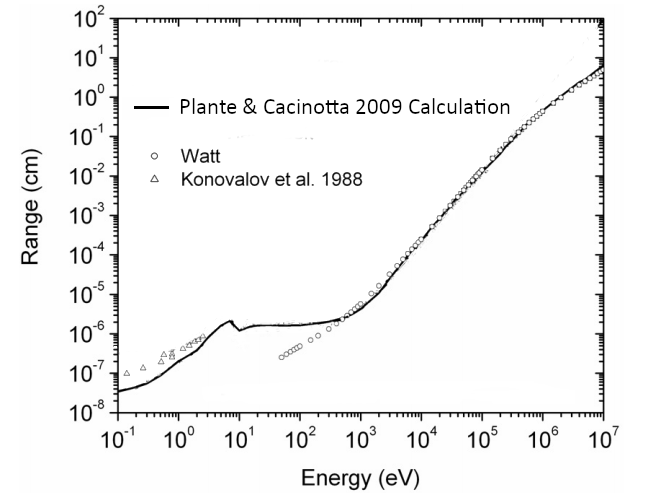
The range of such electrons is about mm (see the graph in Fig. 9 which was presented by Plante and Cucinotta, [31]). Most delta electrons will have kinetic energy much less than , and so a shorter range, making their excursion from the proton beam track measurable in the tenths of a millimeter.
B.2 Maximum beam proton deflection in scattering by electrons
Now let’s find the maximum proton deflection angle, by one collision with an electron. We have, from energy-momentum conservation
| (16) | |||||
| (17) |
so
| (18) | |||||
| (19) |
| (20) | |||||
| (21) | |||||
| (22) |
Thus
| (23) |
This cosine function is () when there is no scattering () or at
| (24) |
with scattering. It drops below one as increases.
As an aside, if (as for proton-proton scattering), or the cosine function drops to zero at
| (25) |
If , rises back to one at a finite electron kinetic energy given by
| (26) | |||||
| (27) |
We can find the energy where the greatest deflection occurs by finding where the slope of vanishes with changing Setting
| (28) |
or
| (29) |
which gives
| (30) |
so the kinetic energy of the electrons when is maximum as
| (31) | |||||
| (32) | |||||
| (33) |
For an MeV beam, this is
| (34) | |||||
| (35) |
Inserting from Eq. (30) in the formula Eq. (23) for gives a remarkably simple result, and one that does not depend on the proton beam energy:
| (36) | |||||
| (37) | |||||
| (38) |
Each time a beam proton interacts with a medium electron, the proton cannot be deflected more than degrees.
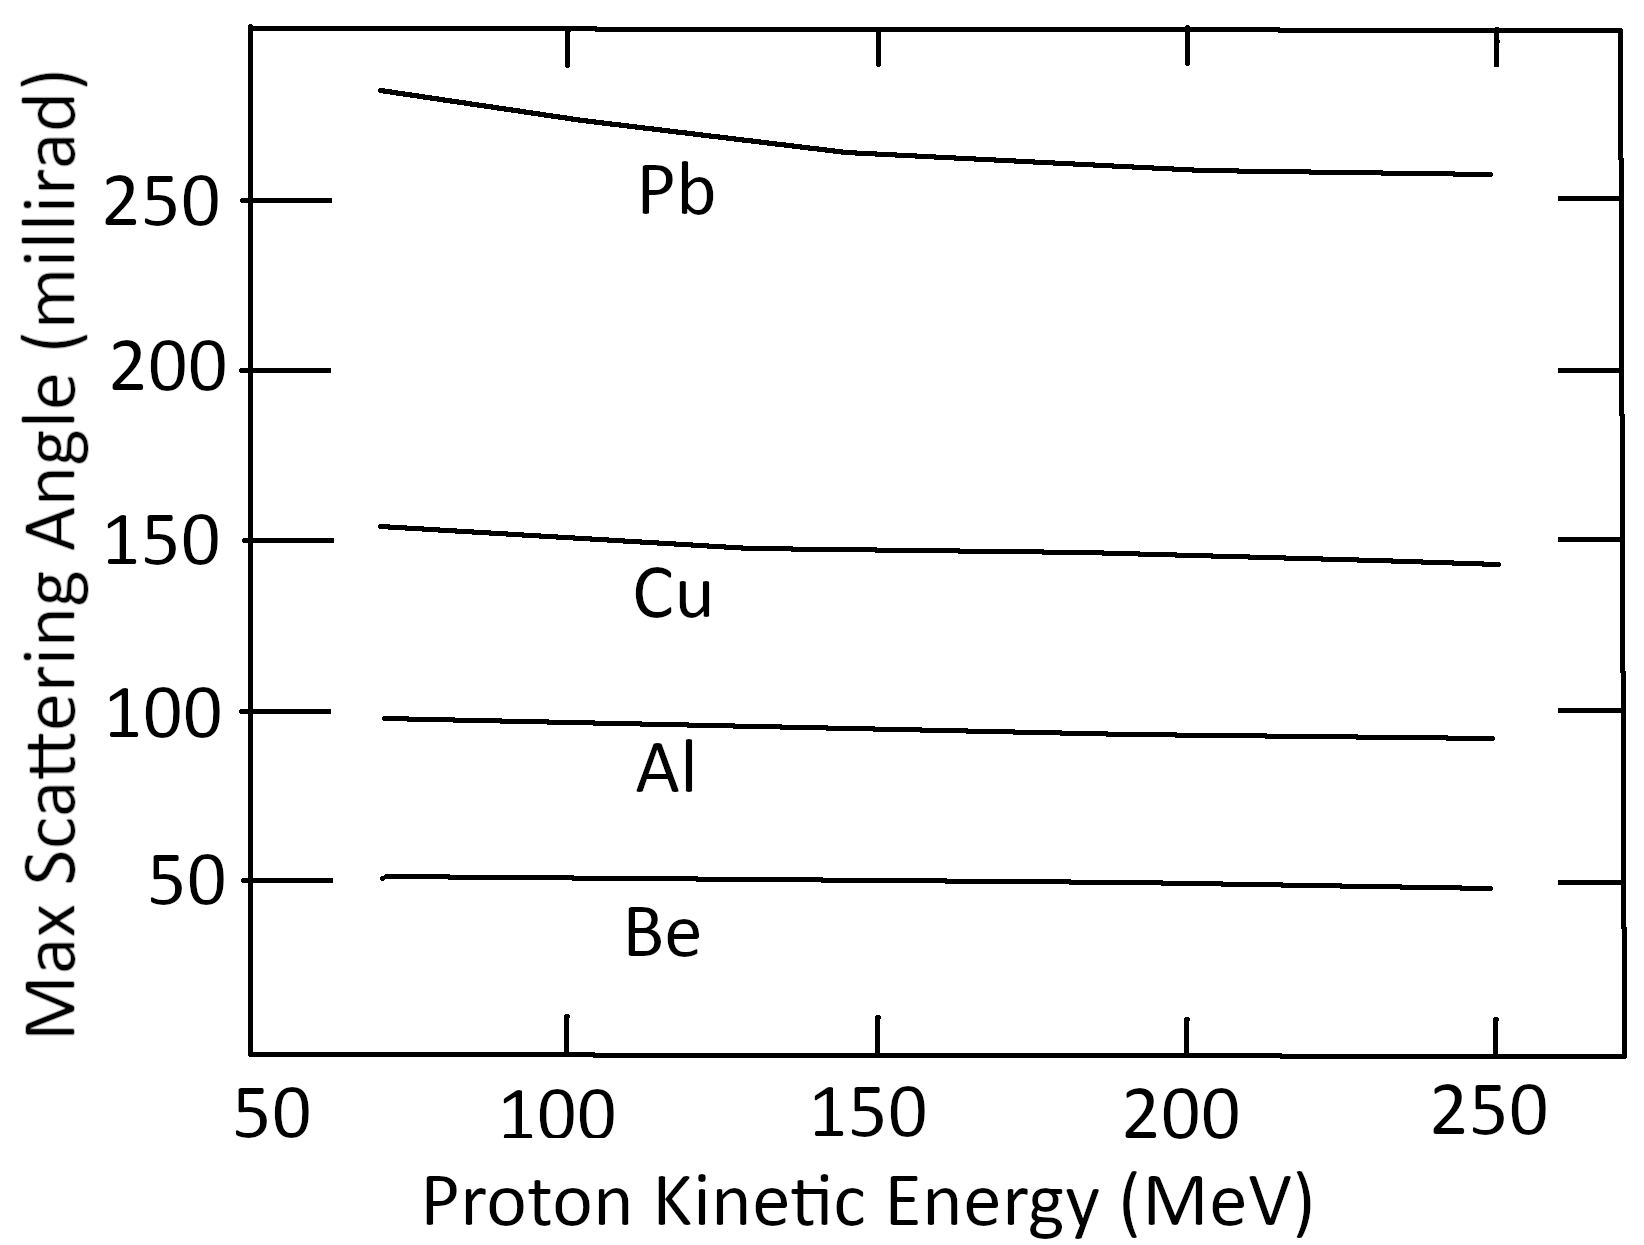
The experimental independence of the maximum scattering angle with beam proton energy was noted by Andy Koehler as reported by Bernard Gottschalk as a ‘curious fact’ in his lecture series [14] and depicted as Fig. 10. We now see that the energy independence of the maximum scattering angle (even after several scatterings) follows from kinematics.
Appendix C Energy and momentum of emitted particles after a particle beta-decay
To simplify indices, we will use here (0,1,2,3) for the parent, daughter, beta, and neutrino. A notation on top of an energy or momentum symbol indicates a frame of reference. Zero will be used for the frame in which the parent nucleus is at rest. (This is ‘the center of momentum (cm) frame’.)
Energy-momentum conservation gives (for the 4-vectors)
| (39) |
In the rest frame of the parent particle, the three vector-momenta must lie in a plane. The orientation of this plane determines two of the independent kinematic variables measurable in the reaction. Orientation of one of the outgoing momenta along some axis in the cm-reaction plane determines another. Momentum conservation means one of the three momenta can be written in terms of the other two. Energy conservation gives the magnitude of one of the outgoing momenta in terms of the other two. Of the nine variables in the three momenta, the constraints mention leaves 9-2-1-3-1=2 variables not determined by kinematics. These two might be taken as the angle between particles (1,2) and the energy of particle 2. A more universal choice, a choice that does not depend on a selection of reference frame, is to use kinematical variables that are relativistic invariants. These are often taken as a pair of Mandelstam variables, defined by
| (40) | |||||
| (41) | |||||
| (42) |
These three are not independent of each other, as can be seen from
| (43) |
To preserve symmetry among the three variables in the plot of the kinematically allowed values of Dalitz first plotted the possible values of in three dimensions. The constraint Eq. (43) forces the values to lie in a plane oriented with a normal having positive values on each axis. This plane cuts the (1,2), (2,3), and (3,1) axis-planes, producing a triangular surface. The Dalitz plot is made on that surface. The density of values as points within the triangle are made proportional to the physical probabilities for detecting particles produced with the kinematics of the point.
Now the question arises: What are the kinematical limits within the Dalitz triangle, or, equivalently, what are the limits on the measured values of momentum and energy of the outgoing particles. Such physical limits come from the constraints that the kinetic energies of the particles cannot be negative (), and that the angles between the momenta of the outgoing particles must be physical ().
To get an upper limit on , we note that in the frame of reference of the parent particle, becomes
| (44) |
But
| (45) |
giving
| (46) |
From we have
| (47) |
To get a lower limit on pick the rest frame for the pair of particles (2,3) (the ‘Jackson’ frame), so that
| (48) |
Then
| (49) |
So, for physically realizable energies, (by cyclically permuting of indices)
| (50) |
| (51) |
| (52) |
When angular constraints are imposed, the s may not be allowed to reach the above limits. In the ‘Jackson’ frame for particles 2 and 3’, in which the momentum of particles 2 and 3 satisfy . Furthermore:
| (53) | |||||
| (54) | |||||
| (55) | |||||
| (56) | |||||
| (57) |
As a result,
| (58) |
Now from
| (59) | |||||
| (60) |
we can solve for the momentum squared of particle 2 in the Jackson frame gives
| (61) |
which is also the momentum squared for particle 3 in the Jackson frame. We now consider
| (62) | |||||
| (63) | |||||
| (64) |
Since, as we have shown, and can be expressed in terms of (without ), for fixed , we have
| (65) |
with the lower limit in the case in which is in the same direction as and the upper limit in the case in which is in the opposite direction as . These limits determine the boundary in the Dalitz plot in the plane.
To get the maximum energy in the frame in which the parent particle is at rest (center-of-momentum frame), we note that
| (66) |
implies that is determined by just one of the two independent Mandelstam variables, and that reaches a maximum when is a minimum. Solving for we have
| (67) |
Using the min of above,
| (68) |
It follows that
| (69) | |||||
| (70) |
By cyclic permutation,
| (71) |
and
| (72) |
Appendix D Reaction ‘Q’ values and threshold energy in laboratory frame
Consider the reaction
| (73) |
where is particle labeled by index .
The “Q” value for this reaction is defined to be the energy released because of mass differences before and after the reaction:
| (74) |
the sum taken over the produced (final) particles.
To find the threshold energy of particle in the “lab” frame (where ), consider the Mandelstam variable , the total energy squared in the center-of-momentum frame of reference. From energy-momentum conservation, (sum is over final particles), so we see that . Expressed in the laboratory frame variables, . Thus
| (75) |
making the threshold kinetic energy of the incoming particle satisfy
| (76) |
In terms of ,
| (77) |
where now the sum is over all particles, in and out. If the reaction is exoergic, and then . If endoergic, , the threshold kinetic energy for the incoming particle will be greater than zero, as given above.
Appendix E Maximum energy of the recoiling O18 after beta decay of F18
The maximum oxygen recoil kinetic energy, from Eq. (68),
| (78) | |||||
| (79) | |||||
| (80) | |||||
| (81) |
The energy needed to cause a double-strand break in DNA is about eV, so the recoil kinetic energy of the O18 is sufficient to break both strands of its DNA, but this breakage depends on the O18 recoil direction. The electron, on the other hand, carries, on average, about keV, which can leave a trail of ions by scattering from molecular electrons along its path. For F18, the path is relatively short (average mm in soft tissue (see Table A.2)).
Appendix F Fate of the positron after the beta decay of F18
As shown above, in the particle-decay reaction , the maximum recoil energy of the particle after the parent decays can be found from energy and momentum conservation, giving
| (82) |
For F18 decay, the positron maximum total energy and kinetic energy are therefore
| (83) | |||||
| (84) | |||||
| (85) |
agrees with the experimental number MeV, given in Table A.2.
The positron energy is typically more than 200 times greater than the highest ionization energy of atoms and molecules in tissue (see Table A.4). As the fast-moving positron (starting at of the speed of light) travels through tissue, it inelastically scatters from bound electrons and nuclei and slows down. Since the positron-electron cross section depends inversely on the center-of-mass energy squared, the positron loses most of its energy in tissue at the end of its track, just as ions beams do. We should expect the emitted positron to scatter among the nearby molecular charges, leading to molecular excitations, ionizations, and photons, before slowing to thermal energies. It can then be directly annihilated or captured by an electron. In water at C, the positron has about a % chance of undergoing direct annihilation ([9]). If captured, positronium forms, either in a spin single state (ortho) or triplet state (para). With no preferred direction of the positron spin, % will be ortho-positronium, although interaction with nearby molecules can flip one of the spins. If the positronium is created in an excited state with angular momentum, it will release UV and visible-light photons with discrete energies half those of atomic hydrogen, until the pair reach an state (no angular momentum). At that point they annihilate each other. If the positronium is in a singlet spin state, the annihilation has a lifetime of ns and almost always two MeV photons are emitted in opposite directions. The spin triple state annihilates with a lifetime of ns, with almost always the emission of three gamma rays.
Appendix G Threshold behavior of nuclear reaction cross sections
In 1948, Eugene Wigner showed ([40]) that under quite general circumstances, the low energy threshold behavior of nuclear-reaction cross-sections have a definite dependence on the relative momentum between the two incoming particles, given by
| for (+)(+) or (-)(-) charges | (86) | ||||
| (87) |
where is the reduced mass of the two particles, having charge numbers and , respectively, is the speed of light, and is the fine-structure constant. A nuclear particle with a positive charge sent toward another one will be inhibited from merging because of the Coulomb repulsive force acting. The effect is expressed by the exponential factor in Eq. (86), used by George Gamow in 1928 to explain alpha-particle decay of nuclei, and is now called the Gamow factor.
Gamow realized [13] that if two particles are in a bound state held together by a strong short-range nuclear force and repelled by a Coulomb force, they may still escape from each other by ‘tunneling’ through the potential barrier created by the two forces. With this quantum idea, he was able to explain the wide range of lifetimes of alpha-particle decay of radioactive nuclei.
Inversely, the probability of two nuclear particles, with masses , and charges , , approaching each other and then overcome the Coulomb repulsion, is:
| (88) |
where is their total kinetic energy, , with the speed of light, (i.e. the reduced mass) and (the fine-structure constant). Note that as the kinetic energy goes to zero, the probability of penetration goes to zero. Eq. (88) is a non-relativistic expression. Yoon and Wong [42] have given the relativistic form for the Gamow factor.
By factoring out the strongly energy dependent factors and from the cross section, the remaining ‘astrophysical factor ’ will have a more gentle low-energy behavior:
| (89) |
The is proportional to the nuclear transition probability, so it contains all the nuclear physics of the process. Apart from nuclear resonances, one finds that is quite flat for in the eV to keV range.
Appendix H Proton energy at given penetration depth
As protons from a PT beam enters tissue, a variety of mechanisms of interaction cause the protons to lose kinetic energy , and to reduce their number (dropping beam fluence). The ionization of molecular electrons dominates, particularly above a few MeV. The inelastic collision with nuclei, although important because of the creation of nuclear fragments and because such collisions spread the beam, contributes only a small fraction to the proton energy-loss because of the small cross sections of nuclei. The energy loss of the ions in transversing through uniform tissue of a given short length (Linear Energy Transfer, LET) follows closely to the Bethe-Bloch relation, with corrections, shown in Eq. (90): (See Bethe, [3],Fano, [12], Ziegler, [45].)
| (90) |
Here, is the material electron density, the number of charges on the beam ion, the electron mass, the average ionization energy in the material, and is the velocity of the beam ions divided by the speed of light. The term is a material electron density correction due to polarization of surround material as a relativistic ion passes, whose electric field spreads perpendicular to the ions velocity and shrinks parallel to that velocity for larger speeds. The term is a “shell” correction needed when the beam particle slows to speed comparable to the speed of the bound electrons in the tissue molecules. For protons in energy range MeV to MeV, the shell correction can be as much as 6% [45]. In the derivation of Eq. (90), the discrete nature of protons interacting with a medium is smoothed (“Continuous Slow-Down Approximation”, or CSDA for short), since, for most of its interaction with electrons, small effects rapidly occurring take place. These days, the discrete events can be handled by Monte Carlo methods (e.g., using the GEANT4 code [8], [1], [2]). However, analytic tools involving continuous changes often can quite accurately account for discrete processes and many times the analytic arguments are simpler to understand and handle.
To integrate the LET relation, we can use the relativistic connection between the kinetic energy and velocity of the protons. We have, in units with and with the mass of the proton,
| (91) |
and, inversely
| (92) |
from which we can connect to , facilitating the integration needed in Eq. (90) to find , which is an implicit solution for . The connection is
| (93) |
When the proton speed becomes very small (), we can use , so that we can see that the large value of the LET (causing the “Bragg peak”) comes from the first term with the inverse of factor. This term generates an infinite peak for zero proton speed. However, we should not expect the Bethe formula to work when the protons have slowed to below the average ionization energy , which is typically found under eV (see Table A.4). At proton kinetic energy of eV, . In turn, this value for is far above the thermal energy at body temperature Kelvin, which is . If we take eV, then the proton speed that makes Bethe’s become negative is which is below the range of validity of the formula.
To simplify integrating, one can use , so an expansion of the second term in powers of is justified:
| (94) |
For an initial proton energy of MeV, , , while . The terms beyond the have an even smaller contribution, and can be dropped.
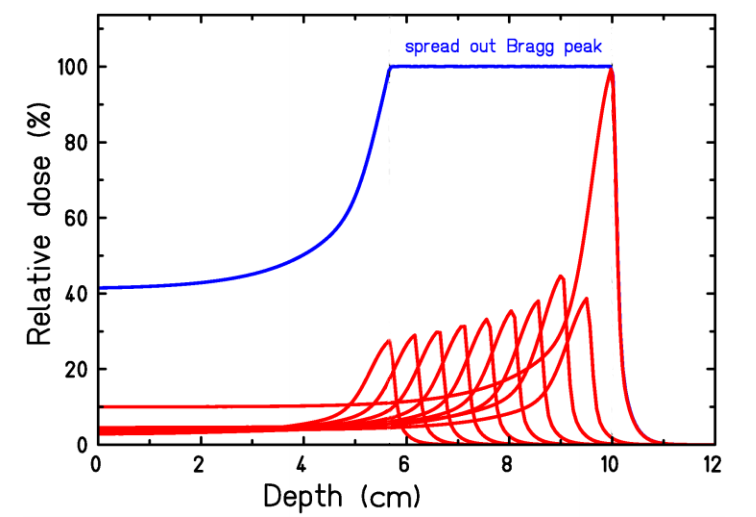
The proton beam Bragg peak is shown in Figure 11. By including a set of different initial proton energies in the incoming beam, the different ranges of the Bragg peaks can be made to produce a spread out Bragg peak (SOBP), designed to cover the width of a tumor. To reduce exposure of healthy tissue in front of the tumor for a given dose to the tumor and to work around structures needing avoidance, the beam angle can be rotated to a set of angles.
The dose delivered along the proton beam path is well represented by Bortfield’s analytic expression derived from the Bethe-Block relation: (Bortfeld, [5, eq.26], Newhauser and Zhang, [27, eq.38])
| (95) |
where is the depth, is the primary fluence, is the range of the proton beam, is the standard deviation of the Gaussian spread of the proton depth, is the fraction of low-energy proton fluence to the total proton fluence, and is the parabolic cylinder function. The values of the material-dependent constants, and , are found by fitting them using the classical LET Bragg-Kleeman (1905) formula:
| (96) |
to experiment. Of course, the Bragg-Kleeman formula is far simpler than the Bethe-Bloch result, but it still works surprisingly well. (The fitted constant is . If , then the parabolic cylinder functions in Eq. (95) become a Gaussian times a Hermite polynomial.) The parameters fitted by Bortfeld for a water target are given in Table H.1. The standard deviation of the range spectrum for an almost mono-energetic beam is denoted and the standard deviation of the almost Gaussian part of the energy-spectrum at its peak is given by . These make up the full standard deviation of the range spectrum through
| (97) |
| Value | Units | |
| 0.565 | 1 | |
| cm/MeV1/q | ||
| cm-1 | ||
| 0.6 | 1 | |
| cm | ||
| cm | ||
| cmq-1/2 | ||
| MeV | ||
| 1 |
An even better fit to the classical LET (Eq. (96)) is a generalization to relativistic energies (see Ulmer and Matsinos, [38]), taking a classical slow-down due to a frictional drag (‘damping’) proportional to the protons momentum along the beam axis to an inverse power:
| (98) |
where is the relativistic proper-time . Integrating Eq. (98) once gives
| (99) |
where is the initial proton beam momentum and is the proper time to stop the protons in the tissue. We can integrate Eq. (99), to get the proton distance in the tissue in terms of the proper time to reach that distance, i.e.
| (100) |
where is the range of the proton. Now with Eq. (99) and (100) we can express the momentum of the beam proton in terms of its distance of travel through the tissue:
| (101) |
As a result, the kinetic energy of a beam proton follows
| (102) |
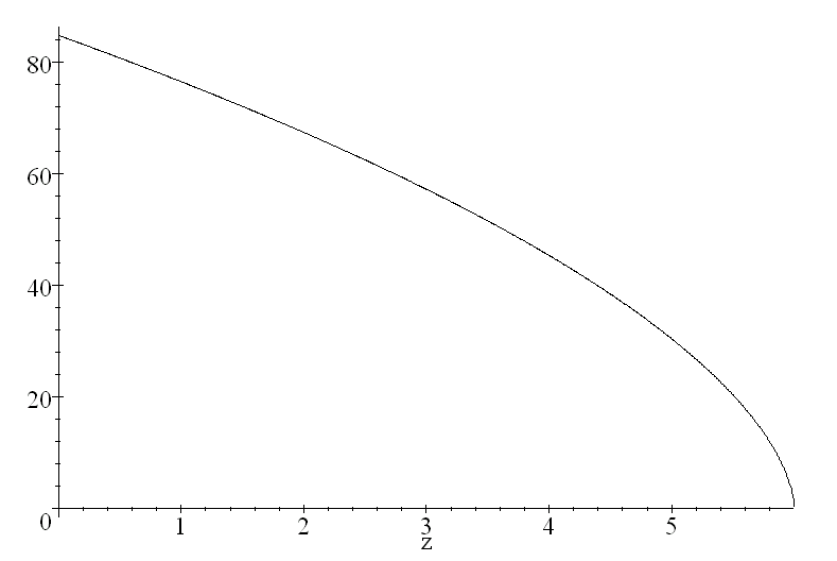
Figure 12 shows how this energy behaves with the choice MeV (MeV/c), cm, and (This coming from a fit of performed by Ulmer and Matsinos, [38].)
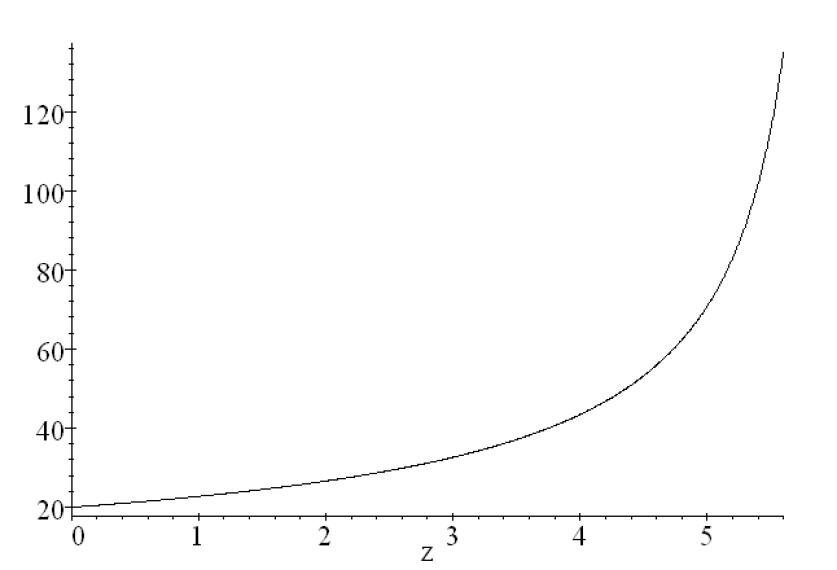
With Eq. (102), the LET of the proton as a function of penetration distance is found to be:
| (103) |
Figure 13 shows the corresponding slope , and exhibits the Bragg peak.
The O18 to F18 reaction occurs predominantly when MeV. We can find how far ahead of the Bragg peak F81’s are produced by using Eq. (102). With MeV, the location for the O18F18 nuclear reaction is greatest at about mm ahead of a pristine Bragg peak set at cm, i.e. so the lead distance is of .
Appendix I Chance of beam protons hitting tissue nuclei
The interaction of a proton beam passing into a material due to scattering from material electrons and nuclei is clearly an important topic for therapeutic proton beams. Besides the energy loss with penetration distance (as described in Sec. H), the beam is spread by multiple scattering. A successful and widely used model describing the spreading and multiple scattering of the beam began with the work of Moliere, [26]. The model gives the particle beam distribution as a function of the angle away from the initial beam direction. Hans Bethe [4] simplified the derivation. Further refinements have been applied since 1953, including models for the relevant cross sections. These models can be compared to brute force Monte Carlo calculations, which can incorporate all the physics describing a beam particle multiply scattering through even an inhomogeneous material. For a review of such models, see Gottschalk [15]. Since the Monte Carlo calculations take much longer run times than current good models, proton beam planning typically uses such models.
Chance for a single proton to make a given number of hits to distributed nuclei
We want to estimate the probability that a proton in passing through a given thickness of tissue will undergo a number of nuclear-scattering events. Let be the number density of nuclei in the tissue and the thickness through which the protons pass. Then the areal density of scatterers will be Let be the area that the beam covers and be the nuclear scattering cross-section. From a beam-proton’s perspective, if the areas around each nucleus the size of their cross sections do not overlap, then the probability of a proton hitting within one of the scattering-center areas is a ratio of all the center areas to the total area covered by the proton beam, i.e. (In the frame of relativistic beam protons, the thickness measures contracted, by a factor , so the scattering-center areas act as if they were all in a thin plane.)
With a thick target, there will be a good chance that several nuclear-cross sections overlap when viewed from the beam-proton frame of reference. To estimate the overlaps, let represent the average area which covers one atom in the tissue (‘atomic areas’). Divide that area into ‘nuclear areas’. This number we expect to be quite large, as nuclear cross-sections are usually less than a barn (cm) while the atoms in tissue are most often separated by to Ångstroms, making of the order or larger. The number of scattering nuclei behind one atomic area will be With a fluence of protons/cmÅngstrom2, the number of protons passing through an atomic area at any given time is quite small.
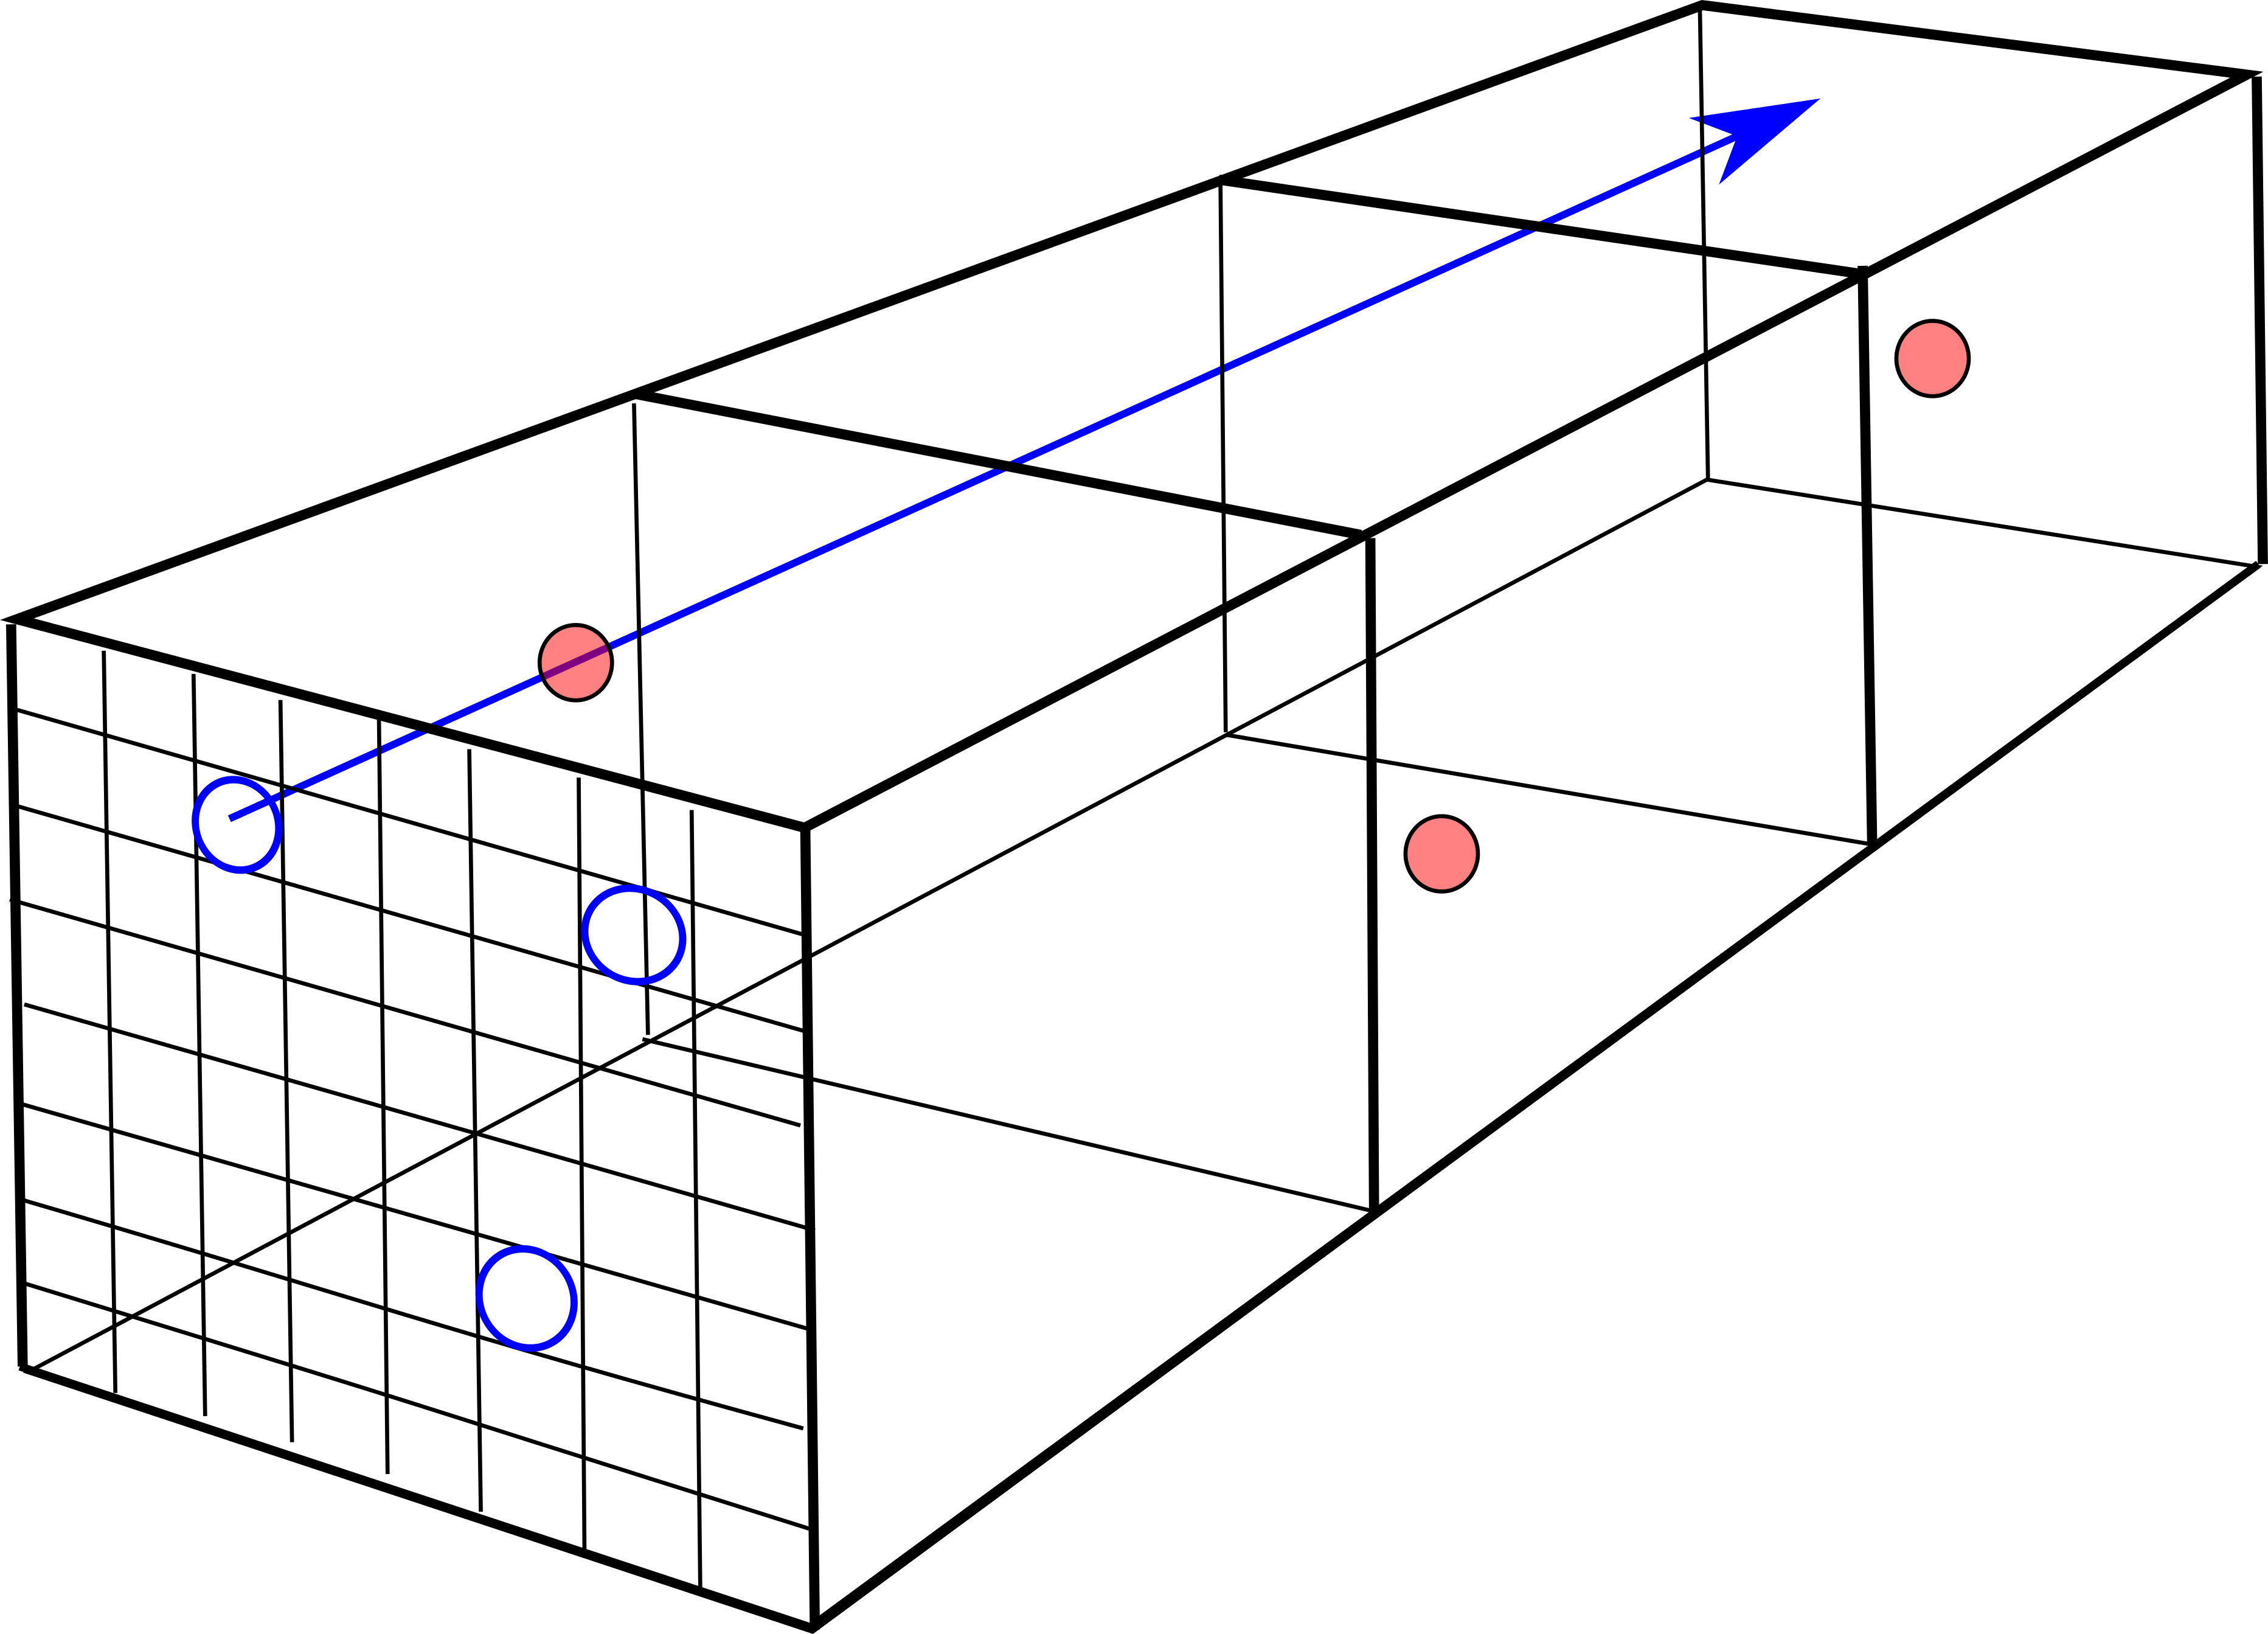
We will assume no correlation in position of the scattering centers. A crystal will not have this property, but an amorphous mixture will, if thick enough. As a beam proton passes through an atomic area , while traversing a distance , the atomic volumes it passes through will make up a ‘scattering tube’ surrounding the path of the beam proton. The number of atomic volumes and therefore the number of nuclei in the tube will be . We will assume that the scattering centers in the scattering tube are spread randomly, so that the beam proton entering any of the nuclear areas has the same probability of being scattered as a proton entering any other such nuclear area.
Given the equal a priori probabilities on entering any one of the nuclear areas, we can arrange all the nuclear areas covering the two dimensional atomic area into a linear array of ‘cells’, symbolized by an dimensional vector. Behind one of those nuclear areas there may be nuclear scattering centers, which we will call a cluster. The number of distinct clusters of scattering centers distributed across cells will be called . Because the position of the nuclear areas does not change the a priori probability for scattering, we can order the cell ‘occupation’ numbers so that, from left to right, .
A single configuration for scattering centers will be called a ‘distribution’ of fixed values for the , with the distribution ‘vector’ symbolized by an dimensional vector
| (104) |
In the second expression, the values beyond are all zero. Note that
| (105) |
Evidently, the number of clusters is
| (106) |
and . A distribution vector is then . If a subset of non-zero ’s have the same value, we will call the number of such equal ’s the ‘multiplicity’ of that .
After randomly distributing the scattering centers in cells, the number of configurations of scattering-center clusters with a given distribution will be called the weight of the distribution, , since this number is proportional to the probability of finding such a configuration after the scattering centers are randomly distributed among the cells.

Figure 15 shows the case for . By filling three cells sequentially with five ‘dots’ and then counting, we find the following configurations and their probabilistic weights :
In this example, the total number of configurations must be , a useful check that all configurations have been found.
To find a general expression for the weights , first note that if there are clusters, there will be ways to distribute distinct clusters. If there are cells with the same number of scattering centers, then the number of configurations with a given set of clusters is , since a cluster with label has ways of equivalent re-arrangements. Now we must count the number of ways the scattering centers could have been placed in the given clusters. Starting with the left-most non-empty cluster which contains scattering centers, there will have been ways to have selected the centers. But now we have fewer centers to put in the second cluster, so there will have been ways to rearrange the centers in the second cluster, given the first. This continues until the last non-zero cluster, which has . As a result, the number of distributions with vector will be
| (107) |
i.e.
| (108) |
The counts must satisfy
| (109) |
wherein the sum is over all that satisfy and
The identity Eq. (109) can be derived from the following observation. The multinomial expansion is
| (110) |
where and now all the ’s range from to . If we put all the ’s to one, then we have
| (111) |
In this sum, group all terms that have the same set of . Consider the terms with non-zero ’s. For the case of distinct ’s, there will be such terms. But some terms with a given may have a degeneracy, i.e. terms with identical ’s. Then the number of distinct terms is . The multinomial for a sum of ones has become the sum of the .
A useful alternative to the expression Eq. (108) is
| (112) |
where the are all the distinct ’s, with and
| (113) | |||||
| (114) |
With this notation, a given configuration of scattering centers can be denoted , where .
An even simpler expression results if we define for the multiplicity of the empty cells. Then
| (119) | |||||
| (124) |
where the two parenthetical expressions are multinomial coefficients, and we have taken advantage of the fact that . In Eq. (124), we assign zeros to the multiplicities for , and then use the fact that any number of ’s or ’s can be appended to the array in each multinomial, as long as they are zero.
The probability for a given configuration of will be
| (125) |
Evidently, the configurations with the scattering centers spread out (having the ’s close to the same values) will have the larger probabilities, but, as seen in the example for below, a configuration with fewer clusters can have a larger probability than one with a more evenly spread . (This is in contrast to the multinomial coefficients themselves, for which a more even spread of the ’s always gives a larger coefficient.)
The weight for the probability that two or more scattering events (‘hits’) occur for a given beam proton will be a sum of the weight of a given cluster set times the probability of a hit in a cluster whose size is greater than one. This determination might best be seen in an example. Let and . Then the possible clusters with their weights are shown in Table I.1.
For this example, the fraction of beam protons that hit two or more scattering centers is , or about .
The general expression for is given by
| (126) |
Here, is the number of ’s bigger than one in the given distribution. Note that we have not required that the proton be deflected only to small angles. After each hit, the distribution of scattering centers is the same as that presented to the proton in the prior hit. This is a property following from the implicit assumption of homogeneity and isotropy of the tissue and of random distribution of scattering centers with cross-section among the possible scattering tubes.
A general expression for is given by
| (127) |
Here, is the number of ’s bigger than zero in the given cluster. Note that we have not required that the proton be deflected only to small angles. After each hit, the distribution of scattering centers is the same as that presented to the proton in the prior hit. This is a property following from the implicit assumption of homogeneity and isotropy of the tissue and of random distribution of scattering centers with cross-section among the possible scattering tubes.
The expression Eq. (127) can be greatly simplified. First note that is also the sum of the multiplicities except for , and that
so that
Substituting into Eq. (127) gives
| (128) |
(The case is allowed in the second sum because ) We recognize each cluster sum to be an expansion of a sum of ones to a power of . Thus
| (129) |
where, in the last expression, we took . Alternatively, this exponential behavior can be derived (as in Beer’s law for light scattering) from the assumption that the number of scattered protons is proportional to the number arriving into a given small volume of tissue and the density of scattering centers in that volume.
To find the probability that a beam proton independently hits at least two scattering centers, we turn to
| (130) |
Now . The evaluation of our expression Eq. (130) is easier as a single multinomial sum. There results
| (131) |
where the sum has been excluded. The factor in front of the sum comes from the fact that there are equivalent such sums. The ranges of the remaining ’s go from to , and they are constrained by . The sum in Eq. (131) is just , resulting in
| (132) |
Note that if (number of scattering centers is the same as the number of nuclear cells), then, for large , and . These serve as a check of calculations.
A Mathematica program is given in Appendix L which finds all the ordered distributions , calculates for a given distribution and then the probabilities for a beam proton to be scattered once, twice, or any a number of times.
Chance for a proton to undergo hits to O18 in tissue
In our applications, the number of nuclear scattering centers behind the area is , while the number of cells over which the scattering centers are distributed in , so
As the proton beam slows, the events O18(p,n)F18 increase as the reaction cross section peaks at about 6 MeV (see Fig. 6). For a low density of parent nuclei, the probability that a proton will hit the cross-sectional area is given by , where is the number density of the parent nuclei and is the distance the proton has traveled. When the area becomes a significant fraction of the area , multiple independent hits are likely. According to Eq. (129), the probability of at least two independent hits in the case has the leading term while The approximate expression for would also follow from the assumption that the change in the flux of beam particles over a short distance drops in proportion to the flux itself, to the scatterer’s cross section and to their number density. The approximate expression for would come about if the change of flux over a short distance dropped as the square of the distance the beam proton traveled, indicating that double scattering is required, just as the chance that a car is involved in two independent encounters with other cars is proportional to the density of cars squared.
Table A.5 shows the relevant data for thymine-18 in the DNA of human tissue. One can see from the long ‘extinction length’ for the O18(p,n)F18 reaction that inside a human, a beam proton is not likely to have more than one encounter with O18 to make F18, assuming the O18 is uniformly spread out. However, the fact that the DNA is compacted into a small volume inside each biologic cell increases the chance that one encounter will be followed by a second, i.e. scattering events may be correlated.
For scattering of beam protons off nuclei, we expect that the number of F18 isotopes that the proton beam produces in the doped tissue will be
| (133) |
where is the number flux of protons in the beam, is the effective area of the beam, and is the exposure time.
Appendix J Beam fluence loss
The loss of protons from a proton-therapy beam while it passes through tissue has a number of distinct causes:
-
•
Protons scattering from electrons (minimal loss)
-
•
Protons elastic scattering from other protons
-
•
Protons inelastically scattering from nuclei making excited nuclear states
-
•
Protons causing nuclear reactions (transmutation and fragmentation)
-
•
Protons becoming thermalized
The loss is usually measured by the change in the beam fluence rate, or number flux, defined as the number of protons passing through a unit area perpendicular to the beam per unit time. In relativity, this is the spatial part of the proton 4-current divided by the magnitude of the electron charge, i.e. the proton number density measured moving with the beam, times the relativistic 4-velocity (.
Given the myriad of possible causes for diminishing proton flux as the beam passed through tissue, analytic expressions for this loss as a function of penetration distance are hard to find. Rather, Monte Carlo techniques (e.g. GEANT4 code) are often employed. Even so, modeling and experiment show that the drop in proton flux with distance is almost linear. The drop in proton number flux in water is % before the end of the proton beam’s average range, where the flux tails off to zero within about % of the beam’s range, ([34], [27]).
Appendix K Nuclear positron emitters produced by a proton beam
Reactions that produce positron-emitting radionuclides potentially could interfere with post-PT PET scans to determine where the beam delivered its dose. It behooves us to look for the reactions that might produce significant amounts of positron nuclear decays in the time-frame of the measurable F18 decays.
We will use , to represent a nuclei. A proton is then represented by , while a neutron is . After a nuclear reaction of a beam proton with a tissue nucleus, the dominant fragments will be . These will be denoted . (Deuterons, tritium, and helium-3 will have a much lower probability, as these are clustered in heavier nuclei far less often than helium-4.) Thus, the fragments will have where ; , .
Reactions are represented succinctly by
with for reactant protons or secondary neutrons. To find the reactant nuclei for a given radionuclide, we use
The possible positron-emitting radionuclides that could interfere, and their half-lives, are
Examinining each one up to copper, we have
half-life
beam proton
‘beam’ neutron
half-life
beam proton
‘beam’ neutron
half-life
beam proton
‘beam’ neutron
half-life
beam proton
‘beam’ neutron
half-life
beam proton
‘beam’ neutron
Appendix L Mathematica expressions for proton scattering probabilities
In Appendix I, we derived a way of calculating the probability that a beam proton will scatter from a scattering center in tissue at least a certain number of times. Here, we will give Mathematica expressions to perform this kind of calculation when the number of cells, , and the number of scattering centers spread among those cells, are tractable by Mathematica. This limits to be below about 100, and to be below about , so the expressions given make a useful test-bed for examining the model, but not for cases in which reaches billions or more.
We distribute scattering centers randomly over ‘cells’. A given distribution of scattering centers in cells is displayed with the notation , where the ’s are the number of scattering centers which have ended in a given cell. Since all cells have equivalent in a priori probability, the cell distributions can be ordered according to the size of the ’s as . The ’s are constrained by . The total number of distinct distributions is some number . For a given distribution, some of the values may be the same. We say the scattering centers form a ‘cluster’. If so, put these clusters in groups. Each such group will be a collection of a certain number of cells. The number of such clusters we will call , the ‘multiplicity’ of the value. The values are constrained by and by . It is useful to extend the set of values with zeros, with the multiplicity of zeros being . The number of equivalent configurations with the same created after a random distribution of the scattering centers among the cells is called , and was shown in Appendix I to be
| (134) |
where is the ‘multiplicity’ of the cells with the same number of scattering centers. The are taken once for the whole set of such cells. In Mathematica, after setting values for variables (for the value of ) and , the distinct configurations can be listed using
We have put to avoid the Mathematica function . A list of the values of for each distinct configuration will result from
Now, in order to get the probability of at least hits by a beam proton, we define
and use, sequentially, . It follows that
will give the probability that a beam proton will hit at least scattering centers. The implied factor is the probability that a given configuration appears in the random distribution of scattering centers, and the implied factor gives the probability that a beam proton will hit a cell containing at least scattering centers. For , the above Mathematica formula has computation times in minutes or hours on a PC.
The number of distinct partitions of an integer taken at a time is often called , with The number can be calculated in Mathematica for a given set of distinct distributions from the ‘length’ of , i.e.
For the example, from Table I.1, with and , .
Many researchers since 1917 have developed improvements to the Hardy and Ramajujan result, including convergent series for large . Here, we give that of Brassesco and Meyroneic[6]:
| (136) |
where
| (137) | |||||
| (138) |
The value of the integer determines the error of the approximation. For example, values as little give an within of the exact answer, .
References
- Allison et al., [2006] Allison, J., Amako, K., Apostolakis, J., Araujo, H., Dubois, P. A., Asai, M., Barrand, G., Capra, R., Chauvie, S., Chytracek, R., et al. (2006). Geant4 developments and applications. IEEE Transactions on Nuclear Science, 53(1):270–278.
- Allison et al., [2016] Allison, J., Amako, K., Apostolakis, J., Arce, P., Asai, M., Aso, T., Bagli, E., Bagulya, A., Banerjee, S., Barrand, G., et al. (2016). Recent developments in Geant4. Nuclear Instruments and Methods in Physics Research Section A: Accelerators, Spectrometers, Detectors and Associated Equipment, 835:186–225.
- Bethe, [1930] Bethe, H. (1930). Zur theorie des durchgangs schneller korpuskularstrahlen durch materie. Annalen der Physik, 397(3):325–400.
- Bethe, [1953] Bethe, H. A. (1953). Moliere’s theory of multiple scattering. Physical review, 89(6):1256.
- Bortfeld, [1997] Bortfeld, T. (1997). An analytical approximation of the Bragg curve for therapeutic proton beams. Medical Physics, 24(12):2024–2033.
- Brassesco and Meyroneinc, [2020] Brassesco, S. and Meyroneinc, A. (2020). An expansion for the number of partitions of an integer. The Ramanujan Journal, 51(3):563–592.
- Cascio et al., [2005] Cascio, E. W., Sisterson, J. M., and Slopsema, R. (2005). Secondary neutron fluence in radiation test beams at The Northeast Proton Therapy Center. In IEEE Radiation Effects Data Workshop, 2005., pages 175–178. IEEE.
- Collaboration et al., [2003] Collaboration, G., Agostinelli, S., et al. (2003). GEANT4–a simulation toolkit. Nucl. Instrum. Meth. A, 506(25):0.
- Colombino and Fiscella, [1971] Colombino, P. and Fiscella, B. (1971). Positronium annihilation in magnetic fields up to 21 kG. Il Nuovo Cimento B (1971-1996), 3(1):1.
- Conti and Eriksson, [2016] Conti, M. and Eriksson, L. (2016). Physics of pure and non-pure positron emitters for PET: a review and a discussion. EJNMMI Physics, 3(1):8.
- Coursey et al., [2015] Coursey, J. S., Schwab, D. J., Tsai, J. J., and Dragoset, R. A. (2015). Atomic Weights and Isotopic Compositions (Ver. 4.1). NIST web page accessed 2020-11-13.
- Fano, [1947] Fano, U. (1947). Ionization yield of radiations. II. The fluctuations of the number of ions. Physical Review, 72(1):26.
- Gamow, [1928] Gamow, G. (1928). The quantum theory of nuclear disintegration. Nature, 122(3082):805–806.
- [14] Gottschalk, B. (2018a). Lectures on proton-beam therapy. https://github.com/BernardGottschalk/BG-distribution.
- [15] Gottschalk, B. (2018b). Radiotherapy proton interactions in matter. arXiv preprint arXiv:1804.00022.
- Grün, [2014] Grün, R. A. (2014). Impact of tissue specific parameters on the predition of the biological effectiveness for treatment planning in ion beam therapy. PhD thesis, Philipps-Universität Marburg, Hesse, Germany.
- Hampel, [1968] Hampel, C. A., editor (1968). Encyclopedia of the chemical elements. Reinhold Book Corp.
- Hardy and Ramanujan, [1917] Hardy, G. H. and Ramanujan, S. (1917). Une formule asymptotique por le nombre des partitions de n. Comptes rendus, 164:35–38.
- Hardy and Ramanujan, [1918] Hardy, G. H. and Ramanujan, S. (1918). Asymptotic formulaæ in combinatory analysis. Proceedings of the London Mathematical Society, 2(1):75–115.
- Hess et al., [2001] Hess, E., Takács, S., Scholten, B., Tárkányi, F., Coenen, H. H., and Qaim, S. M. (2001). Excitation function of the 18O(p, n)18F nuclear reaction from threshold up to 30 MeV. Radiochimica Acta, 89(6):357–362.
- Hünemohr et al., [2014] Hünemohr, N., Paganetti, H., Greilich, S., Jäkel, O., and Seco, J. (2014). Tissue decomposition from dual energy CT data for MC based dose calculation in particle therapy. Medical physics, 41(6):061714–1 to 14.
- Kinahan et al., [2003] Kinahan, P. E., Hasegawa, B. H., and Beyer, T. (2003). X-ray-based attenuation correction for positron emission tomography/computed tomography scanners. In Seminars in nuclear medicine, volume 33(3), pages 166–179. Elsevier.
- Levin and Hoffman, [1999] Levin, C. S. and Hoffman, E. J. (1999). Calculation of positron range and its effect on the fundamental limit of positron emission tomography system spatial resolution. Physics in Medicine & Biology, 44(3):781.
- Lide et al., [2003] Lide, D. R. et al. (2003). Atomic, Molecular, and Optical Physics; Ionization Potentials of Atoms and Atomic Ions. CRC Handbook of Chemistry and Physics, Section 10.
- Marquez, [1952] Marquez, L. (1952). The yield of f18 from medium and heavy elements with 420-mev protons. Physical Review, 86:405.
- Moliere, [1948] Moliere, G. (1948). Theorie der streuung schneller geladener teilchen ii mehrfach-und vielfachstreuung. Zeitschrift für Naturforschung A, 3(2):78–97.
- Newhauser and Zhang, [2015] Newhauser, W. D. and Zhang, R. (2015). The physics of proton therapy. Physics in Medicine & Biology, 60(8):R155.
- Paganetti, [2012] Paganetti, H. (2012). Range uncertainties in proton therapy and the role of Monte-Carlo simulations. Physics in Medicine & Biology, 57(11):R99.
- Panajotovic et al., [2006] Panajotovic, R., Martin, F., Cloutier, P., Hunting, D., and Sanche, L. (2006). Effective cross sections for production of single-strand breaks in plasmid DNA by 0.1 to 4.7 eV electrons. Radiation Research, 165(4):452–459.
- Piovesan et al., [2019] Piovesan, A., Pelleri, M. C., Antonaros, F., Strippoli, P., Caracausi, M., and Vitale, L. (2019). On the length, weight and GC content of the human genome. BMC Research Notes, 12(1):106.
- Plante and Cucinotta, [2009] Plante, I. and Cucinotta, F. A. (2009). Cross sections for the interactions of 1 eV–100 MeV electrons in liquid water and application to Monte-Carlo simulation of HZE radiation tracks. New Journal of Physics, 11(6):063047.
- Pritychenko and Sonzogni, [2016] Pritychenko, B. and Sonzogni, A. (2016). Q-value Calculator. BNL web page accessed 2020-12-04.
- Rich et al., [2020] Rich, T., Pan, D., Chordia, M., Keppel, C., Beylin, D., Stepanov, P., Jung, M., Pang, D., Grindroid, S., and Dritschilo, A. (2020). O Substituted Nucleosides Combined with Proton Therapy: Therapeutic Transmutation in vitro. preprint.
- Sandison and Chvetsov, [2000] Sandison, G. A. and Chvetsov, A. V. (2000). Proton loss model for therapeutic beam dose calculations. Medical physics, 27(9):2133–2145.
- Schneider et al., [2002] Schneider, U., Agosteo, S., Pedroni, E., and Besserer, J. (2002). Secondary neutron dose during proton therapy using spot scanning. International Journal of Radiation Oncology* Biology* Physics, 53(1):244–251.
- Seltzer, [1993] Seltzer, S. (1993). An assessment of the role of charged secondaries from nonelastic nuclear interactions by therapy proton beams in water. NISTIR Publication 5221.
- Studenski and Xiao, [2010] Studenski, M. T. and Xiao, Y. (2010). Proton therapy dosimetry using positron emission tomography. World journal of radiology, 2(4):135.
- Ulmer and Matsinos, [2010] Ulmer, W. and Matsinos, E. (2010). Theoretical methods for the calculation of Bragg curves and 3D distributions of proton beams. The European Physical Journal Special Topics, 190(1):1–81.
- Wang et al., [2017] Wang, M., Audi, G., Kondev, F. G., Huang, W., Naimi, S., and Xu, X. (2017). The AME2016 atomic mass evaluation (II). tables, graphs and references. Chinese Physics C, 41(3):030003.
- Wigner, [1948] Wigner, E. P. (1948). On the behavior of cross sections near thresholds. Physical Review, 73(9):1002.
- Wu and Moszkowski, [1966] Wu, C. S. and Moszkowski, S. A. (1966). Beta Decay. Inter-science Publishers, John Wiley & Sons, New York, London, Sydney.
- Yoon and Wong, [2000] Yoon, J.-H. and Wong, C.-Y. (2000). Relativistic modification of the gamow factor. Physical Review C, 61(4):044905.
- Yule and Turkevich, [1960] Yule, H. P. and Turkevich, A. (1960). Radiochemical studies of the (p,pn) reaction in complex nuclei in the80-450-mev range. Physical Review, 118:1591.
- Zerkin, [2021] Zerkin, V. V. (2021). Brookhaven National Laboratory, National Nuclear Data Center, EXFOR Systems.
- Ziegler, [1999] Ziegler, J. (1999). Stopping of energetic light ions in elemental matter. Journal of Applied Physics, 85(3):1249–1272.