Understanding photoluminescence of coupled metallic nanostructures based on a coupling classic harmonic oscillator model
Abstract
Photoluminescence (PL) phenomenon from metallic nanostructures has been explained and understood by several point of views. One of them is based on the classic harmonic oscillator model, which describes PL of single mode. In this study, we continue to expand this classic model to a coupling case, which involves two oscillators that interact with each other together with the excitation electric field. The new generated modes due to the coupling are carefully analyzed, including their behaviors varying with the coupling coefficients in different cases. Furthermore, for practical purpose, PL spectra and white light scattering spectra of two individual metallic nanostuctures are calculated as examples employing the model to verify its validity. This work would give a deeper understanding on coupling PL phenomena and is helpful to relative applications.
Photoluminescence (PL) phenomena from noble metals have been widely studied since the first report over 50 years ago Mooradian (1969). PL can be excited not only from bulk materials, but also from thin films and nanostructures Boyd, Yu, and Shen (1986); Mohamed et al. (2000); Cai et al. (2018); Balykin and Melentiev (2018); Cai et al. (2019). Particularly, the localized surface plasmon resonance (LSPR) effect enhances the emissions in the case of metallic nanostructures, thus resulting in numerous applications such as optical recording Zijlstra, Chon, and Gu (2009); Taylor, Kim, and Chon (2012), biosensing Lu et al. (2012); Zhang et al. (2018), orientation probes Zhang et al. (2013); Lu et al. (2015), local temperature detection Carattino, Caldarola, and Orrit (2018); Zhang et al. (2019); Hastman et al. (2020).
The origin of PL has been discussed in plenty of studies, with different explanations such as interband transitions enhanced by LSPR Shahbazyan (2013), microscopic explanation for enhanced PL from gold nanoparticles Dulkeith et al. (2004), classic oscillator model assisted with electron distributions for single mode emission Cheng et al. (2018), and non-equilibrium electron dynamics affecting PL of metallic nanostructures Zhang et al. (2020). Nevertheless, the coupling PL phenomena are seldom investigated in theory. For example, Prodan E. et al. present a molecular orbital theory to describe the coupling plasmon modes introduced by the metallic nanostructures of arbitrary shape Prodan et al. (2003). Jain P. K. et al. provide a semiempirical “plasmon ruler equation” based on discrete dipole approximation (DDA) simulation method to estimate the plasmon shifts as a function of the separation between the nanoparticles Jain, Huang, and El-Sayed (2007). However, the developed models based on quantum theories are neither lack of details on the emission spectra, especially for PL, nor lack of intrinsic physical pictures. Hence, a clear picture for coupling PL spectra is required to be built up.
In this study, we present a practical model to give a deep understanding on PL from coupled metallic nanostructures, e.g., gold nanorods or nanospheres. This model is based on the classic harmonic oscillator model, considering two oscillators that interact with each other. We treat the interaction part, i.e., coupling coefficients, between the two in a non-phenomenological way. That is, the coupling coefficients are obtained from the intrinsic physics rather than just assuming as several parameters. The model show reasonable results to explain PL and white light scattering spectra of coupled metallic nanostructures for different situations. This work would help to understand coupling PL phenomena in a classical way.
Since there are plenty free electrons in the metallic nanostructure, and these electrons oscillate when excited by the external electric field, we treat the nanostructure as a resonator, the oscillators of which are the electrons. Due to the collectively oscillating, we can simplify the multiple electrons as only one electron.

Consider that two metallic nanostructures treated as two oscillators are close to each other and are driven by the electric field of the excitation light. The schematic is shown in Fig. 1. In order to obtain the emission electric field from them, we need to find out the differential equations of them. Define and as the displacements relative to equilibrium positions of each oscillator, thus and the velocities, and and the accelerations. The equations should be in this form:
| (1a) | |||
| (1b) | |||
Here, and are the interaction forces between Oscillator 1 and Oscillator 2, , , and is the mass of electron. and are the amplitudes of the excitation electric field at the positions of the two oscillators, and usually is a good approximation. and represent the damping coefficients, and and represent the inherent circular frequencies. The next step is to find out the interaction parts of the equations.
The electric field introduced by a moving charged particle is given by:Griffiths (2013)
| (2) |
where is the charge of the particle, is the permittivity of vacuum, and . Here, is the velocity of light in vacuum, and are the velocity and the acceleration of the particle, respectively, and is the displacement vector from the particle to field point. In our one-dimension case, when considering the electric field introduced by one oscillator acting on the other oscillator, the second part of Eq. 2 is zero due to the fact that and are parallel. Besides, we notice that the charged particle that moves is the electron while the positive ion is assumed to be at rest. Hence, the interacted electric field at one oscillator should be contributed to both positive charged ion and negative charged electron of the other oscillator. Therefore, the electric field can be written as:
| (3a) | ||||
| (3b) | ||||
Here, we use the conditions and for approximation. Notice that is the electric field in Oscillator 1 introduced by one pair of the electrons and ions in Oscillator 2, and is the electric field in Oscillator 2 introduced by one pair of the electrons and ions in Oscillator 1. Hence, the interaction forces should be written as and , where and are the effective numbers of free electrons in Oscillator 1 and Oscillator 2, respectively. We define the coupling coefficients as:
| (4) | |||
thus Eq. (1) can be written as:
| (5a) | |||
| (5b) | |||
For simplicity, we assume , thus , , and if we define , it results in a simple form for and :
| (6) |
Firstly, we consider the situation without coupling, i.e., . In such conditions, Eq. 5 is degenerated into the simple form:
| (7a) | |||
| (7b) | |||
The general solutions are:
| (8a) | |||
| (8b) | |||
Here, and represent the resonant circular frequencies, respectively, which are different from the inherent ones (). The coefficients that represent amplitudes are omitted for the moment, which can be obtained with the initial conditions. The details of this kind of individual oscillator has been discussed carefully in our previous work. Cheng et al. (2018)
Secondly, we start to consider the coupling situation without excitation light, i.e., . The equations are:
| (9a) | |||
| (9b) | |||
To solve Eq. (9), we can assume that and , and substitute them back into Eq. (9), thus obtaining:
| (10a) | |||
| (10b) | |||
Obviously, to obtain non-zero solutions, should satisfy:
| (11) |
Notice that Eq. (11) has analytic solutions for , marked as , , and . However, the expressions are so complex that we would not write in the text. Instead, to illustrate the physical significance of , we rewrite it in this form:
| (12) | |||
Here, and are the new generated resonant circular frequencies when the two oscillators couple. We can call them Mode 1 and Mode 2, respectively. In a more special case, i.e., , , the solutions of Eq. (11) are expressed easily:
| (13) | |||
Thirdly, notice that the particular solutions for Eq. (5) are and (amplitudes are omitted). Therefore, combining these particular solutions and the general ones [Eq. (8)], we obtain the total solutions of Eq. (5) in a symmetric form:
| (14a) | ||||
| (14b) | ||||
where , , and . We emphasize here that Eq. (13) is just a special case for and , and the general case for them should satisfy Eq. (12). The initial conditions are , where we assume that due to the subwavelength scale of the system. Hence, these coefficients are obtained as:
| (15a) | |||
| (15b) | |||
| (15c) | |||
This results in the fact that .
At last, we deal with the far field radiation. For simplicity, we consider the electric field at the position , where is perpendicular to -axis, and is the distance between field point and the center of the two oscillators. The assumption of is reasonable for far field radiation. Hence, the first part of Eq. (2) is ignored compared with the second part, thus giving the electric field introduced by Oscillator 1 and Oscillator 2 as:
| (16) |
where , and is -polarized. The emission intensity in the frequency domain, i.e., emission spectrum, can be evaluated by Cheng et al. (2018):
| (17) |
where is the real part of , and is the time average of quantity . The calculated result is:
| (18) | ||||
where for . Here, we ignore the cross terms in the calculation because the time average is zero when .
As our previous work explains Cheng et al. (2018), the emission spectrum is separated into two parts, one is the inelastic part () which corresponds to PL spectrum, and the other is the elastic part () which corresponds to white light scattering spectrum. Rewrite Eq. (18) as:
| (19a) | ||||
| (19b) | ||||
Therefore, the PL spectrum is given by Eq. (19a), i.e.,
| (20) |
while the white light scattering spectrum is given from Eq. (19b) as long as is substitute by :
| (21) |
To show the coupling modes for PL more clearly and to understand PL phenomenon more easily, we do not consider the electron distributions here as before Cheng et al. (2018), which contributes mostly to the anti-Stokes part of PL spectra, though this model would be more accuracy for PL when assisted with the electron distributions.
After obtaining these formulas, we would analyze in details to understand them more deeply.
Start from the coupling coefficients, and . Fig. 2a shows and varying with the distance , calculated from Eq. (6). It implicates that the coupling coefficients decrease with the increase of , and is smaller than . When is small enough, the coupling coefficients get large. Since these two coefficients are both related to , we take one of them, i.e., , as the coupling strength in the rest of this work.
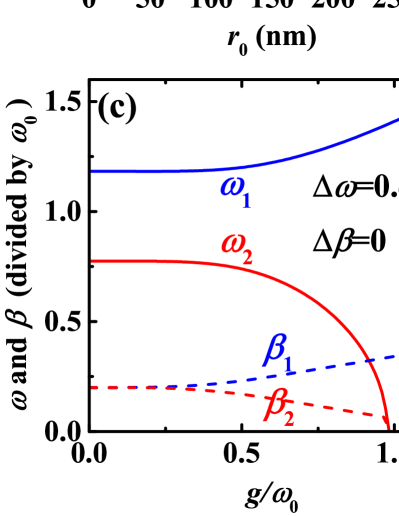
Fig. 2b-d show the new generated resonant circular frequencies () and damping coefficients () in different cases of the coupled oscillators as a function of the coupling strength , calculated from Eq. (11) and (12). The simplest one (Fig. 2b) is that the two oscillators are the same. The two new modes split when coupling, and the splitting increases with the increase of . Here, we generally call the increasing “blue branch”, and the decreasing “red branch”. On the other hand, the two damping coefficients also splits, and one increases (corresponding blue branch), the other decreases (red branch). Notice that there is a cut-off coupling strength for the red branch at around . In Fig. 2c, the situation is almost the same, i.e., the difference of and between the two branches increase with the increase of , and there also exists . The difference between Fig. 2b and 2c is that, to obtain the same level of splitting, the former needs a smaller than the latter does. That is, the former gets a better coupling efficient than the latter does. In Fig. 2d, due to the fact that and , it results in with a small difference. The difference of between the two branches () increases from negative value to zero and then increase to positive value as the increase of . On the other hand, the difference of between the two branches () decreases and then increases as the increase of . Also, exists in this case. The coupling efficient in Fig. 2 follows the relation: .

Furthermore, the effective free electrons number affects the splitting as shown in Fig. 3, giving three values of as examples. Firstly, we find out the behaviors of and as increases for each figure. In Fig. 3a, increases and then decreases, while decreases, indicating that has a maximal value. In Fig. 3b, decreases and then increases and finally decreases, while increases and then decreases, indicating that both and have maximal values. In Fig. 3c, decreases, while increases slightly and then decreases. In Fig. 3d, decreases, while increases and then decreases, the curves of which almost coincide with each other at the range around to . In Fig. 3e, the behaviors are similar to the ones in Fig. 3c. In Fig. 3f, the behaviors are similar to the ones in Fig. 3d, but the two curves cross rather than coincide. Secondly, we find out the similar behaviors for these parameters in a general view. In all cases, there are cut-off coupling strengths for both modes, writing as and , at which and , respectively. The differences are, for smaller ( or ), , while for larger (), . As increases, the splitting of damping coefficients and gets larger. Furthermore, another interesting result is that there is a point (shown with black cross circle) at which for each case, and . This is different from the one in Fig. 2 where . When , Mode 2 behaves normally. However, when , indicates that this is an exponentially increasing mode, which should be removed from the total solutions [Eq. (14)], resulting in the absence of Mode 2. The most special case is when (or ), which corresponds to a lossless (or low loss) mode. In frequency domain this mode would results in a narrow spectrum. However, the effective free electrons number that satisfy this condition is so large that it is almost impossible for a metallic nanostructure. Therefore, in the rest of this work, we only consider the number at the order of magnitudes of .
In Eq. (14), , and represent the amplitudes of the three corresponding modes of . When considering the far field, one should use the amplitudes of , i.e., , and . Obviously, the frequency of the excitation light plays a significant role in the amplitudes.

Fig. 4 shows these amplitudes as a function of . In the first case (Fig. 4a), i.e., two same oscillators, the coupled resonant circular frequencies (relative to ) are calculated as and . We find that to obtain the maximum intensities of Mode 1 and Mode 2 of the emission field, the circular frequency of the excitation light should be close the corresponding circular resonant frequencies. For Mode 3, there are two peaks when varying , which correspond to around and , respectively. In the second case (Fig. 4b), i.e., two different oscillators (), the coupled resonant circular frequencies (relative to ) are calculated as 0.22 and -0.24, respectively, which, however, corresponds to a weak coupling due to the frequency splitting is small. This result has been identified in Fig. 2. Also, the intensities of Mode 1 and Mode 2 for far field reach their maximums when is close to the resonant circular frequencies for each of them, and the two corresponding peaks appear for Mode 3.
For practical purpose, we consider two metallic nanostructures, e.g., gold nanorods or nanospheres, as the two oscillators, each of which has an individual resonant mode. Fig. 5 shows the coupling PL spectra for different coupling strengths at two different excitation wavelengths, calculated from Eq. (20). With the increase of , the splitting of the two modes of PL increases, and the total emission intensities decrease. The decrease of the intensities origin from Eq. (15a) and (15b). Take Eq. (15a) as an example to explain. The amplitudes depend not only on (this has been discussed in Fig. 4), but also on . When increases, increases, resulting in the decrease of the amplitude of Mode 1. So does Mode 2. Therefore, the PL intensities decrease as increases.

Besides, when excited by 532 nm laser, Mode 1 is close to it, resulting in a larger intensity than the one of Mode 2. While excited by 633 nm laser, Mode 2 is close to it, resulting in a larger intensity than the one of Mode 1. This is consistent with the results in Fig. 4. Here, unit “eV” and unit “Hz” for satisfy the following relationship:
| (22) |
where is the reduced Planck constant. So does the damping coefficient .

Fig. 6 shows the coupling white light scattering spectra for different coupling strengths in different cases, calculated from Eq. (21). In Fig. 6a, i.e., two oscillators with different resonant wavelengths, with the increase of , the splitting of the two modes increases, which behaves the same as PL does. However, the scattering intensities stay in the same level which is different from PL spectra. In Fig. 6b, i.e., two same oscillators, with the increase of , Mode 2 red-shifts, while Mode 1 is hardly to be obtained. Also, the intensities stay in the same level. This behavior agrees well with the experiments Su et al. (2003); Sönnichsen et al. (2005); Hu et al. (2012).
In summary, we develop a coupling classic harmonic oscillator model to explain the coupling PL spectra as well as the white light scattering spectra from two coupled metallic nanostructures. Each nanostructure is treated as a classic charged oscillator with its own single mode. The coupling coefficients are obtained from the electric interactions between the charges, and are proportional to the velocity and the acceleration of the oscillator, respectively. The behaviors of the two new generated modes due to the coupling are different under different conditions. In general, they split and the splitting gets large as the coupling strength increases at the beginning. Meanwhile, tuning effective free electron number , when gets large enough, there exist cut-off frequencies for both modes, and a maximum frequency for one of the modes. Besides, PL spectra and white light scattering spectra are calculated from the model, and their behaviors varying with the coupling strength agree well with the experimental ones of other researchers’ work. It is worth noting that this coupling model could be expanded to other wavebands dealing with two coupled single-mode resonators.
This work was supported by the Fundamental Research Funds for the Central Universities (Grant No. FRF-TP-20-075A1).
The authors declare no conflicts of interest.
The data that support the findings of this study are available from the corresponding author upon reasonable request.
References
References
- Mooradian (1969) A. Mooradian, “Photoluminescence of metals,” Physical Review Letters 22, 185–187 (1969).
- Boyd, Yu, and Shen (1986) G. T. Boyd, Z. H. Yu, and Y. R. Shen, “Photoinduced luminescence from the noble metals and its enhancement on roughened surfaces,” Physical Review B 33, 7923–7936 (1986).
- Mohamed et al. (2000) M. B. Mohamed, V. Volkov, S. Link, and M. A. El-Sayed, “The ‘lightning’ gold nanorods: fluorescence enhancement of over a million compared to the gold metal,” Chemical Physics Letters 317, 517–523 (2000).
- Cai et al. (2018) Y.-Y. Cai, J. G. Liu, L. J. Tauzin, D. Huang, E. Sung, H. Zhang, A. Joplin, W.-S. Chang, P. Nordlander, and S. Link, “Photoluminescence of gold nanorods: Purcell effect enhanced emission from hot carriers,” ACS Nano 12, 976–985 (2018).
- Balykin and Melentiev (2018) V. I. Balykin and P. N. Melentiev, “Optics and spectroscopy of a single plasmonic nanostructure,” Physics-Uspekhi 61, 133–156 (2018).
- Cai et al. (2019) Y.-Y. Cai, S. S. E. Collins, M. J. Gallagher, U. Bhattacharjee, R. Zhang, T. H. Chow, A. Ahmadivand, B. Ostovar, A. Al-Zubeidi, J. Wang, P. Nordlander, C. F. Landes, and S. Link, “Single-particle emission spectroscopy resolves d-hole relaxation in copper nanocubes,” ACS Energy Letters 4, 2458–2465 (2019).
- Zijlstra, Chon, and Gu (2009) P. Zijlstra, J. W. M. Chon, and M. Gu, “Five-dimensional optical recording mediated by surface plasmons in gold nanorods,” Nature 459, 410–413 (2009).
- Taylor, Kim, and Chon (2012) A. B. Taylor, J. Kim, and J. W. M. Chon, “Detuned surface plasmon resonance scattering of gold nanorods for continuous wave multilayered optical recording and readout,” Optics Express 20, 5069–5081 (2012).
- Lu et al. (2012) G. Lu, L. Hou, T. Zhang, J. Liu, H. Shen, C. Luo, and Q. Gong, “Plasmonic sensing via photoluminescence of individual gold nanorod,” The Journal of Physical Chemistry C 116, 25509–25516 (2012).
- Zhang et al. (2018) K. Y. Zhang, Q. Yu, H. Wei, S. Liu, Q. Zhao, and W. Huang, “Long-lived emissive probes for time-resolved photoluminescence bioimaging and biosensing,” Chemical Reviews 118, 1770–1839 (2018).
- Zhang et al. (2013) T. Zhang, H. Shen, G. Lu, J. Liu, Y. He, Y. Wang, and Q. Gong, “Single bipyramid plasmonic antenna orientation determined by direct photoluminescence pattern imaging,” Advanced Optical Materials 1, 335–342 (2013).
- Lu et al. (2015) G. Lu, Y. Wang, R. Y. Chou, H. Shen, Y. He, Y. Cheng, and Q. Gong, “Directional side scattering of light by a single plasmonic trimer,” Laser & Photonics Reviews 9, 530–537 (2015).
- Carattino, Caldarola, and Orrit (2018) A. Carattino, M. Caldarola, and M. Orrit, “Gold nanoparticles as absolute nanothermometers,” Nano Letters 18, 874–880 (2018).
- Zhang et al. (2019) H. Zhang, W. Han, X. Cao, T. Gao, R. Jia, M. Liu, and W. Zeng, “Gold nanoclusters as a near-infrared fluorometric nanothermometer for living cells,” Microchimica Acta 186, 353 (2019).
- Hastman et al. (2020) D. A. Hastman, J. S. Melinger, G. L. Aragonés, P. D. Cunningham, M. Chiriboga, Z. J. Salvato, T. M. Salvato, C. W. Brown, D. Mathur, I. L. Medintz, E. Oh, and S. A. Díaz, “Femtosecond laser pulse excitation of dna-labeled gold nanoparticles: Establishing a quantitative local nanothermometer for biological applications,” ACS Nano 14, 8570–8583 (2020).
- Shahbazyan (2013) T. V. Shahbazyan, “Theory of plasmon-enhanced metal photoluminescence,” Nano Letters 13, 194–198 (2013).
- Dulkeith et al. (2004) E. Dulkeith, T. Niedereichholz, T. A. Klar, J. Feldmann, G. von Plessen, D. I. Gittins, K. S. Mayya, and F. Caruso, “Plasmon emission in photoexcited gold nanoparticles,” Physical Review B 70, 205424 (2004).
- Cheng et al. (2018) Y. Cheng, W. Zhang, J. Zhao, T. Wen, A. Hu, Q. Gong, and G. Lu, “Understanding photoluminescence of metal nanostructures based on an oscillator model,” Nanotechnology 29, 315201 (2018).
- Zhang et al. (2020) W. Zhang, T. Wen, L. Ye, H. Lin, Q. Gong, and G. Lu, “Influence of non-equilibrium electron dynamics on photoluminescence of metallic nanostructures,” Nanotechnology 31, 495204 (2020).
- Prodan et al. (2003) E. Prodan, C. Radloff, N. J. Halas, and P. Nordlander, “A hybridization model for the plasmon response of complex nanostructures,” Science 302, 419–422 (2003).
- Jain, Huang, and El-Sayed (2007) P. K. Jain, W. Huang, and M. A. El-Sayed, “On the universal scaling behavior of the distance decay of plasmon coupling in metal nanoparticle pairs: A plasmon ruler equation,” Nano Letters 7, 2080–2088 (2007).
- Griffiths (2013) D. J. Griffiths, Introduction to Electrodynamics (4rd Edition) (Pearson, 2013).
- Su et al. (2003) K.-H. Su, Q.-H. Wei, X. Zhang, J. J. Mock, D. R. Smith, and S. Schultz, “Interparticle coupling effects on plasmon resonances of nanogold particles,” Nano Letters 3, 1087–1090 (2003).
- Sönnichsen et al. (2005) C. Sönnichsen, B. M. Reinhard, J. Liphardt, and A. P. Alivisatos, “A molecular ruler based on plasmon coupling of single gold and silver nanoparticles,” Nature Biotechnology 23, 741–745 (2005).
- Hu et al. (2012) H. Hu, H. Duan, J. K. W. Yang, and Z. X. Shen, “Plasmon-modulated photoluminescence of individual gold nanostructures,” ACS Nano 6, 10147–10155 (2012).