UNCOVER: The rest ultraviolet to near infrared multiwavelength structures and dust distributions of sub-millimeter-detected galaxies in Abell 2744
Abstract
With the wavelength coverage, sensitivity, and high spatial resolution of JWST, it is now possible to peer through the dust attenuation to probe the rest-frame near infrared (NIR) and stellar structures of extremely dusty galaxies at cosmic noon (). In this paper we leverage the combined ALMA and JWST/HST coverage in Abell 2744 to study the multiwavelength () structures of 11 sub-millimeter (sub-mm) detected galaxies at that are fainter than bright “classical” sub-mm galaxies (SMGs); 7 of which are detected in deep X-ray data. While these objects reveal a diversity of structures and sizes, all are smaller and more concentrated towards longer wavelengths. Of the X-ray-detected objects, only two show evidence for appreciable AGN flux contributions (at ). Excluding the two AGN-dominated objects, the smaller long wavelength sizes indicate that their rest-frame NIR light profiles, inferred to trace their stellar mass profiles, are more compact than their optical profiles. The sub-mm detections and visible dust lanes suggest centrally-concentrated dust is a key driver of the observed color gradients. Further, we find that more concentrated galaxies tend to have lower size ratios (rest-frame NIR to optical); this suggests that the galaxies with the most compact light distributions also have the most concentrated dust. The 1.2mm flux densities and size ratios of these 9 objects suggest that both total dust quantity and geometry impact these galaxies’ multiwavelength structures. Upcoming higher resolution 1.2mm ALMA imaging will facilitate joint spatially-resolved analysis and will directly test the dust distributions within this representative sub-mm population.
1 Introduction
The universe looks very different in the sub-millimeter (sub-mm) than at shorter wavelengths. Galaxies which are bright in the sub-mm are often faint or undetected at optical or near infrared (NIR) wavelengths, as their high dust content attenuates the shorter wavelength light and then re-emits this energy as thermal continuum in sub-mm to millimeter (mm) wavelengths (e.g., Casey et al. 2014). These sub-mm detected galaxies are typically distant (), massive, dusty, and star-forming (e.g., Casey et al. 2014, Smith et al. 2017, Dudzevičiūtė et al. 2020; Hodge & da Cunha 2020). However, their detailed rest-frame NIR structures, which contain key information about their formation, remained uncertain with previously available observations.
The sensitivity of sub-mm and mm interferometers, particularly ALMA, has opened a window to directly study the impacts of dust well below the limits of ultraluminous infrared galaxies (ULIRGs) and classical bright sub-millimeter galaxies (SMGs), revealing dust continuum and obscured star formation even in “main sequence” star-forming galaxies. Probing the faint sub-mm population requires deep field or lensing cluster surveys, and there have been relatively limited ALMA studies in the flux density regime to date (e.g., Fujimoto et al. 2016, Aravena et al. 2016, González-López et al. 2020, Gómez-Guijarro et al. 2022, Muñoz Arancibia et al. 2023). However, these surveys have shown that the dust content in the fainter population is still significant, with of star formation at cosmic noon () obscured by dust (e.g., Dunlop et al. 2017). Thus, a full picture of galaxy assembly at cosmic noon requires an understanding of these lower sub-mm luminosity sources.
While the detailed substructures of bright dusty objects such as SMGs have been accessible with ALMA and NOEMA (revealing merging starbursts as well as disks; e.g., Hodge et al. 2016, 2019, Rujopakarn et al. 2016, Calistro Rivera et al. 2018, Lang et al. 2019, Puglisi et al. 2019, Tadaki et al. 2020), reaching the fainter population at high spatial resolution to map the dust continuum has remained a challenge, requiring very long exposures even with ALMA’s sensitivity. Little is known about this population’s intrinsic structures, including their distribution of dust and active star formation, leaving us without a complete picture of how this faint sub-mm population builds up or whether this population represents a particular evolutionary phase in galaxy formation.
An alternative, complementary avenue to characterize the dust distribution and obscured structures in faint sub-mm sources is using high-resolution rest-optical imaging to probe the stellar distribution directly. Prior to JWST, the high spatial resolution and sensitivity Hubble Space Telescope (HST) enabled detailed structural measurements, but its limited wavelength coverage (up to ) probed only as far as the rest frame optical at cosmic noon. And while Spitzer had longer wavelength coverage to probe the rest-frame near infrared (NIR) at these redshifts, it lacked the spatial resolution necessary to map stellar structures. Consequently, past structural measurements have typically been based on one HST filter at the rest-optical. However, dust complicates the interpretation of galaxies’ rest-optical structures. In particular, dust (as well as age and metallicity, which also contribute to radial color gradients) has been shown to result in dramatically different stellar size estimates depending on the dust concentration and distribution, as probed by relative differences between half-mass and half-light sizes (e.g., Wuyts et al. 2012, Liu et al. 2016, 2017, Suess et al. 2019, Miller et al. 2023, Zhang et al. 2023). Mock observations have also found dust geometry to be a major complication in structural interpretation of dusty galaxies (Popping et al. 2022, Zhang et al. 2023).
With the launch of JWST (Gardner et al., 2023), it is now possible to obtain high resolution imaging over an expanded wavelength range from out to (corresponding to the rest-frame at ), providing information across the full stellar spectral energy distribution (SED). Critically, this coverage includes the rest-frame NIR probing the largely unattenuated stellar continuum. In addition to enabling robust measurements of sizes and stellar densities, comparing the rest-frame NIR with the rest-frame UV/optical (“color gradients”) allows us to constrain radial variations in mass-to-light ratios. These color gradients can be driven by non-uniform dust distributions or variations in relative stellar ages and/or metallicities; therefore, color gradients also indicate where active growth occurs in galaxies now relative to their past (e.g., Suess et al. 2021, 2022, 2023). Early results from JWST point to dust distribution as a major contributor to observed color profiles (e.g., Miller et al. 2022; also Suess et al. 2022) and without the simultaneous rest-NIR coverage, intrinsic size estimates may be biased towards larger values (e.g., Zhang et al. 2023, among others).
By combining JWST/NIRCam imaging with existing shorter wavelength HST imaging, we can now perform detailed multiwavelength structural studies of the distribution of stars, dust, and star formation in extremely dusty distant galaxies, revealing new insights about the nature and formation of this population. A number of studies have already leveraged early JWST observations to constrain the structures of distant dusty galaxies, including both sub-mm detected galaxies (including Cheng et al. 2022, 2023, Gillman et al. 2023, Kokorev et al. 2023, Rujopakarn et al. 2023, Smail et al. 2023, Wu et al. 2023, Boogaard et al. 2024) and other dusty galaxies (e.g., Gómez-Guijarro et al. 2023, Le Bail et al. 2024, Liu et al. 2023, Nelson et al. 2023, Magnelli et al. 2023). Building upon these works, we study the structures of a sample of galaxies within a cluster field, where the strong lensing boost allows us to examine the relation between total dust content and detailed multiwavelength structures for a variety of galaxies pushing to faint intrinsic fluxes and compact physical sizes.
Here we present a multiwavelength () structural analysis of 11 sub-mm detected () galaxies in the Abell 2744 cluster field as measured with HST and JWST. This sample includes all galaxies detected in ALMA continuum observations of the Abell 2744 primary cluster core from the ALMA Lensing Cluster Survey (ALCS; Fujimoto et al. 2023a) and ALMA-Hubble Frontier field (ALMA-HFF; Muñoz Arancibia et al. 2023) programs. We visually examine the rest-optical and NIR structures, then quantify the multiwavelength structures by fitting single component models and deriving residual-corrected flux profiles in every filter for the full sample. We also calculate the ratio of sizes between long () and short () wavelengths, which is sensitive to color gradient strengths probing radial changes in dust, age, or metallicity. Dust is expected to be an important driver of these color gradients, given this sample is sub-mm detected and a subset exhibits signatures consistent with dust lanes or patchy dust distributions. Finally, we examine the structural measurements together with the intrinsic, lensing-corrected 1.2mm flux densities, to probe the impact of both dust quantity and geometry on these galaxies’ multiwavelength structures.
Throughout this work we adopt a flat CDM cosmology with , , and .
2 Data
To study the rest-frame UV to near infrared (NIR) structures of sub-mm detected galaxies at cosmic noon (), we leverage the combination of low spatial resolution ALMA continuum observations (beam FWHM ; Fujimoto et al. 2023a) with deep, high spatial resolution JWST/HST coverage available for the Abell 2744 cluster field. We select galaxies from ALCS (Kokorev et al. 2022, Sun et al. 2022, Fujimoto et al. 2023a; including ALMA-HFF observations; González-López et al. 2017, Muñoz Arancibia et al. 2023), as presented in Fujimoto et al. (2023a). We include both sources in the ALCS 1.2mm continuum blind (; ) and IRAC-prior ( and ; ) detection catalogs, for a total of 11 galaxies.
For this analysis, we use all public JWST/NIRCam (F115W, F150W, F200W, F277W, F356W, F410M, F444W) and HST/ACS (F435W, F606W, F814W) and WFC3 (F105W, F125W, F140W, F160W) imaging covering Abell 2744. Mosaics for all filters are produced with a common WCS grid using grizli (1.8.16.dev12; Brammer 2019, Kokorev et al. 2022) and astrodrizzle (Gonzaga et al., 2012), with JWST/NIRCam short wavelength (SW; F115W, F150W, F200W) filters drizzled onto a 20mas scale, while JWST/NIRCam long wavelength (LW; F277W, F356W, F410M, F444W) and HST filters are drizzled onto a 40 mas scale.111https://s3.amazonaws.com/grizli-v2/JwstMosaics/v7/index.html See Bezanson et al. (2024) for full details of the imaging reduction and mosaicing. Background subtraction and modeling and subtraction of bright cluster galaxies is then performed, as detailed in Weaver et al. (2024).
The ALCS sources are matched to JWST-detected sources from the UNCOVER photometric catalog (DR2; Weaver et al. 2024) with a search radius of . NIR counterparts for all ALCS sources are identified. However, in two cases (UNCOVER IDs 9018, 24143; denoted throughout with an asterisk), visual inspection reveals the galaxies are shredded into multiple sources in the UNCOVER catalog as a result of the detection deblending thresholds, which were optimized to detect faint, high-redshift sources. As the photometry and segmentation maps are used for simultaneous modeling or masking of neighboring objects in the structural modeling (see Sec. 3), for these two objects we instead perform an alternative detection (using SEP; Barbary 2018) with less aggressive deblending parameters (KERNEL=3.5 pixel FWHM Gaussian, MINAREA=3 pixels, , DEBLEND_NTHRESH=8, DEBLEND_CONT=0.0001, CLEAN=Y, CLEAN_PARAM=1.0), and use the resulting segmentation maps and photometric parameters (derived using the same photometric pipeline as Weaver et al. 2024 except for the parameter changes) for structural modeling of these two galaxies. We calculate the magnifications () for each object from the updated lensing model by Furtak et al. (2023, v1.1), adopting the best-available redshifts. We also estimate stellar masses from the HST and JWST photometry, as well as the 1.2mm ALMA fluxes (from the most recent DUALZ catalog; Fujimoto et al. 2023b) using the same procedure as the UNCOVER DR2 stellar population synthesis (SPS) catalog (Wang et al., 2024), with the following modifications. First, we fix the redshifts to or when available. Second, we use the alternative, less deblended photometry measured for the aforementioned two objects. For the single object with only a (16840), we use the redshift and stellar mass directly from the DR2 SPS catalog (Wang et al., 2024). For clarity, we emphasize that all physical properties (i.e., stellar mass and physical size) and the intrinsic 1.2mm flux densities are corrected for gravitational lensing using the magnification .
We use deep Chandra X-ray maps of Abell 2744 (2.1Ms, presented in Bogdán et al. 2024, considering both blind and IRAC-prior detections) to determine if any of these objects host AGN. We find that the majority of our sample is X-ray detected (7/11: 24143*, 26131, 43148, 24852, 21972, 14034, 24823), likely hosting AGN. This suggests that the high AGN fraction amongst somewhat brighter sub-mm selected galaxies (e.g., Serjeant et al., 2010; Shim et al., 2022) continues even towards lower sub-mm fluxes. This X-ray detection fraction is even higher than found by previous studies for brighter sub-mm-detected galaxies (e.g., Laird et al., 2010; Johnson et al., 2013; Wang et al., 2013).222We defer any comparison of AGN and X-ray-detection fractions among faint () sub-mm-detected galaxies compared to brighter sub-mm-detected populations to future analysis. Objects which are X-ray detected are noted in figures throughout this work. As discussed later (see Sec. 3, Appendix A), we determine that the host galaxy dominates the light even out to in 5 of these objects (24143*, 26131, 43148, 24852, 21972); we therefore infer that these objects host highly obscured AGN, such that we can still analyze the wavelength-dependent host galaxy morphology. We infer that the other 2 objects (14034, 24823) host dust-reddened AGN, which start to appreciably contribute to the total flux at .
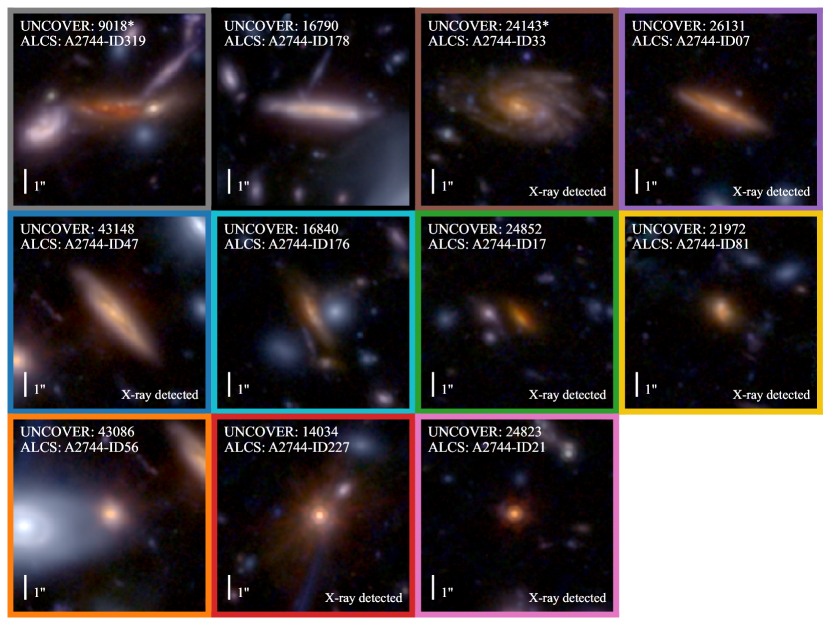
Color composite JWST images for our sample are shown in Fig. 1, and the sample IDs, positions, best-available redshifts, magnifications, and stellar masses are listed in Table 1. For structural modeling, we use empirical PSFs constructed for each band from unsaturated stars within the mosaic, renormalized so the energy enclosed within aligns with typical calibration levels (see Weaver et al. 2024 for full details).
3 Methods
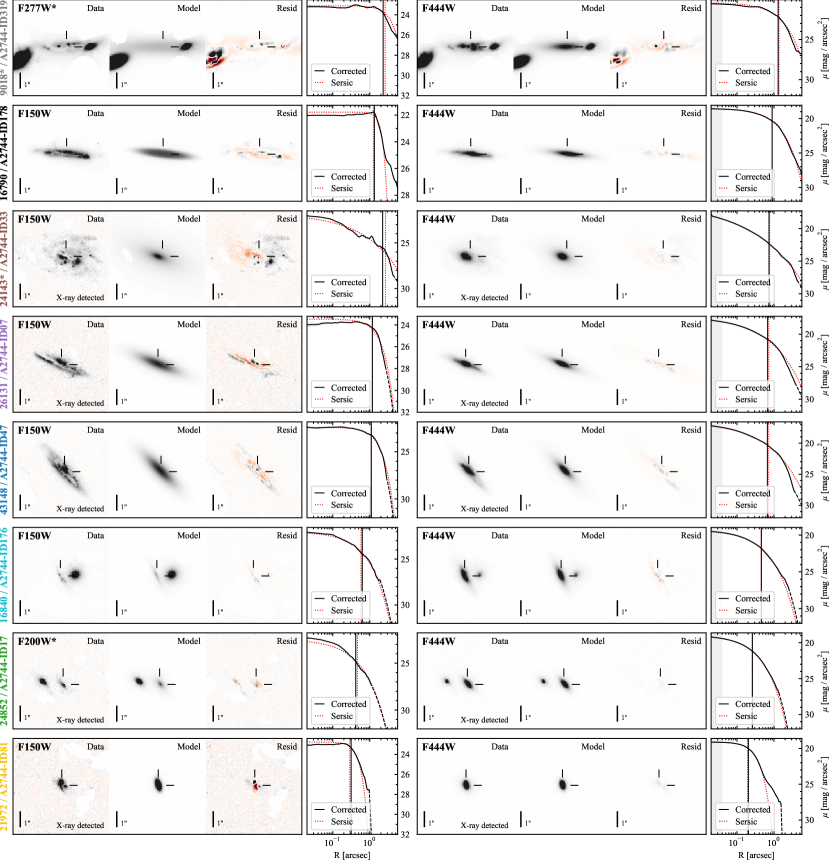
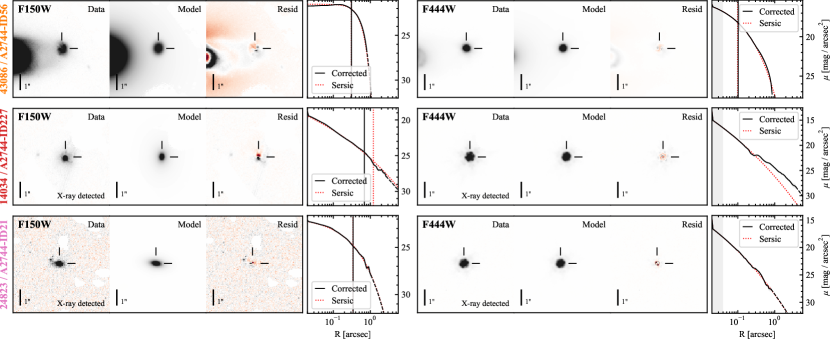
To measure the multiwavelength structural parameters of our sample, we perform single Sérsic component fits in the image plane using GALFIT (Peng et al., 2002, 2010) on cutouts (from the original resolution, non-PSF matched images) in all filters where the integrated galaxy flux has . First, we fit the parameters in F444W, using initial values based on the detection catalog and adopting parameter limits on the Sérsic index (), major axis effective radius (), and axis ratio (), while requiring the total magnitude to be within and the center position to within pixels of the initial values. We simultaneously fit any neighboring objects with (considered over all filters X) and with any part of their segmentation maps falling within of the primary object, and mask all other detected objects are using the detection segmentation maps. We then fit in all other filters in which the galaxy has , fixing the position and PA of all objects to the F444W values. For all filters, we flag the fit if GALFIT returns a flag or if one of the parameters reaches the enforced limit (with the exception that we do not flag fits where or ). Additionally, as some of our objects are nearly point sources in the reddest filters, we do not flag fits where only has numerical stability issues and .
We modify this procedure if , as the position angle (PA) may be poorly constrained. In this case, we fix the positions to the best-fit and perform an intermediate fit on the shortest-wavelength JWST filter with to determine the galaxy’s PA. After this SW filter fit, we refit F444W with the positions and PA of all objects fixed, and then fit all remaining filters as in the normal procedure. We show example short and long wavelength GALFIT model results for each object (F150W if fit and unflagged, otherwise F200W/F277W; and F444W) in the first three panels of the left and right columns in Fig. 2.
As single Sérsic component fits do not capture galaxy substructures (which are clearly present in many of the filters for galaxies in our sample), we also compute residual-corrected flux profiles and corrected effective radii for all filters following Szomoru et al. (2010, 2012). We compute residual flux profiles from the GALFIT model residual images (masking all neighboring objects) using elliptical annular apertures with fixed PA and axis ratio based on each band’s best-fit values. We then determine uncertainties using derived per-band empty aperture scaling relations (to capture correlated noise; as in Skelton et al. 2014). We show these residual-corrected and GALFIT Sérsic fit surface brightness profiles and respective effective radii (, ) for example short and long wavelength bands (F150W or F200W and F444W) of each object in the fourth panel of each column in Fig. 2. We note that the parametric Sérsic are in fairly good agreement with the corrected (median / = 1.01) suggesting that to at least first order the single-component fits capture the average light distributions fairly well, even in the presence of the observed substructures.
Because structural fitting is performed in the image plane, we must account for the lensing magnification on sizes. As our sample has only modest magnifications of , we correct for lensing with a factor of . Throughout this paper, all physical sizes have been corrected for both cosmology and this lensing factor. Angular sizes, as measured directly in the image plane, are uncorrected for lensing.
As an alternative to the parametric Sérsic index, we also derive the empirical concentration as defined in Conselice (2003) for all filters. We calculate the concentration from the residual-corrected flux profiles, in order to mitigate the impact of PSF-broadening (compared to measuring from the observed images).
We also investigate the impact of dust-reddened or dust-obscured AGN on the morphologies of the X-ray detected objects in our sample (7/11). We perform a second, alternative set of morphological fits, using the same methodology as above but adding a point source component. The point source-to-extended flux ratios from these fits are presented in Appendix A, and also discussed in Sec. 4. For the analysis that follows, we exclude objects with appreciable () estimated point-source AGN flux contribution, and use morphological parameters derived from the single-component Sérsic fits in the analysis.
4 Results
Our multiwavelength imaging of these 11 ALMA-detected galaxies reveals a diversity of structures. Visual inspection (i.e., Figs. 1 & 2) reveals galaxies that appear to be large disks, both edge-on (9018*, 16790, 26131, 43148; see also Kokorev et al. 2023 for other analysis of 9018*/ID319, which Kokorev et al. report may be in the early phases of a merger with the compact companion to the West given its undisturbed disk morphology) and more face-on (24143*; see also Wu et al. 2023). The sample also includes other smaller galaxies that appear disk-like and edge-on (16840, 24852), a small galaxy that appears to be a moderately inclined disk with a misaligned dust lane but may be irregular (21972), and small objects which are irregular at short wavelengths but appear compact and round at long wavelengths (43086; also 14034, 24823; see Sec. 3, Appendix A, and below).
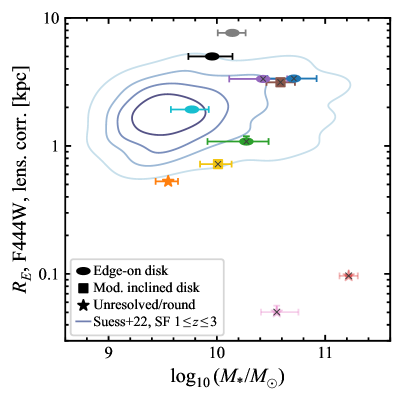
Quantitatively, the sample also exhibits a wide range structural parameter values. In Fig. 3 we show versus inferred stellar masses for our sample. Our sample ranges from low () to high () stellar mass. We find some of the objects visually that are identified as large disks lie above the mass-size distribution of “normal” star-forming galaxies at from Suess et al. (2022), while the remainder of edge-on and moderately-inclined disks fall within the scatter of the Suess et al. sample. Unresolved/round objects include one galaxy (with the lowest stellar mass) just barely below the population scatter.
The two most extremely small objects (14034, 24823) host dust-reddened X-ray detected AGN. Based on alternative Sérsic+point source morphological fits, these objects have appreciable () AGN flux contributions at long wavelengths (; see Sec. 3 and Appendix A), and are therefore excluded from the later structural analysis. The other 5 X-ray-detected objects appear to have fully obscured AGN even at (i.e., minimal point source flux contribution), with the HST and JWST-derived morphology are dominated by the host galaxy (see Sec. 3 and Appendix A). These 5 objects are retained in the sample, and the morphological parameters derived from the single-Sérsic fits are adopted for the remainder of this analysis.
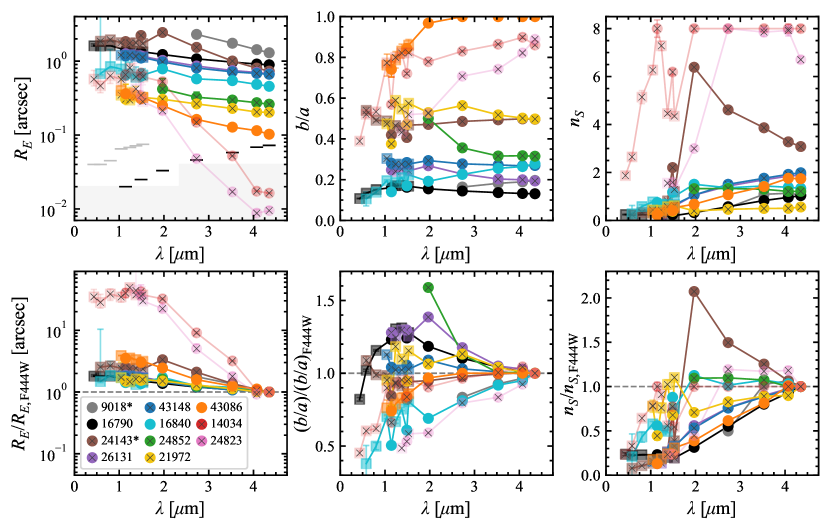
In Fig. 4, we consider measured structural parameters (effective radius, axis ratio, and Sérsic index) as a function of wavelength. We find sizes spanning orders of magnitude at a given wavelength, axis ratios spanning from , and Sérsic indices ranging from in HST/ACS F435W to in JWST/NIRCam F444W. The three galaxies with the smallest in F444W () have sufficiently concentrated long-wavelength light distributions (as evidenced by their relatively high ) to exhibit visible diffraction spikes in the log-scale color images (Fig. 1). We do note that the presented structural parameters are sensitive to a number of additional systematic uncertainties. Previous work has shown systematic uncertainties can be important for GALFIT-derived morphological parameters (e.g., van der Wel et al. 2012), likely leading to underestimates of the total uncertainties presented in this work. We attempt to account for some of these systematic uncertainties (due to non-smooth galaxy light profiles) by using residual corrections to derive , though this does not provide corrections for other, directly-measured structural parameters (i.e., , ).
We also observe common trends in the variation of the structural parameters with wavelength, as seen in Fig. 4 (showing both the measured structural parameters, top, and the trends normalized to the values in F444W, bottom). With increasing wavelength, we find decreases and generally increases, with each galaxy appearing more compact and concentrated at longer wavelengths. (We find a similar trend of increasing with wavelength, in agreement with the trend.) We also find the axis ratios do not drastically change with wavelength (i.e., varying only by ), with the exception of three objects that are extremely compact at long wavelengths (43086; and the two hereafter excluded dust-reddened AGN, 14034, 24823).
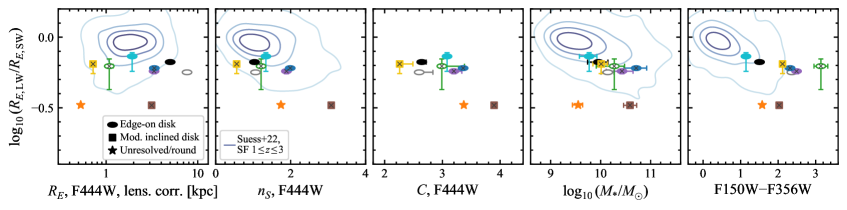
Changes in morphology with wavelength, or equivalently color gradients, reflect non-uniform dust distributions as well as relative age or metallicity changes. Color gradients thus provide a powerful probe of how galaxies assemble their stellar mass profiles (e.g., Suess et al. 2021, 2023). In these sub-mm detected galaxies, we infer that dust is a primary driver of the observed color gradients and morphological changes with wavelength, as we will discuss later. Thus to estimate the radial distribution of dust, we calculate a size ratio between a long () and and short wavelength () band, probing the rest-frame NIR and optical, respectively, for this sample. We use F444W as the LW band, and preferentially use F150W (if the galaxy has sufficient SNR and an unflagged fit in that band), or otherwise F200W or F277W, as the SW band. These size ratios are shown as a function of F444W in kpc (corrected for lensing using as in Fig. 3), , and in Fig. 5. Our sample has size ratios that range from relatively mild values (), similar to those observed in HST-selected star-forming galaxies by Suess et al. (2022), down to steeper ratios () for the more compact objects in F444W.
While we observe a correlation between and , where the smallest objects have the most extreme gradients, we find more clear anti-correlations between and and the size ratio. The Suess et al. (2022) sample also show slight tails of stronger gradients towards lower and higher , though the observed trend for the sub-mm detected galaxies extends far beyond the region spanned by “typical” SFGs.
We also consider the size ratios versus stellar mass, (fourth panel). We find that most (7/9) of our sample (excluding the two X-ray detected objects hosting dust-reddened AGN that contribute to the long-wavelength flux) roughly overlaps with the anti-correlation trend found by Suess et al. (2022), but the remaining two galaxies have lower size ratios at a fixed stellar mass. This suggests that stellar mass alone does not set galaxies’ size ratios and that measures of long wavelength central concentration (i.e., or ) correlate more strongly with size ratio (in contrast to Gómez-Guijarro et al. 2023, who find dust concentration correlates most strongly with mass).
Finally, we examine the size ratios as a function of the integrated observed F150W–F356W color, which approximates the rest-frame V–J color for our sample redshift (; Fig. 5, fifth panel). Again, this is consistent with the anti-correlation of with rest-frame V–J found by Suess et al. (2022). Our sample extends that trend to redder objects. In Fig. 5 we show that most (7/9) of our sample continues the – V–J trend shown by the Suess et al. contours; however, our galaxy sample also includes two objects that have lower size ratios than expected given their color (as also seen with stellar mass).
Rest-frame UVJ colors have been proposed to help distinguish between color gradients that are driven by dust versus age (e.g., Miller et al., 2022, 2023), though Leja et al. 2019 caution that interpretation of spatially-resolved UVJ colors with respect to dust gradients requires further testing. This analysis relies on the fact that more dust tends to produce redder U–V colors and redder V–J colors, where as older ages tend to produce redder U–V colors but bluer V–J colors. To test our rest-frame color gradients, we use EAzY-Py (Brammer et al. 2008; using tweak_fsps_QSF_12_v3 templates) to interpolate, or for 4 objects, slightly extrapolate, the residual-corrected deconvolved profiles (as in Fig. 2) to construct rest-frame UVJ color profiles. We find that all galaxies in our sample have both redder U–V and V–J colors in the centers than the outskirts, consistent with increasing dust attenuation towards their centers. Combined with the sub-mm detection, the visible signatures consistent with dust lanes or patchy dust distributions in some objects, and the emergence of a stellar bar at long wavelengths for at least one object (43148, which cannot be explained by stellar age gradients), these signatures are consistent with high central dust concentrations being an important driver of the observed color gradients. Accurately detangling the contribution of dust attenuation and age to the observed color profiles will require pixel-to-pixel resolved SED fitting. Future high-resolution sub-mm observations (e.g., with a forthcoming ALMA Cycle 10 program; PI: V. Kokorev) and spatially-resolved spectroscopy will also provide valuable constraints on the dust attenuation and age profiles.
5 Discussion & Conclusions
This sample demonstrates that the population of sub-mm detected galaxies is not homogeneous in structure. Among our 11 objects, we observe disk-like structures over a range of inclinations and sizes, as well as smaller, more irregular objects that also host extremely compact central components at the longest wavelengths. In the rest-frame NIR (see Fig. 2), these structures are consistent with stellar disks (with a range of central concentrations; 8/11), small spheroidal or face-on stellar disks (1/11), and NIR continuum dominated by heavily dust-reddened AGN that have appreciable AGN flux contributions at long wavelengths (2/11; excluded from the full analysis).
Even with this morphological diversity, we find evidence that within individual galaxies the dust and NIR continuum light distributions are similar. Specifically, we find the size ratios — and thus color gradients — correlate with size and concentration in F444W. As we infer that the color gradients are primarily driven by dust, based on their sub-mm detection, visible dust lane and patchy distributions, and inferred rest-frame UVJ color profiles (Sec. 4), this correlation suggests that the objects with smaller and more concentrated NIR continuum light (assumed to trace the stars, for all but the 2 excluded dust-reddened X-ray-detected AGN) also have smaller and more compact dust distributions, while objects with less concentrated NIR light also have less concentrated dust. We see further evidence for self-similarity between the NIR continuum and dust distributions from the trend of axis ratios with wavelength: for most objects there is little change in with wavelength, suggesting similar dust geometry to the underlying stellar distribution. For the two excluded dust-reddened X-ray detected AGN, the axis ratio changes reflect the emergence of these point-source AGN as they become less obscured at longer wavelengths, also suggesting distribution self-similarity in order to obscure the central AGN.
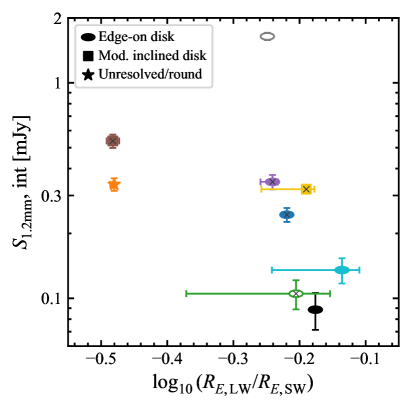
Finally, the distribution of 1.2mm flux densities (using updated fluxes from the recently-released DUALZ catalog by Fujimoto et al. 2023b; Fig. 6) versus size ratios suggests that both dust geometry and total dust quantity (as potentially evidenced by sub-mm flux) are important in setting these galaxies’ multiwavelength structures. For fixed dust-star geometry, increasing the total dust will tend to result in stronger color gradients and more extreme short-to-long wavelength size ratios. Increasing the total dust for a fixed distribution (i.e., increasing the dust column densities) will preferentially attenuate the inner regions compared to the outskirts (assuming dust column density ; Salim & Narayanan 2020), increasing the effective radii at short wavelengths while minimally impacting the long-wavelength sizes (assuming the dust is not optically thick at those wavelengths). This would tend to produce an anti-correlation between the sub-mm flux densities and size ratios.
Variations in dust-star (or dust-star-AGN) geometry — including patchiness in the dust distribution — could change the relation between total dust quantity and color gradient, introducing scatter between the sub-mm flux densities and size ratios. Furthermore, if a galaxy is optically thick even in the rest-frame NIR, dust attenuation would also increase the long-wavelength effective radii relative to the stellar half-mass radii. This could result in larger LW-to-SW size ratios (as both the SW and LW effective radii are larger than the stellar half-mass radius), compared to objects where only the SW is attenuated while the LW is relatively unattenuated.
Our sample exhibits both some degree of anti-correlation between and and notable scatter (including a strong outlier, 9018*, which may be optically thick even in F444W, potentially explaining the unexpectedly high size ratio given the total sub-mm flux density as discussed above). Taken together, we infer that both total dust quantity and dust geometry are important in explaining size ratios. However, we note that non-dust drivers of color gradients (e.g., age gradients) could also introduce scatter. Future analysis of high-resolution maps of the dust continuum, and spatially-resolved stellar population synthesis modeling, will reveal the relative impact of dust quantity and geometry on multiwavelength morphologies and color gradients, and disentangle the impact of non-dust effects.
Furthermore, high (low) sub-mm fluxes can also reflect high (low) incident radiation from star formation or AGN activity. The uncertain AGN contributions to the 1.2mm flux density for the 5 X-ray detected but highly obscured AGN host galaxies retained in this analysis (24143*, 26131, 43148, 24852, 21972) thus complicates the above inferences regarding dust content and dust geometry. Nonetheless, the non-X-ray-detected objects (9018*, 16790, 16840, 43086) span much of the parameter space that might be expected for both total dust and dust geometry contributions to setting the observed size ratios — suggesting that the conclusion that both dust quantity and geometry are important holds even with the high AGN fraction in this sample. High-resolution dust continuum maps will additionally help address this issue, by spatially detangling the central AGN contribution from the extended emission driven by star formation radiation.
This analysis highlights the power of using high-resolution, deep NIR imaging from JWST to unravel the multi-wavelength, multi-component structures of extremely dusty galaxies, which were previously shrouded from view. More detailed observations and modeling to directly recover the stellar mass and dust distributions are necessary to better understand the structures of sub-mm detected galaxies. This type of spatially-resolved spectral energy distribution (SED) modeling would benefit dramatically from higher-resolution ALMA continuum observations, which are forthcoming in an approved ALMA Cycle 10 program (2023.1.00626.S; PI V. Kokorev). Resolved NIR spectroscopy (either from a slit or IFU) would also be critical to directly probe the reddening and thus disentangle the dust, age, and metallicity color degeneracies. Future work with these observations will also determine how well dust and stellar geometries are captured through multiwavelength structural measurements similar to those presented in this work. Finally, JWST and ALMA will continue to map larger fields, including the recently completed ALMA Cycle 9 program DUALZ covering the full extended Abell 2744 cluster (Fujimoto et al., 2023b), yielding significantly larger samples that fully span the demographics of dust-obscured/sub-mm-detected galaxies across cosmic time. Larger samples would enable full explorations of sub populations and constrain their respective evolutionary pathways. Combined with parallel efforts to characterize structures of less extreme galaxy populations, these studies will continue bridging the gap between optical studies of relatively low dust galaxies and sub-mm studies of the most dusty galaxies.
We thank the anonymous referee for a constructive report which has improved this manuscript. This work is based in part on observations made with the NASA/ESA/CSA James Webb Space Telescope. These observations are associated with JWST-GO-2561, JWST-ERS-1324, and JWST-DD-2756. Support for program JWST-GO-2561 was provided by NASA through a grant from the Space Telescope Science Institute, which is operated by the Associations of Universities for Research in Astronomy, Incorporated, under NASA contract NAS5-26555. This research is also based on observations made with the NASA/ESA Hubble Space Telescope obtained from the Space Telescope Science Institute, which is operated by the Association of Universities for Research in Astronomy, Inc., under NASA contract NAS 5?26555. These observations are associated with programs HST-GO-11689, HST-GO-13386, HST-GO/DD-13495, HST-GO-13389, HST-GO-15117, and HST-GO/DD-17231. All of the data presented in this paper were obtained from the Mikulski Archive for Space Telescopes (MAST) at the Space Telescope Science Institute. The specific observations used to produce these mosaics can be accessed via http://dx.doi.org/10.17909/zn4s-0243 (catalog 10.17909/zn4s-0243). This paper makes use of the ALMA data: ADS/JAO. ALMA #2018.1.00035.L, #2019.1.00237.S, #2021.1.01246.S, and #2021.1.00407.S. ALMA is a partnership of the ESO (representing its member states), NSF (USA) and NINS (Japan), together with NRC (Canada), MOST and ASIAA (Taiwan), and KASI (Republic of Korea), in cooperation with the Republic of Chile. The Joint ALMA Observatory is operated by the ESO, AUI/NRAO, and NAOJ. This research was supported in part by the University of Pittsburgh Center for Research Computing, RRID:SCR_022735, through the resources provided. Specifically, this work used the H2P cluster, which is supported by NSF award number OAC-2117681. VK acknowledges funding from the Dutch Research Council (NWO) through the award of the Vici Grant VI.C.212.036. PD acknowledges support from the Dutch Research Council (NWO) through the award of the VIDI Grant 016.VIDI.189.162 (“ODIN”) and the European Commission’s and University of Groningen’s CO-FUND Rosalind Franklin program.
| ID | IDALCS | RA | Dec | Type | Ref. | |||||||
|---|---|---|---|---|---|---|---|---|---|---|---|---|
| (1) | (2) | (3) | (4) | (5) | (6) | (7) | (8) | (9) | (10) | (11) | (12) | |
| 9018* | ID319 | 3.575986 | -30.413174 | 2.580 | 1 | 3,9 | 1.85 | 1.060.01 | ,a | |||
| 16790 | ID178 | 3.600396 | -30.396138 | 0.940 | 2 | 1,5 | 1.98 | 1.030.00 | ||||
| 24143* | ID33 | 3.584924 | -30.381780 | 3.060 | 1 | 1,2,9 | 3.19 | 3.080.01 | ||||
| 26131 | ID07 | 3.579685 | -30.378407 | 2.410 | 1 | 1,2,9 | 2.70 | 1.890.01 | ||||
| 43148 | ID47 | 3.571959 | -30.382986 | 1.670 | 1 | 7 | 2.80 | 1.990.01 | ||||
| 16840 | ID176 | 3.572349 | -30.395966 | 3 | 6 | 2.92 | 1.340.01 | |||||
| 24852 | ID17 | 3.581273 | -30.380227 | 3.475 | 1 | 7,8 | 3.14 | 1.210.00 | ,a | |||
| 21972 | ID81 | 3.582499 | -30.385459 | 3.056 | 1 | 7,8 | 4.65 | 0.560.00 | ||||
| 43086 | ID56 | 3.573258 | -30.383501 | 1.500 | 1 | 1,2,9 | 2.70 | 1.740.03 | ||||
| 14034 | ID227 | 3.568930 | -30.402792 | 2.580 | 2 | 1,5 | 1.85 | 8.000.13 | ||||
| 24823 | ID21 | 3.592096 | -30.380472 | 2.640 | 1 | 1,2,9 | 2.28 | 6.700.14 | ||||
Note. — (1) UNCOVER ID (DR2; Weaver et al. 2024). (2) ALCS ID (Fujimoto et al., 2023a), omitting the prefix ‘A2744’. (3) UNCOVER catalog coordinate (J2000). (4) Best available redshift. (5) Redshift type: 1: spectroscopic, 2: HST grism, 3: photometric. (6) References: 1: Fujimoto et al. (2023a), 2: Muñoz Arancibia et al. (2023), 3: Kokorev et al. (2023), 4: Laporte et al. (2017), 5: Wang et al. (2015), 6: Wang et al. (2024, UNCOVER, DR2 SPS catalog), 7: Fujimoto et al. (2023b, DUALZ), 8: Price et al. (2024, UNCOVER, DR4), 9: F. Bauer et al., in prep (ALCS). (7) Magnification (using the updated v1.1 model of Furtak et al. 2023). (8) Stellar mass from Prospector as in Wang et al. (2024), with fixed redshift when or is available and using alternative deblended photometry for noted objects (see Sec 2). (9) Residual-corrected major axis effective radius measured in F444W, uncorrected for lensing, in arcsec. (10) GALFIT Sérsic index in F444W. (11) Concentration parameter measured from the F444W residual corrected flux profiles. (12) Ratio of long to short wavelength residual-corrected effective radii. By default, F444W and F150W are used for the LW and SW radii, respectively. If F150W has insufficient SNR or a flagged fit, F200W or next F277W is used instead (noted with a). Annotation: *: Alternative detection and segmentation used for morphological analysis and stellar population modeling (see Sec. 2).
Appendix A Evaluation of point-source flux contributions from AGN in X-ray-detected objects
To investigate the impact of AGN on the morphologies of the 7 X-ray detected objects in our sample (24143*, 26131, 43148, 24852, 21972, 14034, 24823), we perform an alternative set of morphological fits with GALFIT, including a point source as well as a Sérsic component. These fits are performed using the same methodology as the fiducial, single Sérsic component fits (as described in Sec. 3). The total magnitude of the point source component is free, and its location is tied or fixed to coincide with the center of the Sérsic component (depending on whether the Sérsic center is free or not for the specific filter, as noted in the procedure).
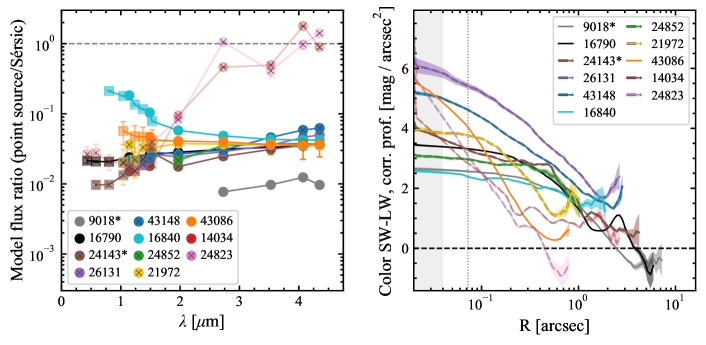
The measured flux ratio between the point source flux and the total Sérsic component flux (Fig. 7a) is typically very small, with the point source as bright as the Sérsic component (or magnitudes fainter). Appreciable (assumed to be ) point source flux contributions among the X-ray-detected sources are only seen for 14034 & 24823, and only at long wavelengths (). (A non-X-ray-detected source, 16840, shows elevated point source flux at short wavelengths , which we attribute to an opportunely located light clump and patchy dust, which fades in prominence towards less-attenuated longer wavelengths.) Overall, we find that the Sérsic parameters derived for these alternative two-component fits are very similar to those from the fiducial, single component fits (e.g., median ratio of Sérsic component ), further supporting the lack of impact of a point source to the morphologies for most objects at most wavelengths.
We also examine the residual-corrected, intrinsic short-to-long wavelength color profiles of the sample for indications of AGN-dominated central colors that differ from the overall galaxy. We measure residual-corrected surface brightness profiles using the single-component Sérsic fits (as in Fig. 2), measuring the residuals within elliptical annuli using the same PA and axis ratio based on the F277W best-fit values for both the SW (F150W, or F200W or next F277W if insufficient SNR in F150W) and the LW (F444W) residual images. All objects demonstrate negative color gradients, with very red centers, continuing to less red colors out to the outskirts. Overall, we observe no obvious change in color profile at the PSF scale for the 5 X-ray-detected objects without appreciable point source flux contributions (24143*, 26131, 43148, 24852, 21972). This suggests that the inferred highly-obscured AGN in these objects do not dominate the color gradients, or the measured short-to-long wavelength size ratios.
When combined with the color profiles, we infer that the host galaxies dominate the light in 5 of the X-ray-detected sources (24143*, 26131, 43148, 24852, 21972), and that these objects likely host highly obscured AGN (given lack of a point source component even at ). As a point source contributes of the flux at for 14034 & 24823, we infer these remaining X-ray-detected objects host a dust-reddened, but not fully obscured AGN. As accurately detangling the host galaxy morphology from the AGN contribution can be challenging, we choose to exclude these objects from the detailed morphological analysis in this work. We thus also use parameters derived from the fiducial, single-component Sérsic fits (reflecting the host galaxy of the remaining X-ray-detected objects) for all analysis.
References
- Aravena et al. (2016) Aravena, M., Decarli, R., Walter, F., et al. 2016, ApJ, 833, 68, doi: 10.3847/1538-4357/833/1/68
- Astropy Collaboration et al. (2013) Astropy Collaboration, Robitaille, T. P., Tollerud, E. J., et al. 2013, A&A, 558, A33, doi: 10.1051/0004-6361/201322068
- Astropy Collaboration et al. (2018) Astropy Collaboration, Price-Whelan, A. M., Sipőcz, B. M., et al. 2018, AJ, 156, 123, doi: 10.3847/1538-3881/aabc4f
- Astropy Collaboration et al. (2022) Astropy Collaboration, Price-Whelan, A. M., Lim, P. L., et al. 2022, ApJ, 935, 167, doi: 10.3847/1538-4357/ac7c74
- Barbary (2018) Barbary, K. 2018, SEP: Source Extraction and Photometry, Astrophysics Source Code Library, record ascl:1811.004. http://ascl.net/1811.004
- Bezanson et al. (2024) Bezanson, R., Labbe, I., Whitaker, K. E., et al. 2024, ApJ, 974, 92, doi: 10.3847/1538-4357/ad66cf
- Bogdán et al. (2024) Bogdán, Á., Goulding, A. D., Natarajan, P., et al. 2024, Nature Astronomy, 8, 126, doi: 10.1038/s41550-023-02111-9
- Boogaard et al. (2024) Boogaard, L. A., Gillman, S., Melinder, J., et al. 2024, ApJ, 969, 27, doi: 10.3847/1538-4357/ad43e5
- Bradley (2023) Bradley, L. 2023, astropy/photutils: 1.8.0, 1.8.0, Zenodo, Zenodo, doi: 10.5281/zenodo.7946442
- Brammer (2019) Brammer, G. 2019, Grizli: Grism redshift and line analysis software, Astrophysics Source Code Library, record ascl:1905.001. http://ascl.net/1905.001
- Brammer et al. (2008) Brammer, G. B., van Dokkum, P. G., & Coppi, P. 2008, ApJ, 686, 1503, doi: 10.1086/591786
- Calistro Rivera et al. (2018) Calistro Rivera, G., Hodge, J. A., Smail, I., et al. 2018, ApJ, 863, 56, doi: 10.3847/1538-4357/aacffa
- Casey et al. (2014) Casey, C. M., Narayanan, D., & Cooray, A. 2014, Phys. Rep., 541, 45, doi: 10.1016/j.physrep.2014.02.009
- Cheng et al. (2022) Cheng, C., Yan, H., Huang, J.-S., et al. 2022, ApJ, 936, L19, doi: 10.3847/2041-8213/ac8d08
- Cheng et al. (2023) Cheng, C., Huang, J.-S., Smail, I., et al. 2023, ApJ, 942, L19, doi: 10.3847/2041-8213/aca9d0
- Conselice (2003) Conselice, C. J. 2003, ApJS, 147, 1, doi: 10.1086/375001
- Dudzevičiūtė et al. (2020) Dudzevičiūtė, U., Smail, I., Swinbank, A. M., et al. 2020, MNRAS, 494, 3828, doi: 10.1093/mnras/staa769
- Dunlop et al. (2017) Dunlop, J. S., McLure, R. J., Biggs, A. D., et al. 2017, MNRAS, 466, 861, doi: 10.1093/mnras/stw3088
- Fujimoto et al. (2016) Fujimoto, S., Ouchi, M., Ono, Y., et al. 2016, ApJS, 222, 1, doi: 10.3847/0067-0049/222/1/1
- Fujimoto et al. (2023a) Fujimoto, S., Kohno, K., Ouchi, M., et al. 2023a, arXiv e-prints, arXiv:2303.01658, doi: 10.48550/arXiv.2303.01658
- Fujimoto et al. (2023b) Fujimoto, S., Bezanson, R., Labbe, I., et al. 2023b, arXiv e-prints, arXiv:2309.07834, doi: 10.48550/arXiv.2309.07834
- Furtak et al. (2023) Furtak, L. J., Zitrin, A., Weaver, J. R., et al. 2023, MNRAS, 523, 4568, doi: 10.1093/mnras/stad1627
- Gardner et al. (2023) Gardner, J. P., Mather, J. C., Abbott, R., et al. 2023, PASP, 135, 068001, doi: 10.1088/1538-3873/acd1b5
- Gillman et al. (2023) Gillman, S., Gullberg, B., Brammer, G., et al. 2023, A&A, 676, A26, doi: 10.1051/0004-6361/202346531
- Gómez-Guijarro et al. (2022) Gómez-Guijarro, C., Elbaz, D., Xiao, M., et al. 2022, A&A, 658, A43, doi: 10.1051/0004-6361/202141615
- Gómez-Guijarro et al. (2023) Gómez-Guijarro, C., Magnelli, B., Elbaz, D., et al. 2023, A&A, 677, A34, doi: 10.1051/0004-6361/202346673
- Gonzaga et al. (2012) Gonzaga, S., Hack, W., Fruchter, A., & Mack, J. 2012, The DrizzlePac Handbook
- González-López et al. (2017) González-López, J., Bauer, F. E., Romero-Cañizales, C., et al. 2017, A&A, 597, A41, doi: 10.1051/0004-6361/201628806
- González-López et al. (2020) González-López, J., Novak, M., Decarli, R., et al. 2020, ApJ, 897, 91, doi: 10.3847/1538-4357/ab765b
- Harris et al. (2020) Harris, C. R., Millman, K. J., van der Walt, S. J., et al. 2020, Nature, 585, 357, doi: 10.1038/s41586-020-2649-2
- Hodge & da Cunha (2020) Hodge, J. A., & da Cunha, E. 2020, Royal Society Open Science, 7, 200556, doi: 10.1098/rsos.200556
- Hodge et al. (2016) Hodge, J. A., Swinbank, A. M., Simpson, J. M., et al. 2016, ApJ, 833, 103, doi: 10.3847/1538-4357/833/1/103
- Hodge et al. (2019) Hodge, J. A., Smail, I., Walter, F., et al. 2019, ApJ, 876, 130, doi: 10.3847/1538-4357/ab1846
- Hunter (2007) Hunter, J. D. 2007, Computing in Science and Engineering, 9, 90, doi: 10.1109/MCSE.2007.55
- Johnson et al. (2021) Johnson, B. D., Leja, J., Conroy, C., & Speagle, J. S. 2021, ApJS, 254, 22, doi: 10.3847/1538-4365/abef67
- Johnson et al. (2013) Johnson, S. P., Wilson, G. W., Wang, Q. D., et al. 2013, MNRAS, 431, 662, doi: 10.1093/mnras/stt197
- Kokorev et al. (2022) Kokorev, V., Brammer, G., Fujimoto, S., et al. 2022, ApJS, 263, 38, doi: 10.3847/1538-4365/ac9909
- Kokorev et al. (2023) Kokorev, V., Jin, S., Magdis, G. E., et al. 2023, ApJ, 945, L25, doi: 10.3847/2041-8213/acbd9d
- Laird et al. (2010) Laird, E. S., Nandra, K., Pope, A., & Scott, D. 2010, MNRAS, 401, 2763, doi: 10.1111/j.1365-2966.2009.15860.x
- Lang et al. (2019) Lang, P., Schinnerer, E., Smail, I., et al. 2019, ApJ, 879, 54, doi: 10.3847/1538-4357/ab1f77
- Laporte et al. (2017) Laporte, N., Bauer, F. E., Troncoso-Iribarren, P., et al. 2017, A&A, 604, A132, doi: 10.1051/0004-6361/201730628
- Le Bail et al. (2024) Le Bail, A., Daddi, E., Elbaz, D., et al. 2024, A&A, 688, A53, doi: 10.1051/0004-6361/202347465
- Leja et al. (2019) Leja, J., Tacchella, S., & Conroy, C. 2019, ApJ, 880, L9, doi: 10.3847/2041-8213/ab2f8c
- Liu et al. (2016) Liu, F. S., Jiang, D., Guo, Y., et al. 2016, ApJ, 822, L25, doi: 10.3847/2041-8205/822/2/L25
- Liu et al. (2017) Liu, F. S., Jiang, D., Faber, S. M., et al. 2017, ApJ, 844, L2, doi: 10.3847/2041-8213/aa7cf5
- Liu et al. (2023) Liu, Z., Morishita, T., & Kodama, T. 2023, ApJ, 955, 29, doi: 10.3847/1538-4357/acef19
- Magnelli et al. (2023) Magnelli, B., Gómez-Guijarro, C., Elbaz, D., et al. 2023, A&A, 678, A83, doi: 10.1051/0004-6361/202347052
- Miller et al. (2023) Miller, T. B., van Dokkum, P., & Mowla, L. 2023, ApJ, 945, 155, doi: 10.3847/1538-4357/acbc74
- Miller et al. (2022) Miller, T. B., Whitaker, K. E., Nelson, E. J., et al. 2022, ApJ, 941, L37, doi: 10.3847/2041-8213/aca675
- Muñoz Arancibia et al. (2023) Muñoz Arancibia, A. M., González-López, J., Ibar, E., et al. 2023, A&A, 675, A85, doi: 10.1051/0004-6361/202243528
- Nelson et al. (2023) Nelson, E. J., Suess, K. A., Bezanson, R., et al. 2023, ApJ, 948, L18, doi: 10.3847/2041-8213/acc1e1
- Peng et al. (2002) Peng, C. Y., Ho, L. C., Impey, C. D., & Rix, H.-W. 2002, AJ, 124, 266, doi: 10.1086/340952
- Peng et al. (2010) —. 2010, AJ, 139, 2097, doi: 10.1088/0004-6256/139/6/2097
- Popping et al. (2022) Popping, G., Pillepich, A., Calistro Rivera, G., et al. 2022, MNRAS, 510, 3321, doi: 10.1093/mnras/stab3312
- Price et al. (2024) Price, S. H., Bezanson, R., Labbe, I., et al. 2024, arXiv e-prints, arXiv:2408.03920, doi: 10.48550/arXiv.2408.03920
- Puglisi et al. (2019) Puglisi, A., Daddi, E., Liu, D., et al. 2019, ApJ, 877, L23, doi: 10.3847/2041-8213/ab1f92
- Rujopakarn et al. (2016) Rujopakarn, W., Dunlop, J. S., Rieke, G. H., et al. 2016, ApJ, 833, 12, doi: 10.3847/0004-637X/833/1/12
- Rujopakarn et al. (2023) Rujopakarn, W., Williams, C. C., Daddi, E., et al. 2023, ApJ, 948, L8, doi: 10.3847/2041-8213/accc82
- Salim & Narayanan (2020) Salim, S., & Narayanan, D. 2020, ARA&A, 58, 529, doi: 10.1146/annurev-astro-032620-021933
- Serjeant et al. (2010) Serjeant, S., Negrello, M., Pearson, C., et al. 2010, A&A, 514, A10, doi: 10.1051/0004-6361/200913483
- Shim et al. (2022) Shim, H., Lee, D., Kim, Y., et al. 2022, MNRAS, 514, 2915, doi: 10.1093/mnras/stac1105
- Skelton et al. (2014) Skelton, R. E., Whitaker, K. E., Momcheva, I. G., et al. 2014, ApJS, 214, 24, doi: 10.1088/0067-0049/214/2/24
- Smail et al. (2023) Smail, I., Dudzevičiūtė, U., Gurwell, M., et al. 2023, ApJ, 958, 36, doi: 10.3847/1538-4357/acf931
- Smith et al. (2017) Smith, D. J. B., Hayward, C. C., Jarvis, M. J., & Simpson, C. 2017, MNRAS, 471, 2453, doi: 10.1093/mnras/stx1689
- Suess et al. (2019) Suess, K. A., Kriek, M., Price, S. H., & Barro, G. 2019, ApJ, 877, 103, doi: 10.3847/1538-4357/ab1bda
- Suess et al. (2021) —. 2021, ApJ, 915, 87, doi: 10.3847/1538-4357/abf1e4
- Suess et al. (2022) Suess, K. A., Bezanson, R., Nelson, E. J., et al. 2022, ApJ, 937, L33, doi: 10.3847/2041-8213/ac8e06
- Suess et al. (2023) Suess, K. A., Williams, C. C., Robertson, B., et al. 2023, ApJ, 956, L42, doi: 10.3847/2041-8213/acf5e6
- Sun et al. (2022) Sun, F., Egami, E., Fujimoto, S., et al. 2022, ApJ, 932, 77, doi: 10.3847/1538-4357/ac6e3f
- Szomoru et al. (2012) Szomoru, D., Franx, M., & van Dokkum, P. G. 2012, ApJ, 749, 121, doi: 10.1088/0004-637X/749/2/121
- Szomoru et al. (2010) Szomoru, D., Franx, M., van Dokkum, P. G., et al. 2010, ApJ, 714, L244, doi: 10.1088/2041-8205/714/2/L244
- Tadaki et al. (2020) Tadaki, K.-i., Belli, S., Burkert, A., et al. 2020, ApJ, 901, 74, doi: 10.3847/1538-4357/abaf4a
- van der Wel et al. (2012) van der Wel, A., Bell, E. F., Häussler, B., et al. 2012, ApJS, 203, 24, doi: 10.1088/0067-0049/203/2/24
- Virtanen et al. (2020) Virtanen, P., Gommers, R., Oliphant, T. E., et al. 2020, Nature Methods, 17, 261, doi: 10.1038/s41592-019-0686-2
- Wang et al. (2024) Wang, B., Leja, J., Labbé, I., et al. 2024, ApJS, 270, 12, doi: 10.3847/1538-4365/ad0846
- Wang et al. (2013) Wang, S. X., Brandt, W. N., Luo, B., et al. 2013, ApJ, 778, 179, doi: 10.1088/0004-637X/778/2/179
- Wang et al. (2015) Wang, X., Hoag, A., Huang, K. H., et al. 2015, ApJ, 811, 29, doi: 10.1088/0004-637X/811/1/29
- Waskom (2021) Waskom, M. 2021, The Journal of Open Source Software, 6, 3021, doi: 10.21105/joss.03021
- Weaver et al. (2024) Weaver, J. R., Cutler, S. E., Pan, R., et al. 2024, ApJS, 270, 7, doi: 10.3847/1538-4365/ad07e0
- Wu et al. (2023) Wu, Y., Cai, Z., Sun, F., et al. 2023, ApJ, 942, L1, doi: 10.3847/2041-8213/aca652
- Wuyts et al. (2012) Wuyts, S., Förster Schreiber, N. M., Genzel, R., et al. 2012, ApJ, 753, 114, doi: 10.1088/0004-637X/753/2/114
- Zhang et al. (2023) Zhang, J., Wuyts, S., Cutler, S. E., et al. 2023, MNRAS, 524, 4128, doi: 10.1093/mnras/stad2066