Ultrafast Ultrasound Imaging for 3D Shear Wave Absolute Vibro-Elastography
Abstract
Shear wave absolute vibro-elastography (S-WAVE) is a 3D quantitative imaging technique that generates steady-state shear waves inside the tissue using multi-frequency excitation from an external vibration source. In this work, plane wave imaging is introduced to reduce total acquisition time while retaining the benefit of a 3D formulation. Plane wave imaging with a frame rate of 3000 frames/s is followed by 3D absolute elasticity estimation. This paper presents two imaging sequences of ultrafast S-WAVE for low frequency and high frequency sets of excitation frequencies using a Verasonics system and a motorized swept ultrasound transducer (3D wobbler) to synchronize ultrasound acquisition with the external mechanical excitation. The overall data collection time is improved by 83-88% compared to the original 3D S-WAVE because of the per-channel acquisition offered by the Verasonics system. The method is validated on four liver fibrosis tissue-mimicking phantoms and initial results are shown on ex vivo bovine liver. The curl operator was previously used in magnetic resonance elastography (MRE) to cancel out the effect of the compressional waves. In this work, we apply the curl operator to the full 3D displacement field followed by 3D elasticity reconstruction. The results of the phantom experiment show that by using the curl of a 3D displacement field, the accuracy of the elasticity estimation improves by 14% with a decrease of the standard deviation (STD) of 18% compared to reconstruction using the curl of a 2D displacement field. The phantom results also demonstrate 12% enhancement in accuracy of elasticity estimation and 45% lower STD compared to the elasticity reconstruction without the curl on a 3D displacement field. We also show the experimental results of a standard method based on acoustic radiation force impulse (ARFI) on the phantoms and an ex vivo sample.
keywords:
\KWDUltrafast elastography
Shear wave absolute vibro-elastography
S-WAVE
3D elastography
Ultrasound
Elasticity estimation
1 Introduction
Measurements of low frequency mechanical vibrations inside the tissue such as shear waves contain useful information about tissue properties including elasticity. The conventional single-line delay and sum algorithm for ultrasound beamforming provides an imaging frame rate of 25 to 50 frames/s for an image with the depth of 5 cm and 128 lines. However, an acquisition frame rate higher than 1000 frames/s is needed for real-time tracking of shear waves which typically travel at speed of 1 to 10 m/s inside the tissue [58]. Plane waves can be used to image the tissue at a frame rate of several thousand frames/s by parallel beamforming for all positions in the medium [59, 50]. High frame rate imaging can therefore reduce imaging time. Shear wave propagation should also be separated from the motion artifacts caused by breathing in many patient examinations as they take place on a slower time scale [58]. Furthermore, local estimation of the tissue stiffness can be improved by higher spatial and temporal sampling rates [58].
Several elasticity imaging techniques have employed ultrafast elastography to increase the frame rate as well as the accuracy of the shear wave tracking. Some of these techniques use acoustic radiation force impulse (ARFI) to generate tissue motion from focused ultrasound beams. Multiple Track Location Shear Wave Elasticity Imaging (MTL-SWEI) includes methods such as Supersonic Shear waves Imaging (SSI) [9], and Comb-push Ultrasound Shear Elastography (CUSE) [55], where a single ARFI excitation is generated inside the tissue and the shear waves are tracked in multiple locations. In this study, we combine ultrafast imaging with the 3D Shear Wave Absolute Vibro-Elastography (S-WAVE) method [1] to provide fast 3D data acquisition, and call our method Ultrafast S-WAVE. In S-WAVE, similar to magnetic resonance elastography (MRE), an external mechanical excitation source generates steady-state shear waves at multiple low frequencies throughout an entire volume. By estimating the tissue displacements, the wave equation can be used to estimate the shear modulus (). By modeling the tissue as a linear, elastic and nearly incompressible material, the elasticity (stiffness) is approximated using the shear modulus through .
Elastography is beneficial in detection, staging and monitoring of the liver disease[60]. Nonalcoholic fatty liver disease (NAFLD) is the most common cause of chronic liver disease which has affected more than 25 of the global population [34] especially in individuals with obesity, hypertension, and diabetes. The progressive version of NAFLD can lead to the fibrosis, cirrhosis, and finally liver death. Furthermore, it has been found that the stage of fibrosis is exponentially linked to the mortality rate of NAFLD [16]. Therefore, determination of the liver fibrosis is important in patient treatment and can be diagnosed using biopsy [12] or liver imaging evidence.
Imaging, as a non-invasive approach, is preferred over liver biopsy, however liver fibrosis has no direct signature detectable by current imaging techniques. Therefore, all the imaging modalities attempt to detect fibrosis indirectly. Stiffness is the leading imaging biomarker for detecting and staging liver fibrosis [17] which can be accessible through elastography. Some of the commercial elastography methods that are clinically used to estimate liver stiffness include: VCTE (Echosens), SWE (Hologic), MRE, ARFI (Philips, Siemens), and S-WAVE (Sonic Incytes). MRE has greater accuracy compared to the other methods [65], however it is more expensive and time consuming. S-WAVE is the most similar elastography method to MRE in terms of using an external excitation source to generate steady-state shear waves inside the liver at frequencies in the range of 40 to 70 Hz. The advantage of the low-frequency vibration source is the high penetration of the shear waves into the entire liver. S-WAVE has been successfully used in liver disease studies [66] as well as other organs such as the placenta [3], the breast [18, 52], the prostate [37], and the kidney [51]. Some of the previous studies reported limitations in using ARFI shear wave imaging for obese patients. In [11, 53], SSI failed in providing reliable estimations for 15% of the subject and 49% of the patients, respectively, for cases with Body Mass Index (BMI) greater than 30. A recent study [41] examined the accuracy of the VCTE known as Fibroscan in the diagnosis of liver fibrosis in clinical practice and concluded that BMI should be taken into account while selecting patients for the staging of fibrosis to alleviate inherent limitations. Given the fact that patients with nonalcoholic steatohepatitis (NASH) disease are commonly overweight individuals, the need for methods such as S-WAVE to work reliably for obese patients is clearly vital. In 3D S-WAVE [66] and several clinical imaging methods, patients have to perform a breath hold of approximately 10 seconds [6] which is not always possible, especially for elderly people, postoperative patients, or paediatric population [49]. Arthritis in the neck or shoulders [15], obesity or cardiopulmonary disease [48] can also cause difficulties in holding breath. Therefore, faster imaging techniques are needed to decrease the ultrasound exam time for patients.
Standard 2D shear wave elastography methods implemented on clinical scanners showed good performance in assessing liver fibrosis but unsatisfying results in assessing the entire spectrum of steatohepatitis (fibrosis, steatosis, inflammation, ballooning) leading to cirrhosis and liver cancer. 3D ultrasound can provide the motion measurement in all three directions over a volumetric region of interest which is the best approach for accurately estimating the shear modulus from the wave equation in elastography systems [19]. Furthermore, the 3D implementation permits assessment of a larger liver volume and enables analysis of a larger number of tissue slices. It provides improvements in colocalization across time points, monitoring for longitudinal change, and a more complete representation of wave propagation [57].
In this work, we use a 3D motorized array transducer to acquire volumetric ultrasound data and present imaging sequences and data processing using the Verasonics research system. The excitation and imaging sweep are synchronized to enable quasi-instantaneous 3D imaging which is followed by the 3D motion estimation and elasticity reconstruction over a volume. Measuring motion in three directions has several advantages such as enhancements in accuracy of the shear wave motion estimation and speed measurements [63], opportunity to incorporate anisotropic properties of the tissue [62], and decreasing diffraction bias in shear wave fields [64].
Utilizing the curl of the displacement field in elasticity reconstruction, which needs 2D or 3D motion estimation, eliminates the contribution of the compressional waves [5]. It was previously used in MRE where measurements of all three motion components are available [25, 35]. In this work, we use the curl of the 3D displacement phasors in 3D elasticity reconstruction. To the best of our knowledge, it is the first instance that the curl of a 3D displacement map obtained from a single ultrasound transducer is used in solving the inverse problem of elastography to calculate the tissue elasticity map. In this paper, two imaging sequences in a Verasonics programming scripts with different sets of excitation frequencies are described where the overall data collection time is equal to 1.5 and 2 s for each imaging sequence. The challenge with defining a new sequence is that the imaging time should be selected such that the acquisition is synchronized with the mechanical excitation. In other words, the overall period of multi-frequency signal determines the imaging time which is discussed in 2.1.3 in details. The high frame rate of 3000 frames/s, and deep penetration of low excitation frequencies has a goal of providing elasticity measurements at both shallower and greater depths. The method is validated on phantoms and also applied on an ex vivo bovine liver to show some initial results on real tissue. The results of the proposed method are compared with an implementation of the MTL-SWEI technique on the same Verasonics system [14]. In vivo data will be acquired in future studies to detect and stage liver fibrosis in patients using the proposed method.
In a previous study on 3D S-WAVE published by our group [66], a matrix array transducer with a Philips ultrasound machine was used to collect sector-based volumetric data with an effective frame rate of 250 Hz and axial displacement measurements over a volume. The advantages of this work over the previous work are as follows:
-
1.
Integrating a high frame rate imaging approach with the frame rate of 3000 frames/s to the S-WAVE system to improve the overall exam time from 12s to less than 2s.
-
2.
Eliminating potential sector artifacts by using plane wave imaging that fires all transducer elements at the same time.
-
3.
Using full 3D displacements over the volume which is more accurate compared to the case where only the axial measurement is used over the volume [27].
-
4.
Utilizing the curl of the 3D displacements to ignore the effect of compressional waves.
Since the element to channel mapping for our current Philips matrix array is not compatible with the Verasonics ultrasound system, we used a 3D wobbler transducer in this work. The rest of this paper is organized as follows: Section 2 details the imaging setup, parameter selection for the experiments, controlling the transducer motor and synchronizing the imaging sweep with the excitation source. Section 3 demonstrates the results of the proposed algorithm on phantoms, and ex vivo data, and compares the elasticity values with a previous method using MTL-SWEI technique [14] where plane waves are also utilized. The goal is to investigate the consistency of the elasticity ranges especially in ex vivo sample achieved by both methods. The results of the reconstruction with and without the curl of displacement field are demonstrated. Section 4 discusses some of the limitations in experiments and possible future work. Finally, our conclusions are presented in Section 5.
2 Methods
2.1 Proposed Technique: UltraFast Shear Wave Absolute Vibro-Elastography (Ultrafast S-WAVE)
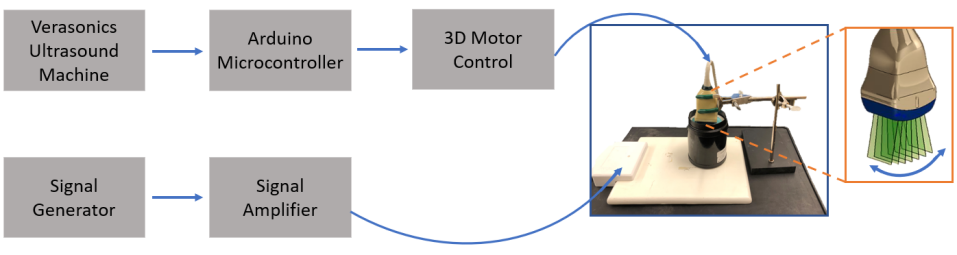
In S-WAVE [1], an external excitation source is placed against or beneath the tissue sample or patient as shown in Figure 1. The signal generator is then programmed to generate sinusoidal vibrations at multiple frequencies leading to steady-state shear waves inside the tissue. For low frequency sequences which can penetrate deeper inside the tissue in applications such as the placenta [47] and the liver [66], we use three excitation frequencies of 40, 50, and 60 Hz. These frequencies are within the typical range utilized by some of the previous methods such as MRE, transient elastography [6], and crawling wave sonoelastography [40] for imaging the liver. The higher frequency sequence using the excitation frequencies of 100, 160, and 200 Hz are designed for shallower depth applications such as the breast. A Vantage 256 ultrasound system (Verasonics Inc, Kirkland, WA) equipped with a 4DL14-5/38 motorized swept volume (3D wobbler) transducer (Vermon, Tours, France) with a center frequency of 5.1 MHz and the sampling frequency of 20.4 MHz is used in all Ultrafast S-WAVE experiments. A custom motor controller, which has been used in previous studies [1, 3, 13], is connected between the Vantage ultrasound machine and the motorized ultrasound transducer to control the transducer sweep inside the housing and acquire volumetric data. An Arduino microcontroller is also used to generate input signals for the motor controller to synchronize data acquisition between motor movements. As shown in Figure 1, inside the transducer housing, a linear array transducer sweeps back and forth generating 2D ultrasound images which are used to reconstruct the 3D ultrasound volume. In this work, the transducer acquires 10 planes and collects several frames at each plane location. The frames are grouped together such that the slices within a volume are acquired at a common excitation phase. We use an imaging depth of 5 cm for the phantom elasticity measurements. To be consistent with the ex vivo experiment, an imaging depth of 5 cm is used for both lower and higher frequency sequences while all the reported measurements are performed at the depth of 3 cm for the ex vivo sample with a frame rate of 3000 frames/s to fully capture the shear wave propagation and tissue displacement. The radio-frequency (RF) data is stored and beamformed [23, 44] in a rectangular grid for each 2D frame. The corressponding frames for each volume are placed together and form a volume. Axial, lateral, and elevational displacement maps are calculated using the GLUE3D algorithm [27] which has been used previously in different elastography methods [26, 27, 28]. Similar to the other elastography methods, it has tunable parameters (, , , and ) which regulate the spatial and temporal displacement continuity throughout the data volume. The parameters can be set at the beginning of the ultrasound exam based on the target organ. Higher coefficient values lead to smoother displacement maps. In all experiments, we set the tunable parameters of the GLUE3D algorithm to the recommended values in [27] such that , , and . Changing the GLUE3D coefficients by 100 changes the elasticity values by less than 2 for both phantom and ex vivo data. Displacement estimation is followed by fitting displacement phasors [2], and calculating the curl of 3D displacement phasors to be utilized in tissue elasticity measurement using local frequency estimation (LFE) [39].
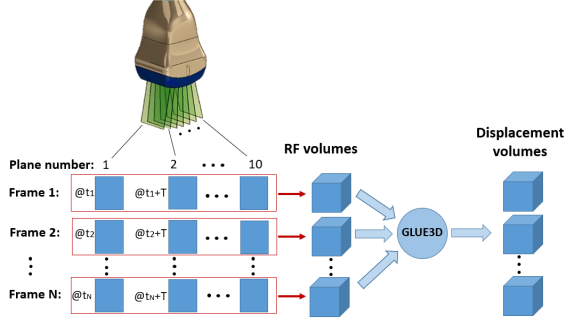
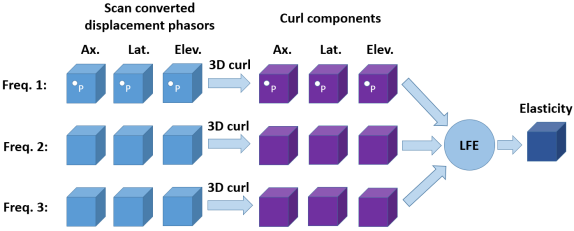
Figure 2 (a) shows the formation of RF volumes. The planes inside each RF volume are acquired at a common excitation phase given the periodic motion of the excitation wave. The transducer volume sweeps comprise 10 planes (slices). frames are acquired at each plane location such that the frames for the first plane are collected at , for the second plane at , and so forth where T is the period of the excitation signal and . The planes acquired at are then grouped into the first volume, the planes collected at are grouped in the second volume, and etc. The spacing of the beamformed RF data and displacement volumes in the axial, lateral and elevational directions are 0.15 mm, 0.48 mm, and 0.45∘, respectively. The consecutive volumes are used by GLUE3D for 3D motion estimation and a sequence of displacement volumes is generated. Displacement phasors are obtained at each spatial location and each frequency by taking the Fourier transform of the displacements. The phasors are then scan converted to a 3D Cartesian grid with the uniform sample spacing of 0.5 mm in all three directions. These are demonstrated in Figure 2 (b). For each excitation frequency, there are three phasor volumes: axial, lateral, and elevational displacements, which are used in the 3D curl calculations.
The Curl of a 3D volume can be estimated as follows:
,
where F is the 3D displacement phasor, x, y and z are axial, lateral, and elevational directions, respectively. A 3D grid of points is defined based on the uniform sample spacing in each direction. The partial derivatives in the curl formula are calculated using the central difference method. Note that applying the curl operator for a specific point P in the volume results in a 3D vector. Therefore, by performing the curl operator for all the points within the volume, three volumes corresponding to axial, lateral and elevational directions will be achieved and used in 3D LFE function.
To show the advantage of reconstruction using the 3D curl of displacements, the elasticity of the phantoms are estimated using two other approaches: first, reconstruction with no curl (using axial, lateral, and elevational displacement phasors); Second, reconstruction using 2D curl (curl of axial and lateral displacements i.e. the or elevational component of ).
2.1.1 Ultrafast S-WAVE Imaging Sequence for Verasonics & Parameter Specification
Parameter selection for S-WAVE sequences and guidelines of synchronizing excitation source, imaging sequence and the stepper motor inside of the transducer are explained in this section. We design two different sequences that can be used for imaging at “deeper” depth inside the organs such as human liver and placenta and also for “shallower” imaging applications such as the breast.
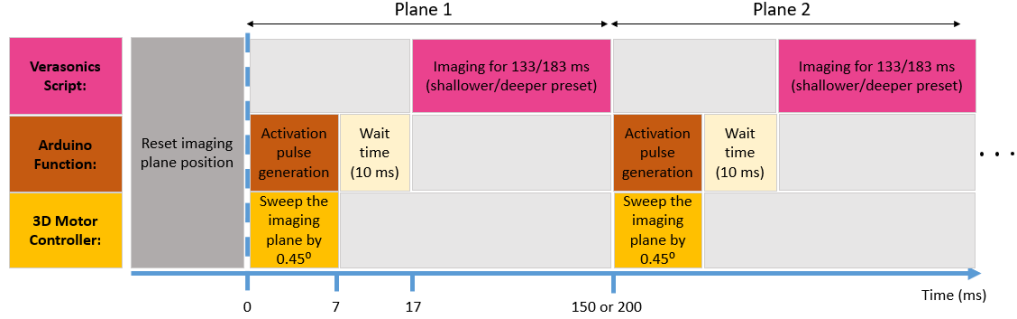
The wobbler transducer is defined in the Verasonics script as a custom transducer based on the transducer information and geometry. When our custom Verasonics script is executed, the Arduino microcontroller function resets the array location inside the transducer housing and moves it to an initial location adjusted for the start of imaging. Then the imaging starts and several RF frames are acquired. Figure 3 shows the sequencing used in the Verasonics script for the Ultrafast S-WAVE method. First, second, and third rows show the actions that is performed by the Verasonics machine, Arduino microcontroller and 3D motor controller while all the commands and functions are defined and called inside the Verasonics script. First, the imaging plane is reset to the middle plane of the transducer. Then, the sequence starts by generating four activation pulses using an Arduino microcontroller to mechanically sweep the imaging plane inside the transducer housing by followed by the motor settling time (10 ms). The Verasonics machine starts collecting data such that the number of acquired frames and imaging time depends on the shallower or deeper presets selected by the user at the beginning. When the imaging completes, the transducer sweeps to the next location while the imaging is paused in the script during the transducer sweep. This process is repeated until the last imaging plane. The imaging time for each preset depends on the overall period of the excitation signal. For the deeper imaging preset, the excitation frequencies are 40, 50, and 60 Hz which result in an overall excitation period of 100 ms. The Vantage system is programmed to perform imaging for 183 ms acquiring 549 RF frames. Therefore, the overall time spent on each plane is 200 ms which is a factor of the excitation period to synchronize ultrasound imaging with mechanical excitation (details are described in 2.1.3). By repeating the same sequence, the total number of 10 planes (slices) are imaged to form an RF volume of data resulting in the overall exam time of 2 s (5490 frames). For the excitation frequencies of 100, 160, and 200 Hz, the overall excitation period is 50 ms for imaging at shallower depth in the tissue. The imaging duration for each plane is 133 ms. Therefore, the overall ultrasound examination time for a volume consists of 10 planes is 1.5 s (3990 frames).
2.1.2 Motor Controller
For the motorized 3D transducer, the imaging plane is swept over a volume using a customized motor control component to collect volumetric data. The imaging script sends signals to the motor microcontroller. The microcontroller is programmed before the start of imaging such that during the data collection the function is called within the Verasonics script while there is no need to repeatedly program each frame acquisition, thereby avoiding any programming delay. The direction of the sweep, the angle between the planes, and the sweep activation pulse can be adjusted using the imaging script and the microcontroller.
| Manufacturer | ARFI | Ultrafast S-WAVE | Ultrafast S-WAVE | Ultrafast S-WAVE |
|---|---|---|---|---|
| value | (no curl) | (2D curl) | (3D curl) | |
| 2.8 | 2.32 0.01 | 2.03 0.08 | 2.11 0.03 | 2.45 0.03 |
| 6.2 | 5.08 0.16 | 5.00 0.16 | 4.62 0.13 | 5.92 0.12 |
| 11.6 | 10.07 0.11 | 10.26 0.49 | 9.66 0.98 | 11.19 0.47 |
| 21.2 | 19.27 0.13 | 19.07 0.27 | 18.96 0.36 | 20.98 0.20 |
2.1.3 Synchronization of excitation source, imaging, and transducer sweep
In this work, the wobbler transducer sweeps 10 slices and collects several frames at each slice location. For the deeper imaging setting (40, 50, and 60 Hz), the excitation signal period is 100 ms. In order to synchronize ultrasound acquisition with mechanical excitation, the overall data acquisition time for each plane should be a factor of the excitation signal period (i.e. 100 ms, 200 ms, etc). So, for each plane, the overall acquisition time was adjusted to 200 ms. The synchronization between the imaging and transducer sweep is done within the Vantage sequencing script. The microcontroller function is called to generate four step pulses to sweep the transducer by 0.45∘ followed by a wait time of 10 ms. Afterward, the imaging process starts and continues for 183 ms. This process is repeated until the last imaging plane is acquired. For the shallower setting (100, 160, and 200 Hz), the overall excitation period is 50 ms. So, we used the acquisition time of 150 ms which is a factor of the excitation signal period. In both deeper and shallower settings, the excitation frequencies will be visible in the displacements in frequency domain.
2.2 Liver Fibrosis Phantom
The RF data is acquired from four elastic liver fibrosis phantoms (Model 039, CIRS Inc., Norfolk, VA, USA) with the imaging depth of 5 cm using the Vantage 256 ultrasound system and deeper setting. According to the manufacturer, the elasticity value of the phantoms are 2.8, 6.2, 11.6, and 21.2 kPa with a precision of . It has a sound speed of 1540 m/s, ultrasound attenuation of 0.5 dB/cm/MHz, and the overall depth of 10 cm.
2.3 Ex vivo Bovine Liver
The ex vivo data was collected from bovine liver tissue as shown in Figure 1. The sample has a depth of cm in the axial direction. Both the ARFI and S-WAVE acquisition methods are performed at room temperature ( ∘C). Imaging depth of 5 cm is used for both shallower and deeper settings to have a fair comparison. All the reported measurements are obtained at the depth of 3 cm.
2.4 ARFI: Multiple Track Location Shear Wave Elasticity Imaging (MTL-SWEI)
MTL-SWEI is a group of elasticity estimation techniques based on ARFI. A single push from the focused transducer beam is induced into the tissue to generate tissue motion. Multiple track locations are used to estimate the group shear wave speed (SWS) and phase velocity over the frequency content of the shear waves. We use an implementation of the MTL-SWEI on the Verasonics system where a single push with the frequency within the lower bandwidth of the transducer will be generated at the center of the transducer following by plane wave tracking, and IQ beamforming [14]. There are zero delays across the curvilinear transducer elements resulting in diverging waves due to the curved transducer surface. We perform 8 measurements at a single location by slightly rotating the medium about that location between each acquisition. As such, we have a different speckle realization for the same area at each measurement. The elasticity can be estimated by considering the tissue as an isotropic incompressible elastic material and using , where is the tissue density which is considered for soft tissues and is the group SWS. For the rest of this paper, we use the general term “ARFI” to refer to this method. A C5-2v curvilinear transducer with the center frequency of 3.6 MHz and the sampling frequency of 14.24 MHz is used in all ARFI experiments.
3 Results
3.1 Phantom Results
3.1.1 ARFI
3.1.2 Ultrafast S-WAVE
A set of 3D RF data is collected using the proposed Ultrafast S-WAVE technique described in 2.1 and vibration frequencies of 40, 50, and 60 Hz. Figure 4 shows the axial, lateral, and elevational phasors of a slice of the phantom for the excitation frequency of 50 Hz. The elasticity values for homogeneous phantoms are calculated using the curl of 3D displacement and LFE reconstruction. To be consistent with the ARFI measurements, a ROI of size is considered at the same depth of cm. The average elasticity with the standard deviation (STD) values inside the ROI are shown in Table 1. Changing the size of the ROI by 100 will change the average elasticity value by less than 5. The elasticity volume is reconstructed using no curl, 2D curl and 3D curl. The results in Table 1 confirm that using the curl of the 3D displacement map provides closer elasticity values to the manufacturer reported values. Furthermore, the elasticity values measured by the ARFI and Ultrafast S-WAVE methods are both in reasonable agreement with the manufacturer elasticity values. The average error between the proposed method using curl and the reported manufacturer values is 5% which is a reasonable error by considering the effect of aging on phantom materials and also the 4% precision error in measurements of manufacturer elasticity values as mentioned in the phantom data sheet. The statistical analysis shows no significant differences between the manufacturer and estimated elasticity values by the Ultrafast S-WAVE using 3D curl in reconstruction. Using the 3D curl helps to get more accurate mean elasticity values and reduces the STD within the homogeneous phantoms. The average STD for the Ultrafast S-WAVE using curl on 3D motion field improved by 18% and 45% compared to the no curl (but using elevational) and 2D curl (no elevational) approaches, respectively. The difference error in mean elasticity value of Ultrafast S-WAVE from the manufacturer value improved by 12% and 14% (averaged for all phantoms) compared to the no curl and 2D curl approaches. Therefore, the 3D curl method shows better performance compared to the no curl and 2D curl techniques.
3.2 Ex vivo Results
The proposed two imaging sequences are applied on the ex vivo bovine liver to show some preliminary results on real tissue. As there is no ground truth for the actual elasticity of the ex vivo sample, the result of the ARFI method is also provided to investigate the range of the elasticity values estimated by both methods. All the reported measurements are performed at the depth of 3 cm which is half of the total depth of the tissue sample.
3.2.1 ARFI
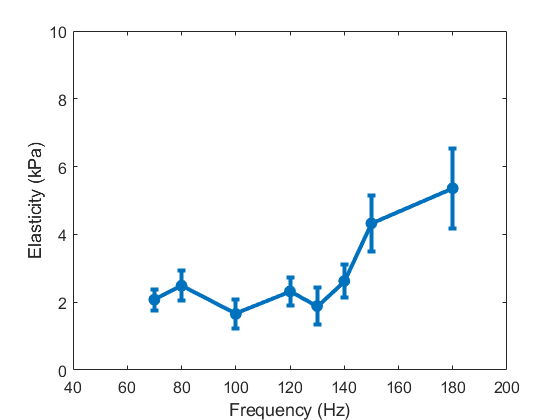
RF data are acquired as described in 2.4. Figure 5 (a) shows the elasticity values estimated using phase velocities for different frequencies. The elasticity values increase with frequency as the tissue mechanical characteristics of the liver have viscoelastic properties [42]. For a typical low frequency range of 70 to 180 Hz which are among the frequencies used by ARFI methods for the soft tissues [40, 54] and are close to the Ultrafast S-WAVE frequency range, the mean elasticity increases from 2.0 kPa to 5.4 kPa over the frequency range. Due to the noise in phase velocity estimation for each frequency, some variances are visible among the generally increasing trend with frequency. Furthermore, some outliers in the time-of-flight trajectories can affect the results caused by the proximity to the capsule, vessels or poor coupling. Higher frequencies typically show larger STD values since there is less energy at these frequencies. Furthermore, the waves are traveling faster at higher frequencies which may cause sampling issues. According to a previous study [63], the STD of time-of-flight will increase with the square of the shear wave speed. Therefore, smaller STD values are expected at lower frequencies. As different elastography methods shows different values for the same sample/patient in ex/in vivo experiments [33, 46], the ARFI result is shown in this section to only investigate the dependency of the elasticity value to the frequency and also confirm the range of values provided by the proposed Ultrafast S-WAVE method described in 3.2.2.
3.2.2 Ultrafast S-WAVE
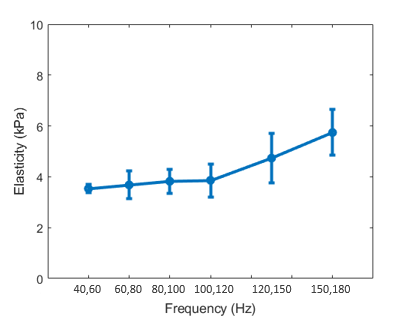
Before applying the main multi-frequency sequences described in 2.1.1, different excitation frequencies in the range of 40 to 180 Hz are applied to the tissue to investigate the dependency of the elasticity on frequency for biological tissue. The estimated elasticity values for each pair of excitation frequencies are plotted in Figure 5(b) showing that the average elasticity value increases with excitation frequency as we expect from the viscoelastic liver tissue [42]. As different transducers and slightly different imaging location on the sample were used for the ARFI and Ultrafast S-WAVE experiments, direct comparison between values of both methods are not possible through this experiment.
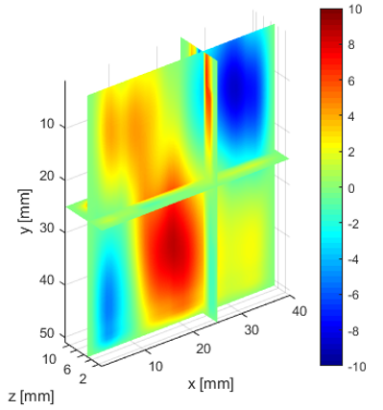
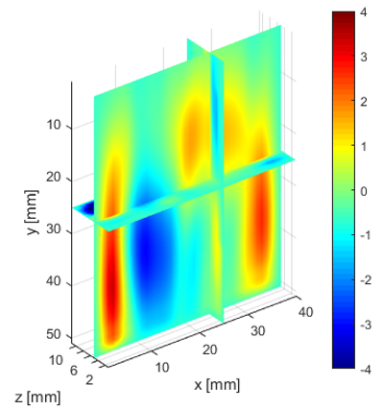
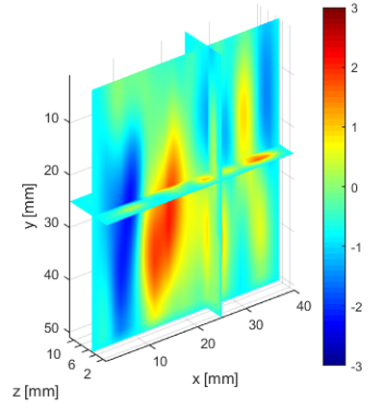
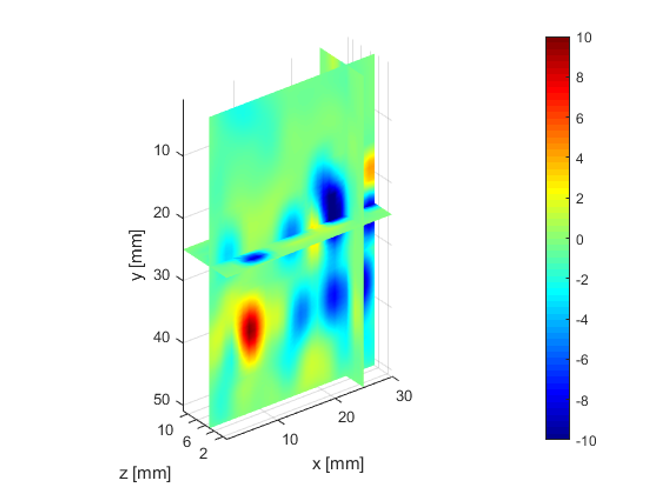
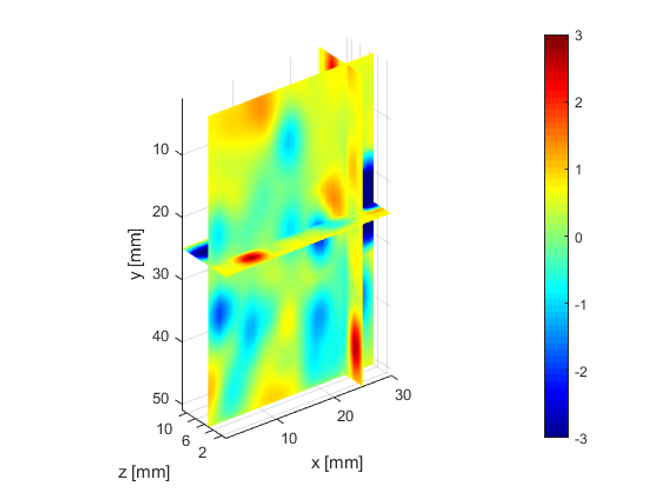
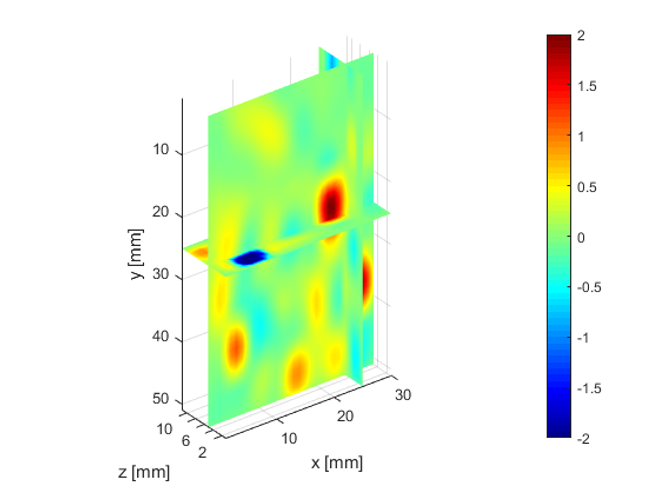
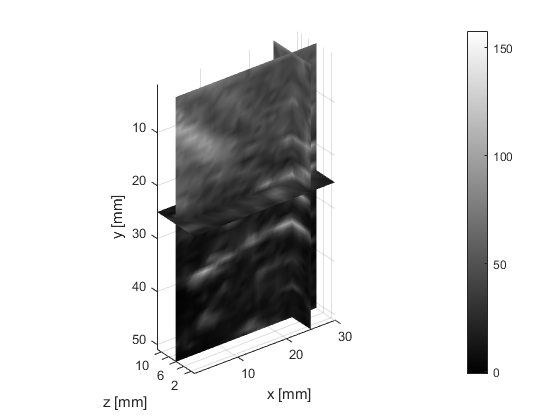
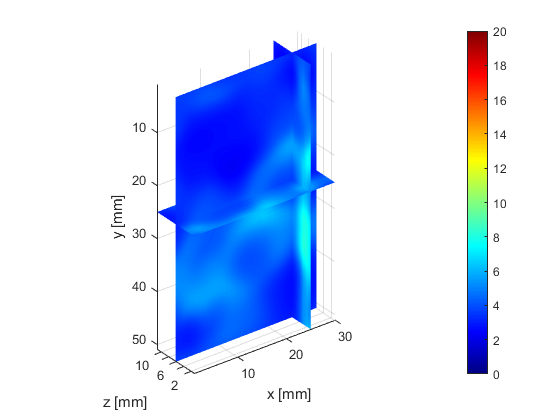
The deeper and shallower sequences described in 2.1 are applied to the tissue for the same imaging depth of 5 cm as the total sample depth is 6 cm, thereby comparing the results of two sequences at the same depth. The 3D displacements are estimated using the GLUE3D method and the least square sinusoidal fitting. The elasticity values of 3.990.12 and 4.860.59 kPa are estimated respectively, using the LFE function on the curl of 3D displacement for two sets of excitation frequencies. Note that for each frequency group, the reported elasticity value is the average of elasticity maps at each excitation frequency. The values are similar to the reported values for animal livers [7, 8]. Figure 6 (a)-(c) shows the axial, lateral, and elevational phasors for the excitation frequency of 200 Hz. To avoid boundary artifacts, right and left boundaries of the RF frames are cropped by 0.7 cm. The elasticity map obtained by averaging the elasticity maps of all the excitation frequencies (100, 160 and 200 Hz) is depicted in (e). A ROI of size at the depth of 3 cm is used for elasticity calculations.
3.3 Data Acquisition Time
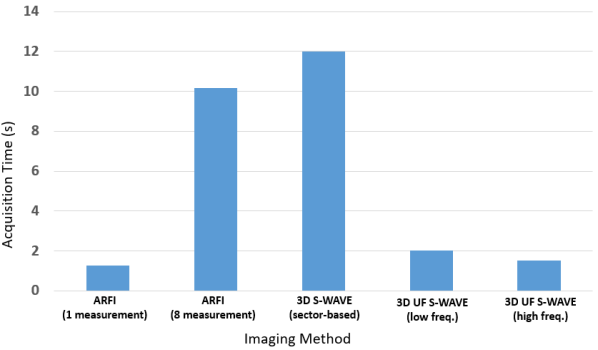
Figure 7 shows the data collection time for different methods. The ARFI imaging sequence for a single measurement takes 1.2 s, however, the implementation of the method provided for the Verasonics machine uses between 6 to 12 measurements (8 in this work). Therefore, the overall data collection using 8 measurements takes 10.16 s assuming no wasted time between the measurements. The original 3D S-WAVE method [66] takes 12 s for each patient where the focused beam and sector-based imaging is used. The Ultrafast S-WAVE proposed in this work takes 2 s and 1.5 s for deeper and shallower imaging sequences, respectively. Using plane waves instead of focused beams reduces the number of transducer transmissions, thereby improving the imaging time by 83% and 88% compared to the original 3D S-WAVE for the two proposed sequences.
4 Discussion
The proposed Ultrafast S-WAVE method provides absolute elasticity of the tissue at ultrafast frame rate and images fast and deep within the body in only 1.5-2 s. The importance of the proposed technique is twofold: First, the low frequency excitation provides deep penetration within the body to examine suspected sites located at higher depths. Second, it decreases the patient examination time while providing 3D volume of tissue elasticity. In fact, one of the disadvantages of the methods generating 3D elasticity images compared to the methods making point measurements is the long acquisition times which increases the role of other undesired motions such as operator hand motion, or motion due to patient coughing, or breathing. Therefore, the displacement estimation could be corrupted leading to an inaccurate elasticity map. However, in our proposed method, acquiring a 3D ultrasound volume takes 2 s, thereby potentially reducing the motion artifacts in handheld ultrasound examinations. The shear-wave displacement volumes are converted to elasticity maps through solving an inverse problem. As waves propagate in three directions, 3D inversion algorithms provide a more complete analysis of the full wave motion compared to 2D ones where only two components within a slice of the 3D wave propagation are analyzed [56].
Increasing the accuracy of the elasticity estimation will improve the staging of the liver fibrosis [45]. Liver fibrosis can be caused by the inflammation and liver damage of NAFLD, which is often associated with obesity. The prevalence of obesity is dramatically affecting developed countries. For example, approximately one-third of the United States population is considered obese, with the prevalence of NAFLD in the United States population being approximately 30% [61]. As a result, the need to image deeply is necessary for a large portion of the population. However, the maximum imaging depth for ARFI methods is mostly limited to 8 cm [21]. Therefore, ARFI is not well suited as a screening tool that must work for all patients. On the other hand, MRE is slow, less accessible, and more prone to motion artifacts compared to ultrasound elastography [45]. So, the Ultrafast S-WAVE has advantages over both ARFI and MRE.
The Vantage 256 system provides excellent control on tuning different imaging parameters, however, it does not have regulatory approval [20] to be used for the in vivo experiments on human subjects. Although our experiment on real tissue is limited to the ex vivo bovine liver, the results have shown the potential of the ultrafast elastography to be integrated with the 3D S-WAVE system. A future study will explore in vivo liver images to stage liver fibrosis in patients using Ultrafast S-WAVE on a system with regulatory approval.
In this work, the ultrasound frame rate is set to 3000 frames/s which leads to a adequate number of data samples during each excitation cycle. Furthermore, it is selected within common ranges utilized in the other liver studies [38, 10, 24]. Using high frame rate imaging improves the acquisition time substantially for 3D S-WAVE imaging which currently takes 12 s for each subject [66]. It also eliminates potential sector artifacts. Volumetric ultrasound data will also be acquired using electronically steered 2D matrix array transducers in the future to further improve the total exam time.
It has been shown that the only approach that can theoretically remove longitudinal wave effects is curl filtering [5]. The curl operation involves spatial derivatives of the phasor displacement field and derivatives are affected by noisy displacement estimations. However, the GLUE3D motion estimation algorithm used in this work is robust to noise and therefore provides smooth displacements with high signal-to-noise ratio as shown in [26, 27, 28]. The reason lies within the simultaneous displacement estimation of several samples and exploitation of the displacement continuity prior throughout the image [28]. As an alternative approach, one can use spatial high-pass filters to reduce the effects of the compressional waves given the difference in propagation speed of compressional and shear waves. However, the compression artifacts will still be coupled to the shear waves and adversely affect the shear wave speed estimation especially using time-of-flight or phase gradient techniques [43].
There is an inherent trade-off between increasing the frame rate and depth of imaging. The total acquisition time can be improved by increasing the frame rate, however, this reduces the time between two transmit events. Therefore, higher depth imaging will be challenging as longer time is needed for the ultrasound waves to reach the imaging depth and back between two transmit events. For example, in medical applications with the speed of sound of 1540 m/s, single plane wave imaging at the depth of more than 13 cm is not possible with much faster frame rates such as 6000 frames/s even without considering the system delay. Higher frame rates are possible with lower depth of imaging or higher speed of sound in other materials such as steel where the longitudinal speed of sound is about 5900 m/s. Furthermore, there is a system trade-off between the frame rate and depth of imaging in Verasonics ultrasound machine. The received ultrasound signals are digitized and stored in local memory prior to transfer to the host computer. So, after each frame collection (including all steered-angle acquisitions), there is a ”Transfer To Host” command to transfer the collected data to the computer. For higher depth and more steering angles, the size of data is larger and can takes longer time to be transferred to the host computer which affects the adjusted frame rate in the code. One possible solution can be modifying the default imaging sequence to keep more frames on the local memory and transfer them once to the host computer.
Some previous studies used sector-based imaging where the region of interest is divided into a number of sectors, and each one is acquired separately at a higher frame rate [4]. Any error in this approach can lead to disjointed motion measurements between sectors. Plane wave imaging eliminates potential sector artifacts by insonifying the entire field of view at the same time. Furthermore, it potentially allows the study of dynamic elasticity changes over the cardiac cycle. However, there is a trade-off between image quality and frame rate: the spatial resolution of the data is higher in the focused-beam S-WAVE, whereas the Ultrafast S-WAVE is faster ( times) in data acquisition. Coherent compounding of multiple plane wave images from successive transmissions can be explored to further investigate the image quality trade-off with frame rate [36].
A limitation of the LFE algorithm used for elasticity reconstruction in this work is the absence of information on the loss modulus and thus on tissue viscosity. As an alternative, one can utilize the obtained phasors from this method in Voigt, Maxwell, and Zener [22, 32] rheological models or a combination of the Voigt model with the finite element methods [29, 30, 31] to estimate both elasticity and viscosity of the tissue. These viscoelasticity inversion approaches will be explored in future work.
3D ultrasound imaging can provide further information as the real tissue is not isotropic, but it can get affected by acoustic shadows that have been shown to be either helpful in detecting lesions and calcifications, or destructive as artifacts in image processing tasks such as 3D reconstruction, segmentation, and image registration. Acoustic shadows appear as low SNR regions in the ultrasound volume due to highly reflecting structures such as bones and ribs which have significantly different impedances compared to soft tissue. Integration of displacement continuity regularization over time that is used in GLUE3D algorithm can alleviate or ignore the effect of shadowing artifacts. 3D displacement estimation is also preferred compared to 1D and 2D techniques over a volume of data given that biological tissues are nearly incompressible and applying any force on them (which is the case in elastography) leads the tissue to expand in all three directions. So, lateral and elevational displacements can add further information for elasticity reconstruction algorithms and provide more accurate elasticity values [27].
5 Conclusion
In this work, we introduced Ultrafast S-WAVE to advance 3D S-WAVE with ultrafast imaging. The proposed method measures absolute elasticity of the tissue, and was applied to phantom and ex vivo data at the frame rate of 3000 frames/s. The advantages of the proposed method include 3D elasticity estimation and lower patient examination time. The overall data collection time improved by 83-88% compared to the original 3D S-WAVE. Furthermore, using the curl of 3D motion field improved the reconstruction results. Future work will examine in vivo liver data to stage liver fibrosis in patients using Ultrafast S-WAVE and also reduce unwanted motion artifacts due to the patient breathing or pulsatile motions. Furthermore, plane-wave S-WAVE eliminated the sector artifacts with standard S-WAVE, dynamic elasticity changes with the heart beat can be studied. The dependency of the ex vivo liver elasticity values on frequency was also shown in this work and should be investigated further together with dynamic elasticity changes over the cardiac cycle.
Acknowledgments
This work was supported by the Canadian Institutes of Health Research, and the Natural Sciences and Engineering Research Council of Canada and by the CA Laszlo Chair in Biomedical Engineering held by Professor Salcudean. The authors would like to thank Dr. Kathryn Nightingale, Dr. Mark Palmeri, Dr. Mohammad Honarvar and Dr. Damien Garcia for valuable discussions.
References
- Abeysekera et al. [2015] Abeysekera, J., Rohling, R., Salcudean, S., 2015. Vibro-elastography: Absolute elasticity from motorized 3d ultrasound measurements of harmonic motion vectors, in: 2015 IEEE International Ultrasonics Symposium (IUS), IEEE. pp. 1–4.
- Abeysekera [2016] Abeysekera, J.M., 2016. Three dimensional ultrasound elasticity imaging. Ph.D. thesis. University of British Columbia.
- Abeysekera et al. [2017] Abeysekera, J.M., Ma, M., Pesteie, M., Terry, J., Pugash, D., Hutcheon, J.A., Mayer, C., Lampe, L., Salcudean, S., Rohling, R., 2017. Swave imaging of placental elasticity and viscosity: proof of concept. Ultrasound in Medicine & Biology 43, 1112–1124.
- Baghani et al. [2010] Baghani, A., Brant, A., Salcudean, S., Rohling, R., 2010. A high-frame-rate ultrasound system for the study of tissue motions. IEEE Transactions on Ultrasonics, Ferroelectrics, and Frequency Control 57, 1535–1547.
- Baghani et al. [2009] Baghani, A., Salcudean, S., Rohling, R., 2009. Theoretical limitations of the elastic wave equation inversion for tissue elastography. The Journal of the Acoustical Society of America 126, 1541–1551.
- Barr et al. [2015] Barr, R.G., Ferraioli, G., Palmeri, M.L., Goodman, Z.D., Garcia-Tsao, G., Rubin, J., Garra, B., Myers, R.P., Wilson, S.R., Rubens, D., Levine, D., 2015. Elastography assessment of liver fibrosis: society of radiologists in ultrasound consensus conference statement. Radiology 276, 845–861.
- Barry et al. [2014] Barry, C.T., Hah, Z., Partin, A., Mooney, R.A., Chuang, K.H., Augustine, A., Almudevar, A., Cao, W., Rubens, D.J., Parker, K.J., 2014. Mouse liver dispersion for the diagnosis of early-stage fatty liver disease: A 70-sample study. Ultrasound in Medicine & Biology 40, 704–713.
- Barry et al. [2015] Barry, C.T., Hazard, C., Hah, Z., Cheng, G., Partin, A., Mooney, R.A., Chuang, K.H., Cao, W., Rubens, D.J., Parker, K.J., 2015. Shear wave dispersion in lean versus steatotic rat livers. Journal of Ultrasound in Medicine 34, 1123–1129.
- Bercoff et al. [2004] Bercoff, J., Tanter, M., Fink, M., 2004. Supersonic shear imaging: a new technique for soft tissue elasticity mapping. IEEE Transactions on Ultrasonics, Ferroelectrics, and Frequency Control 51, 396–409.
- Budelli et al. [2016] Budelli, E., Brum, J., Bernal, M., Deffieux, T., Tanter, M., Lema, P., Negreira, C., Gennisson, J.L., 2016. A diffraction correction for storage and loss moduli imaging using radiation force based elastography. Physics in Medicine & Biology 62, 91.
- Cassinotto et al. [2013] Cassinotto, C., Lapuyade, B., Aït-Ali, A., Vergniol, J., Gaye, D., Foucher, J., Bailacq-Auder, C., Chermak, F., Le Bail, B., de Lédinghen, V., 2013. Liver fibrosis: noninvasive assessment with acoustic radiation force impulse elastography—comparison with fibroscan m and xl probes and fibrotest in patients with chronic liver disease. Radiology 269, 283–292.
- De Alwis et al. [2016] De Alwis, N.M., Anstee, Q.M., Day, C.P., 2016. How to diagnose nonalcoholic fatty liver disease. Digestive Diseases 34, 19–26.
- Deeba et al. [2021] Deeba, F., Schneider, C., Mohammed, S., Honarvar, M., Lobo, J., Tam, E., Salcudean, S., Rohling, R., 2021. A multiparametric volumetric quantitative ultrasound imaging technique for soft tissue characterization. arXiv preprint arXiv:2104.00712 .
- Deng et al. [2016] Deng, Y., Rouze, N.C., Palmeri, M.L., Nightingale, K.R., 2016. Ultrasonic shear wave elasticity imaging sequencing and data processing using a verasonics research scanner. IEEE Transactions on Ultrasonics, Ferroelectrics, and Frequency Control 64, 164–176.
- Dershaw [2000] Dershaw, D.D., 2000. Imaging guided biopsy: an alternative to surgical biopsy. The Breast Journal 6, 294–298.
- Dulai et al. [2017] Dulai, P.S., Singh, S., Patel, J., Soni, M., Prokop, L.J., Younossi, Z., Sebastiani, G., Ekstedt, M., Hagstrom, H., Nasr, P., Stal, P., Wong, V.W.S., Kechagias, S., Hultcrantz, R., Loomba, R., 2017. Increased risk of mortality by fibrosis stage in nonalcoholic fatty liver disease: systematic review and meta-analysis. Hepatology 65, 1557–1565.
- Dulai et al. [2016] Dulai, P.S., Sirlin, C.B., Loomba, R., 2016. Mri and mre for non-invasive quantitative assessment of hepatic steatosis and fibrosis in nafld and nash: clinical trials to clinical practice. Journal of Hepatology 65, 1006–1016.
- Eskandari et al. [2013] Eskandari, H., Salcudean, S.E., Rohling, R., Baghani, A., Frew, S., Gordon, P.B., Warren, L., 2013. Identifying malignant and benign breast lesions using vibroelastography, in: 2013 IEEE International Ultrasonics Symposium (IUS), IEEE. pp. 25–28.
- Eskandari et al. [2008] Eskandari, H., Salcudean, S.E., Rohling, R., Ohayon, J., 2008. Viscoelastic characterization of soft tissue from dynamic finite element models. Physics in Medicine & Biology 53, 6569.
- Food and Drug Administration [2008] Food and Drug Administration, 2008. Information for manufacturers seeking marketing clearance of diagnostic ultrasound systems and transducers. Guidance for Industry and FDA Staff .
- Frulio and Trillaud [2013] Frulio, N., Trillaud, H., 2013. Ultrasound elastography in liver. Diagnostic and Interventional Imaging 94, 515–534.
- Fung [2013] Fung, Y.c., 2013. Biomechanics: mechanical properties of living tissues. Springer Science & Business Media.
- Garcia [2021] Garcia, D., 2021. Make the most of must, an open-source matlab ultrasound toolbox, in: 2021 IEEE International Ultrasonics Symposium (IUS), IEEE. pp. 1–4.
- Gesnik et al. [2020] Gesnik, M., Bhatt, M., Cardinal, M.H.R., Destrempes, F., Allard, L., Nguyen, B.N., Alquier, T., Giroux, J.F., Tang, A., Cloutier, G., 2020. In vivo ultrafast quantitative ultrasound and shear wave elastography imaging on farm-raised duck livers during force feeding. Ultrasound in Medicine & Biology 46, 1715–1726.
- Glaser et al. [2012] Glaser, K.J., Manduca, A., Ehman, R.L., 2012. Review of mr elastography applications and recent developments. Journal of Magnetic Resonance Imaging 36, 757–774.
- Hashemi et al. [2018] Hashemi, H.S., Fallone, S., Boily, M., Towers, A., Kilgour, R.D., Rivaz, H., 2018. Assessment of mechanical properties of tissue in breast cancer-related lymphedema using ultrasound elastography. IEEE Transactions on Ultrasonics, Ferroelectrics, and Frequency Control 66, 541–550.
- Hashemi et al. [2020] Hashemi, H.S., Honarvar, M., Salcudean, T., Rohling, R., 2020. 3d global time-delay estimation for shear-wave absolute vibro-elastography of the placenta, in: 2020 42nd Annual International Conference of the IEEE Engineering in Medicine & Biology Society (EMBC), IEEE. pp. 2079–2083.
- Hashemi and Rivaz [2017] Hashemi, H.S., Rivaz, H., 2017. Global time-delay estimation in ultrasound elastography. IEEE Transactions on Ultrasonics, Ferroelectrics, and Frequency Control 64, 1625–1636.
- Honarvar et al. [2012] Honarvar, M., Sahebjavaher, R., Salcudean, S., Rohling, R., 2012. Sparsity regularization in dynamic elastography. Physics in Medicine & Biology 57, 5909.
- Honarvar et al. [2013] Honarvar, M., Sahebjavaher, R., Sinkus, R., Rohling, R., Salcudean, S.E., 2013. Curl-based finite element reconstruction of the shear modulus without assuming local homogeneity: time harmonic case. IEEE Transactions on Medical Imaging 32, 2189–2199.
- Honarvar et al. [2017] Honarvar, M., Sahebjavaher, R.S., Rohling, R., Salcudean, S.E., 2017. A comparison of finite element-based inversion algorithms, local frequency estimation, and direct inversion approach used in mre. IEEE Transactions on Medical Imaging 36, 1686–1698.
- Klatt et al. [2007] Klatt, D., Hamhaber, U., Asbach, P., Braun, J., Sack, I., 2007. Noninvasive assessment of the rheological behavior of human organs using multifrequency mr elastography: a study of brain and liver viscoelasticity. Physics in Medicine & Biology 52, 7281.
- Leung et al. [2013] Leung, V.Y.f., Shen, J., Wong, V.W.s., Abrigo, J., Wong, G.L.h., Chim, A.M.l., Chu, S.H.t., Chan, A.W.h., Choi, P.C.l., Ahuja, A.T., Chan, H.L.y., Chu, W.C.w., 2013. Quantitative elastography of liver fibrosis and spleen stiffness in chronic hepatitis b carriers: comparison of shear-wave elastography and transient elastography with liver biopsy correlation. Radiology 269, 910–918.
- Loomba and Sanyal [2013] Loomba, R., Sanyal, A.J., 2013. The global nafld epidemic. Nature Reviews Gastroenterology & Hepatology 10, 686–690.
- Manduca et al. [2018] Manduca, A., Rossman, T., Lake, D., Glaser, K., Arani, A., Arunachalam, S., Rossman, P., Trzasko, J., Ehman, R., Dragomir-Daescu, D., Araoz, P., 2018. Waveguide effects and implications for cardiac magnetic resonance elastography: A finite element study. NMR in Biomedicine 31, e3996.
- Montaldo et al. [2009] Montaldo, G., Tanter, M., Bercoff, J., Benech, N., Fink, M., 2009. Coherent plane-wave compounding for very high frame rate ultrasonography and transient elastography. IEEE Transactions on Ultrasonics, Ferroelectrics, and Frequency Control 56, 489–506.
- Moradi et al. [2014] Moradi, M., Mahdavi, S.S., Nir, G., Mohareri, O., Koupparis, A., Gagnon, L.O., Fazli, L., Casey, R.G., Ischia, J., Jones, E.C., Goldenberg, S.L., Salcudean, S.E., 2014. Multiparametric 3d in vivo ultrasound vibroelastography imaging of prostate cancer: Preliminary results. Medical Physics 41, 073505.
- Nightingale et al. [2015] Nightingale, K.R., Rouze, N.C., Rosenzweig, S.J., Wang, M.H., Abdelmalek, M.F., Guy, C.D., Palmeri, M.L., 2015. Derivation and analysis of viscoelastic properties in human liver: impact of frequency on fibrosis and steatosis staging. IEEE Transactions on Ultrasonics, Ferroelectrics, and Frequency Control 62, 165–175.
- Oliphant et al. [2000] Oliphant, T., Kinnick, R., Manduca, A., Ehman, R.L., Greenleaf, J.F., 2000. An error analysis of helmholtz inversion for incompressible shear, vibration elastography with application to filter-design for tissue characterization, in: 2000 IEEE Ultrasonics Symposium. Proceedings. An International Symposium (Cat. No. 00CH37121), IEEE. pp. 1795–1798.
- Ormachea et al. [2016] Ormachea, J., Lavarello, R.J., McAleavey, S.A., Parker, K.J., Castaneda, B., 2016. Shear wave speed measurements using crawling wave sonoelastography and single tracking location shear wave elasticity imaging for tissue characterization. IEEE Transactions on Ultrasonics, Ferroelectrics, and Frequency Control 63, 1351–1360.
- Ornelas et al. [2020] Ornelas, R., Pan, D., Chak, E., 2020. S3264 the accuracy of fibroscan: A real world study. Official Journal of the American College of Gastroenterology— ACG 115, S1706.
- Palmeri et al. [2021] Palmeri, M.L., Milkowski, A., Barr, R., Carson, P., Couade, M., Chen, J., Chen, S., Dhyani, M., Ehman, R., Garra, B., Gee, A., Guenette, G., Hah, Z., Lynch, T., Macdonald, M., Managuli, R., Miette, V., Nightingale, K.R., Obuchowski, N., Rouze, N.C., Morris, D.C., Fielding, S., Deng, Y., Chan, D., Choudhury, K., Yang, S., Samir, A.E., Shamdasani, V., Urban, M., Wear, K., Xie, H., Ozturk, A., Qiang, B., Song, P., McAleavey, S., Rosenzweig, S., Wang, M., Okamura, Y., McLaughlin, G., Chen, Y., Napolitano, D., Carlson, L., Erpelding, T., Hall, T.J., 2021. Radiological society of north america/quantitative imaging biomarker alliance shear wave speed bias quantification in elastic and viscoelastic phantoms. Journal of Ultrasound in Medicine 40, 569–581.
- Palmeri et al. [2008] Palmeri, M.L., Wang, M.H., Dahl, J.J., Frinkley, K.D., Nightingale, K.R., 2008. Quantifying hepatic shear modulus in vivo using acoustic radiation force. Ultrasound in Medicine & Biology 34, 546–558.
- Perrot et al. [2021] Perrot, V., Polichetti, M., Varray, F., Garcia, D., 2021. So you think you can das? a viewpoint on delay-and-sum beamforming. Ultrasonics 111, 106309.
- Petitclerc et al. [2017] Petitclerc, L., Sebastiani, G., Gilbert, G., Cloutier, G., Tang, A., 2017. Liver fibrosis: Review of current imaging and mri quantification techniques. Journal of Magnetic Resonance Imaging 45, 1276–1295.
- Potthoff et al. [2013] Potthoff, A., Attia, D., Pischke, S., Kirschner, J., Mederacke, I., Wedemeyer, H., Manns, M.P., Gebel, M.J., Rifai, K., 2013. Influence of different frequencies and insertion depths on the diagnostic accuracy of liver elastography by acoustic radiation force impulse imaging (arfi). European Journal of Radiology 82, 1207–1212.
- Rac et al. [2015] Rac, M.W., Dashe, J.S., Wells, C.E., Moschos, E., McIntire, D.D., Twickler, D.M., 2015. Ultrasound predictors of placental invasion: the placenta accreta index. American Journal of Obstetrics and Gynecology 212, 343–e1.
- Reiner et al. [2013] Reiner, C., Neville, A., Nazeer, H., Breault, S., Dale, B., Merkle, E., Bashir, M., 2013. Contrast-enhanced free-breathing 3d t1-weighted gradient-echo sequence for hepatobiliary mri in patients with breath-holding difficulties. European Radiology 23, 3087–3093.
- Riccabona et al. [2003] Riccabona, M., Fritz, G., Ring, E., 2003. Potential applications of three-dimensional ultrasound in the pediatric urinary tract: pictorial demonstration based on preliminary results. European Radiology 13, 2680–2687.
- Sandrin et al. [2002] Sandrin, L., Tanter, M., Catheline, S., Fink, M., 2002. Shear modulus imaging with 2-d transient elastography. IEEE Transactions on Ultrasonics, Ferroelectrics, and Frequency Control 49, 426–435.
- Schneider et al. [2016] Schneider, C., Honarvar, M., Lobo, J., Rohling, R., Salcudean, T., Bidnur, S., Nguan, C., 2016. Blood pressure dependent elasticity measurements of porcine kidney ex-vivo, in: 2016 IEEE International Ultrasonics Symposium (IUS), IEEE. pp. 1–4.
- Shao et al. [2021] Shao, Y., Hashemi, H., Gordon, P., Warren, L., Wang, Z.J., Rohling, R., Salcudean, T., 2021. Breast cancer detection using multimodal time series features from ultrasound shear wave absolute vibro-elastography. IEEE Journal of Biomedical and Health Informatics .
- Sirli et al. [2013] Sirli, R., Bota, S., Sporea, I., Jurchis, A., Popescu, A., Gradinaru-Tascău, O., Szilaski, M., 2013. Liver stiffness measurements by means of supersonic shear imaging in patients without known liver pathology. Ultrasound in Medicine & Biology 39, 1362–1367.
- Song et al. [2015] Song, P., Macdonald, M.C., Behler, R.H., Lanning, J.D., Wang, M.H., Urban, M.W., Manduca, A., Zhao, H., Callstrom, M.R., Alizad, A., Greenleaf, J.F., Chen, S., 2015. Two-dimensional shear-wave elastography on conventional ultrasound scanners with time-aligned sequential tracking (tast) and comb-push ultrasound shear elastography (cuse). IEEE Transactions on Ultrasonics, Ferroelectrics, and Frequency Control 62, 290–302.
- Song et al. [2012] Song, P., Zhao, H., Manduca, A., Urban, M.W., Greenleaf, J.F., Chen, S., 2012. Comb-push ultrasound shear elastography (cuse): a novel method for two-dimensional shear elasticity imaging of soft tissues. IEEE Transactions on Medical Imaging 31, 1821–1832.
- Tang et al. [2015a] Tang, A., Cloutier, G., Szeverenyi, N.M., Sirlin, C.B., 2015a. Ultrasound elastography and mr elastography for assessing liver fibrosis: part 1, principles and techniques. AJR. American Journal of Roentgenology 205, 22.
- Tang et al. [2015b] Tang, A., Cloutier, G., Szeverenyi, N.M., Sirlin, C.B., 2015b. Ultrasound elastography and mr elastography for assessing liver fibrosis: part 2, diagnostic performance, confounders, and future directions. AJR. American Journal of Roentgenology 205, 33.
- Tanter and Fink [2014] Tanter, M., Fink, M., 2014. Ultrafast imaging in biomedical ultrasound. IEEE Transactions on Ultrasonics, Ferroelectrics, and Frequency Control 61, 102–119.
- Tanter et al. [2002] Tanter, M., Gauthier, T., Barriere, C., Fink, M., 2002. Constrast enhancement in harmonic imaging using time reversal processing. The Journal of the Acoustical Society of America 112, 2370–2370.
- Tapper and Loomba [2018] Tapper, E.B., Loomba, R., 2018. Noninvasive imaging biomarker assessment of liver fibrosis by elastography in nafld. Nature Reviews Gastroenterology & Hepatology 15, 274.
- Vernon et al. [2011] Vernon, G., Baranova, A., Younossi, Z., 2011. Systematic review: the epidemiology and natural history of non-alcoholic fatty liver disease and non-alcoholic steatohepatitis in adults. Alimentary Pharmacology & Therapeutics 34, 274–285.
- Wang et al. [2013a] Wang, M., Byram, B., Palmeri, M., Rouze, N., Nightingale, K., 2013a. Imaging transverse isotropic properties of muscle by monitoring acoustic radiation force induced shear waves using a 2-d matrix ultrasound array. IEEE Transactions on Medical Imaging 32, 1671–1684.
- Wang et al. [2013b] Wang, M., Byram, B., Palmeri, M., Rouze, N., Nightingale, K., 2013b. On the precision of time-of-flight shear wave speed estimation in homogeneous soft solids: initial results using a matrix array transducer. IEEE Transactions on Ultrasonics, Ferroelectrics, and Frequency Control 60, 758–770.
- Yin et al. [2008] Yin, M., Rouvière, O., Glaser, K.J., Ehman, R.L., 2008. Diffraction-biased shear wave fields generated with longitudinal magnetic resonance elastography drivers. Magnetic Resonance Imaging 26, 770–780.
- Yin and Venkatesh [2018] Yin, M., Venkatesh, S.K., 2018. Ultrasound or mr elastography of liver: which one shall i use? Abdominal Radiology 43, 1546–1551.
- Zeng et al. [2020] Zeng, Q., Honarvar, M., Schneider, C., Mohammad, S.K., Lobo, J., Pang, E.H., Lau, K.T., Hu, C., Jago, J., Erb, S.R., Rohling, R., Salcudean, S.E., 2020. Three-dimensional multi-frequency shear wave absolute vibro-elastography (3d s-wave) with a matrix array transducer: Implementation and preliminary in vivo study of the liver. IEEE Transactions on Medical Imaging 40, 648–660.