Truncated Simulation and Inference in
Edge-Exchangeable Networks
Abstract
Edge-exchangeable probabilistic network models generate edges as an i.i.d. sequence from a discrete measure, providing a simple means for statistical inference of latent network properties. The measure is often constructed using the self-product of a realization from a Bayesian nonparametric (BNP) discrete prior; but unlike in standard BNP models, the self-product measure prior is not conjugate the likelihood, hindering the development of exact simulation and inference algorithms. Approximation via finite truncation of the discrete measure is a straightforward alternative, but incurs an unknown approximation error. In this paper, we develop methods for forward simulation and posterior inference in random self-product-measure models based on truncation, and provide theoretical guarantees on the quality of the results as a function of the truncation level. The techniques we present are general and extend to the broader class of discrete Bayesian nonparametric models.
keywords:
t1This work is supported by a National Sciences and Engineering Research Council of Canada (NSERC) Discovery Grant and Discovery Launch Supplement.
and
1 Introduction
Probabilistic generative models have for many years been key tools in the analysis of network data [1, 2]. Recent work in the area [3, 4, 5, 6, 7, 8, 9, 10, 11, 12, 13] has begun to incorporate the use of nonparametric discrete measures, in an effort to address the limitations of traditional models in capturing the sparsity of real large-scale networks [14]. These models construct a discrete random measure (often a completely random measure, or CRM [15]) on a space , associate each atom of the measure with a vertex in the network, and then use the self-product of the measure—i.e., the measure on —to represent the magnitude of interaction between vertices.
While the inclusion of a nonparametric measure enables capturing sparsity, it also makes both generative simulation and posterior inference via Markov chain Monte Carlo (MCMC) [16; 17, Ch. 11, 12] significantly more challenging. In standard Bayesian models with discrete nonparametric measures—such as the Dirichlet process mixture model [18] or beta process latent feature model [19]—this issue is typically addressed by exploiting the conjugacy of the (normalized) completely random measure prior and the likelihood to marginalize the latent infinite discrete measure [20]. But in the case of nonparametric network models, however, there is no such reprieve; the self-product of a completely random measure is not a completely random measure, and exact marginalization is typically not possible.
Another option is to truncate the discrete CRM to have finitely many atoms, and perform simulation and inference based on the truncated CRM. Exact truncation schemes based on auxiliary variables [21, 22, 23] are limited to models where certain tail probabilities can be computed exactly. Fixed truncation [24, 25, 26, 27], on the other hand, is easy to apply to any CRM-based model; but it involves an approximation with potentially unknown error. Although the approximation error of truncated CRM models has been thoroughly studied in past work [28, 29, 30, 27, 31], these results apply only to generative simulation—i.e., not inference—and do not apply to self-product CRMs that commonly appear in network models.
In this work, we provide tractable methods for both generative simulation and posterior inference of discrete Bayesian nonparametric models based on truncation, as well as rigorous theoretical analyses of the error incurred by truncation in both scenarios. In particular, our theory and methods require only the ability to compute bounds on—instead of exact evaluation of—intractable tail probabilities. Our work focuses on the case of self-product-measure-based edge-exchangeable network sequences [3, 5, 32, 33], whose edges are simulated i.i.d. conditional on the discrete random product measure , but the ideas here apply without much effort to the broader class of discrete Bayesian nonparametric models. As an intermediate step of possible independent interest, we also show that the nonzero rates generated from the rejection representation [34] of a Poisson process have the same distribution as the well-known but typically intractable inverse Lévy or Ferguson-Klass representation [35]. This provides a novel method for simulating the inverse Lévy representation, which has a wide variety of uses in applications of Poisson processes [36, 37, 38].
2 Background
2.1 Completely random measures and self-products
A completely random measure (CRM) on is a random measure such that for any collection of disjoint measurable sets , the values are independent random variables [15]. In this work, we focus on discrete CRMs taking the form , where is a Dirac measure on at location (i.e., if and 0 otherwise), and are a sequence of rates and labels generated from a Poisson process on with mean measure . Here is a diffuse probability measure, and is a -finite measure satisfying , which guarantees that the Poisson process has countably infinitely many points almost surely. The space and distribution will not affect our analysis; thus as a shorthand, we write for the distribution of :
| (2) |
One can construct a multidimensional measure on , from defined in Eq. 2 by taking its self-product. In particular, we define
| (3) |
where is a -dimensional multi-index, and is the set of such indices with all distinct components. Note that is no longer a CRM, as it does not satisfy the independence condition.
2.2 Series representations
To simulate a realization —e.g., as a first step in the simulation of a self-product measure —the rates and labels may be generated in sequence using a series representation [39] of the CRM. In particular, we begin by simulating the jumps of a unit-rate homogeneous Poisson process on in increasing order. For a given distribution on and nonnegative measurable function , we set
| (4) |
Depending on the particular choice of and , one can construct several different series representations of a CRM [28]. For example, the inverse Lévy representation [35] has the form
| (5) |
In many cases, computing is intractable, making it hard to generate in this manner. Alternatively, we can generate a series of rates from with the rejection representation [34], which has the form
| (6) |
where is a measure on chosen such that uniformly and is easy to calculate in closed-form. While there are many other sequential representations of CRMs [28], the representations in Eqs. 4, 5 and 6 are broadly applicable and play a key role in our theoretical analysis.
2.3 Edge-exchangeable graphs
Self-product measures of the form Eq. 3 with have recently been used as priors in a number of probabilistic network models [3, 4].111There are also network models based on self-product measure priors that do not generate edge-exchangeable sequences [8, 11]; it is likely that many of the techniques in the present work would extend to these models, but we leave the study of this to future work. The focus of the present work are those models that associate each with a vertex, each tuple with a (hyper)edge, and then build a growing sequence of networks by sequentially generating edges from in rounds . There are a number of choices for how to construct such a sequence. For example, in each round we may add multiple edges via an independent likelihood process defined by
| (7) |
where denotes that there were copies of edge added at round , and is a probability distribution on . We denote the mean and probability of 0 under to be for convenience. By the Slivnyak-Mecke theorem [40], if satisfies
| (8) |
then finitely many edges are added to the graph in each round. We make this assumption throughout this work. Alternatively, if
| (9) |
then , and we may add only a single edge per round via a categorical likelihood process defined by
| (10) |
This construction has appeared in [4], where follows a Dirichlet process, which can be seen as a normalized gamma process [41]. Note that our definition of involves simulating from the normalization; we use this definition to avoid introducing new notation for normalized processes.
Using either likelihood process, the edges in the network after rounds are
| (11) |
i.e., represents the count of edge after rounds.
There are three points to note about this formulation. First, since the atom locations are not used, we can represent the network using only its array of edge counts
| (12) |
where denotes the set of integer arrays indexed by with finitely many nonzero entries. Note that is a countable set. Second, by construction, the distribution of is invariant to reorderings of the arrival of edges, and thus the network is edge-exchangeable [3, 5, 6, 7]. Finally, note that the network as formulated in Eq. 12 is in general a directed multigraph with no self-loops (due to the restriction to indices rather than ). Although the main theoretical results in this work are developed in this setting, we provide an additional result in Section 3.1 to translate to other common network structures (e.g. binary undirected networks).
3 Truncated generative simulation
In this section, we consider the tractable generative simulation of network models via truncation, and analyze the approximation error incurred in doing so as a function of (the truncation level) and number of rounds of generation . In particular, to construct a truncated self-product measure, we first split the underlying CRM into a truncation and tail component,
| (13) |
and construct the self-product from the truncation as in Eq. 3. Fig. 1 provides an illustration of the truncation of and , showing that can be decomposed into a sum of four parts,
| (14) |
Thus, while we only discard in truncating to , we discard three parts in truncating to ; and in general, we discard parts of when truncating it to . We therefore intuitively might expect higher truncation error when approximating than when approximating ; in Sections 3.2 and 3.3, we will show that this is indeed the case.


Once the measure is truncated, a truncated network—based on —can be constructed in the same manner as the original network using the independent likelihood process Eq. 7 or categorical likelihood process Eq. 10. We denote to be the corresponding edge set of the truncated network up round , where for any index such that some component . We keep and in the same space in order to compare their distributions in Sections 3.1, 3.2 and 3.3.
3.1 Truncation error bound
We formulate the approximation error incurred by truncation as the total variation distance between the marginal network distributions, i.e., of and . The first step in the analysis of truncation error—provided by Lemma 3.1—is to show that this is bounded above by the probability that there are edges in the full network involving vertices beyond the truncation level . To this end, we denote the maximum vertex index of to be
| (15) |
and note that by definition, if and only if all edges in fall in the truncated region.
Lemma 3.1.
Let be a random discrete measure, and be its truncation to atoms. Let be the self-product of , and be the self-product of . Let and be the marginal distributions of edge sets under either the independent or categorical likelihood process. Then
| (16) |
As mentioned in Section 2.3, the network is in general a directed multigraph with no self loops. However, Lemma 3.1—and the downstream truncation error bounds presented in Sections 3.2 and 3.3—also apply to any graph that is a function of the original graph such that truncation commutes with the function, i.e., . For example, to obtain a truncation error bound for the common setting of undirected binary graphs, we generate the directed multigraph as above and construct the undirected binary graph via
| (17) |
Corollary 3.2 provides the precise statement of the result; note that the bound is identical to that from Lemma 3.1.
Corollary 3.2.
Let be the set of edges of a network with truncation , and denote their marginal distributions and . If there exists a measurable function such that
| (18) |
then
| (19) |
3.2 Independent likelihood process
We now specialize Lemma 3.1 to the setting where is a CRM generated by a series representation of the form Eq. 4, and the network is generated via the independent likelihood process from Eq. 7. As a first step towards a bound on the truncation error for general hypergraphs with in Theorem 3.4, we present a simpler corollary in the case where , which is of direct interest in analyzing the truncation error of popular edge-exchangeable networks.
Corollary 3.3.
The proof of this result (and Theorem 3.4 below) in Appendix B follows by representing the tail of the CRM as a unit-rate Poisson process on . Though perhaps complicated at first glance, an intuitive interpretation of the truncation error terms is provided by Fig. 1(b). corresponds to the truncation error arising from the upper right quadrant, where both vertices participating in the edge were in the discarded tail region. is the truncation error arising from the bottom right and upper left quadrants, where one of the two vertices participating in the edge was in the truncation, and the other was in the tail. Finally, represents the truncation error arising from edges in which one vertex was at the boundary of tail and truncation, and the other was in the tail.
Theorem 3.4 is the generalization of Corollary 3.3 from to the general setting of arbitrary hypergraphs with . The bound is analogous to that in Corollary 3.3—with expressed as a sum of terms, each corresponding to whether vertices were in the tail, boundary, or truncation region—except that there are vertices participating in each edge, resulting in more terms in the sum. Note that Theorem 3.4 also guarantees that the bound is not vacuous, and indeed converges to 0 as the truncation level as expected.
Theorem 3.4.
The same geometric intuition from the -dimensional case applies to the general hypergraph truncation error in Eq. 26. corresponds to the error arising from the edges whose vertices all belong to the tail region . Each term in the summation in corresponds to the error arising from edges that have out of vertices belonging to the truncation . Each term in the summation in corresponds to the error arising from the edges that have out of vertices belonging to the truncation and have one vertex exactly on the boundary of the truncation. Note that we obtain Corollary 3.3 by taking in Eq. 26.
3.3 Categorical likelihood process
We may also specialize Lemma 3.1 to the setting where the network is generated via the single-edge-per-step categorical likelihood process in Eq. 10. However, truncation with the categorical likelihood process poses a few key challenges. From a practical angle, certain choices of series representation for generating may be problematic. For instance, when using the rejection representation Eq. 6 in the typical case where , there is a nonzero probability that
| (30) |
meaning there aren’t enough accepted vertices in the truncation to generate a single edge. In this case, the categorical likelihood process—which must generate exactly one edge per step—is ill-defined. An additional theoretical challenge arises from the normalization of the original and truncated networks in Eq. 10, which prevents the use of the usual theoretical tools for analyzing CRMs.
Fortunately, the inverse Lévy representation provides an avenue to address both issues. The rates are all guaranteed to be nonzero—meaning as long as , the categorical likelihood process is well-defined—and are decreasing, which enables our theoretical analysis in Section B.1. However, as mentioned earlier, the inverse Lévy representation is well-known to be intractable to use in most practical settings.
Theorem 3.5 provides a solution: we use the rejection representation to simulate the rates , but instead of simulating for iterations , we simulate until we obtain nonzero rates. This is no longer a sample of a truncated rejection representation; but Theorem 3.5 shows that the first nonzero rates have the same distribution as simulating iterations of the inverse Lévy representation. Therefore, we can tailor the analysis of truncation error for the categorical likelihood process in Theorem 3.6 to the inverse Lévy representation, and simulate its truncation for any using the tractable rejection representation in practice.
Theorem 3.5.
Let be the first rates from the inverse Lévy representation of a CRM, and let be the first nonzero rates from any rejection representation of the same CRM. Then
| (31) |
3.4 Examples
We now apply the results of this section to binary undirected networks () constructed via Eq. 17 from common edge-exchangeable networks [3]. We derive the convergence rate of truncation error, and provide simulations of the expected number of edges and vertices under the infinite and truncated network. In each simulation we use the rejection representation to simulate , and run steps of network construction.
Beta-Bernoulli process network
Suppose is generated from a beta process, and network is generated using the independent Bernoulli likelihood process [3]. The beta process [42] with discount parameter , concentration parameter , and mass parameter is a CRM with rate measure
| (35) |
The Bernoulli likelihood has the form
| (36) |
To simulate the process, we use a proposal rate measure given by
| (37) |
Dense network: When , the binary beta-Bernoulli graph is dense and
| (38) |
Therefore the rejection representation Eq. 6 of can be written as
| (39) |
In Section C.2, we show that there exists such that
| (40) |
This implies that the truncation error of the dense binary beta-Bernoulli network converges to 0 geometrically in . Fig. 2(a) corroborates this result in simulation with and ; it can be seen that for the dense beta-Bernoulli graph, truncated graphs with relatively low truncation level—in this case, —approximate the true network model well.


Sparse network: When , the binary beta-Bernoulli graph is sparse and
| (41) |
Therefore the rejection representation Eq. 6 of can be written as
| (42) |
In Section C.2, we show that there exists such that
| (43) |
This bound suggests that the truncation error for the sparse binary beta-Bernoulli network converges to 0 much more slowly than for the dense graph. Fig. 2(b) corroborates this result in simulation with , , and ; it can be seen that for the sparse beta-Bernoulli graph, truncated graphs behave significantly differently from the true graph for moderate truncation levels. In practice, one should select an appropriate (large) value of using our error bounds as guidance, and use sparse data structures to avoid undue memory burden.
Gamma-independent Poisson network
Next, consider the network with generated from a gamma process, and the network generated using the independent Poisson likelihood process. The gamma process [43] with discount parameter , scale parameter and mass parameter has rate measure
| (44) |
The Poisson likelihood has the form
| (45) |
Dense network: When , the gamma-Poisson graph is dense, and we choose the proposal measure to be
| (46) |
such that
| (47) |
Therefore, the rejection representation in Eq. 6 has the form
| (48) |
In Section C.3, we show that there exists such that
| (49) |
Again, for the dense network converges to 0 geometrically, indicating that truncation may provide reasonable approximations to the original network. Fig. 3(a) corroborates this result in simulation with and ; for , no vertices are discarded on average by truncation.


Sparse network: When , the gamma-Poisson graph is sparse, and we choose the proposal measure to be
| (50) |
such that
| (51) |
Therefore the rejection representation in Eq. 6 has the form
| (52) |
In Section C.3, we show there exists such that
| (53) |
Again, for the sparse network converges to 0 slowly, suggesting that the truncation error for the sparse binary gamma-Poisson graph converges more slowly than for the dense graph. Fig. 3(b) corroborates this result in simulation with , , and ; for a moderate range of truncation values , the truncated graph behaves very differently from the true graph. Therefore in practice, one should follow the above guidance for the beta-Bernoulli network: select a value of using our error bounds, and avoid intractable memory requirements by using sparse data structures.
4 Truncated posterior inference
In this section, we develop a tractable approximate posterior inference method for network models via truncation, and analyze its approximation error. In particular, given an observed network , we want to simulate from the posterior distribution of the CRM rates and the parameters of the CRM rate measure. Since exact expressions of full conditional densities are not available, we truncate the model and run an approximate Markov chain Monte Carlo algorithm. We provide a rigorous theoretical justification for this simple approach by establishing a bound on the total variation distance between the truncated and exact posterior distribution. This in turn provides a method to select the truncation level in a principled manner.
Although this section focuses on self-product-CRM-based network models, the method and theory we develop are both general and extend easily to other CRM-based models, e.g. for clustering [44], feature allocation [45], and trait allocation [6]. In particular, the methodology only requires bounds on tail occupancy probabilities (e.g., in the present context, the probability that ) rather than the exact evaluation of these quantities.
4.1 Truncation error bound
We begin by examining the density of the posterior distribution of the rate from the inverse Lévy representation for some fixed , the unordered collection of rates such that , and the parameters of the CRM rate measure given the observed set of edges . We denote to be the density of and to be the prior density of , both with respect to the Lebesgue measure. Given these definitions the posterior density can be expressed as
| (54) | |||
| (55) |
where is the subset of such that , and is shorthand for the set of such that . All the factors on the first row correspond to the prior of and , and the first factor on the second row corresponds to the likelihood of the portion of the network involving only vertices ; these are straightforward to evaluate, though will occasionally require a 1-dimensional numerical integration. The last factor corresponds to the likelihood of the portion of the network involving vertices beyond , and is not generally possible to evaluate exactly.
To handle this term, suppose that is large enough that . Then , i.e., the probability that no portion of the network involves vertices of index . Theorem 4.1 provides upper and lower bounds on this probability akin to those of Theorem 3.4—indeed, Theorem 4.1 is an intermediate step in the proof of Theorem 3.4—that apply conditionally on the values of , rather than marginally. This theorem also makes the dependence of the bound on the rate measure parameters notationally explicit via parametrized series representation components and from Eq. 4. Finally, though Theorem 4.1 applies to general series representations, we require only the specific instantiation for the inverse Lévy representation in the present context.
Theorem 4.1.
The conditional probability satisfies
| (56) |
where
| (57) | ||||
| (58) |
where and .
Since is unused in the inverse Lévy representation, in the present context we use the notation for brevity. The bound in Theorem 4.1 implies that as long as is set large enough such that both and for some then
| (59) |
Therefore as increases, this term should become and have a negligible effect on the posterior density. We use this intuition to propose a truncated Metropolis–Hastings algorithm that sets , ignores the term in the acceptance ratio, and fixes to 0. Theorem 4.2 provides a rigorous analysis of the error involved in using the truncated sampler.
Theorem 4.2.
Fix . Let be the distribution of given , and let be the distribution with density proportional to Eq. 55 without the term and with fixed to 0. If for some ,
| (60) |
then
| (61) |
4.2 Adaptive truncated Metropolis–Hastings
Crucially, as long as one can obtain samples from the truncated posterior distribution, one can estimate the bound in Eq. 61 using sample estimates of the tail probability . Therefore, one can compute the bound Eq. 61 without needing to evaluate exactly. This suggests the following adaptive truncation procedure:
-
1.
Pick a value of and desired total variation error .
-
2.
Obtain samples from the truncated posterior.
-
3.
Minimize the bound in Eq. 61 over , using the samples to estimate for each value of .
-
4.
If the minimum bound exceeds , increase and return to 2.
-
5.
Otherwise, return the samples.
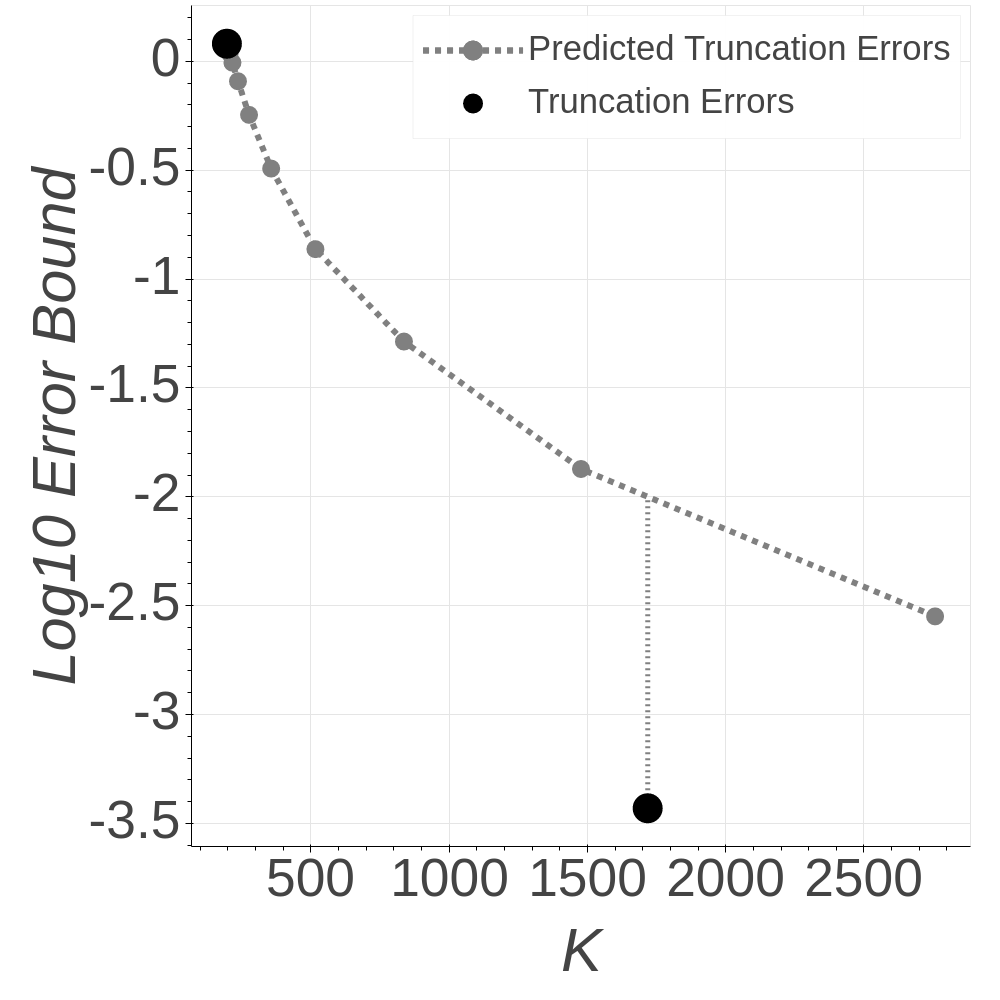
In this work, we start by initializing to . In order to decide how much to increase by in each iteration, we use the sequential representation to extrapolate the total variation bound Eq. 61 to larger values of without actually performing MCMC sampling. In particular, for each posterior sample, we use its hyperparameters to generate additional rates from the sequential representation. We then use these extended samples to compute the total variation error guarantee as per step 3 above. We continue to generate additional rates (typically doubling the number each time) until the predicted total variation guarantee is below the desired threshold. Finally, we use linear interpolation between the last two predicted errors to find the next truncation level that matches the desired (log) error threshold. This fixes a new value of ; at this point, we return to step 2 above and iterate.


4.3 Experiments
In this section, we examine the properties of the proposed adaptive truncated inference algorithm for the beta-independent Bernoulli network model in Eqs. 35 and 36 with discount , concentration , mass , unordered collection of rates , and rate from the sequential representation . In order to simplify inference, we transform each of these parameters to an unconstrained version:
| (62) | ||||||||
| (63) |
We use a Markov chain Monte Carlo algorithm that includes an exact Gibbs sampling move for , and separate Gaussian random-walk Metropolis–Hastings moves for , , , all such that vertex has degree 0 (jointly), and each such that vertex has nonzero degree (individually).
Synthetic data

We first apply the model to synthetic data simulated from the generative model. We simulate a sparse network with parameters , , , and , and a dense network with , , , and . In both settings we set the truncation level for data generation to , the desired total variation bound from Eq. 61 to , and initialize the sampler with , , and generated from the sequential representation. All Metropolis–Hastings moves have proposal standard deviation except the sparse network move, which has standard deivation .
Figs. 4 and 5 show histograms of marginal posterior samples of the hyperparameters for the dense (true ) and sparse (true ) networks. In both cases, the approximate posterior in the first round of adaptation (orange histogram) does not concentrate on the true hyperparameter values, despite the relatively large number of generative rounds . Fig. 6—which displays the truncation error and predictive adaptation procedure—shows why this is the case. In both networks, the first adaptation iteration identifies a large truncation error. After a single round of adaptation, the approximate posterior distributions (blue histograms) in Figs. 4 and 5 concentrate more on the true values as expected, and the truncation errors fall well below the desired threshold (). It is worth noting that the predictive extrapolation appears to be quite conservative in these examples, and especially in the dense network. This happens because the approximate posterior for the dense network (respectively, sparse network) assigns mass to higher values of (respectively, ) than it should, which results in larger truncation error and thus a larger predicted required truncation level.
Real network data
Next, we apply the model to a Facebook-like Social Network222Available at https://toreopsahl.com/datasets/ [46]. The original source network contains a sequence of weighted, time-stamped edges, and vertices. We preprocess the data by removing the edge weights, binning the edge sequence into 30-minute intervals, and removing the initial transient of network growth, resulting in vertices and edges over rounds of generation. We again set a desired total variation error guarantee of 0.01 during inference. All Metropolis–Hastings moves have proposal standard deviation except the and degree-0 moves, which have standard deviation and , respectively. We initialize the sampler to , , and sample rates from the prior sequential representation.


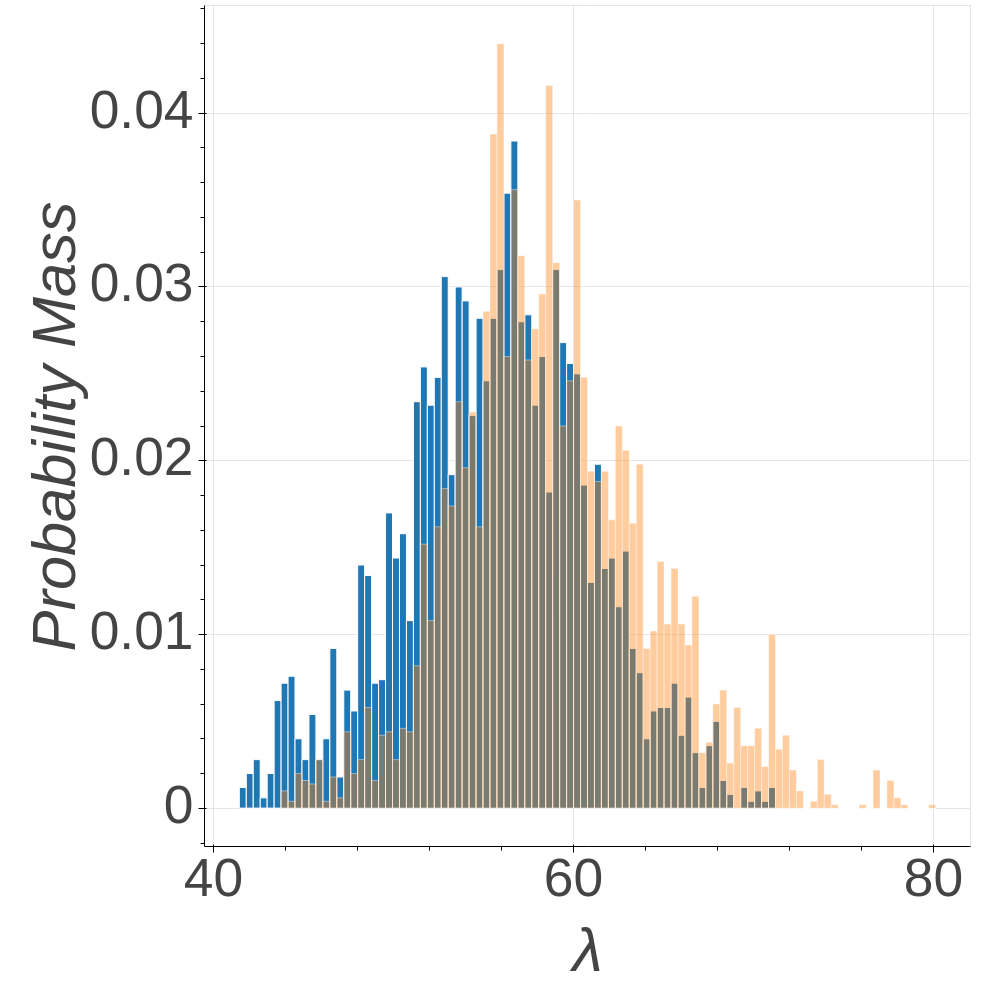
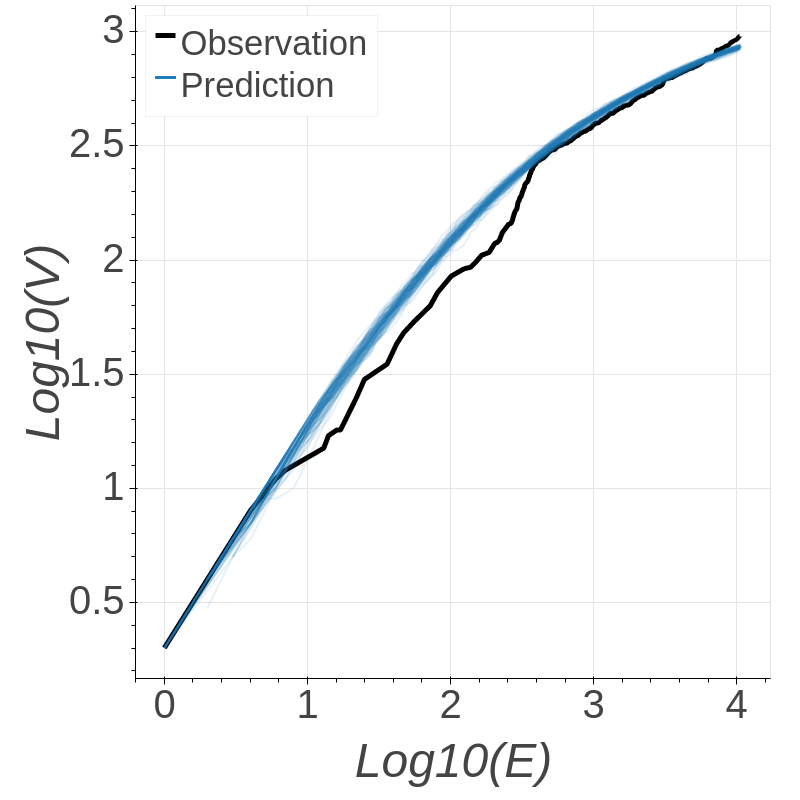
Fig. 7 shows the posterior marginal histograms for the hyperparameters in both the first iteration (orange) and the second and final iteration (blue) of truncation adaptation. The posterior distribution suggests that the network is dense (i.e. ). This conclusion is supported both by the close match of 100 samples from the posterior predictive distribution, shown in Figs. 8(a) and 8(b), and the findings of past work using this data [8]. Further, as in the synthetic examples, the truncation adaptation terminates after two iterations; but in this case the histograms do not change very much between the two. This is essentially because the truncation error in the first iteration is relatively low (), leading to a reasonably accurate truncated posterior and hence accurate predictions of the truncation error at higher truncation levels.


5 Conclusion
In this paper, we developed methods for tractable generative simulation and posterior inference in statistical models with discrete nonparametric priors via finite truncation. We demonstrated that these approximate truncation-based approaches are sound via theoretical error analysis. In the process, we also showed that the nonzero rates of the (tractable) rejection representation of a Poisson process are equal in distribution to the rates of the (intractable) inverse Lévy representation. Simulated and real network examples demonstrated that the proposed methods are useful in selecting truncation levels for both forward generation and inference in practice.
References
- [1] Paul Erdős and Alfréd Rényi. On random graphs I. Publicationes Mathematicae, 6:290–297, 1959.
- [2] Paul Holland, Kathryn Laskey, and Samuel Leinhardt. Stochastic block models: first steps. Social Networks, 5:109–137, 1983.
- [3] Diana Cai, Trevor Campbell, and Tamara Broderick. Edge-exchangeable graphs and sparsity. In Advances in Neural Information Processing Systems, pages 4249–4257, 2016.
- [4] Sinead Williamson. Nonparametric network models for link prediction. The Journal of Machine Learning Research, 17(1):7102–7121, 2016.
- [5] Harry Crane and Walter Dempsey. Edge exchangeable models for interaction networks. Journal of the American Statistical Association, 113(523):1311–1326, 2018.
- [6] Trevor Campbell, Diana Cai, and Tamara Broderick. Exchangeable trait allocations. Electronic Journal of Statistics, 12(2):2290–2322, 2018.
- [7] Svante Janson. On edge exchangeable random graphs. Journal of Statistical Physics, 173(3-4):448–484, 2018.
- [8] François Caron and Emily Fox. Sparse graphs using exchangeable random measures. Journal of the Royal Statistical Society: Series B (Statistical Methodology), 79(5):1295–1366, 2017.
- [9] Adrien Todeschini, Xenia Miscouridou, and François Caron. Exchangeable random measures for sparse and modular graphs with overlapping communities. arXiv:1602.02114, 2016.
- [10] Tue Herlau, Mikkel Schmidt, and Morten Mørup. Completely random measures for modelling block-structured sparse networks. In Advances in Neural Information Processing Systems, pages 4260–4268, 2016.
- [11] Victor Veitch and Daniel Roy. The class of random graphs arising from exchangeable random measures. arXiv:1512.03099, 2015.
- [12] Christian Borgs, Jennifer Chayes, Henry Cohn, and Nina Holden. Sparse exchangeable graphs and their limits via graphon processes. The Journal of Machine Learning Research, 18(1):7740–7810, 2017.
- [13] François Caron and Judith Rousseau. On sparsity and power-law properties of graphs based on exchangeable point processes. arXiv:1708.03120, 2017.
- [14] Peter Orbanz and Daniel Roy. Bayesian models of graphs, arrays and other exchangeable random structures. IEEE Transactions on Pattern Analysis and Machine Intelligence, 37(2):437–461, 2014.
- [15] John Kingman. Completely random measures. Pacific Journal of Mathematics, 21(1):59–78, 1967.
- [16] Christian Robert and George Casella. Monte Carlo Statistical Methods. Springer, 2nd edition, 2004.
- [17] Andrew Gelman, John Carlin, Hal Stern, David Dunson, Aki Vehtari, and Donald Rubin. Bayesian data analysis. CRC Press, 3rd edition, 2013.
- [18] Michael Escobar and Mike West. Bayesian density estimation and inference using mixtures. Journal of the American Statistical Association, 90:577–588, 1995.
- [19] Thomas Griffiths and Zoubin Ghahramani. Infinite latent feature models and the Indian buffet process. In Advances in Neural Information Processing Systems, 2005.
- [20] Tamara Broderick, Ashia Wilson, and Michael Jordan. Posteriors, conjugacy, and exponential families for completely random measures. Bernoulli, 24(4B):3181–3221, 2018.
- [21] Yee Whye Teh, Dilan Görür, and Zoubin Ghahramani. Stick-breaking construction for the Indian buffet process. In Artificial Intelligence and Statistics, 2007.
- [22] Maria Kalli, Jim Griffin, and Stephen Walker. Slice sampling mixture models. Statistics and Computing, 21:93–105, 2011.
- [23] Peiyuan Zhu, Alexandre Bouchard-Côté, and Trevor Campbell. Slice sampling for general completely random measures. In Uncertainty in Artificial Intelligence, 2020.
- [24] David Blei and Michael Jordan. Variational inference for Dirichlet process mixtures. Bayesian Analysis, 1(1):121–143, 2006.
- [25] David Blei and John Lafferty. A correlated topic model of science. The Annals of Applied Statistics, 1(1):17–35, 2007.
- [26] Chong Wang, John Paisley, and David Blei. Online variational inference for the hierarchical Dirichlet process. In International Conference on Artificial Intelligence and Statistics, 2011.
- [27] Finale Doshi, Kurt Miller, Jurgen Van Gael, and Yee Whye Teh. Variational inference for the Indian buffet process. In Artificial Intelligence and Statistics, pages 137–144, 2009.
- [28] Trevor Campbell, Jonathan Huggins, Jonathan How, and Tamara Broderick. Truncated random measures. Bernoulli, 25(2):1256–1288, 2019.
- [29] Hemant Ishwaran and Lancelot James. Gibbs sampling methods for stick-breaking priors. Journal of the American Statistical Association, 96(453):161–173, 2001.
- [30] Hemant Ishwaran and Mahmoud Zarepour. Exact and approximate sum representations for the Dirichlet process. Canadian Journal of Statistics, 30(2):269–283, 2002.
- [31] Anirban Roychowdhury and Brian Kulis. Gamma Processes, Stick-Breaking, and Variational Inference. In International Conference on Artificial Intelligence and Statistics, 2015.
- [32] Diana Cai and Tamara Broderick. Completely random measures for modeling power laws in sparse graphs. In NIPS 2015 Workshop on Networks in the Social and Informational Sciences, 2015.
- [33] Harry Crane and Walter Dempsey. A framework for statistical network modeling. arXiv:1509.08185, 2015.
- [34] Jan Rosiński. Series representations of Lévy processes from the perspective of point processes. In Lévy processes, pages 401–415. Springer, 2001.
- [35] Thomas Ferguson and Michael Klass. A representation of independent increment processes without Gaussian components. The Annals of Mathematical Statistics, 43(5):1634–1643, 1972.
- [36] Robert Wolpert and Katja Ickstadt. Poisson/gamma random field models for spatial statistics. Biometrika, 85(2):251–267, 1998.
- [37] Yee Whye Teh and Dilan Gorur. Indian buffet processes with power-law behavior. In Advances in Neural Information Processing Systems, pages 1838–1846, 2009.
- [38] Yee Whye Teh and Michael Jordan. Hierarchical Bayesian nonparametric models with applications. Bayesian Nonparametrics, 1:158–207, 2010.
- [39] Jan Rosiński. On series representations of infinitely divisible random vectors. The Annals of Probability, pages 405–430, 1990.
- [40] Günter Last and Mathew Penrose. Lectures on the Poisson process, volume 7. Cambridge University Press, 2017.
- [41] Thomas Ferguson. A Bayesian analysis of some nonparametric problems. The Annals of Statistics, 1:209–230, 1973.
- [42] Nils Lid Hjort. Nonparametric Bayes estimators based on beta processes in models for life history data. The Annals of Statistics, 18(3):1259–1294, 1990.
- [43] Anders Brix. Generalized gamma measures and shot-noise Cox processes. Advances in Applied Probability, 31(4):929–953, 1999.
- [44] Charles Antoniak. Mixtures of Dirichlet processes with applications to Bayesian nonparametric problems. The Annals of Statistics, 2:1152–1174, 1974.
- [45] Thomas Griffiths and Zoubin Ghahramani. Infinite latent feature models and the Indian buffet process. In Advances in Neural Information Processing Systems, 2006.
- [46] Pietro Panzarasa, Tore Opsahl, and Kathleen M Carley. Patterns and dynamics of users’ behavior and interaction: Network analysis of an online community. Journal of the American Society for Information Science and Technology, 60(5):911–932, 2009.
- [47] John Kingman. Poisson Processes. Oxford Studies in Probability. Clarendon Press, 1992.
Appendix A Equivalence between nonzero rates from a rejection representation and the inverse Lévy representation
Proof of Theorem 3.5.
Denote be the first nonzero element that is generated from the rejection representation from Eq. 6 and correspondingly, denote be the jump of the unit-rate homogeneous Poisson process on such that , where is the proposal measure in the rejection representation. Let be a bounded continuous function. Then
| (64) | ||||
| (65) | ||||
| (66) | ||||
| (67) |
Note that given , , for , so
| (68) |
where . Using the change of variable , we obtain
| (69) |
Therefore, using the same change of variable trick,
| (70) | ||||
| (71) | ||||
| (72) | ||||
| (73) | ||||
| (74) |
Suppose that is the first rate generated using the inverse Lévy representation. Then
| (75) |
Making the change of variable , we obtain
| (76) |
Therefore, the first nonzero rate from the rejection representation has the same marginal distribution as the first rate from the inverse Lévy representation.
We now employ an inductive argument. Suppose that we have shown that the marginal distribution of first nonzero elements from the rejection representation has the same marginal distribution as the first elements from the inverse Lévy representation. To prove the same for elements, it suffices to show that the conditional distribution of given is equal to the conditional distribution of given when .
Denote , where , and . Then
| (77) |
where is shorthand for
| (78) |
Using steps similar to the base case,
| (79) |
where
| (80) |
Making the change of variable as before, we obtain
| (81) | ||||
| (82) |
Making another change of variables in the original integral—and hence —yields
| (83) | ||||
| (84) | ||||
| (85) | ||||
| (86) | ||||
| (87) |
On the other hand,
| (88) | ||||
| (89) |
Thus the distribution of the nonzero rate in the rejection representation given is equal to the distribution of the rate from the inverse Lévy representation given when . ∎
Appendix B Truncation error bounds for self-product measures
Proof of Lemma 3.1.
Denote . Denote the marginal probability mass function (PMF) of and as and , and denote their PMFs given as and respectively.
| (90) | |||
| (91) | |||
| (92) | |||
| (93) | |||
| (94) |
Conditioned on , under both the independent and categorical likelihood. So
| (96) |
By Fubini’s Theorem,
| (97) | ||||
| (98) | ||||
| (99) | ||||
| (100) |
∎
Proof of Theorems 3.4 and 4.1.
Denote the set of indices
| (101) |
such that indicates that the first elements of belong to the truncation, and the remaining elements belong to the tail. By Jensen’s inequality,
| (102) |
This equation arises by noting that if and only if for all involving an index , the count of edge is 0 after rounds; the factor accounts for the fact that is independent of the ordering of the .
Consider a single term in the above sum. Since we are conditioning on , we have that are fixed in the expectation, and the remaining steps are the ordered jumps of a unit rate homogeneous Poisson process on . By the marking property of the Poisson process [47], conditioned on , we have that is a Poisson process on with rate measure . Thus we apply the Slivnyak-Mecke theorem [40] to the remaining indices to obtain
| (103) | ||||
| (104) | ||||
| (105) | ||||
| (106) |
where . Substitution of this expression into Eq. 102 yields the result of Theorem 4.1. Next, we consider the bound on the marginal probability . By Jensen’s inequality applied to Eq. 102 and following the previous derivation, we find that
| (107) |
and
| (108) | ||||
| (109) |
Using the fact that conditioned on , are uniformly distributed on , and that at most one can be equal to ,
| (110) | |||
| (111) | |||
| (112) |
where the first and second terms arise from portions of the sum where all indices satisfy and one index satisfies , respectively.
To complete the result, we study the asymptotics of the marginal probability bound. It follows from Eq. 8 that almost surely. Therefore
| (113) |
It then follows from [28, Lemma B.1] and continuous mapping theorem that
| (114) |
Since this sequence is monotonically increasing in , we have that
| (115) |
∎
B.1 Proof of Theorem 3.6
We first state an useful results which states that if one perturbs the probabilities of a countable discrete distribution by i.i.d. random variables, the arg max of the resulting set is a sample from that distribution.
Lemma B.1.
[28, Lemma 5.2] Let be a countable collection of positive numbers such that and let . If are i.i.d random variables, then exists, is unique a.s., and has distribution
| (116) |
Proof of Theorem 3.6.
Since the edges from the categorical likelihood process are i.i.d. categorical random variables, by Jensen’s inequality,
| (117) |
Next, since , we can simulate a categorical variable with probabilities proportional to , by sampling indices independently from a categorical distribution with probabilities proportional to and discarding samples where for some . Denote to be the normalized rates, , and the event . Then
| (118) |
Since the normalized rates are generated from the inverse Lévy representation, they are monotone decreasing. Therefore
| (119) | ||||
| (120) |
By Jensen’s inequality,
| (121) |
Note that for a categorical random variable with class probabilities given by , , the quantity is the probability that . So by the infinite Gumbel-max sampling lemma,
| (122) |
where we can replace with the unnormalized because the normalization does not affect the . Denoting
| (123) |
we have that
| (124) |
and so the remainder of the proof focuses on the conditional expectation. Conditioned on ,
| (125) |
The cumulative distribution function and the probability density function of the Gumbel distribution is
| (126) |
So
| (127) |
and
| (128) |
Therefore,
| (129) |
Denote , and
| (130) |
Conditioned on , the tail is a unit rate homogeneous Poisson process on that is independent of . So conditioned on ,
| (131) |
where is unit rate of homogeneous Poisson process on . Since is a Poisson process, is also a Poisson process with the rate measure
| (132) |
is the probability that no atom of the Poisson process is greater than . For a Poisson process with rate measure , this probability is ,
| (133) | ||||
| (134) | ||||
| (135) |
where the second equation comes from the fact that the inner integrand is the probability density function of a Gumbel distribution. Therefore,
| (136) | ||||
| (137) | ||||
| (138) |
For the categorical variable with class probabilities given by , , it holds that as . By the monotone convergence theorem
| (139) |
∎
Appendix C Error bounds for edge-exchangeable networks
C.1 Rejection representation
We first derive the specific form of in Corollary 3.3 for the rejection representation from Eq. 6, where
| (140) |
and . So in Corollary 3.3,
| (141) | ||||
| (142) | ||||
| (143) |
Since , , we can take the indicator in out of the function to obtain
| (144) | ||||
| (145) | ||||
| (146) |
Transforming variables via and , and noting that ,
| (147) |
where is the cumulative distribution function of . Using the same variable transformation again,
| (148) | ||||
| (149) | ||||
| (150) | ||||
| (151) |
| (152) | ||||
| (153) | ||||
| (154) | ||||
| (155) |
C.2 Beta-independent Bernoulli process network
Dense network
When ,
| (156) |
and
| (157) |
Substituting and into Eq. 147 and noting that the integrand is symmetric around the line ,
| (158) |
Next, note that when and
| (159) |
So
| (160) | ||||
| (161) |
For any , dividing the integral into two parts and bounding each part separately,
| (162) |
Assume for the moment that . Use the fact that and note also that when , ,
| (163) | ||||
| (164) | ||||
| (165) |
It can be seen that there exists a constant value such that . Setting and using the first order Taylor’s expansion to approximate the first term, it can be seen that
| (166) |
Therefore, there exists such that when ,
| (167) |
If ,
| (168) | ||||
| (169) |
which can be bounded similarly by choosing the same and setting . Therefore we can find a constant and for ,
| (170) |
Next, the term is bounded via
| (171) | ||||
| (172) | ||||
| (173) |
This has exactly the same form as , except that the CDF of is replaced with that of . Therefore, it can be shown that for large ,
| (174) |
Finally, may be expressed as
| (175) | ||||
| (176) | ||||
| (177) |
Since ,
| (178) | ||||
| (179) | ||||
| (180) |
We split the analysis of this term into two cases. In the first case, assuming , we have that
| (181) |
On the other hand, if , we bound the integral over and over separately. Since for ,
| (182) | ||||
| (183) | ||||
| (184) | ||||
| (185) |
As , the second term will dominate the first term, so when , the following inequality holds for large ,
| (186) |
and as , will dominate and . So there exists a such that for ,
| (187) |
Sparse network
When ,
| (188) |
and
| (189) |
Similar to the case when ,
| (190) |
Since ,
| (191) | ||||
| (192) | ||||
| (193) | ||||
| (194) |
Denoting , then
| (195) | ||||
| (196) | ||||
| (197) |
By Stirling’s formula,
| (198) |
Now we consider the error bound for . As we have shown in the example when , here we can obtain that
| (199) |
Similar to and ,
| (200) | ||||
| (201) | ||||
| (202) | ||||
| (203) |
We again split our analysis into two cases. First, suppose that . Then
| (204) | ||||
| (205) | ||||
| (206) |
Since ,
| (207) |
and so
| (208) | ||||
| (209) | ||||
| (210) |
where the last equation is obtained from Stirling’s formula.
On the other hand, if ,
| (211) | ||||
| (212) | ||||
| (213) | ||||
| (214) |
If , we get the same result as in the case when . When , note that we can find an such that when ,
| (215) |
So
| (216) | ||||
| (217) | ||||
| (218) | ||||
| (219) | ||||
| (220) |
Because here we assume that , the second term will dominate. So in this case we obtain that for large ,
| (221) |
Asymptotically, will dominate and , so there exists such that when ,
| (222) |
C.3 Gamma-independent Poisson network
Dense network
When ,
| (223) |
In this case,
| (224) |
For Poisson distribution, , so
| (225) |
Note that the integrand is symmetric around the line , so we only need to compute the integral above the line . In this region, and . So
| (226) | ||||
| (227) | ||||
| (228) |
For any , we divide the integral into two parts and bound each part separately. We denote and use the fact that and . So
| (229) | ||||
| (230) | ||||
| (231) |
Setting two terms equal and use the fact that when is large, we get and is defined by
| (232) |
Therefore,
| (233) |
Similarly,
| (234) | ||||
| (235) |
Note that
| (236) | ||||
| (237) |
Keeping only the positive part,
| (238) | ||||
| (239) |
This has the same form as , so
| (240) |
Next,
| (241) | ||||
| (242) | ||||
| (243) | ||||
| (244) | ||||
| (245) |
Note that , so
| (246) | ||||
| (247) |
Since will dominate and asymptotically, there exists such that for ,
| (248) |
Sparse network
When ,
| (249) |
and
| (250) |
Similar to the example when ,
| (251) | ||||
| (252) | ||||
| (253) |
Note that the integrand with respect to is the density function of the gamma distribution with shape and rate , so the integral is less than 1. We partition the outer integral into two parts and bound them separately,
| (254) | ||||
| (255) | ||||
| (256) |
By setting the two terms in the brackets equal, we get
| (257) |
So
| (258) |
Similar to the last example where , here
| (259) | ||||
| (260) | ||||
| (261) | ||||
| (262) |
This has the same form as , and therefore
| (263) |
Finally, since both and ,
| (264) | ||||
| (265) | ||||
| (266) | ||||
| (267) | ||||
| (268) |
By Stirling’s formula,
| (269) |
So
| (270) |
dominates and asymptotically, so there exists such that for ,
| (271) |
Appendix D Truncated inference
Proof of Theorem 4.2.
Fix and , and define the subset of state space . By assumption,
| (272) |
Further, by applying the bound from Theorem 4.1, we know that for states in ,
| (273) |
Suppose is the RHS of Eq. 55 that is proportional to the density of , and is the RHS of Eq. 55 removing the term , which is proportional to the density of :
| (274) |
Define the normalization constants such that . Then the above bounds yield
| (275) |
Therefore, , and hence
| (276) |
The above results yield the total variation bound via
| (277) | ||||
| (278) | ||||
| (279) | ||||
| (280) | ||||
| (281) |
∎