Trends in elastic properties of Ti-Ta alloys from first-principles calculations
Abstract
The martensitic start temperature () is a technologically fundamental characteristic of high-temperature shape memory alloys. We have recently shown [Phys. Rev. B 94, 224104 (2016)] that the two key features in describing the composition dependence of are the K phase stability and the difference in vibrational entropy which, within the Debye model, is directly linked to the elastic properties. Here, we use density functional theory together with special quasi-random structures to study the elastic properties of disordered martensite and austenite Ti-Ta alloys as a function of composition. We observe a softening in the tetragonal shear elastic constant of the austenite phase at low Ta content and a non-linear behavior in the shear elastic constant of the martensite. A minimum of 12.5% Ta is required to stabilize the austenite phase at K. Further, the shear elastic constants and Young’s modulus of martensite exhibit a maximum for Ta concentrations close to 30%. Phenomenological, elastic-constant-based criteria suggest that the addition of Ta enhances the strength, but reduces the ductile character of the alloys. In addition, the directional elastic stiffness, calculated for both martensite and austenite, becomes more isotropic with increasing Ta content. The reported trends in elastic properties as a function of composition may serve as a guide in the design of alloys with optimized properties in this interesting class of materials.
I Introduction
Ti-Ta alloys are among the most promising candidates for high-temperature shape memory alloys (HTSMAs), materials which exhibit martensitic phase transformations to reversely convert heat into mechanical strain and that are currently being employed as, e.g., sensors or actuators in automotive and aerospace applications Ma, Karaman, and Noebe (2010); Buenconsejo et al. (2009); Firstov, Humbeeck, and Koval (2004). Among various types of shape memory alloys such as Ti-Mo Miyazaki, Kim, and Hosoda (2006); Kim et al. (2006a, b) and Ti-Nb Matsumoto, Watanabe, and Hanada (2006); Inamura et al. (2005), Ti-Ta solid solutions not only present advantages including relatively high transformation temperatures ( 373 K) and a low tendency to form the hexagonal phase, which is detrimental for the shape memory effect and causes embrittlement Buenconsejo et al. (2009), but also show excellent cold workability Buenconsejo, Kim, and Miyazaki (2011). Theoretical and experimental investigations on Ti-Ta and Ti-Ta-based alloys demonstrated that the martensitic transformation temperature , as well as other physical properties of the two phases are strongly composition dependent Chakraborty, Rogal, and Drautz (2016); Buenconsejo et al. (2009); Chakraborty, Rogal, and Drautz (2015); Ferrari et al. (2019a, b).
Recently, we have shown that the relative phase stability at K and the difference in the vibrational free energy contribution (which within the Debye model is derived from the elastic properties) between the martensite (orthorhombic, , low-temperature phase) and the austenite (cubic, , high-temperature phase) phases in Ti-Ta are the two critical parameters that govern the composition dependence of Chakraborty, Rogal, and Drautz (2016). The relative stability of the different competing phases in Ti-Ta alloys has been studied extensively in our previous work Chakraborty, Rogal, and Drautz (2015). Wu et al. Wu et al. (2010) studied the phase stability and also elastic properties, but of only the phase in Ti-Ta alloys and without accounting for chemically disordered structures. A careful analysis of changes in the elastic properties of both, austenite and martensite, upon varying the Ta concentration can improve our understanding of the chemical interplay that may affect the martensitic transformation in shape memory alloys as well as provide useful insights into designing HTSMAs with desired properties. Moreover, trends in elastic properties can be used to determine the conditions of mechanical stability in cubic Ti-based alloys Skripnyak et al. (2018) and qualitatively assess the alloy mechanical behavior. A comprehensive investigation of the elastic properties, in particular of the martensite phase, is, to the best of our knowledge, still missing in theory and experiment, motivating the present study.
Here, we use density functional theory (DFT) to investigate the single-crystal elastic constants and derived polycrystalline properties of the martensite and austenite phases of Ti-Ta alloys as a function of composition. Our results show that the tetragonal shear elastic constant of the austenite phase softens at very low Ta content and then gradually stiffens upon further alloying with Ta. This indicates that the mechanical stability of the austenite increases with increasing Ta content. The shear elastic constants of the martensite phase exhibit a non-linear behavior with a maximum value at intermediate Ta concentrations. The polycrystalline properties of the two phases derived from the single crystal elastic constants correspondingly reveal similar trends. Based on the empirical criteria proposed by Pugh Pugh (1954), Pettifor Pettifor (1992), and most recently by Niu et al. Niu et al. (2012), our results suggest that Ta enhances the strength of Ti-Ta binary alloys and lowers the ductility. We have also investigated the effect of Ta alloying on the anisotropy of both phases by calculating different anisotropy indices and directional-dependent Young’s moduli. The anisotropy of both phases decreases smoothly with increasing Ta content.
The paper is organized as follows: In Section II we describe the computational details and the Voight-Reuss-Hill (VRH) approximation for polycrystalline elastic moduli. In Section III we present our ab initio results on the single crystal elastic and polycrystalline properties, as well as the elastic anisotropy. We conclude our findings in Section IV.
II Computational details
First principles density functional theory (DFT) calculations were carried out using the Vienna Simulation Package (VASP) Kresse and Furthmüller (1996a, b); Kresse and Joubert (1999). We use Perdew-Burke-Ernzerhof gradient corrected exchange-correlation functional (PBE-GGA) Perdew, Burke, and Ernzerhof (1996) for all calculations. Projector augmented wave (PAW) Kresse and Joubert (1999); Blöchl (1994) potentials were used for all calculations including 3 and 5 electrons for Ti and Ta in the valence shell, respectively. A cutoff energy of 300 eV for the plane waves and Methfessel-Paxton scheme was used to integrate the Brillouin zone (BZ) with a smearing of = 0.05 eV. With this setup, total energies are converged to within 4 meV/atom. We have used special quasi-random structure (SQS) method Zunger et al. (1990) as implemented in the modified version von Pezold et al. (2010); Koßmann et al. (2015) of the ATAT package van de Walle, Asta, and Ceder (2002) to model the chemical disorder of the martensite and austenite phases. We considered six different compositions with 12.5%, 18.75%, 25%, 31.25%, 37.5% and 43.75% Ta (details concerning the corresponding SQS supercells can be found in the Supplementary Material (SM)).
The elastic constants of the martensite and austenite phases were calculated using the stress-strain method as implemented in VASP Page and Saxe (2002). The cubic austenite and orthorhombic martensite phases have three (, , and ) and nine (, , , , , , , and ) independent elastic constants, respectively. For cubic systems, represents the uniaxial deformation along the [001] direction, is the shear stress at the (110) crystal plane along the [110] direction, and represents a shear deformation on the (100) crystal plane. The elastic tensor matrix for the martensite (orthorhombic) phase is given by
For the austenite (cubic), , , and . Using SQSs to describe the chemical disorder results in a lowering of the symmetry and minor differences in the elastic constants that are equivalent in the cubic phase. Correspondingly, the elastic constants for the phase have been averaged as Tasnádi, Odén, and Abrikosov (2012); Gao et al. (2013)
| (1) | |||
The polycrystalline elastic moduli of the martensite and austenite phases have been computed within the Voigt-Reuss-Hill (VRH) approximation Voigt (1928); Reuss (1929); Hill (1952). The Voigt approximation Voigt (1928) provides an upper bound of the bulk () and shear () modulus, whereas the Reuss approximation Reuss (1929) represents a lower bound of and . The relationship between the elastic constants matrix C and the compliance matrix S elements with the polycrystalline bulk and shear moduli for the martensite and the austenite are given by Xiao et al. (2011); Connétable and Thomas (2009):
-
•
Austenite phase:
| (2) |
| (3) |
| (4) |
-
•
Martensite phase:
| (5) |
| (6) |
| (7) |
| (8) | |||
where , , etc. are the elements of the elastic compliance matrix with S = C-1. , , , and are the bulk modulus and shear modulus from the Voigt and Reuss equations, respectively. Polycrystalline elastic properties such as and can be calculated from the elastic constants using the VRH approximation
| (9) |
| (10) |
Furthermore, the Young’s modulus () within the VRH framework is given by
| (11) |
III Results
III.1 Composition dependent elastic constants
III.1.1 Single crystal elastic constants
In this section, we report the trends in elastic constants of the austenite and martensite as a function of composition. The elastic constants for pure bcc Ti and bcc Ta (see Table S1 in the Supplementary Material) are in good agreement with previous ab initio and experimental results Ikehata et al. (2004); Allard (1969). According to the Born-Huang criteria Wu et al. (2007) a cubic phase is mechanically stable if
| (12) |

The austenite phase in Ti-Ta satisfies the Born-Huang stability criteria for all compositions studied, that is the austenite phase appears to be elastically stable (values are listed in Table S2 of the Supplementary Material). The tetragonal shear constant (/2) is strongly dependent on composition, increasing with increasing Ta content as shown in Fig. 1. This implies that alloying Ta stabilizes the bcc austenite phase, which is expected as Ta is a -stabilizer. Below 12.5% Ta our calculations predict that the austenite phase will be mechanically unstable at K as becomes negative, which is in agreement with the fact that bcc Ti is mechanically and dynamically unstable at = 0 K Mei et al. (2009); Hu et al. (2010). The top -axis of Fig. 1 displays the corresponding change in the ratio (the number of electrons per atom). The monotonic correlation between and has been identified experimentally by Fischer et al. Fischer and Dever (1970) for bcc transition metals, and has also been recognized later theoretically for -type Ti alloys such as Ti-Nb Hu et al. (2008); Lai et al. (2013), consistent with our findings for Ti-Ta. Similar results have also been reported for Ti-V solid solutions Skripnyak et al. (2018), where % V are required to mechanically stabilize the bcc phase in Ti-V alloys.
In the right graph of Fig. 1, the dependence of the trigonal shear constant () on composition is shown. also increases with increasing Ta concentration, but is much less sensitive to a change in composition (increase by only 10%) compared to . Similar findings have also been reported for Ti-Nb Lai et al. (2013); Gutiérrez Moreno et al. (2018) and Ti-V Skripnyak et al. (2018), where is also nearly independent of Nb and V alloying, respectively.
The mechanical stability criteria for the orthorhombic martensite phase are Wu et al. (2007)
| (13) |
The elastic constants of the martensite are shown in Fig. 2 as a function of Ta concentration (values are provided in Table S3 of the Supplementary Material). All criteria in Eq. (13) are satisfied implying the existence of a mechanically stable martensite phase over the entire composition range studied in this work. The elastic constants, apart from characterizing the mechanical and dynamical stability of materials, can often also be related to the crystallographic axes to obtain insights into the incompressibility along different directions. , for example, characterizes resistance to linear compression under uniaxial stress along the direction Ma et al. (2017); Ganeshraj and Santhosh (2014) which also represents atomic bonding along the direction Masys and Jonauskas (2013). Between the austenite and martensite the orientation relationship (OR) is given by
| (14) | |||
To be consistent with common notations used in experiments for the martensite phase with lattice vectors < < , we have setup our supercells such that
| (15) | |||
For low Ta content, , indicative of the fact that the martensite phase reveals the largest incompressibility along the and axis, and that it is relatively compressible along the axis. With increasing Ta content, increases significantly, while and exhibit smaller changes. is very similar in the martensite and austenite (open circles in Fig. 2) phases, which is reasonable since considering the OR between the two phases corresponds to a deformation in the same crystallographic direction. Also, wee see that at 43.75% Ta, the value of for the austenite phase becomes higher than that of the martensite phase, indicative of a higher mechanical stability of the austenite phase at high Ta content.

The shear elastic constants , , and in Fig. 2 show approximately the same value at 12.5% Ta. The similarities in shear moduli at low Ta content might be indicative of the tendency of Ti-Ta to transform into the energetically more stable hexagonal phase Chakraborty, Rogal, and Drautz (2015), for which = = . For larger Ta concentrations, the shear moduli of the martensite maintain the trend over the entire investigated composition range. This indicates that the martensite phase possesses the greatest shear resistance within the (100) plane and that the softest shearing transformation is observed along the (001) plane. While and change only slightly, exhibits a non-linear behaviours with an increase up to about 30% Ta, followed by a slight decrease.
At high Ta content, there seems to be an interesting pattern where the primary elastic constants (, , and ), off-diagonal elastic constants (, , and ), and the shear constants (, , and ) tend to converge to three distinct sets of values, respectively (i.e., to say, , , ), cf. Fig. 2. One could imagine that these three sets qualitatively represent the three elastic constants of a cubic phase. This implies that the martensite is on the verge of martensite austenite phase transformation, which is in good agreement with previous theoretical and experimental findings Chakraborty, Rogal, and Drautz (2015); Dobromyslov and Elkin (2001, 2006); Zhou, Niinomi, and Akahori (2004). It is further supported by the fact that both, the and , ratios of the martensite decrease with increasing Ta content Chakraborty, Rogal, and Drautz (2016), making the martensite phase more cubic.

III.1.2 Polycrystalline properties
Using the values of elastic constants together with VRH approximation we studied various polycrystalline properties of the martensite and the austenite phase as a function of composition. The corresponding values for the bulk (), shear (), and Young’s () moduli are shown in Fig. 3. The bulk modulus (top graph) increases linearly with increasing Ta content for both phases, and appears to be a simple linear interpolation between the bulk moduli of pure Ti and Ta. The shear modulus mainly depends upon the shear strain and is a measure of the stability of a phase upon shear. As shown in the middle panel of Fig. 3, also increases linearly with Ta content for the cubic austenite phase. For the martensite phase, however, initially increases linearly up to 25% Ta, then exhibits a plateau-like region up to 40% Ta, before it decreases upon further addition of Ta. This interesting behavior of for the martensite phase originates in the corresponding shear elastic constants (, , and ) that show a similar trend, see Fig. 2. It is to be noted that although the value of differs maximum among both the phases within the 25%-35% Ta content regime, at very low and high Ta content the values tend to converge, which might be related to the expected phase transformations (, ) and at low and high Ta content, respectively. The Young’s modulus reflects the stiffness of a material which in turn is connected to the bonding strength within the material. The dependence of on the composition is shown in the lower panel of Fig. 3. The change in with Ta alloying is similar to that in for both phases, that is linear for the austenite and non-linear with a clear maximum for the martensite phase. The trends in , , and of the austenite and martensite phase are in very similar to that observed for Ti-Nb alloys Gutiérrez Moreno et al. (2018); Lai et al. (2013).

To investigate the brittle-ductile properties in these alloys, we follow a more recently discovered universal ductile-to-brittle criterion reported by Niu et al. Niu et al. (2012), which is essentially a renormalized hyperbolic correlation derived by dividing the Cauchy pressure by the Young’s modulus (revised Cauchy pressure) and plotting it as a function of Pugh’s ratio, . According to Niu et al. Niu et al. (2012), the higher Pugh’s ratio the higher the material’s strength and consequently hardness. On the other hand, a higher value of the revised Cauchy pressure indicates a more ductile material. In Fig. 4, the corresponding results are shown for the martensite and austenite phases. With increasing Ta content both, the martensite and austenite, tend to increase strength i.e, loose their ductility. However, we also note that due to the non-linear elastic response of the martensite it becomes more ductile again upon further alloying Ta above 40%. There is currently no existing experimental evidence to support our brittle-ductile findings, however, we note that stabilizing element, in general, tends to enhances the Pugh’s ratio e.g, in Ti-Nb Lai et al. (2013), similar to our findings for Ti-Ta.
III.2 Elastic anisotropy
Elastic anisotropy plays a crucial role in the formation of microcracks in materials Tvergaard and Hutchinson (1988) as well as significantly impacts the mechanical properties of materials Tasnádi et al. (2010). It is therefore important to study elastic anisotropy in materials to understand their durability that, in turn, can assist the design of improved materials. In this work, we have computed two important anisotropy indices: (1) Universal elastic anisotropy () Ranganathan and Starzewski (2008), which is also interpreted as a generalization of the Zener anisotropy index, and (2) Chung-Buessem percent shear anisotropy () Chung and Buessem (1967). These are defined as


| (16) |
| (17) |
Both parameters have been extensively used in the materials community to study elastic anisotropy of materials Xiao et al. (2011); Ravindran et al. (1998); Ganeshraj and Santhosh (2014); Wu et al. (2019); Maxisch and Ceder (2006); Mao et al. (2015); Dong et al. (2013). For a perfectly isotropic crystal = = 0. There is no upper bound for , whereas the maximum value of is 1. The deviation from 0, for both parameters, is a measure of the anisotropic behavior of a material.
The calculated values of these two quantities for the austenite and martensite phases as a function of composition are shown in Fig. 5. Both indices ( and ) have large values for the two phases at low Ta concentrations suggesting a highly anisotropic nature. With increasing Ta content, and converge towards zero implying that the addition of Ta makes both phases more isotropic. The anisotropy appears to be less connected to the respective crystal phase, but more to the properties of the elements, since Ta is more isotropic than Ti.
The two, commonly used anisotropy indices are often not sufficient to fully depict the elastic behavior of different crystal phases. In order to further extend our description of the anisotropic behavior of the austenite and martensite phases we calculate the directional dependence of the Young’s modulus as a function of composition. This approach has been well established for various systems Xiao et al. (2011); Ravindran et al. (1998); Ma et al. (2008); Koval et al. (2020); Ghosh (2015) to study the elastic anisotropy of materials. The direction-dependent Young’s modulus for the martensite (orthorhombic) is given by Nye (1985)
| (18) |
Likewise, the direction-dependent Young’s modulus for the austenite (cubic) is given by Nye (1985); Lee, Park, and Soon (2016)
| (19) |
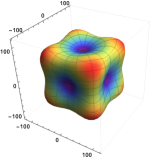
where and are the elastic compliance matrix elements as introduced above. , and are the direction cosines, calculated using a spherical coordinate system i.e. , , and . In Fig. 6 we show the directional dependence of the Young’s modulus of the martensite as a function of composition. At low Ta content, the martensite phase reveals a strong anisotropy in the Young’s modulus that decreases smoothly with increasing Ta content, similar to the trend in the anisotropy indices discussed above. Likewise, in Fig. 7 the directional dependence of the Young’s modulus of the austenite phase is shown as a function composition. The outcome is similar to what we already observe for martensite and again this is good agreement with the findings from our anisotropy indices discussion. Similar behavior was also observed in -type Ti-Nb alloys Gutiérrez Moreno et al. (2018); Ma et al. (2008) where it was found that at 18.75% Nb content the phase shows strong anisotropy in the Young’s modulus, but at 31.25% Nb the anisotropy decreases drastically and the material becomes almost fully isotropic. The austenite phase exhibits the highest values along the [111] axes and reveals exceptionally low Young’s modulus (30 GPa) in the [100], [010] and [100] directions, similar to Ti-Nb alloys Gutiérrez Moreno et al. (2018); Ma et al. (2008). In the martensite the highest values are observed in the [101] direction which is parallel to the [111] direction in austenite. Similarly, the Young’s modulus in [100] direction (parallel to [001] austenite) is lowest, and remains the lowest with increasing Ta content. The overall trend again indicates that the anisotropy is more strongly related to the properties of the elements (Ti and Ta) than to the crystallographic structure.
IV Summary
We have investigated trends in the elastic properties of the martensite and austenite phases in Ti-Ta alloys over a wide range of compositions. The tetragonal shear constant of the high-temperature austenite phase strongly stiffens with increasing Ta content, making the phase more stable, which is in agreement with our previous work and existing literature. Below 12.5% Ta, the austenite phase becomes unstable. The martensite phase exhibits and unexpected non-linear trend in the shear elastic constants, with a maximum at 30% Ta.
The polycrystalline bulk, shear, and Young’s moduli of the austenite show a linear dependence on the composition, whereas the shear and Young’s moduli of the martensite again behaves non-linear, similar to the single crystal shear elastic constants. This gives rise to different thermodynamic and mechanical properties observed in the two phases which may have potential applications in other sectors e.g. in the biomedical industry where materials with low Young’s modulus are desirable. Using a universal brittle-ductile phase diagram reveals that the addition of Ta enhances the strength but reduces the ductility in these alloys.
Furthermore, the anisotropy in the Young’s modulus is strongly composition dependent for both phases. With increasing Ta content the elastic properties become more isotropic independent of the phase which indicates that this originates mainly in the isotropic nature of Ta. This information is of particular interest in the study of microcrack formation.
The class of Ti-Ta alloys is not only of importance as high-temperature shape memory alloys, but might also show potential for biomedical applications, as sensors or actuators. The presented trends in the elastic properties of the martensite and austenite phases in Ti-Ta alloys can be helpful in the design of new materials and aid experimentalists in the identification of promising alloy compositions.
Supplementary Material
See Supplementary Material for details on the structural description of the martensite and austenite phases, their elastic constants and polycrystalline values, a brittle-ductile phase diagram and values of the anisotroy indices.
Acknowledgements.
The work presented in this paper has been financially supported by the Deutsche Forschungsgemeinschaft (DFG) within the research unit FOR 1766 (High Temperature Shape Memory Alloys, http://www.for1766.de, Project No. 200999873, sub-project 3). The authors thank Ralf Drautz and Davide Sangiovanni for critical comments and helpful discussions.Data availability
The data that support the findings of this study are available within the article and its Supplementary Material. Additional data are available from the corresponding author upon reasonable request.
References
- Ma, Karaman, and Noebe (2010) J. Ma, I. Karaman, and R. Noebe, Int. Mater. Rev. 55, 257 (2010).
- Buenconsejo et al. (2009) P. J. S. Buenconsejo, H. Y. Kim, H. Hosoda, and S. Miyazaki, Acta Mater. 57, 1068 (2009).
- Firstov, Humbeeck, and Koval (2004) G. S. Firstov, J. V. Humbeeck, and Y. N. Koval, Mater. Sci. Eng. A 378, 2 (2004).
- Miyazaki, Kim, and Hosoda (2006) P. S. Miyazaki, H. Y. Kim, and H. Hosoda, Mater. Sci. Eng. A 438, 18 (2006).
- Kim et al. (2006a) H. Y. Kim, Y. Ikehara, J. I. Kim, T. Inamura, H. Hosoda, and S. Miyazaki, Acta Mater. 54, 2419 (2006a).
- Kim et al. (2006b) H. Y. Kim, Y. Ohmatsu, J. I. Kim, H. Hosoda, and S. Miyazaki, Mater. Trans. 45, 518 (2006b).
- Matsumoto, Watanabe, and Hanada (2006) H. Matsumoto, S. Watanabe, and S. Hanada, Mater. Trans. 465, 1070 (2006).
- Inamura et al. (2005) T. Inamura, Y. Fukui, H. Hosoda, K. Wakashima, and S. Miyazaki, Mater. Sci. Eng. C 253, 426 (2005).
- Buenconsejo, Kim, and Miyazaki (2011) P. J. S. Buenconsejo, H. Y. Kim, and S. Miyazaki, Scripta. Mater. 64, 1114 (2011).
- Chakraborty, Rogal, and Drautz (2016) T. Chakraborty, J. Rogal, and R. Drautz, Phys. Rev. B 94, 224104 (2016).
- Chakraborty, Rogal, and Drautz (2015) T. Chakraborty, J. Rogal, and R. Drautz, J. Phys.: Condens. Matter 25, 115401 (2015).
- Ferrari et al. (2019a) A. Ferrari, P. M. Kadletz, T. Chakraborty, K. Liao, D. Langenkämper, Y. Motemani, A. Paulsen, Y. Lysogorskiy, J. Frenzel, J. Rogal, A. Ludwig, C. Somsen, R. Drautz, and W. W. Schmahl, Shape Memory and Superelasticity 5, 6–15 (2019a).
- Ferrari et al. (2019b) A. Ferrari, A. Paulsen, D. Langenkämper, D. Piorunek, C. Somsen, J. Frenzel, J. Rogal, G. Eggeler, and R. Drautz, Phys. Rev. Materials 3, 103605 (2019b).
- Wu et al. (2010) C. Y. Wu, Y. H. Xin, X. F. Wang, and J. G. Lin, Solid State Sci. 12, 2120 (2010).
- Skripnyak et al. (2018) N. V. Skripnyak, A. V. Ponomareva, M. P. belov, and I. A. Abrikosov, Materials and Design 140, 357 (2018).
- Pugh (1954) S. F. Pugh, Philos. Mag. Ser. 45, 823 (1954).
- Pettifor (1992) D. G. Pettifor, Mater. Sci. Technol. 8, 345 (1992).
- Niu et al. (2012) H. Niu, X.-Q. Chen, P. Liu, W. Xing, X. Cheng, D. Li, and Y. Li, Sci. Rep. 2, 718 (2012).
- Kresse and Furthmüller (1996a) G. Kresse and J. Furthmüller, Comput. Mater. Sci. 6, 15 (1996a).
- Kresse and Furthmüller (1996b) G. Kresse and J. Furthmüller, Phys. Rev. B 54, 11169 (1996b).
- Kresse and Joubert (1999) G. Kresse and D. Joubert, Phys. Rev. B 59, 1758 (1999).
- Perdew, Burke, and Ernzerhof (1996) J. P. Perdew, K. Burke, and M. Ernzerhof, Phys. Rev. Lett. 77, 3865 (1996).
- Blöchl (1994) P. E. Blöchl, Phys. Rev. B 50, 17953 (1994).
- Zunger et al. (1990) A. Zunger, S. H. Wei, L. G. Ferreira, and J. E. Bernard, Phys. Rev. Lett. 65, 353 (1990).
- von Pezold et al. (2010) J. von Pezold, A. Dick, M. Friák, and J. Neugebauer, Phys. Rev. B 81, 094203 (2010).
- Koßmann et al. (2015) J. Koßmann, T. Hammerschmidt, S. Maisel, S. Müller, and R. Drautz, Intermetallics 64, 44 (2015).
- van de Walle, Asta, and Ceder (2002) A. van de Walle, M. Asta, and G. Ceder, CALPHAD 26, 539 (2002).
- Page and Saxe (2002) Y. L. Page and P. Saxe, Phys. Rev. B 65, 104104 (2002).
- Tasnádi, Odén, and Abrikosov (2012) F. Tasnádi, M. Odén, and I. Abrikosov, Phys. Rev. B 85, 144112 (2012).
- Gao et al. (2013) M. C. Gao, Y. Suzuki, H. Schweiger, O. N. Doğan, J. Hawk, and M. Widom, J. Phys.: Condens. Matter 25, 075402 (2013).
- Voigt (1928) W. Voigt, Lehrburch der Kristallphysik (Teubner, Leipzig, 1928).
- Reuss (1929) A. Reuss, Z. Angew. Math. Mech. 65, 350 (1929).
- Hill (1952) R. Hill, Proc. Phys. Soc. London 65, 350 (1952).
- Xiao et al. (2011) B. Xiao, J. Feng, C. T. Zhou, Y. H. Jiang, and R. Zhou, J. Appl. Phys. 109, 023507 (2011).
- Connétable and Thomas (2009) D. Connétable and O. Thomas, Phys. Rev. B 79, 094101 (2009).
- Ikehata et al. (2004) H. Ikehata, N. Nagasako, T. Furuta, F. Fukomoto, K. Miwa, and T. Saito, Phys. Rev. B 70, 174113 (2004).
- Allard (1969) S. Allard, Metals, Thermal and Mechanical Data, Vol 16 of International Tables of Selected Constants (Pergamon Press, New York, 1969).
- Wu et al. (2007) Z.-j. Wu, E.-j. Zhao, H.-p. Xiang, X.-f. Hao, X.-j. Liu, and J. Meng, Phys. Rev. B 76, 054115 (2007).
- Mei et al. (2009) Z.-G. Mei, S.-L. Shang, Y. Wang, and Z.-K. Liu, Phys. Rev. B 80, 104116 (2009).
- Hu et al. (2010) C.-E. Hu, Z.-Y. Zeng, L. Zhang, X.-R. Chen, L.-C. Cai, and Alfè, J. Appl. Phys. 107, 093509 (2010).
- Fischer and Dever (1970) E. S. Fischer and D. Dever, Acta. Metall 18, 265 (1970).
- Hu et al. (2008) Q.-M. Hu, S.-J. Li, Y.-L. Hao, R. Yang, B. Johansson, and L. Vitos, Appl. Phys. Lett. 93, 121902 (2008).
- Lai et al. (2013) M. Lai, X. Xue, C. Meng, H. Kou, B. Tang, H. Chang, and J. Li, Mater. Sci. Forum 747, 890 (2013).
- Gutiérrez Moreno et al. (2018) J. J. Gutiérrez Moreno, D. G. Papageorgiou, G. A. Evangelakis, and C. E. Lekka, J. Appl. Phys. 124, 245102 (2018).
- Ma et al. (2017) H. Ma, J. Zhang, B. Zhao, Q. Wei, and Y. Yang, AIP Advances 7, 065007 (2017).
- Ganeshraj and Santhosh (2014) C. Ganeshraj and P. N. Santhosh, J. Appl. Phys. 116, 144104 (2014).
- Masys and Jonauskas (2013) v. Masys and V. Jonauskas, J. Chem. Phys. 139, 224705 (2013).
- Dobromyslov and Elkin (2001) A. V. Dobromyslov and V. A. Elkin, Scripta. Mater. 44, 905 (2001).
- Dobromyslov and Elkin (2006) A. V. Dobromyslov and V. A. Elkin, Mater. Sci. Eng. A 438, 324 (2006).
- Zhou, Niinomi, and Akahori (2004) Y. L. Zhou, M. Niinomi, and T. Akahori, Mater. Sci. Eng. A 371, 283 (2004).
- Tvergaard and Hutchinson (1988) V. Tvergaard and J. W. Hutchinson, J. Am. Chem. Soc. 71, 157 (1988).
- Tasnádi et al. (2010) F. Tasnádi, I. A. Abrikosov, L. Rogström, J. Almer, M. P. Johansson, and M. Od́en, Appl. Phys. Lett. 97, 231902 (2010).
- Ranganathan and Starzewski (2008) S. I. Ranganathan and M. O. Starzewski, Phys. Rev. Lett. 101, 055504 (2008).
- Chung and Buessem (1967) D. H. Chung and W. R. Buessem, J. Appl. Phys. 38, 5 (1967).
- Ravindran et al. (1998) P. Ravindran, L. Fast, P. A. Korzhavyi, and B. Johansson, J. Appl. Phys. 84, 4891 (1998).
- Wu et al. (2019) S.-C. Wu, G. H. Fecher, S. Shahab Naghavi, and C. Felser, J. Appl. Phys. 125, 082523 (2019).
- Maxisch and Ceder (2006) T. Maxisch and G. Ceder, Phys. Rev. B 73, 174112 (2006).
- Mao et al. (2015) P. Mao, B. Yu, Z. Liu, F. Wang, and Y. Ju, J. Appl. Phys. 117, 115903 (2015).
- Dong et al. (2013) H. Dong, C. Chen, S. Wang, W. Duan, and J. Li, Appl. Phys. Lett. 102, 182905 (2013).
- Ma et al. (2008) D. Ma, M. Friák, J. Neugebauer, D. Raabe, and F. Roters, Phys. Stat. Sol. (b) 245, 2642 (2008).
- Koval et al. (2020) N. E. Koval, J. I. Juaristi, R. Díez Muińo, and M. Alducin, J. Appl. Phys. 127, 145102 (2020).
- Ghosh (2015) G. Ghosh, AIP Advances 5, 087102 (2015).
- Nye (1985) J. F. Nye, Physical Properties of Crystals (Oxford University Press, Oxford, 1985).
- Lee, Park, and Soon (2016) J.-H. Lee, J.-H. Park, and A. Soon, Phys. Rev. B 94, 024108 (2016).