TraVLR: Now You See It, Now You Don’t!
A Bimodal Dataset for Evaluating Visio-Linguistic Reasoning
Abstract
Numerous visio-linguistic (V+L) representation learning methods have been developed, yet existing datasets do not adequately evaluate the extent to which they represent visual and linguistic concepts in a unified space. We propose several novel evaluation settings for V+L models, including cross-modal transfer. Furthermore, existing V+L benchmarks often report global accuracy scores on the entire dataset, making it difficult to pinpoint the specific reasoning tasks that models fail and succeed at. We present TraVLR, a synthetic dataset comprising four V+L reasoning tasks. TraVLR’s synthetic nature allows us to constrain its training and testing distributions along task-relevant dimensions, enabling the evaluation of out-of-distribution generalisation. Each example in TraVLR redundantly encodes the scene in two modalities, allowing either to be dropped or added during training or testing without losing relevant information. We compare the performance of four state-of-the-art V+L models, finding that while they perform well on test examples from the same modality, they all fail at cross-modal transfer and have limited success accommodating the addition or deletion of one modality. We release TraVLR as an open challenge for the research community.111Code and dataset available at https://github.com/kengjichow/TraVLR.
1 Introduction
Research in psycholinguistics has found that human processing of spatial words activates brain regions associated with the visual system (Tang et al., 2021), suggesting the latter’s involvement in processing linguistic input. It is reasonable to expect multimodal neural models to resemble humans in being able to leverage capabilities in the visual domain to solving problems in the text domain, and vice versa. Following its recent success in the text domain (Devlin et al., 2019), the pretraining–fine-tuning paradigm has been applied to the vision and text modalities to create unified visio-linguistic (V+L) representations. Just as pretrained multilingual models have been shown capable of zero-shot cross-lingual transfer on various NLP tasks (Conneau et al., 2020), we may expect true V+L models to be capable of generalising to a modality not seen during fine-tuning.


However, current approaches for benchmarking V+L models involve reporting global accuracy scores on the entire dataset, rendering the specific sources of success and failure difficult to diagnose (Ribeiro et al., 2020; Goel et al., 2021). For instance, Visual Question Answering (VQA, Goyal et al. 2017) tasks may allow models to exploit dataset bias (Dancette et al., 2021), or may reduce to object recognition problems which do not evaluate the models’ ability to perform more complex tasks, beyond aligning words or phrases in the text to a portion of the image (Hudson and Manning, 2019; Acharya et al., 2019). As Bernardi and Pezzelle (2021) note, the ability to reason over multiple objects and answer relational questions is crucial to the genuine mastery of language.
Datasets such as NLVR2 (Suhr et al., 2019) address this limitation, but do not allow for fine-grained evaluation along specific dimensions (Tan et al., 2021). CLEVR (Johnson et al., 2017) and ShapeWorld (Kuhnle and Copestake, 2017) enable targeted evaluations of a V+L model’s reasoning abilities but only encode the scene unimodally, as images. Additionally, their test examples may still be in the training distribution with respect to task-relevant dimensions, making it difficult to draw conclusions about generalisation ability.
We thus contribute TraVLR, a synthetic dataset comprising four V+L reasoning tasks: spatiality, cardinality, quantifiers, and numerical comparison, all of which require reasoning over multiple objects and have been shown to be challenging for V+L models (Johnson et al., 2017; Parcalabescu et al., 2021). Unlike ShapeWorld, we fully leverage the benefits of using a synthetic dataset by controlling the train-test split such that examples in the out-of-distribution (OOD) test set are OOD with respect to task-relevant dimensions. We thus argue that TraVLR serves as a basic sanity check for the abstract reasoning and out-of-distribution generalisation capabilities of models, and is complementary to datasets that evaluate real-world object recognition and compositional reasoning abilities, such as GQA (Hudson and Manning, 2019).
Inspired by the word/picture sentence verification task from psycholinguistics (Goolkasian, 1996), we further propose various novel evaluation settings by representing the scene bimodally as both an image and a caption. First, TraVLR supports the novel cross-modal transfer setting (Figure 1): If pretrained V+L models have learnt a truly multimodal representation, they should be able to learn a reasoning task with input from one modality and perform inference using input from the other modality with little to no extra training. Being able to transfer cross-modally in a zero- or few-shot manner may improve data efficiency in applications where diverse image data is difficult to obtain. Furthermore, models should also succeed on test settings where either an unseen modality is added, or a seen modality is dropped.
Using TraVLR, we perform extensive analysis of the ability of four Transformer-based V+L models to perform various reasoning tasks. We show that current V+L models:
-
•
May require unreasonably large amounts of data to learn simple visio-linguistic reasoning tasks.
-
•
Exhibit a strong textual bias.
-
•
Are unable to perform cross-modal transfer. We thus pose this as an open challenge for future V+L models.
2 Related Work
V+L tasks and datasets.
The Visual Question Answering (VQA) task involves answering a question about an image. It is a complex task as it requires an ability to process input in both visual and textual modalities (Antol et al., 2015). A known issue with VQA datasets is the presence of real-world language priors and statistical biases in the training and testing distribution (Kervadec et al., 2021; Agrawal et al., 2018; Kafle et al., 2019). Although VQA v2.0 Goyal et al. (2017) was improved by balancing each query with pairs of images, Dancette et al. (2021) show that it still contains both unimodal and multimodal biases that models can exploit. Furthermore, questions in VQA may use non-compositional language that does not require abilities beyond object recognition.
NLVR (Suhr et al., 2017) addresses the lack of compositionality in VQA using synthetic images of abstract 2D shapes, accompanied by human-written English sentences to be judged true or false. NLVR2 (Suhr et al., 2019) and SNLI-VE (Xie et al., 2019) also involve truth-value/entailment judgement tasks, but use photographs instead of synthetic images. Both lack detailed annotations of the specific semantic phenomena evaluated by each example. GQA improves over VQA by focusing on compositional questions that require reasoning over multiple objects and contains detailed annotations (Hudson and Manning, 2019), but still suffers from statistical imbalances and the lack of an out-of-distribution test set (Kervadec et al., 2021).
Other synthetic datasets focusing on reasoning include CLEVR (Johnson et al., 2017), a fully synthetic and annotated 3D dataset, and ShapeWorld, a 2D dataset targeting linguistic phenomena such as spatial relationships and quantifiers. SPARTQA (Mirzaee et al., 2021) is another 2D synthetic dataset built upon NLVR focusing on spatial reasoning among other linguistic phenomena. gSCAN (Ruis et al., 2020) focuses on generalisation of commands within a 2D grid-world.
V+L models.
Pretrained V+L models differ in their architecture and pretraining methods. VL-BERT (Su et al., 2019), UNITER (Chen et al., 2020) and VisualBERT (Li et al., 2020a) are single-stream models with a single Transformer while ViLBERT (Lu et al., 2019), LXMERT (Tan and Bansal, 2019), and ALBEF (Li et al., 2021) are dual-stream models which encode image and textual inputs separately before fusing them. These models all use masked language modelling and image-text matching objectives for pretraining, with LXMERT additionally pretraining on VQA and ALBEF using a contrastive loss to align the image and language representations. UNITER, VisualBERT, and LXMERT use a frozen Faster R-CNN (Ren et al., 2015) to extract region-based features from the image, while ALBEF directly encodes the image with a Vision Transformer (Dosovitskiy et al., 2020).
Cross-modal transfer.
Prior work has found models trained on multimodal data to perform better on unimodal downstream tasks than models trained only on one modality. Zadeh et al. (2020) found models trained on multimodal input to perform better than text-only models on three NLP tasks, while Testoni et al. (2019) showed that models trained on textual, visual, and auditory input were better at a quantification task than models trained only on a single modality. Using a task involving queries about typical colours of objects, Norlund et al. (2021) found BERT trained on linguistic and visual features to outperform BERT trained on language data filtered for mentions of colour. Frank et al. (2021) investigated the cross-modal alignment of pretrained V+L models with an ablative method based on masked modelling. Lu et al. (2021) propose an image–text fusion model to solve a novel image generation task from a textual description and an image prompt based on NLVR2.
Summary.
The datasets commonly used to evaluate V+L models such as VQA and NLVR2 lack fine-grained interpretability, due to the lack of annotations for semantic phenomena involved in each example. Additionally, multiple semantic phenomena co-occur within a single example, making it difficult to control the training distribution and assess the generalisation abilities of models. Furthermore, existing V+L datasets only present the scene in the visual modality and cannot be used to evaluate a V+L model’s cross-modal transfer ability.
Existing synthetic datasets (e.g. ShapeWorld, CLEVR) fail to split the training and testing distributions along a dimension relevant to the specific task, because they generate captions based on randomly generated images. Unlike existing datasets, TraVLR fully exploits the benefits of a synthetic dataset by strictly controlling the training and evaluation distributions to test the generalisation abilities of V+L models and avoid statistical biases from language priors and non-uniform distributions.
3 TraVLR: Cross-Modal Transfer of Visio-Linguistic Reasoning
We construct TraVLR, a synthetic dataset comprising four visio-linguistic reasoning tasks: spatiality, cardinality, quantifiers and numerical comparison. These tasks were previously identified to be challenging for text-only models (Lin and Su, 2021; Dua et al., 2019; Ravichander et al., 2019). TraVLR aims to evaluate the extent to which pretrained V+L models already encode or are able to learn these four relations between entities present in input scenes. We first describe the general task format, and then describe each task.
Given a scene with objects, , where each object can be represented as a tuple colour, shape, position , and a textual query involving some relation between two or more objects in , each task involves learning a function where . This is essentially a binary classification task. For instance, in the spatiality task, the relation (e.g., above) compares the positions of two objects. In the numerical comparison task, noun phrases in the query refer to subsets of objects, while the relations (e.g., more) compare the cardinality of two sets of objects. Assigning a truth value to the query thus involves reasoning over several objects.
However, a model can never have direct access to the underlying representation scene and must operate on visual or textual forms, and may be represented in the form of an image or a textual description. In prior work such as VQA, is presented as an image. In TraVLR, is represented bimodally as an image, caption pair.
Each example consists of an image, an accompanying caption, and a query. Images include abstract objects arranged in a grid. We draw from five colours and seven shapes, giving 35 unique objects in total. The shapes used in TraVLR are from the Visual Genome (Krishna et al., 2017), a commonly-used pretraining dataset. Each caption fully describes the image with the coordinates of each object (e.g., “There is a red circle at A 1, a blue square at B 2…”). A description of the coordinate system, e.g., “Columns, left to right, are ordered A to F. Rows, top to bottom, are ordered 1 to 6.” is prepended to the caption. The caption and query are separated by the [SEP] token when presented to the models. Removing the caption reduces our tasks to VQA-like tasks.
3.1 Novel Evaluation Settings
Encoding the scene as both an image and a caption allows models to be trained and evaluated on a combination of three settings: i) image-only, ii) caption-only, and iii) both image and caption input settings. The query is presented as part of the text input in each setting. In the caption-only setting, a blank white image is presented to the models.
3.2 Reasoning Tasks
In contrast to existing synthetic datasets (e.g. ShapeWorld and CLEVR), we do not generate queries post-hoc based on pre-generated scenes, and instead generate scenes constrained along a task-relevant dimension. For instance, in generating the training and out-of-distribution (OOD) test sets for the spatial relationship task, we ensure that the positions of the queried objects do not overlap between the training and test sets along the relevant axis (e.g. the horizontal axis for horizontal relations left/right). We indicate the train/test splits based on pairs in angled brackets.
Spatiality.
This task involves queries of the form “The [object1] is [relationship] the [object2].” (e.g., “The red circle is to the right of the blue square.”). The possible relationships are to the left of, to the right of, above, below. For horizontal relationships (left/right), the train and test sets are split based on the pair column(object1), column(object2) (see Appendix A.1), while for vertical relationships (above/below), the train–test split is based on the pair row(object1),row(object2). This tests the model’s ability to generalise its understanding of spatial relationships along the relevant dimension, as opposed to memorising fixed positions.
Cardinality.
This task involves queries of the form “There is/are [number] [shape] object(s).” (e.g., “There are 3 circle objects”). The train and test sets are split by the number, shape pair occurring in the input image/caption; e.g., instances containing 2 circles and 3 triangles could occur in the training distribution, while instances with just 3 circles occur only in the OOD test distribution.
| All | |
|---|---|
| Not all | |
| No | |
| Some | |
| Only | |
| Not only |
Quantifiers.
This task involves queries of the form “[quantifier] the [attr1] objects are [attr2] objects.”, where the quantifiers include all, some, only and their negated counterparts not all, none and not only. The train–test split is performed based on the pair , which varies based on the quantifier, as given in Table 1. For instance, for the relationship not all, is the number of objects which fulfil both [attr1] and [attr2], and is the number of objects which fulfil [attr1] but not [attr2] (see Appendix A.1).
Numerical comparison.
This task involves queries of the form “There are [more/fewer] [attr1] objects than [attr2] objects.” (e.g., “There are more circles than squares.”). The train and test sets are split by the pair where is the number of [attr1] objects, and is the number of [attr2] objects. Instances for which is smaller than a threshold is assigned to the training distribution, and the remaining pairs are assigned to testing. and both and have a maximal value of 9. Success in this task is indicative of generalisation based on an understanding of numeral scales and transitivity of comparison; i.e., and implies .
| Train | Image | Caption | Image + Caption | ||||||||||
|---|---|---|---|---|---|---|---|---|---|---|---|---|---|
| Test | Image | Caption | Img. + Cap. | #sd | Image | Caption | Img. + Cap. | #sd | Image | Caption | Img. + Cap. | #sd | |
| S | VisualBERT | 65.94 (-1.02) | 48.92 (-0.23) | 52.47 (+0.19) | 3 | 49.40 (+0.09) | 93.55 (-6.45) | 93.46 (-6.54) | 2 | 49.34 (+0.31) | 70.99 (-1.59) | 71.39 (-1.65) | 3 |
| UNITER | 89.67 (+0.96) | 44.36 (+0.48) | 46.15 (-0.19) | 3 | 37.66 (+0.54) | 92.31 (-7.67) | 92.23 (-7.74) | 1 | 50.15 (+0.17) | 70.75 (+1.24) | 71.17 (+0.40) | 1 | |
| LXMERT | 99.46 (-0.38) | 38.87 (-0.27) | 48.82 (+0.33) | 3 | 33.52 (+0.47) | 33.52 (+0.47) | 33.52 (+0.47) | 0 | 33.52 (+0.47) | 33.52 (+0.47) | 33.52 (+0.47) | 0 | |
| ALBEF | 48.28 (+0.10) | 44.54 (-0.26) | 44.85 (-0.18) | 0 | 48.75 (+0.52) | 98.42 (-1.58) | 98.42 (-1.58) | 1 | 48.56 (+0.94) | 93.66 (-6.34) | 93.31 (-6.69) | 2 | |
| C | VisualBERT | 77.41 (+1.11) | 33.14 (+0.01) | 46.94 (-0.53) | 3 | 46.63 (-0.03) | 99.99 (+0.08) | 99.99 (+0.16) | 3 | 45.20 (-1.41) | 99.94 (+0.10) | 99.94 (+0.18) | 3 |
| UNITER | 77.12 (+0.09) | 42.36 (-0.35) | 48.55 (+0.23) | 3 | 41.97 (-0.95) | 98.96 (+1.82) | 98.99 (+0.82) | 3 | 42.36 (-1.97) | 98.48 (+0.11) | 98.83 (+1.99) | 3 | |
| LXMERT | 82.90 (-1.66) | 33.16 (+0.02) | 43.79 (-0.95) | 3 | 45.23 (-0.21) | 60.02 (-18.88) | 60.10 (-18.98) | 3 | 50.72 (+0.34) | 55.00 (-1.60) | 55.26 (-7.83) | 3 | |
| ALBEF | 59.19 (+0.43) | 32.67 (-0.05) | 53.31 (-0.44) | 2 | 41.58 (-3.24) | 99.61 (+0.17) | 99.61 (+0.17) | 3 | 43.17 (-2.33) | 99.61 (+0.26) | 99.61 (+0.26) | 3 | |
| Q | VisualBERT | 86.59 (-2.73) | 45.09 (+1.16) | 60.93 (-2.25) | 3 | 49.22 (+0.63) | 99.99 (-0.01) | 99.99 (-0.01) | 3 | 49.51 (-0.16) | 99.98 (-0.01) | 99.98 (-0.02) | 3 |
| UNITER | 95.14 (-1.10) | 48.89 (+0.62) | 53.99 (-0.13) | 3 | 48.64 (-0.99) | 99.42 (-0.41) | 99.36 (-0.44) | 3 | 48.07 (-1.14) | 97.85 (+2.11) | 98.87 (+1.43) | 3 | |
| LXMERT | 96.72 (-0.94) | 34.87 (-0.27) | 39.94 (-0.69) | 3 | 43.33 (-0.98) | 92.91 (+6.58) | 90.65 (+7.02) | 3 | 48.95 (-0.14) | 33.93 (-0.01) | 51.02 (+0.17) | 0 | |
| ALBEF | 66.19 (-0.19) | 43.88 (+0.21) | 54.78 (-1.32) | 3 | 48.27 (+0.19) | 99.98 (+0.12) | 99.98 (+0.12) | 3 | 47.73 (+0.19) | 99.98 (+0.17) | 99.97 (+0.17) | 3 | |
| N | VisualBERT | 58.75 (-14.16) | 40.27 (+1.26) | 53.13 (-2.81) | 3 | 49.62 (-0.42) | 99.77 (-0.06) | 99.75 (+0.00) | 3 | 51.10 (+0.20) | 99.79 (-0.11) | 99.79 (-0.10) | 3 |
| UNITER | 63.08 (-22.07) | 45.52 (+0.81) | 52.97 (-0.62) | 3 | 49.32 (-0.59) | 69.43 (-30.34) | 68.77 (-30.91) | 3 | 46.78 (-1.03) | 64.80 (-34.71) | 63.88 (-35.92) | 3 | |
| LXMERT | 62.56 (-21.57) | 45.85 (-0.34) | 46.62 (+0.59) | 3 | 48.62 (-0.94) | 53.10 (-46.30) | 53.15 (-46.21) | 3 | 50.68 (+2.31) | 57.45 (-26.77) | 56.81 (-41.86) | 2 | |
| ALBEF | 41.93 (-4.30) | 41.23 (-1.27) | 33.88 (-3.13) | 0 | 48.00 (-0.82) | 97.96 (-1.88) | 97.96 (-1.88) | 3 | 47.24 (-1.50) | 98.93 (-0.91) | 98.93 (-0.91) | 3 | |
3.3 Generating TraVLR
To generate examples for each task, we randomly sample object attributes from the distributions defined in Section 3.2, ensuring that the pairs relevant to each task do not overlap between the train and OOD test sets. We also ensure that all queries in the OOD test set do not occur in the training set. Distractor objects irrelevant to the intended query are finally added to the scene. The spatiality task’s training set comprises 32k examples, the training sets of the other tasks comprise 8k examples each due to differences in the amount of data required for convergence in our preliminary experiments.
Prior work on generalisation evaluation recommends the use of in- and out-of-distribution (henceforth InD and OOD, respectively) test sets (Csordás et al., 2021). Hence, we include validation and InD test sets randomly sampled from the training distribution (10k examples each), in addition to the OOD test set described above (20k examples). We report further dataset statistics in Appendix A.
4 Experiments
Models.
We perform experiments on two single-stream models, VisualBERT and UNITER, and two dual-stream models, LXMERT and ALBEF. We use Li et al. (2020b)’s implementation of VisualBERT, LXMERT, and UNITER, and the original implementation of ALBEF. The image features of LXMERT and UNITER are 36 regions of interest extracted using Tan and Bansal (2019)’s implementation of a pretrained Faster R-CNN (Ren et al., 2015; Anderson et al., 2018). We use a Detectron model (Girshick et al., 2018) to extract image features for VisualBERT. We also train two text-only models, BERT (Devlin et al., 2019) and RoBERTa (Liu et al., 2019), as caption-only baselines.
Setup.
We train models on each task for 80 epochs. Following Csordás et al. (2021)’s finding that early stopping may lead to underestimation of model performance, we do not do early stopping. We use the recommended hyperparameters for fine-tuning ALBEF on SNLI-VE (Xie et al., 2019) and VisualBERT on NLVR2. Learning rates were adjusted downwards for models/tasks where recommended hyperparameters did not lead to convergence. Each experiment is repeated with three random seeds. Table 2 reports mean results on seeds leading to above-random performance, and mean results on all seeds when none achieve above-random performance. We present further experimental details in Appendix B.
4.1 Within-Modality Results
We first discuss the results of testing the model on the modality it was trained on (Table 2). In Appendix C, we examine the effect of dataset size on model performance and discuss the results in detail. In Appendix 20, we discuss differences in training duration between models.
Image-only setting.
Generalising across the four tasks, in the image-only setting, LXMERT is the best performing model across all tasks, while ALBEF is consistently the worst performing model. UNITER outperforms VisualBERT in all tasks except the cardinality task.
Caption-only and image+caption settings.
Generally, the performance of all models except LXMERT in the caption-only and image+caption settings is better than performance in the image-only setting. Across tasks and models, performance in the caption-only closely resembles performance in image+caption settings, suggesting a strong textual bias when both modalities are presented. In the caption-only and image+caption settings, LXMERT is consistently the worse performing model, and VisualBERT is the best performing model in all but the spatiality task. On the cardinality and quantifiers tasks, all models except LXMERT achieve close to a perfect F1 score, performing similarly to RoBERTa and BERT. However, they are outperformed by RoBERTa when trained on smaller datasets.
Spatiality.
While UNITER and LXMERT achieve above-random performance with 8k examples, VisualBERT requires at least 16k examples, and ALBEF fails to learn the task on the full 32k dataset. 32k is a significant number of examples given the task’s simplicity. For comparison, the full VQA dataset consists of only 443k training examples. Transformer-based models thus face similar issues to CNN and LSTM models, which Johnson et al. (2017) found to have trouble learning spatial relationships and often memorise the absolute object positions.
A potential explanation for the superior performance of UNITER and LXMERT could be that unlike the other models, spatial coordinates from the bounding boxes are explicitly encoded in the input to the image encoders, which the models can directly exploit. This is unavailable to ALBEF, which takes in the image as input directly instead of relying on a separate object detector. VisualBERT does not make use of these spatial coordinates, which may impair its ability to relate the positions of objects. Bugliarello et al. (2021) and Frank et al. (2021) posited this limitation of VisualBERT to explain its poor performance on tasks such as RefCOCO+ and Masked Region classification, but the impact of this limitation on spatial reasoning has hitherto not been directly investigated. LXMERT converges in fewer epochs compared to all other models. LXMERT only required 4 epochs of training on the 32k dataset to exceed F1=90 on the InD test set, while UNITER required about 60 epochs (see further discussion in Appendix 20).
In the caption-only and image+caption settings, UNITER and ALBEF are notably more sensitive to random seeds and fail to achieve convergence in several cases. Furthermore, performance is poorer in the image+caption than in the caption-only setting across all models. This runs counter to existing expectations that bimodal representation of the same information should improve performance (Zadeh et al., 2020; Testoni et al., 2019). Several models exhibit point differences in F1 on the InD and OOD test sets. BERT requires at least 8k examples to achieve an F1 score above 60, corroborating findings by Lin and Su (2021) that BERT requires a significant number of examples to learn a simple natural language inference task.
Cardinality.
On the cardinality task, all models achieve non-random performance when trained with 8k examples. Across all settings, performance on the InD and OOD test set is similar, indicating that models are able to generalise to unseen object–number pairs. However, despite the task’s simplicity, in the image-only setting, no model achieves above an F1 of 85 when trained on the full dataset, and when trained on 1k examples, all models perform poorly with F1 scores below 60. This corroborates Parcalabescu et al. (2021)’s finding that current V+L models face difficulties with counting objects in images. Models are generally successful in the caption-only setting, corroborating Wallace et al. (2019)’s findings that numeracy is encoded in the embeddings of language-only models.
Quantifiers.
All models perform well on the quantifiers task in most settings, with exceptions that conform to the overall trends described above (e.g. LXMERT in the image+caption setting). Good performance on the OOD dataset indicates that models are not memorising specific numbers of objects and instead use more general strategies for understanding quantifiers. This parallels psycholinguistic findings that comprehension of non-exact quantifiers does not correlate with counting skills in human children (Dolscheid et al., 2015).
Numerical comparison.
Unlike the other tasks, there is a significant difference between the InD and OOD settings for the numerical comparison task across all settings. In the image-only setting, all models except ALBEF, achieve F1s above 70 on the InD test set, while achieving much lower F1s (55–65) on the OOD test set. In the caption-only and image+caption settings, while all models achieve close to F1=100 on the InD test set, UNITER and LXMERT do not generalise well to the OOD test set, showing a substantial drop in performance. Our results suggest that models face difficulties generalising beyond the training distribution to unseen number pairs.
4.2 Cross-Modal Transfer
Despite performing well in the within-modality settings, none of the models succeed at performing zero-shot cross-modal transfer to an unseen modality. Nevertheless, given the success of few-shot learning, we may expect few-shot cross-modal transfer to be plausible. We hence conduct few-shot learning experiments on the best performing models that were fine-tuned on the full dataset of the spatiality and quantifiers tasks. We fine-tuned the models on 200 examples of the unseen modality for 20 epochs before testing (see details in Appendix B.5). Unfortunately, none of the models achieved above random performance even after this additional fine-tuning. We conclude that they can perform neither zero-shot nor few-shot cross-modal transfer, and that existing V+L representation learning methods have yet to succeed at producing truly multimodal (or modality-agnostic) representations.
4.3 Adding and Dropping Modalities
We now discuss the effects of either adding or dropping a modality to the input presented during testing. First, models trained in the image+caption setting perform similarly when tested in the image+caption and caption-only settings. However, when tested in the image-only setting, models perform poorly, exhibiting (close to) random performance in most cases. This indicates that all models tend to overly focus on the caption during training. Second, models trained only on captions perform similarly when tested in the image+caption setting. In contrast, testing a model trained only on images in the image+caption setting results in a significant performance drop. In most cases, F1 is close to random, although all models except LXMERT manage to maintain above-random performance on the quantifier task. This could indicate that the models are easily distracted by the textual modality. Together with the general similarity between results in the caption-only and image+caption settings, these results indicate a bias towards the textual modality.
5 Further Analyses
5.1 The Impact of Pretraining
We conduct additional experiments on VisualBERT, UNITER and LXMERT trained using the unified Volta (Bugliarello et al., 2021) framework, where V+L models were pretrained using the same dataset in a standardised manner. This allows us to understand the extent to which differences in models’ performance can be attributed to the pretraining data or objective, rather than model architecture. First, Volta LXMERT loses its advantage in both performance and training efficiency over the other models. We suggest that LXMERT’s superior performance is due to some aspect of its pretraining, such as the larger size of or presence of VQA examples in its pretraining dataset, or its use of an additional VQA pretraining objective. Furthermore, Volta VisualBERT’s performance is significantly improved over the original VisualBERT, likely because it was pretrained with more data. UNITER also outperforms the other two models (also reported by Bugliarello et al. (2021) on RefCOCO+ and NLVR2), which suggests some advantage of its specific architecture. All three Volta models achieve similar results on the caption-only setting of the 8k cardinality dataset. As all Volta models were initialised with BERT weights, we suggest that the poor performance of the original LXMERT on textual input is due to its lack of initialisation with BERT weights (Tan and Bansal, 2019). We discuss the results in greater detail in Appendix E.
5.2 The Impact of Catastrophic Forgetting
A potential concern with fine-tuning on one modality and testing on another is that the models may overfit to the fine-tuning modality, resulting in the catastrophic forgetting of cross-modal information. To reduce this possibility, we freeze the pretrained representations and only fine-tune the classification layers. In this setting, all models except LXMERT fail to go beyond random performance. Although LXMERT achieves above-random performance in the image-only setting for two tasks, it is still relatively poor (Spatiality: OOD=52.29, InD=52.67; Cardinality: OOD= 56.39, InD=60.88). This indicates that most models require representation fine-tuning to perform reasoning tasks, and it is unlikely that the inability to transfer cross-modally was due to catastrophic forgetting during fine-tuning.
5.3 Modal Dropout
One may be concerned that the presentation of the same information in the image+caption setting facilitates overfitting to either modality. We investigate whether models’ textual bias can be overcome by randomly “dropping out” either the image or caption input when training in the image+caption setting. We find modal dropout to not significantly alleviate bias towards the textual modality. We discuss our findings in detail in Appendix F.
5.4 Error analysis
We now report findings from our error analysis on selected experiments where models converged but did not achieve perfect or near perfect F1 scores, which can reveal trends that explain poor performance. We describe our analysis on the spatiality and cardinality tasks here, referring readers to Appendix G for details on quantifiers and numerical comparison.
Across all tasks, errors are intuitive and explainable, and the performance of models is generally poorer on boundary cases. For example, models are more error-prone when objects are positioned close to each other in the spatiality task, and where only one object either falsifies or confirms the query in the quantifier task. On the numerical comparison task, we observe more errors when the difference between the numerals being compared is small.
5.4.1 Spatiality


In the spatiality task, VisualBERT was unable to achieve F1 scores above 70 across all three random seeds. Figure 2 shows that this was due to VisualBERT only correctly answering queries involving vertical relationships, but not horizontal ones. In the figure, the x-axis is organised by the pairs of object coordinates relevant to the query (i.e., columns for horizontal relationship queries, and rows for vertical relationship queries). A similar pattern is observed on all three runs on VisualBERT, and also on UNITER on one random seed. Mediocre results on the spatiality task can thus often be attributed to models successfully learning to answer only a subset of the queries.

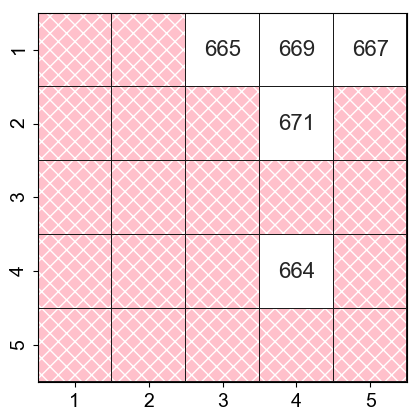
Figure 3 shows the percentage of incorrect answers on specific pairs in the InD test set. Note that white entries are pairs which belong to the OOD test set. Overall, models make more mistakes on examples with queried objects positioned closer together (represented by cells closer to the diagonal).
5.4.2 Cardinality

While most models apart from LXMERT succeeded on the cardinality task in the caption-only and image+caption settings, moderate performance was observed in the image-only setting. We found that models performed poorer on images with more objects in the image, inclusive of distractors (refer to Appendix G for details). Furthermore, models often predict values close to the actual value. Figure 4 plots the actual number of objects in the scene against the number of objects predicted. Since the task was a true/false task, this analysis is based only on examples for which the model predicted that the query was true. The counting abilities of models thus intuitively resemble that of humans, given that they are confused by a large number of objects in the scene, and are also likely to predict answers close to the actual value when miscounting.
6 Discussion
Comparing modalities.
As discussed in §4.3, V+L models exhibit a clear bias towards the textual modality across single and dual stream models, corroborating findings by Cao et al. (2020). This finding also applies to LXMERT, even though it generally performs more poorly on caption than image inputs. Furthermore, the V+L models perform more poorly than unimodal RoBERTa on various tasks in the caption-only setting, similar to Iki and Aizawa (2021), who show that V+L pretraining on degrades performance on NLU tasks.
Comparing tasks.
The spatiality task is the hardest task, requiring at least 32k examples to converge in some cases, as opposed to the 8k examples for the other tasks (see Appendix C for details). Furthermore, convergence of the models on the spatiality task is highly sensitive to random seeds. Among the other tasks, the easiest task is the quantifiers task, followed by cardinality, and finally numerical comparison. In the caption-only and image+caption settings, all models apart from LXMERT achieve a close to perfect F1 on the cardinality and quantifiers tasks. However, on the numerical comparison task, UNITER and LXMERT exhibited a limited ability to generalise outside the training distribution in both image and textual modalities. Thus, while success on the cardinality task indicates that models possess an understanding of the meaning of numbers in absolute terms, the numerical comparison task was able to differentiate models in terms of their understanding of numbers’ relative positions on a numeral scale.
Comparing models.
As argued in §5.1, the most significant factor differentiating models seems to be their pretraining rather than model architecture. Our findings corroborate Bugliarello et al. (2021)’s findings that differences between models cannot be primarily attributed to differences in model architecture. Unlike LXMERT and ALBEF, VisualBERT and UNITER both succeed on all tasks in all settings. While UNITER generally outperforms VisualBERT in the image-only setting, VisualBERT at times outperforms UNITER in the caption and image+caption settings. The superior performance of VisualBERT in caption-only settings could be due to its comparatively minimal pretraining on V+L objectives, enabling it to retain performance closer to that of text-only models.
The encoding of image features also has a significant impact on performance in the image-only setting. VisualBERT’s poor performance on the spatiality task is likely due to the fact that it does not explicitly encode the spatial coordinates of the bounding boxes in its input. Additionally, it is likely that the pretrained object detector used by every model except ALBEF helped them outperform ALBEF in the image-only setting, despite underperforming it in common V+L benchmarks (Li et al., 2021). A possible explanation is that the information captured by the Faster R-CNN detector was more relevant to our visio-linguistic tasks.
Finally, the poor performance of LXMERT on caption-only and image+caption settings reflects its lack of initialisation with BERT parameters before pretraining. Given the superior performance of RoBERTa over BERT, it could be beneficial to initialise models with RoBERTa weights instead.
7 Conclusion
TraVLR allows us to evaluate specific visio-linguistic reasoning skills in isolation, enabling finer-grained diagnosis of model deficiencies. We found some models to learn better from one modality than the other, and some task-setting combinations to be more challenging across the board. Furthermore, existing models may require unreasonably large amounts of data and training steps to learn simple tasks. Improving the sample efficiency and training time of V+L models is a potential direction for future research. Furthermore, while pretrained multilingual models have been shown to demonstrate zero-shot cross-lingual transfer abilities, it is unclear whether V+L models can similarly perform cross-modal transfer of downstream task abilities to a modality unseen during fine-tuning.
We hence contribute TraVLR, which enables the evaluation of cross-modal transfer ability by encoding scenes bimodally. We found all models to suffer from a strong textual bias, and an inability to perform zero- and few-shot cross-modal transfer. Given the success of multilingual models with cross-lingual transfer, future work might attempt to bridge the gulf between the visual and textual modalities, perhaps by forcing models to transform images into intermediate representations which more closely resemble language. Visio-linguistic representations capable of such transfer will unlock a whole host of new applications, and we pose this as the next challenge for multimodal modelling.
Limitations
We acknowledge that the use of synthetic data is potentially unrealistic given that most applications would require reasoning on real-world input. Nevertheless, we note that because synthetic data is easier, it is still useful as a benchmark for the minimum expected performance of models. We follow the line of argument in prior work (e.g. Johnson et al. (2017)) that synthetic datasets not only mitigate the problem of distributional bias in real-world datasets, but also simplify the problem of object recognition to focus on diagnosing genuine abstract reasoning ability. We generally expect V+L models to acquire abstract visual reasoning skills, like humans, rather than being limited to the realm of photographs. TraVLR’s focus on simple shapes also makes it a test of this ability.
Our experiments on Volta should be taken as preliminary, as a full replication of all experiments was not performed due to resource limitations. Future work could investigate the extent to which the superior performance of Volta UNITER is robust across all tasks, which would indicate a genuine advantage due to UNITER’s architecture. Furthermore, although we have attributed the superior performance of LXMERT to some aspect of its pretraining, we are unable to pinpoint whether the advantage is specifically due to the large size of its pretraining dataset, its use of VQA examples in the pretraining, or its use of a VQA pretraining objective, and leave this to future work.
Finally, while all models were shown to succeed at generalising to the OOD test setting with varying degrees of success, only the numerical comparison task poses a significant challenge in terms of OOD generalisation. This is expected, since we did not intend to challenge the models with generalisation settings which they are unlikely to encounter in test (i.e., more realistic datasets designed for fine-tuning models to perform real-world applications). Furthermore, the simplicity of our reasoning tasks enables us to evaluate models’ abilities on specific semantic phenomena in isolation. Nevertheless, future work can extend TraVLR to include more challenging generalisation tasks, such as generalisation of the meaning of negation over unseen quantifiers, compositional queries which combine multiple semantic phenomena (e.g. combining propositions via conjunction or disjunction), and queries which contain instructions to manipulate the scene.
Ethics Statement
TraVLR is a synthetically generated dataset, and hence poses no ethical issues relating to the source of the data. Its use of abstract shapes has the further advantage of avoiding biases relating to human subjects.
References
- Acharya et al. (2019) Manoj Acharya, Kushal Kafle, and Christopher Kanan. 2019. TallyQA: Answering complex counting questions. In Proceedings of the AAAI Conference on Artificial Intelligence, volume 33, pages 8076–8084.
- Agrawal et al. (2018) Aishwarya Agrawal, Dhruv Batra, Devi Parikh, and Aniruddha Kembhavi. 2018. Don’t just assume; look and answer: Overcoming priors for visual question answering. In Proceedings of the IEEE Conference on Computer Vision and Pattern Recognition, pages 4971–4980.
- Anderson et al. (2018) Peter Anderson, Xiaodong He, Chris Buehler, Damien Teney, Mark Johnson, Stephen Gould, and Lei Zhang. 2018. Bottom-up and top-down attention for image captioning and visual question answering. In CVPR.
- Antol et al. (2015) Stanislaw Antol, Aishwarya Agrawal, Jiasen Lu, Margaret Mitchell, Dhruv Batra, C Lawrence Zitnick, and Devi Parikh. 2015. VQA: Visual question answering. In Proceedings of the IEEE international conference on computer vision, pages 2425–2433.
- Bernardi and Pezzelle (2021) Raffaella Bernardi and Sandro Pezzelle. 2021. Linguistic issues behind visual question answering. Language and Linguistics Compass, 15(6):e12417.
- Bugliarello et al. (2021) Emanuele Bugliarello, Ryan Cotterell, Naoaki Okazaki, and Desmond Elliott. 2021. Multimodal pretraining unmasked: A meta-analysis and a unified framework of vision-and-language BERTs. Transactions of the Association for Computational Linguistics, 9:978–994.
- Cao et al. (2020) Jize Cao, Zhe Gan, Yu Cheng, Licheng Yu, Yen-Chun Chen, and Jingjing Liu. 2020. Behind the scene: Revealing the secrets of pre-trained vision-and-language models. In European Conference on Computer Vision, pages 565–580. Springer.
- Chen et al. (2020) Yen-Chun Chen, Linjie Li, Licheng Yu, Ahmed El Kholy, Faisal Ahmed, Zhe Gan, Yu Cheng, and Jingjing Liu. 2020. UNITER: Universal image-text representation learning. In European conference on computer vision, pages 104–120. Springer.
- Conneau et al. (2020) Alexis Conneau, Kartikay Khandelwal, Naman Goyal, Vishrav Chaudhary, Guillaume Wenzek, Francisco Guzmán, Édouard Grave, Myle Ott, Luke Zettlemoyer, and Veselin Stoyanov. 2020. Unsupervised cross-lingual representation learning at scale. In Proceedings of the 58th Annual Meeting of the Association for Computational Linguistics, pages 8440–8451.
- Csordás et al. (2021) Róbert Csordás, Kazuki Irie, and Juergen Schmidhuber. 2021. The devil is in the detail: Simple tricks improve systematic generalization of transformers. In Proceedings of the 2021 Conference on Empirical Methods in Natural Language Processing, pages 619–634.
- Dancette et al. (2021) Corentin Dancette, Remi Cadene, Damien Teney, and Matthieu Cord. 2021. Beyond question-based biases: Assessing multimodal shortcut learning in visual question answering. arXiv preprint arXiv:2104.03149.
- Devlin et al. (2019) Jacob Devlin, Ming-Wei Chang, Kenton Lee, and Kristina Toutanova. 2019. BERT: Pre-training of deep bidirectional transformers for language understanding. In Proceedings of the 2019 Conference of the North American Chapter of the Association for Computational Linguistics: Human Language Technologies, Volume 1 (Long and Short Papers), pages 4171–4186.
- Dolscheid et al. (2015) Sarah Dolscheid, Christina Winter, and Martina Penke. 2015. Counting on quantifiers: Specific links between linguistic quantifiers and number acquisition. In EAPCogSci.
- Dosovitskiy et al. (2020) Alexey Dosovitskiy, Lucas Beyer, Alexander Kolesnikov, Dirk Weissenborn, Xiaohua Zhai, Thomas Unterthiner, Mostafa Dehghani, Matthias Minderer, Georg Heigold, Sylvain Gelly, Jakob Uszkoreit, and Neil Houlsby. 2020. An image is worth 16x16 words: Transformers for image recognition at scale. In International Conference on Learning Representations.
- Dua et al. (2019) Dheeru Dua, Yizhong Wang, Pradeep Dasigi, Gabriel Stanovsky, Sameer Singh, and Matt Gardner. 2019. DROP: A reading comprehension benchmark requiring discrete reasoning over paragraphs. In Proceedings of the 2019 Conference of the North American Chapter of the Association for Computational Linguistics: Human Language Technologies, Volume 1 (Long and Short Papers), pages 2368–2378.
- Frank et al. (2021) Stella Frank, Emanuele Bugliarello, and Desmond Elliott. 2021. Vision-and-language or vision-for-language? On cross-modal influence in multimodal transformers. In Proceedings of the 2021 Conference on Empirical Methods in Natural Language Processing, pages 9847–9857.
- Girshick et al. (2018) Ross Girshick, Ilija Radosavovic, Georgia Gkioxari, Piotr Dollár, and Kaiming He. 2018. Detectron. https://github.com/facebookresearch/detectron.
- Goel et al. (2021) Karan Goel, Nazneen Fatema Rajani, Jesse Vig, Zachary Taschdjian, Mohit Bansal, and Christopher Ré. 2021. Robustness gym: Unifying the NLP evaluation landscape. In Proceedings of the 2021 Conference of the North American Chapter of the Association for Computational Linguistics: Human Language Technologies: Demonstrations, pages 42–55.
- Goolkasian (1996) Paula Goolkasian. 1996. Picture-word differences in a sentence verification task. Memory & Cognition, 24(5):584–594.
- Goyal et al. (2017) Yash Goyal, Tejas Khot, Douglas Summers-Stay, Dhruv Batra, and Devi Parikh. 2017. Making the V in VQA matter: Elevating the role of image understanding in visual question answering. In 2017 IEEE Conference on Computer Vision and Pattern Recognition (CVPR), pages 6325–6334. IEEE Computer Society.
- Hudson and Manning (2019) Drew A Hudson and Christopher D Manning. 2019. GQA: A new dataset for real-world visual reasoning and compositional question answering. In Proceedings of the IEEE/CVF conference on computer vision and pattern recognition, pages 6700–6709.
- Iki and Aizawa (2021) Taichi Iki and Akiko Aizawa. 2021. Effect of visual extensions on natural language understanding in vision-and-language models. In Proceedings of the 2021 Conference on Empirical Methods in Natural Language Processing, pages 2189–2196.
- Johnson et al. (2017) Justin Johnson, Bharath Hariharan, Laurens van der Maaten, Li Fei-Fei, C Lawrence Zitnick, and Ross Girshick. 2017. CLEVR: A diagnostic dataset for compositional language and elementary visual reasoning. In 2017 IEEE Conference on Computer Vision and Pattern Recognition (CVPR), pages 1988–1997. IEEE.
- Kafle et al. (2019) Kushal Kafle, Robik Shrestha, and Christopher Kanan. 2019. Challenges and prospects in vision and language research. Frontiers in Artificial Intelligence, 2:28.
- Kervadec et al. (2021) Corentin Kervadec, Grigory Antipov, Moez Baccouche, and Christian Wolf. 2021. Roses are red, violets are blue… but should VQA expect them to? In Proceedings of the IEEE/CVF Conference on Computer Vision and Pattern Recognition, pages 2776–2785.
- Krishna et al. (2017) Ranjay Krishna, Yuke Zhu, Oliver Groth, Justin Johnson, Kenji Hata, Joshua Kravitz, Stephanie Chen, Yannis Kalantidis, Li-Jia Li, David A Shamma, et al. 2017. Visual genome: Connecting language and vision using crowdsourced dense image annotations. International journal of computer vision, 123(1):32–73.
- Kuhnle and Copestake (2017) Alexander Kuhnle and Ann Copestake. 2017. Shapeworld-a new test methodology for multimodal language understanding. arXiv preprint arXiv:1704.04517.
- Lacoste et al. (2019) Alexandre Lacoste, Alexandra Luccioni, Victor Schmidt, and Thomas Dandres. 2019. Quantifying the carbon emissions of machine learning. arXiv preprint arXiv:1910.09700.
- Li et al. (2021) Junnan Li, Ramprasaath R Selvaraju, Akhilesh Deepak Gotmare, Shafiq Joty, Caiming Xiong, and Steven Hoi. 2021. Align before fuse: Vision and language representation learning with momentum distillation. In Thirty-Fifth Conference on Neural Information Processing Systems.
- Li et al. (2020a) Liunian Harold Li, Mark Yatskar, Da Yin, Cho-Jui Hsieh, and Kai-Wei Chang. 2020a. What does BERT with vision look at? In Proceedings of the 58th Annual Meeting of the Association for Computational Linguistics, pages 5265–5275.
- Li et al. (2020b) Yikuan Li, Hanyin Wang, and Yuan Luo. 2020b. A comparison of pre-trained vision-and-language models for multimodal representation learning across medical images and reports. In 2020 IEEE International Conference on Bioinformatics and Biomedicine (BIBM), pages 1999–2004. IEEE.
- Lin et al. (2014) Tsung-Yi Lin, Michael Maire, Serge Belongie, James Hays, Pietro Perona, Deva Ramanan, Piotr Dollár, and C Lawrence Zitnick. 2014. Microsoft COCO: Common objects in context. In European conference on computer vision, pages 740–755. Springer.
- Lin and Su (2021) Yi-Chung Lin and Keh-Yih Su. 2021. How fast can BERT learn simple natural language inference? In Proceedings of the 16th Conference of the European Chapter of the Association for Computational Linguistics: Main Volume, pages 626–633.
- Liu et al. (2017) Guan-Horng Liu, Avinash Siravuru, Sai Prabhakar, Manuela Veloso, and George Kantor. 2017. Learning end-to-end multimodal sensor policies for autonomous navigation. In Conference on Robot Learning, pages 249–261. PMLR.
- Liu et al. (2019) Yinhan Liu, Myle Ott, Naman Goyal, Jingfei Du, Mandar Joshi, Danqi Chen, Omer Levy, Mike Lewis, Luke Zettlemoyer, and Veselin Stoyanov. 2019. RoBERTa: A robustly optimized BERT pretraining approach.
- Lu et al. (2019) Jiasen Lu, Dhruv Batra, Devi Parikh, and Stefan Lee. 2019. ViLBERT: pretraining task-agnostic visiolinguistic representations for vision-and-language tasks. In Proceedings of the 33rd International Conference on Neural Information Processing Systems, pages 13–23.
- Lu et al. (2021) Xiaopeng Lu, Lynnette Ng, Jared Fernandez, and Hao Zhu. 2021. CIGLI: Conditional image generation from language & image. In Proceedings of the IEEE/CVF International Conference on Computer Vision, pages 3134–3138.
- Mirzaee et al. (2021) Roshanak Mirzaee, Hossein Rajaby Faghihi, Qiang Ning, and Parisa Kordjamshidi. 2021. Spartqa: A textual question answering benchmark for spatial reasoning. In Proceedings of the 2021 Conference of the North American Chapter of the Association for Computational Linguistics: Human Language Technologies, pages 4582–4598.
- Norlund et al. (2021) Tobias Norlund, Lovisa Hagström, and Richard Johansson. 2021. Transferring knowledge from vision to language: How to achieve it and how to measure it? In Proceedings of the Fourth BlackboxNLP Workshop on Analyzing and Interpreting Neural Networks for NLP, pages 149–162.
- Ordonez et al. (2011) Vicente Ordonez, Girish Kulkarni, and Tamara Berg. 2011. Im2text: Describing images using 1 million captioned photographs. Advances in neural information processing systems, 24.
- Parcalabescu et al. (2021) Letitia Parcalabescu, Albert Gatt, Anette Frank, and Iacer Calixto. 2021. Seeing past words: Testing the cross-modal capabilities of pretrained V&L models on counting tasks. In Proceedings of the 1st Workshop on Multimodal Semantic Representations (MMSR), pages 32–44.
- Ravichander et al. (2019) Abhilasha Ravichander, Aakanksha Naik, Carolyn Rose, and Eduard Hovy. 2019. Equate: A benchmark evaluation framework for quantitative reasoning in natural language inference. In Proceedings of the 23rd Conference on Computational Natural Language Learning (CoNLL), pages 349–361.
- Ren et al. (2015) Shaoqing Ren, Kaiming He, Ross Girshick, and Jian Sun. 2015. Faster R-CNN: Towards real-time object detection with region proposal networks. Advances in neural information processing systems, 28:91–99.
- Ribeiro et al. (2020) Marco Tulio Ribeiro, Tongshuang Wu, Carlos Guestrin, and Sameer Singh. 2020. Beyond accuracy: Behavioral testing of NLP models with checklist. In Proceedings of the 58th Annual Meeting of the Association for Computational Linguistics, pages 4902–4912.
- Ruis et al. (2020) Laura Ruis, Jacob Andreas, Marco Baroni, Diane Bouchacourt, and Brenden M Lake. 2020. A benchmark for systematic generalization in grounded language understanding. Advances in Neural Information Processing Systems, 33.
- Sharma et al. (2018) Piyush Sharma, Nan Ding, Sebastian Goodman, and Radu Soricut. 2018. Conceptual captions: A cleaned, hypernymed, image alt-text dataset for automatic image captioning. In Proceedings of the 56th Annual Meeting of the Association for Computational Linguistics (Volume 1: Long Papers), pages 2556–2565.
- Su et al. (2019) Weijie Su, Xizhou Zhu, Yue Cao, Bin Li, Lewei Lu, Furu Wei, and Jifeng Dai. 2019. VL-BERT: Pre-training of generic visual-linguistic representations. In International Conference on Learning Representations.
- Suhr et al. (2017) Alane Suhr, Mike Lewis, James Yeh, and Yoav Artzi. 2017. A corpus of natural language for visual reasoning. In Proceedings of the 55th Annual Meeting of the Association for Computational Linguistics (Volume 2: Short Papers), pages 217–223.
- Suhr et al. (2019) Alane Suhr, Stephanie Zhou, Ally Zhang, Iris Zhang, Huajun Bai, and Yoav Artzi. 2019. A corpus for reasoning about natural language grounded in photographs. In Proceedings of the 57th Annual Meeting of the Association for Computational Linguistics, pages 6418–6428.
- Tan and Bansal (2019) Hao Tan and Mohit Bansal. 2019. LXMERT: Learning cross-modality encoder representations from transformers. In Proceedings of the 2019 Conference on Empirical Methods in Natural Language Processing and the 9th International Joint Conference on Natural Language Processing (EMNLP-IJCNLP), pages 5100–5111.
- Tan et al. (2021) Samson Tan, Shafiq Joty, Kathy Baxter, Araz Taeihagh, Gregory A. Bennett, and Min-Yen Kan. 2021. Reliability testing for natural language processing systems. In Proceedings of the 59th Annual Meeting of the Association for Computational Linguistics and the 11th International Joint Conference on Natural Language Processing (Volume 1: Long Papers), pages 4153–4169, Online. Association for Computational Linguistics.
- Tang et al. (2021) Jerry Tang, Amanda LeBel, and Alexander G Huth. 2021. Cortical representations of concrete and abstract concepts in language combine visual and linguistic representations. bioRxiv.
- Testoni et al. (2019) Alberto Testoni, Sandro Pezzelle, and Raffaella Bernardi. 2019. Quantifiers in a multimodal world: Hallucinating vision with language and sound. In Proceedings of the workshop on cognitive modeling and computational linguistics, pages 105–116.
- Wallace et al. (2019) Eric Wallace, Yizhong Wang, Sujian Li, Sameer Singh, and Matt Gardner. 2019. Do NLP models know numbers? Probing numeracy in embeddings. In Proceedings of the 2019 Conference on Empirical Methods in Natural Language Processing and the 9th International Joint Conference on Natural Language Processing (EMNLP-IJCNLP), pages 5307–5315.
- Xie et al. (2019) Ning Xie, Farley Lai, Derek Doran, and Asim Kadav. 2019. Visual entailment: A novel task for fine-grained image understanding. arXiv preprint arXiv:1901.06706.
- Zadeh et al. (2020) Amir Zadeh, Paul Pu Liang, and Louis-Philippe Morency. 2020. Foundations of multimodal co-learning. Information Fusion, 64:188–193.
- Zhao et al. (2021) Mengjie Zhao, Yi Zhu, Ehsan Shareghi, Ivan Vulić, Roi Reichart, Anna Korhonen, and Hinrich Schütze. 2021. A closer look at few-shot crosslingual transfer: The choice of shots matters. In Proceedings of the 59th Annual Meeting of the Association for Computational Linguistics and the 11th International Joint Conference on Natural Language Processing (Volume 1: Long Papers), pages 5751–5767.
Appendix A Dataset Details
We now describe the version of TraVLR used in our experiments, although our dataset generation scripts allow parameters such as the object properties and grid size to be modified. TraVLR draws from five colours (red, blue, green, yellow, orange) and seven shapes (square, circle, triangle, star, hexagon, octagon, pentagon), yielding a total of thirty-five unique objects. The seven shapes and colours used in TraVLR are present in the Visual Genome dataset (Krishna et al., 2017). We use a six by six grid, which allows a maximum of 36 objects in a scene. Each example consists of an image, a caption and a query.
A.1 Dataset Figures


A.2 Dataset Statistics
Table 3 shows the label distributions (true/false) for the various datasets: training, validation, In-Distribution (InD) test, and Out-Of-Distribution (OOD) test sets. The spatiality dataset is the largest dataset comprising 32k examples, while the other datasets comprise 8k examples. In the remainder of the section, we detail crucial statistics for the splits between the training and OOD test sets.
| Task | Train | Val. | InD Test | OOD Test |
|---|---|---|---|---|
| Spatial | 15903 / 16097 | 4979 / 5021 | 5064 / 4936 | 9918 / 10082 |
| Cardinality | 4040 / 3960 | 4927 / 5073 | 5043 / 4957 | 10079 / 9921 |
| Quantifier | 4006 / 3994 | 5003 / 4997 | 5030 / 4970 | 10029 / 9971 |
| Comparison | 4088 / 3912 | 4926 / 5074 | 4992 / 5008 | 10033 / 9967 |


For the spatiality task, the scene comprises only three objects: the two objects mentioned in the query, and one distractor object. We limit the number of distractors for this task, since we intend the task to evaluate models’ ability to compare the position of the objects, rather than their ability to perform object recognition.


Figure 8 shows dataset statistics for the training, InD and OOD spatiality dataset. Each figure indicates the number of examples whose scene instantiates a specific pair (this is independent of the query and label). For instance, there are 681 examples instantiating the pair for the horizontal relationship. In these examples, the first object in the query is found in Column A, and the second object is found in Column B. As illustrated in Figure 5, we ensure no overlap between pairs in the training set and the OOD test set. We note that each example either instantiates a horizontal or vertical relationship, but not both.
Unlike the spatiality task, more objects are present in the remaining tasks, since it is the ability to reason about the number of objects which is under test. For the cardinality task (Figure 9), we limit the number of objects relevant to the query within the range [1, 6], and the maximum number of distractor objects within the range [1, 10]. The relevant pairs shown in Figure 9 are shape, number, i.e. the number of objects of that shape.


For the numerical comparison task (Figure 10), we split the train and test sets by the pair where is the number of [attr1] objects, and is the number of [attr2] objects. The number of [attr1] and [attr2] objects are limited within the range , and the number of distractor objects is in the range .
| All | |
|---|---|
| Not all | |
| No | |
| Some | |
| Only | |
| Not only |


For the quantifiers task (Figure 14), we split the training and OOD distributions based on the pairs as stated in Table 4, which differ depending on the specific quantifier. We limit the number of objects relevant to each part of the pair within the range , and the number of distractor objects within the range .


Appendix B Experiment details
We conducted the following fine-tuning experiments:
-
•
4 V+L models on all 4 tasks on 3 modality settings, on 3 random seeds each = 144 main experiments.
-
•
2 text-only models on all 4 tasks, on 3 random seeds each = 24 experiments.
-
•
Replications of the above experiments on 3 smaller subsets of the original dataset, on a single random seed = 144 + 24 = 168 experiments (see Appendix C).
-
•
All models on all 4 tasks with frozen pretrained representations.
-
•
4 V+L models on 4 tasks on the modal dropout/“mixed” setting (see Appendix F).
-
•
Selected experiments on the Volta implementation of 3 V+L models (see Appendix E).
-
•
Selected experiments using the few-shot learning setting (see Appendix B.5).
B.1 Metric
The metric used is the macro F1 score, which is computed as the arithmetic mean of the F1 score of each of the two classes (true and false). We use F1 instead of accuracy due to small imbalances in the classes (see Table 3).
| (1) |
B.2 Hyperparameters
We train models for 80 epochs without early stopping. As the hyperparameters recommended for fine-tuning UNITER and LXMERT did not lead to convergence on some tasks, we adjusted learning rates downwards until the model converged. For LXMERT, we used a learning rate of 5e-5 only for the spatiality task, and 5e-6 elsewhere.
| Model | Batch Size | Learning rate |
|---|---|---|
| VisualBERT | 64 | 2e-5 |
| UNITER | 32 | 5e-6 |
| LXMERT | 32 | 5e-6 / 5e-5 |
| ALBEF | 256 | 2e-5 |
| VOLTA VisualBERT | 32 | 5e-6 |
| VOLTA UNITER | 32 | 5e-6 |
| VOLTA LXMERT | 32 | 5e-6 |
B.3 Runtimes
Table 6 provides an estimate of the runtimes for fine-tuning each model on different dataset sizes in different settings. Experiments were run either on NVIDIA GeForce RTX 2080 Ti or NVIDIA TITAN RTX GPUs. The longest experiments on ALBEF with the 32k dataset are estimated to lead to carbon emissions of 15.24 kgCO2eq (Lacoste et al., 2019).
| Dataset size | Model | Image | Caption | Img.+Cap. |
|---|---|---|---|---|
| 32k | UNITER | 15 | 27 | 27 |
| VisualBERT | 15 | 27 | 27 | |
| LXMERT | 25.5 | 36.5 | 36.5 | |
| ALBEF | 38 | 38 | 38 | |
| BERT | - | 12 | - | |
| RoBERTA | - | 12 | - | |
| 8k | UNITER | 3.5 | 7 | 7 |
| VisualBERT | 5 | 7 | 7 | |
| LXMERT | 6.5 | 10.5 | 10.5 | |
| ALBEF | 8 | 9 | 9 | |
| BERT | - | 3 | - | |
| RoBERTA | - | 3 | - |
B.4 Model Details
Table 7 summarises the amount and sources of pretraining data used in the pretraining of various models we evaluate. Table 8 reports the total trainable parameters for each model.
| Model | Pretraining Dataset Size | COCO | VG | CC | SBU | Other |
|---|---|---|---|---|---|---|
| VisualBERT | 600k | ✓ | ✓ | ✓ | ||
| UNITER | 5.6M | ✓ | ✓ | ✓ | ✓ | |
| LXMERT | 9.18M | ✓ | ✓ | ✓ | ✓ | ✓ |
| ALBEF | 4.0M | ✓ | ✓ | ✓ | ✓ | |
| VOLTA | 2.77M | ✓ |
.
| Model | Num. Parameters |
|---|---|
| VisualBERT | 112.64 M |
| UNITER | 111.08 M |
| LXMERT | 209.12 M |
| ALBEF | 290.34 M |
| BERT | 108.31 M |
| RoBERTa | 124.65 M |
| VOLTA VisualBERT | 114.02 M |
| VOLTA UNITER | 113.63 M |
| VOLTA LXMERT | 210.50 M |
B.5 Few-shot learning experiments
On top the zero-shot setting experiments that we conduct on all fine-tuned models, we perform few-shot learning experiments on selected fine-tuned models as shown in Table 9. We select the best-performing model for the task and setting, as well as additional models to ensure that all models are tested. We adopt the same hyperparameters stated in Table 5, and perform additional fine-tuning on 200 examples of the unseen modality for 20 epochs. Typically, between 10 to 100 examples are sufficient for few-shot cross-lingual transfer on multilingual BERT (Zhao et al., 2021). For instance, in the “Image to Caption” setting, we fine-tune a model already fine-tuned for 80 epochs in the image-only setting, on examples in the caption-only setting.
| Setting | Task | Models tested | Seed |
| Image to Caption | Spatiality | UNITER | 0 |
| LXMERT | 0 | ||
| Quantifiers | VisualBERT | 2 | |
| UNITER | 2 | ||
| LXMERT | 2 | ||
| Caption to Image | Spatiality | UNITER | 0 |
| ALBEF | 2 | ||
| Quantifiers | VisualBERT | 2 | |
| UNITER | 2 | ||
| ALBEF | 2 |
Appendix C Effect of Training Dataset Size
To investigate the effect of training dataset size on model performance, we fine-tune models with 50%, 25% and 12.5% subsets, randomly sampled from the full training set. These experiments were conducted only on a single random seed, due to resource limitations.


Spatiality.
On the spatiality task (Figure 15), in the image-only setting, LXMERT requires the least amount of data to achieve convergence (4k examples), followed by UNITER (8k examples), and VisualBERT (16k examples). ALBEF fails to converge, even on the full 32k dataset. There is a clear advantage in performance of LXMERT and UNITER over VisualBERT and ALBEF.
In the caption-only setting, the text-only model RoBERTa performs the best, achieving F1s close to 100 with 16k training examples. While BERT, UNITER and VisualBERT achieve similar results with 32k training examples, the V+L models are outperformed by BERT when trained on a smaller dataset.


Cardinality.
Compared to the spatiality task, more models converged on the cardinality task (Figure 16) with a smaller amount of data (8k examples). In the image-only setting, LXMERT remains the best performing model on the full 8k dataset, but the performance of VisualBERT, UNITER and LXMERT are relatively similar. In the caption-only setting, when trained on a smaller dataset with 1k examples, RoBERTA achieves an F1 of 86.76, while all other models achieve an F1 between 55 and 67, except for LXMERT, which fails to achieve non-random performance. In the image+caption setting, ALBEF seems to be most data efficient, performing the best on a 2k training dataset.


Quantifiers.
On the quantifiers task (Figure 17), in the image-only setting, we observe a similar overall trend to the spatiality task, where UNITER and LXMERT significantly outperform the other models. In the caption-only setting, RoBERTa significantly outperforms BERT with limited data (1k examples), and the performance of UNITER and VisualBERT resembles that of BERT. The superior performance of ALBEF on a smaller 2k dataset in both caption-only and image+caption settings is observed again, as on the cardinality task.


Numerical Comparison.
On the numerical comparison task (Figure 18), all models exhibit relatively poor performance on the OOD dataset in the image-only setting, revealing an inability to generalise to unseen number pairs. In the caption-only and image+caption settings, the superior performance of RoBERTa over BERT, and VisualBERT and ALBEF over the other V+L models can be observed, as similarly described for other tasks. The performance of VisualBERT and UNITER is clearly distinguished.
Appendix D Training Duration


We discuss selected runs indicative of the contrast in the number of training steps required by models. From the training loss curves on a single run of training on the spatiality tasks, we can observe a substantial degree of variation in the amount of time each model takes to converge.
The training loss curves in Figure 19 are on the whole indicative of the significant amount of time required by all models except LXMERT to learn the spatiality task. With the notable exception of LXMERT, many models have yet to fully converge by 60 epochs. LXMERT takes fewer than 5 epochs to achieve a training loss close to 0, while completely failing to converge on the caption and image+caption settings. Possible reasons for the faster convergence of LXMERT on the spatiality task include the large size of its pretraining data, and the fact that it was additionally pretrained on a VQA task, unlike the other models. VisualBERT has yet to completely converge after 80 epochs. ALBEF in the image+caption setting and UNITER in the caption setting are representative of successful convergence, which is achieved only after 40 and 60 epochs, respectively.


The variation between models is much less significant on the cardinality dataset, as seen in Figure 20. The training loss curves between the caption-only and image+caption settings are often similar, and also steeper compared to the image-only loss curves, which is reflective of the textual bias of all models towards the caption when both modalities are presented in the image+caption setting. In the image-only setting, most models have yet to fully converge within 80 epochs, in this case, with the exception of VisualBERT. It is notable that the marked advantage of LXMERT in terms of efficiency of training time observed in the spatiality task does not extend to other tasks.
Appendix E VOLTA Experiments
From Table 10, we observe that while the performance of all three Volta models are similar on the 32k spatiality dataset, Volta UNITER significantly outperforms both Volta LXMERT and Volta VisualBERT on the 8k spatiality dataset. This is in contrast to results on the original models where LXMERT exhibits a clear advantage over the other models and is able to achieve an F1 score close to 100 on the 8k dataset.
| Dataset | Model | OOD | InD | # Seeds | ||
| Size | Mean | Stdev. | Mean | Stdev. | ||
| 32k | Volta LXMERT | 99.30 | - | 99.67 | - | 1 |
| Volta UNITER | 99.67 | - | 99.88 | - | 1 | |
| Volta VisualBERT | 98.31 | - | 98.92 | - | 1 | |
| LXMERT | 99.46 | 0.47 | 99.84 | 0.13 | 3 | |
| UNITER | 89.67 | 14.43 | 88.71 | 14.58 | 3 | |
| VisualBERT | 65.94 | 6.63 | 66.96 | 6.05 | 3 | |
| 8k | Volta LXMERT | 62.28 | 3.16 | 64.17 | 3.73 | 3 |
| Volta UNITER | 94.46 | 1.19 | 93.18 | 1.50 | 3 | |
| Volta VisualBERT | 60.73 | 2.39 | 60.69 | 2.90 | 3 | |
| LXMERT | 99.02 | - | 99.00 | - | 1 | |
| UNITER | 88.33 | - | 91.48 | - | 1 | |
| VisualBERT | 49.60 | - | 49.25 | - | 1 | |
Similar findings are observed on the cardinality dataset (Table 11), where Volta LXMERT is outperformed by both Volta UNITER and Volta VisualBERT. The Volta LXMERT differs from the original LXMERT in the amount of pretraining data, as well as the use of VQA examples and a downstream VQA objective during pretraining. It can be concluded that LXMERT loses its advantage in the image-only setting when it is pretrained in the same manner as other models.
| Model | OOD | InD | # Seeds | ||
|---|---|---|---|---|---|
| Mean | Stdev. | Mean | Stdev. | ||
| Volta LXMERT | 73.38 | 0.56 | 79.30 | 0.39 | 3 |
| Volta UNITER | 85.91 | 5.13 | 87.40 | 3.36 | 3 |
| Volta VisualBERT | 81.67 | 4.46 | 83.90 | 1.66 | 3 |
| LXMERT | 82.90 | 3.86 | 84.56 | 2.71 | 3 |
| UNITER | 77.12 | 5.04 | 77.03 | 1.44 | 3 |
| VisualBERT | 77.41 | 0.61 | 76.30 | 0.46 | 3 |
The difference between Volta LXMERT and the original LXMERT can also be clearly observed in the training loss curves in Figure 21, where the original LXMERT is significantly more efficient in terms of number of epochs required for training.


Furthermore, it is notable that the performance of VisualBERT on the full dataset is significantly improved over the original model. This is likely due to the fact that the Volta VisualBERT was pretrained with more data than the original VisualBERT. An additional finding is that Volta UNITER outperforms Volta VisualBERT and LXMERT.
| Model | OOD | InD | # Seeds | ||
|---|---|---|---|---|---|
| Mean | Stdev. | Mean | Stdev. | ||
| Volta LXMERT | 97.87 | 0.85 | 99.44 | 0.03 | 3 |
| Volta UNITER | 98.73 | 1.25 | 99.60 | 0.11 | 3 |
| Volta VisualBERT | 99.40 | 0.03 | 98.50 | 0.11 | 3 |
| LXMERT | 60.02 | 4.76 | 78.90 | 6.83 | 3 |
| UNITER | 98.96 | 0.30 | 97.14 | 0.83 | 3 |
| VisualBERT | 99.99 | 0.01 | 99.91 | 0.06 | 3 |
Finally, the Volta models were also used to investigate the comparatively poor performance of the original LXMERT on the caption-only and image+caption settings. As seen in Table 12, all three Volta models achieve similar results on the 8k cardinality dataset. Given that all Volta models were initialised with BERT weights, this lends support to the idea that the poor performance of LXMERT on textual input is due to the lack of initialisation with BERT weights (Tan and Bansal, 2019).
| Task | Model | OOD | InD | #sd | ||||
| Image | Caption | Img. + Cap. | Image | Caption | Img. + Cap. | |||
| S | VisualBERT | 50.61 (+1.28) | 70.03 (-0.96) | 69.26 (-2.12) | 50.88 (+1.85) | 72.26 (-0.32) | 71.94 (-1.10) | 3 |
| UNITER | 64.24 (+14.09) | 50.03 (-20.72) | 49.70 (-21.47) | 63.53 (+13.55) | 49.70 (-19.81) | 50.32 (-20.45) | 1 | |
| LXMERT | 33.27 (-0.24) | 33.27 (-0.24) | 33.27 (-0.24) | 33.43 (+0.38) | 33.43 (+0.38) | 33.43 (+0.38) | 0 | |
| ALBEF | 48.25 (-0.31) | 96.12 (+2.46) | 96.10 (+2.79) | 48.14 (+0.52) | 99.99 (-0.01) | 99.99 (-0.01) | 3 | |
| C | VisualBERT | 65.07 (+19.87) | 99.86 (-0.08) | 99.85 (-0.10) | 65.01 (+18.39) | 99.53 (-0.31) | 99.41 (-0.35) | 3 |
| UNITER | 66.01 (+23.65) | 97.86 (-0.62) | 97.40 (-1.44) | 67.61 (+23.28) | 94.57 (-3.80) | 94.01 (-2.83) | 3 | |
| LXMERT | 60.43 (+9.71) | 54.03 (-0.97) | 54.35 (-0.91) | 64.42 (+14.04) | 76.80 (+20.20) | 73.63 (+10.55) | 3 | |
| ALBEF | 47.67 (+4.51) | 99.21 (-0.41) | 99.16 (-0.45) | 48.77 (+3.28) | 98.30 (-1.06) | 98.21 (-1.14) | 3 | |
| Q | VisualBERT | 66.34 (+16.83) | 99.01 (-0.97) | 99.01 (-0.96) | 65.35 (+15.68) | 98.43 (-1.56) | 98.37 (-1.63) | 3 |
| UNITER | 75.04 (+26.98) | 93.41 (-4.44) | 93.82 (-5.04) | 73.18 (+23.97) | 88.14 (-7.60) | 88.43 (-9.00) | 3 | |
| LXMERT | 64.72 (+15.78) | 53.23 (+19.30) | 50.13 (-0.90) | 62.36 (+13.27) | 69.16 (+35.22) | 67.06 (+16.21) | 3 | |
| ALBEF | 51.92 (+4.19) | 99.88 (-0.09) | 99.87 (-0.09) | 51.68 (+4.14) | 99.18 (-0.62) | 99.12 (-0.68) | 3 | |
| N | VisualBERT | 59.32 (+8.22) | 92.68 (-7.10) | 92.79 (-7.00) | 61.54 (+10.64) | 99.62 (-0.27) | 99.64 (-0.26) | 3 |
| UNITER | 61.79 (+15.01) | 56.92 (-7.88) | 56.85 (-7.03) | 76.65 (+28.84) | 99.17 (-0.34) | 99.08 (-0.71) | 3 | |
| LXMERT | 58.81 (+8.13) | 56.07 (-1.39) | 56.57 (-0.24) | 62.17 (+13.80) | 84.17 (-0.05) | 79.42 (-19.24) | 3 | |
| ALBEF | 42.80 (-4.44) | 88.82 (-10.11) | 88.83 (-10.10) | 47.34 (-1.40) | 99.62 (-0.22) | 99.62 (-0.22) | 3 | |
Appendix F Modal dropout/“mixed” setting
There is a concern that the bimodal presentation of the input in the image+caption setting facilitates overfitting to the textual modality. One way to alleviate the impact of bias towards either modality is by performing dropout of either the image or caption input in a subset of the input, thus introducing some unimodal examples into the image+caption dataset. This technique is inspired by the idea of sensor dropout as described in Liu et al. (2017), where overfitting to specific sensors (modalities) by a multisensor autonomous navigation system is avoided through dropout of features from sensors during training. In the following experiments, we perform dropout at a fixed probability of 25% for both the image and caption modalities. In other words, datasets comprise 50% image+caption, 25% image-only and 25% caption-only input.
Overall, performance of models trained in the mixed setting resembles performance of models trained in the image+caption setting, in that they exhibit a bias towards the textual modality. Performance on the image modality is generally poorer than performance on both caption-only and image+caption test settings (with the exception of LXMERT), and performance on caption-only and image+caption settings are largely similar. Nevertheless, because of the dropout of the caption modality in 25% of the input, the models are forced to also learn to deal with image-only input to some extent, and hence exhibit non-random performance on image-only test data in some cases.
F.1 Comparison against models trained purely on image+caption input
First, we compare the performance of models trained in the mixed setting against those trained in the image+caption setting. The relative difference is shown in brackets in Table 13. In the spatiality task, only UNITER achieves a non-random performance in the image-only setting, while VisualBERT, LXMERT and ALBEF exhibit no significant difference in comparison to the image+caption baseline. On the other tasks, we observe that VisualBERT, UNITER and LXMERT exhibit above random performance in the mixed setting, improving results over the purely image+caption setting.
When models trained in the mixed setting are tested in the caption and image+caption settings, in the majority of cases, there is a small decrease in performance compared to models trained in the purely image+caption setting. The small magnitude of this difference is likely because the models continue to overfit to the caption when both image and caption input is presented, and are deprived of the textual information in only 25% of the training data. The magnitude of the difference is larger in the numerical comparison task, where VisualBERT, UNITER and ALBEF exhibit significant decreases in performance on the OOD test set.
There are several exceptions to the overall trend. Firstly, unlike the other models, UNITER seems to have overfitted to the image modality instead of the caption modality in the spatiality task. Second, LXMERT exhibits an improvement in performance in both the caption and image+caption settings on the cardinality and quantifier datasets.
F.2 Comparison against models trained on subset of data
| Task | Model | OOD | InD | #Seeds | ||||
|---|---|---|---|---|---|---|---|---|
| Image | Caption | Img. + Cap. | Image | Caption | Img. + Cap. | |||
| S | VisualBERT | +1.36 | +19.07 | -21.95 | +1.28 | +21.66 | -28.05 | 3 |
| UNITER | -27.24 | +0.37 | -0.66 | -24.80 | -1.38 | +0.42 | 1 | |
| LXMERT | -65.73 | -16.15 | -16.97 | -65.59 | -16.47 | -17.65 | 0 | |
| ALBEF | +0.16 | +47.09 | +47.27 | -0.56 | +50.87 | +50.89 | 3 | |
| C | VisualBERT | +6.49 | +11.41 | +1.82 | +4.86 | +12.50 | +4.48 | 3 |
| UNITER | +1.52 | +10.46 | +2.02 | +3.27 | +11.35 | +4.31 | 3 | |
| LXMERT | -2.97 | +4.08 | +3.85 | -0.11 | +19.47 | +24.46 | 3 | |
| ALBEF | -9.47 | +12.29 | +0.47 | -8.50 | +9.64 | +1.83 | 3 | |
| Q | VisualBERT | +9.18 | +44.72 | +13.31 | +8.70 | +45.03 | +15.75 | 3 |
| UNITER | +12.15 | +43.48 | -2.30 | +8.44 | +36.99 | -2.73 | 3 | |
| LXMERT | +31.32 | +19.83 | +0.15 | +28.89 | +35.69 | +17.93 | 3 | |
| ALBEF | +1.18 | +7.37 | +2.14 | +0.81 | +13.61 | +2.92 | 3 | |
| N | VisualBERT | +6.73 | +38.46 | +17.75 | +0.09 | +43.60 | +1.18 | 3 |
| UNITER | +0.10 | -8.21 | -3.95 | +4.69 | +5.98 | +0.26 | 3 | |
| LXMERT | -0.59 | -2.77 | -1.28 | +1.54 | +18.20 | +11.76 | 3 | |
| ALBEF | -2.75 | -5.73 | +28.78 | -0.61 | +5.29 | +21.15 | 3 | |
Next, we compare the results from the mixed setting against a baseline if the mixed dataset were separated into datasets with fully unimodal or bimodal examples. For instance, the 32k mixed dataset on the spatiality task can be compared against baseline datasets of i) 16k bimodal image+caption examples, ii) 8k image-only examples and iii) 8k caption-only examples. Specifically, we ask if there is a performance benefit to training models on a single mixed dataset which combine these subsets together, as opposed to training models on each dataset separately.
This baseline is obtained from training on a randomly sampled subset of the full dataset. As previously explained, these experiments on subsets of the full dataset were conducted only on a single random seed, due to resource limitations. In Table 14, we observe that the performance of models trained on the mixed dataset indeed outperforms models trained on only the caption-only and image+caption subset of the data. This result is not unexpected, given that it is known that models exploit the caption present in the image+caption examples.
However, it is less clear from the results whether the models are able to exploit the additional image information present in the image+caption examples in the mixed setting to improve performance on the image-only test examples. In particular, results from the quantifier task, as well as the results of VisualBERT on the OOD test set seem suggestive of some advantage accorded to models by the additional image+caption data. Nevertheless, there are also results suggestive of the opposite finding, particularly on the spatiality task, where the presence of caption-only and image+caption examples degrades performance in the image-only setting.
We conclude that the technique of dropping out the input from some modalities helps to ameliorate the extent of the textual bias in the image+caption setting to some extent, although the overall textual bias of models remains.
Appendix G Error analysis
In section 5.4, we described our error analysis of the spatiality and cardinality tasks. In this appendix section, we include additional details on the cardinality task and present our error analysis on the quantifiers and numerical comparison tasks.
G.1 Cardinality

As noted in section 5.4, a significant factor is the total number of objects in the image, inclusive of distractors. Figure 22 shows an increasing percentage of wrong answers as the total number of objects increases. We also notice a slight decrease in wrong answers when the number of objects exceeds 13. This can be attributed to the decreasing likelihood of correct answers having smaller numbers.
G.2 Quantifiers


Figure 23 plots the percentage of wrong answers against specific values relevant to the particular quantifiers of VisualBERT on the InD test set in the image-only setting. Similar patterns are also observed across other models in runs with moderate performance, although moderate performance in some cases may be due to failure to learn a subset of quantifiers. For instance, Figure 23a shows the percentage of wrong answers against the number of Xs which are not Ys, given all false queries of the form “All Xs are Ys”. The results show that the more Xs which are not Ys, the less likely it is for the model to incorrectly predict the query to be true. In Figure 23c, given all true queries of the form “Some Xs are Ys”, the more objects which are both X and Y, the less likely it is for the model to incorrectly predict the query to be false. Although the trend is not always robust across all the quantifiers, this overall pattern of errors made by models is not unexpected.
G.3 Numerical comparison


The plot in Figure 25 reveals a clear trend where models are more accurate on pairs where the magnitude of (i.e. the difference between the numerals being compared) is larger for the InD test set. However, the more significant finding is that the numerical comparison task was the only task which exhibited significant differences in performance between the InD and OOD datasets, due to an inability to generalise to unseen pairs particularly in the image-only setting, but also the caption-only setting in the case of UNITER and LXMERT.
In Figure 25, we observe a pattern where the model succeeds only on OOD queries where the number of the first object exceeds that of the second object (cells on the upper right are darker than cells on the lower left). This asymmetry is also observed to some extent in Figure 25. This pattern does not result from any simple strategy of providing the same answer (true/false) given a relation in the query (more/fewer). A similar pattern is observed even when subsetting the OOD test set into queries with either the more or fewer relation in both cases. The overall finding is that models are able to generalise to unseen number pairs by constructing an implicit numeral scale, but only to a limited extent.