Topology of vibrational modes predict plastic events in glasses
Abstract
The plastic deformation of crystalline materials can be understood by considering their structural defects such as disclinations and dislocations. Although glasses are also solids, their structure resembles closely the one of a liquid and hence the concept of structural defects becomes ill-defined. As a consequence it is very challenging to rationalize on a microscopic level the mechanical properties of glasses close to the yielding point and to relate plastic events with structural properties. Here we investigate the topological characteristics of the eigenvector field of the vibrational excitations of a two-dimensional glass model, notably the geometric arrangement of the topological defects as a function of vibrational frequency. We find that if the system is subjected to a quasistatic shear, the location of the resulting plastic events correlate strongly with the topological defects that have a negative charge. Our results provide thus a direct link between the structure of glasses prior their deformation and the plastic events during deformation.
The structural disorder of glasses allows them to have a multitude of properties that are absent in crystals but can be exploited in many technical applications Deb01 ; Bin11 ; Var19 ; Wan19 . The downside of this disorder is that it has hindered us to come up with a reliable microscopic description of many of these features since at present we lack a solid understanding how the atoms are arranged on the level of the particles Bin11 . Prominent examples of these properties are the specific heat of glasses at low temperatures, the electric conduction properties of glasses Phi87 ; Ram22 , or the plastic deformation of the solid upon applied load before the yielding point Dyr06 . While in crystals dislocations and disclinations allow to rationalize the plastic deformation kit96 , the structural disorder of glasses makes it impossible to come up with a reasonable definition of a defect and as a consequence it becomes very challenging to establish a connection between the local structure and the yielding of the sample, despite a multitude of efforts Fal98 ; Pen11 ; Man11 ; Din14 ; Pat16 ; Yan16 ; Ric20 ; Rid22 . Although the local structure of systems composed of particles that have a mesoscopic size (colloids, granular systems,…) can be determined on the level of the particles Che11 ; Yan16 ; Cao18 , the mechanical properties of such materials are dominated by particle-interactions that are mainly of excluded volume type, i.e., very different from the ionic or covalent interactions found in atomic systems. As a consequence our understanding on how the local structure and interactions affect the mechanical properties of materials like metallic or oxide glasses is far from being satisfactory, despite the long history of research on this topic Nic18 .
Early studies on this question showed that for simple model systems an increasing strain leads to a destabilization of the local packing and results in a strain activated, instead or thermally activated, stress relaxation Mala98 , a picture that was elaborated by Falk and Langer who introduced the notion of shear transformation zones (STZ) Fal98 . Many subsequent studies have related these STZ and the plastic events (PE) to structural quantities or a high local entropy, indicating that this concept is useful Pen11 ; Din14 ; Yan16 ; Cao18 ; Mit22 .
By probing the local yield stress in the glass, Patinet et al showed that the zones in which this stress is weak correlate well with the spots at which the globally sheared sample shows a plastic event Pat16 . In particular it was found that this purely local measure shows a higher predictive power for identifying sites of plastic activity than the structural properties considered so far, thus demonstrating that PE can be predicted from local information and that therefore it is reasonable the attempt to correlate PE with local structural information.
At low temperatures the motion of the atoms is of vibrational nature Ler21 and since PEs are related to a local mechanical instability of the particle configuration it can be expected that the latter are associated with quasi-localized soft modes. Various studies support this view, showing that the location of these soft modes are often, but not always, related to the local arrangement of the particles Maz96 ; Sch04 ; Mal04 ; Mal04a ; Bri07 ; Wid08 ; Xu10 ; Tang10 ; Man11 ; Che11 ; Din14 ; Rot14 ; Gar16 ; Bon19 ; Bag21 .
In view of the difficulty to identify the relevant structural features that are responsible for the occurrence of PE, recent studies have used machine learning approaches to identify a connection between these two quantities Fon22 ; Sch17 ; Cub17 ; Fan21 ; Rid22 . Although these works have demonstrated that this technique is indeed able to predict to some extent the location of PEs, Richard and collaborators has recently shown that the quality of these predictions is not always superior to the one of simple local structural predictors and hence one concludes that at present we are still lacking insight on the relevant quantity that is able to predict PEs Ric20 .
Although soft modes show a good correlation with plastic events, one must recall thatyielding is a cooperative phenomenon. Therefore it is important to study not only the effect of individual modes, but instead to consider the total vibrational field given by the weighted sum over all the modes, since this will determine the displacement field of all the atoms. In the present work we hence focus on the eigenvector field for the different modes, and in particular study its topological properties. (See also Ref. Bag21 for a somewhat related approach.) We find that the topological singularities of this field, averaged over the modes, are closely related to the plastic events, showing that the vibrational modes allow direct prediction of the location of plastic transformations if the sample is sheared.
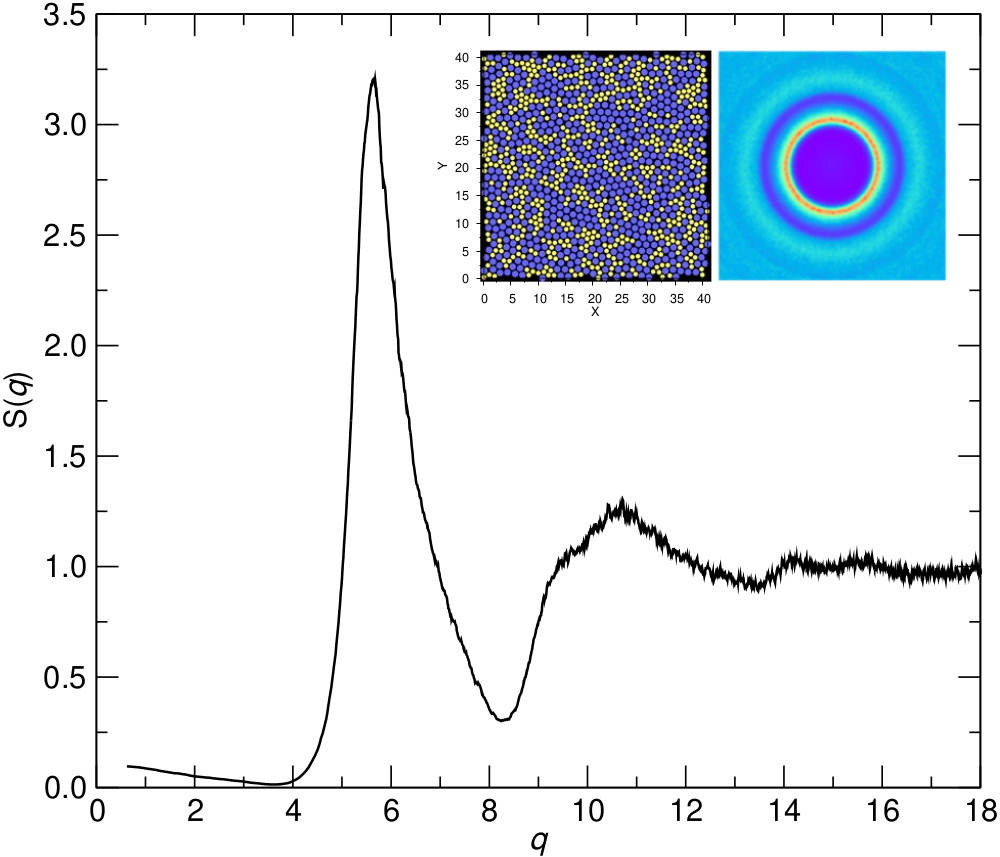
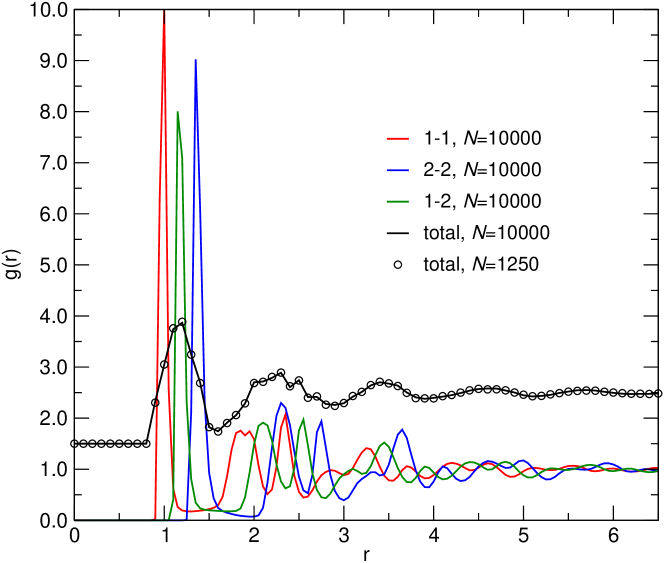
System: The system we study is a two-dimensional binary mixture of Lennard-Jones particles, the interactions of which have been truncated at the minimum. The liquid was equilibrated at a high temperature and then cooled down, at constant volume, below the kinetic glass transition temperature. Using a conjugate gradient procedure we determined the local minimum of the potential energy and subsequently calculated the eigenvectors and vibrational frequencies . More details on the potential and the simulations are given in the Methods and structural data is given in the Extended Data Figs. 1 and 2.
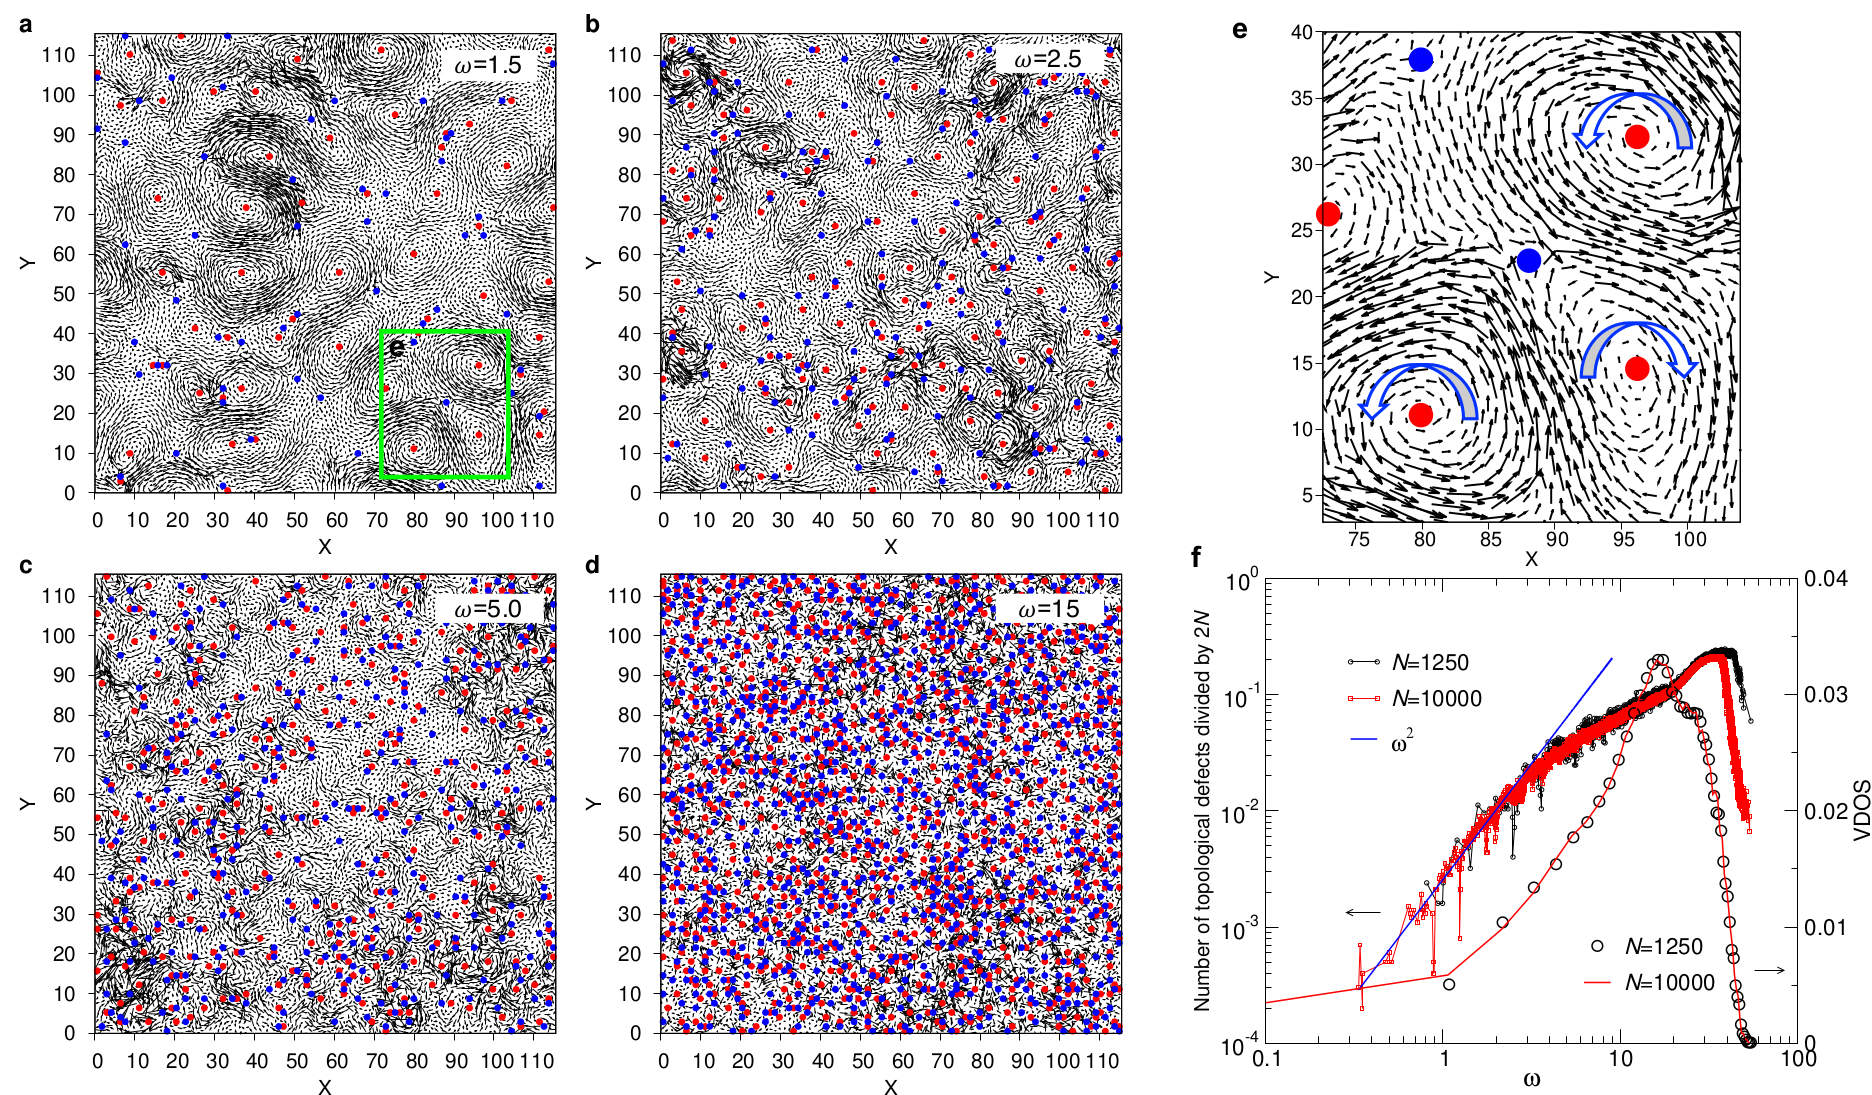
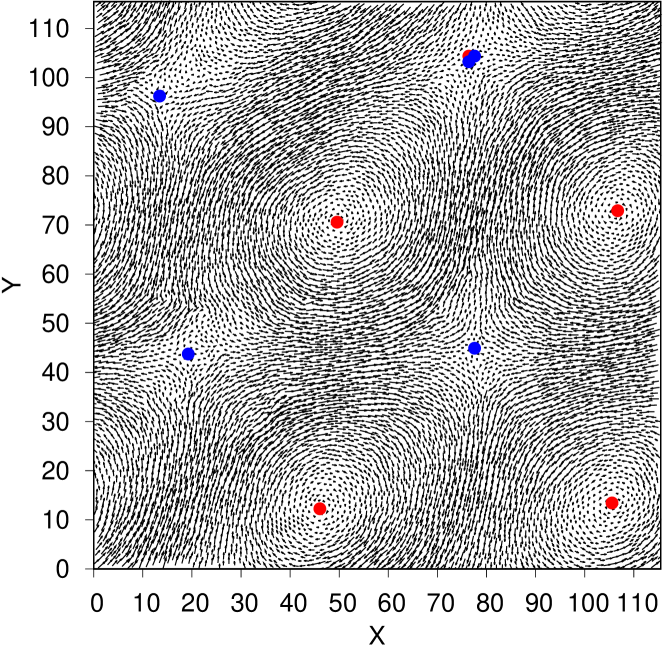
Results: In order to comprehend the evolution of the morphology of the eigenvector field with , we show in Fig. 1 the vibrational modes for different values of the frequency. (The vibrational density of states is shown in panel (f).) For low frequencies, panel (a), the mode is composed of a multitude of swirls that have roughly the same size. (In Extended Data Fig. 4 we show that at very low frequencies the eigenvector does show a regular pattern, as expected for an elastic solid.) By calculating from the eigenvector field the topological charge, i.e., the winding number, we can identify the location of the singularities (topological defects, TD) of the field (see Methods) and these positions are included in the graph as well, with red and blue points marking charges +1 (vortex) and (saddle points), respectively; see also panel (e).
A closer inspection of Fig. 1(a) demonstrates that at low the positions of the TD are not random but correlated: While TDs with the same sign have the tendency to stay away from each other, TDs with opposite sign seem to attract each other and below we will quantify this behavior in more detail. Note that two neighboring swirls with opposite sign of phase chirality (direction of rotation of the vortex) have an interface that is not frustrated, Fig. 1(e), while if they have the same sign of chirality, they are not compatible with each other and thus at their interface there will be a TD with charge 1, Fig. 1(e).
If is increased, panels (b)-(d), it becomes increasingly difficult to identify isolated zones in which the atoms move in an coherent manner, i.e., the swirls become ill-defined. It is, however, still possible to identify the TDs and thus to recognize that their number increases quickly with increasing frequency. Panel (f) shows the total number of TD as a function of frequency and we find that at low this number increases like . This dependence can be understood by recalling that for a continuous elastic medium the number of maxima/minima of a plane wave with wave-vector , i.e., an acoustic mode, increases like . If plane waves having the same but different orientations are superposed, this will give rise to minima/maxima. Since in dimensions the number of modes increases like , the number of minima/maxima scales like and because , this rationalizing the -dependence of the number of TD (see also Fig. 2(d) and Extended Data Fig. 4).
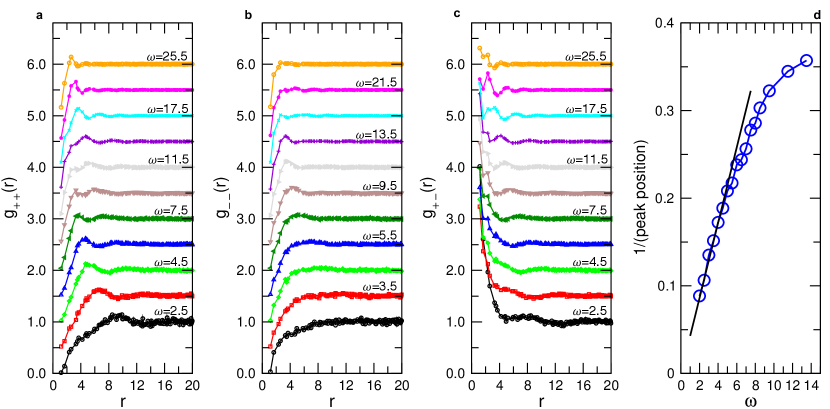
The positional correlation observed in Fig. 1(a) between the defects can be quantified by means of the corresponding partial radial distribution functions , , and Bin11 , Fig. 2. For low one notices that has a correlation hole at small , followed by a small peak at , signaling the typical distance between these TDs, in agreement with the fields shown in Fig. 1. With increasing this peak shifts to smaller and one finds that at small and intermediate , its location is proportional to , see panel (d), which is consistent with the -dependence of the acoustic modes discussed above. This proportionality holds up to , at which point it crosses over to a weaker -dependence. In this range of , displays several wiggles, indicating that the TD with charge +1 form a structure that is similar to the one of a liquid, i.e., these TDs have the tendency to repel each other. For , panel (b), we find no nearest neighbor peak at low , showing that these TD behave like an ideal gas. Only if the frequency reaches one notices a peak at around , but at larger no further wiggles are observed. This indicates that negative TDs are clustered but do not form a structure that is reminiscent to the one of a liquid. If is increased even more, the correlation function becomes again flat (except for a correlation hole at ), showing that at high frequencies these TDs become completely uncorrelated. These observations for indicate that the relative arrangement of the defects is significantly less pronounced than the one of the TD and below we will discuss the origin of this behavior.
The correlator , panel (c), shows a dependence on and that is very different from the two other correlators. Independent of one finds a strong peak at small ’s, demonstrating that the positive and negative TD attract each other. In view of this strong correlation one can conclude that the positive TD form a liquid-like structure and that it is the attraction between the positive and negative TD which makes that the latter become correlated as well, although to a lesser extent, in agreement with the data in panel (b).
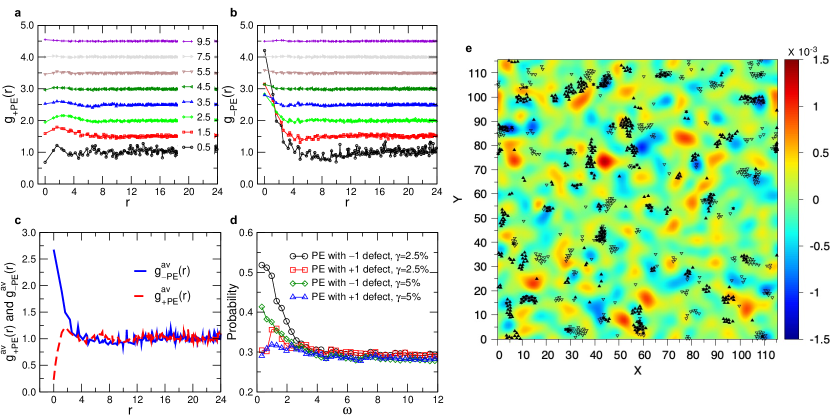
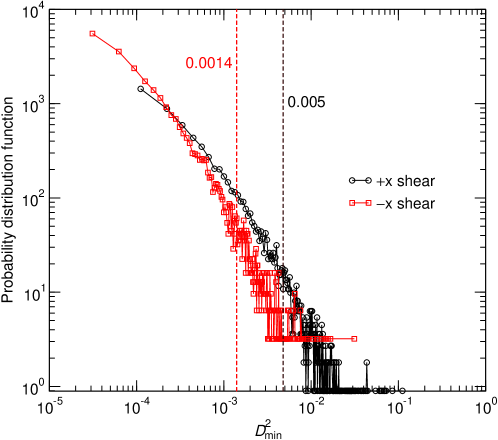
Since TDs are singularities in the field of the eigenvector, it can be expected that they are directly related with the heterogeneous mechanical response of the system under shear. To explore this connection we have determined the plastic instabilities of the sample if it is put under an athermal quasi-static pure shear, see Methods for details. For a sheared configuration at strain we calculate , the field of non-affine displacement of the particles between two consecutive configurations (having a difference in strain of 0.05%) Fal98 . After a drop in the stress, signaling that a plastic event has occurred, we identify the particles that have a high (top 5%, see Extended Data Fig. 7), and associate these particles to a PE. The location of these PEs can be correlated with the position of the TDs by means of a corresponding radial distribution function , where . In Fig. 3(a)-(b) we show the resulting correlation for different values of and one recognizes that is basically flat, implying that there is only very little correlation of the PE with the positive TDs, and this holds for all frequencies. The only noticeable feature in the curve is the small peak at around if is small, the origin of which is discussed below.
In contrast to this, shows at small and intermediate values of a marked peak at small , panel (b), demonstrating that PE are closely related to low-frequency TDs with negative charge. This results rationalizes also the presence of the small peak found at in since from Fig. 2(c) we know that TDs with positive and negative charges are significantly correlated and hence the correlation between negative TDs and PEs will induce a correlation between positive TDs and PEs.
Panels (a) and (b) show that TDs and PEs are correlated if is less than , while for higher frequency there is no correlation. We have therefore averaged all in the rage in order to get a correlation function that takes into account all the TDs at low frequencies. Since the number of TDs increases quadratically with , see Fig. 2(d), we have weighted the individual by . The resulting correlation functions and are shown in panel (c) and from this graph one clearly recognizes that the negative TDs are significantly correlated with the PE in that the peak at small rises above 2.5, which means that there is a more than two-fold increase of the probability that a PE occurs close to a TD as compared to a uniform distribution.
Since these results have been obtained by considering all the modes up to a cut-off frequency , it is of interest to check to what extent the correlation between the TDs and PE depend on the frequency of the mode. Therefore we show in Fig. 3(d) the probability that a PE is close to a TD as a function of . In practice we used a cut-off distance between TD and PE of 1.6, i.e., the location of the first minimum in the radial distribution function between the particles, see Extended Data Fig. 2. The graph shows that the probability is high for small value of and then decreases rapidly if one approaches the threshold 3.5, the value we have used to calculate the curves in panel (c), thus justifying this choice. For larger values of the probability stays at around 0.3, a value that is determined by the spatial density of the PE, i.e., these high frequency modes are not relevant for the occurrence of the PEs.
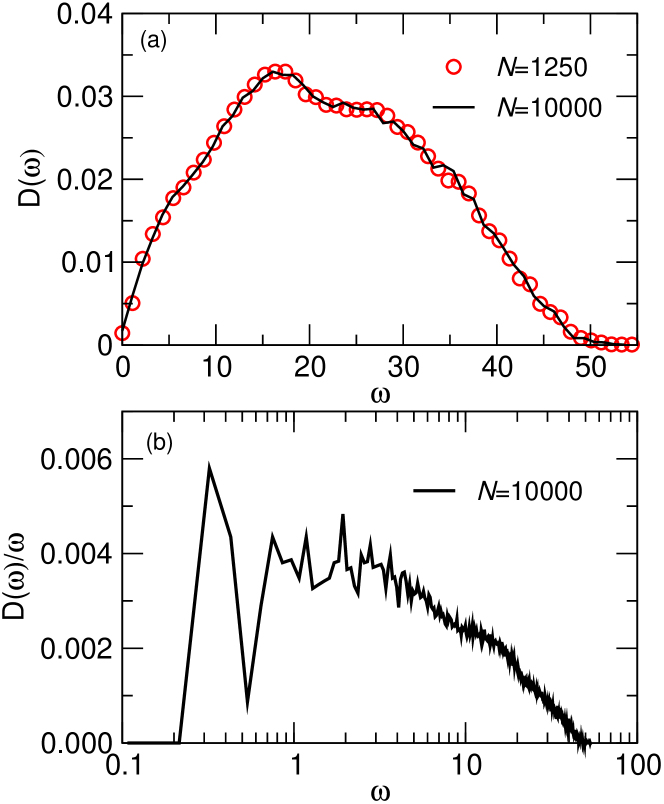
The results presented so far are for a strain of . Also included in panel (d) is the corresponding data for , a value that is close to the yielding point of the system, see Extended Data Fig. 5, and one recognizes that also in this case there is a pronounced increase of the probability at small , i.e., the negative TDs for small correlate well with the PE and this correlation disappears for , indicating that this value is independent of the strain. Note that this threshold is also close to the frequency at which the number of TDs as a function of frequency starts to show the first deviation from the quadratic law found at low values of , see Fig. 1(f). Furthermore it also coincides with the frequency at which the density of states starts to show deviations from the Debye regime, see Extended Data Fig. 3(b), i.e., above this the nature of the vibrational modes is no longer acoustic and starts to become affected by the disorder of the structure. Therefore one concludes that this threshold does indeed reflect a relevant frequency for the plastic yielding of the sample.
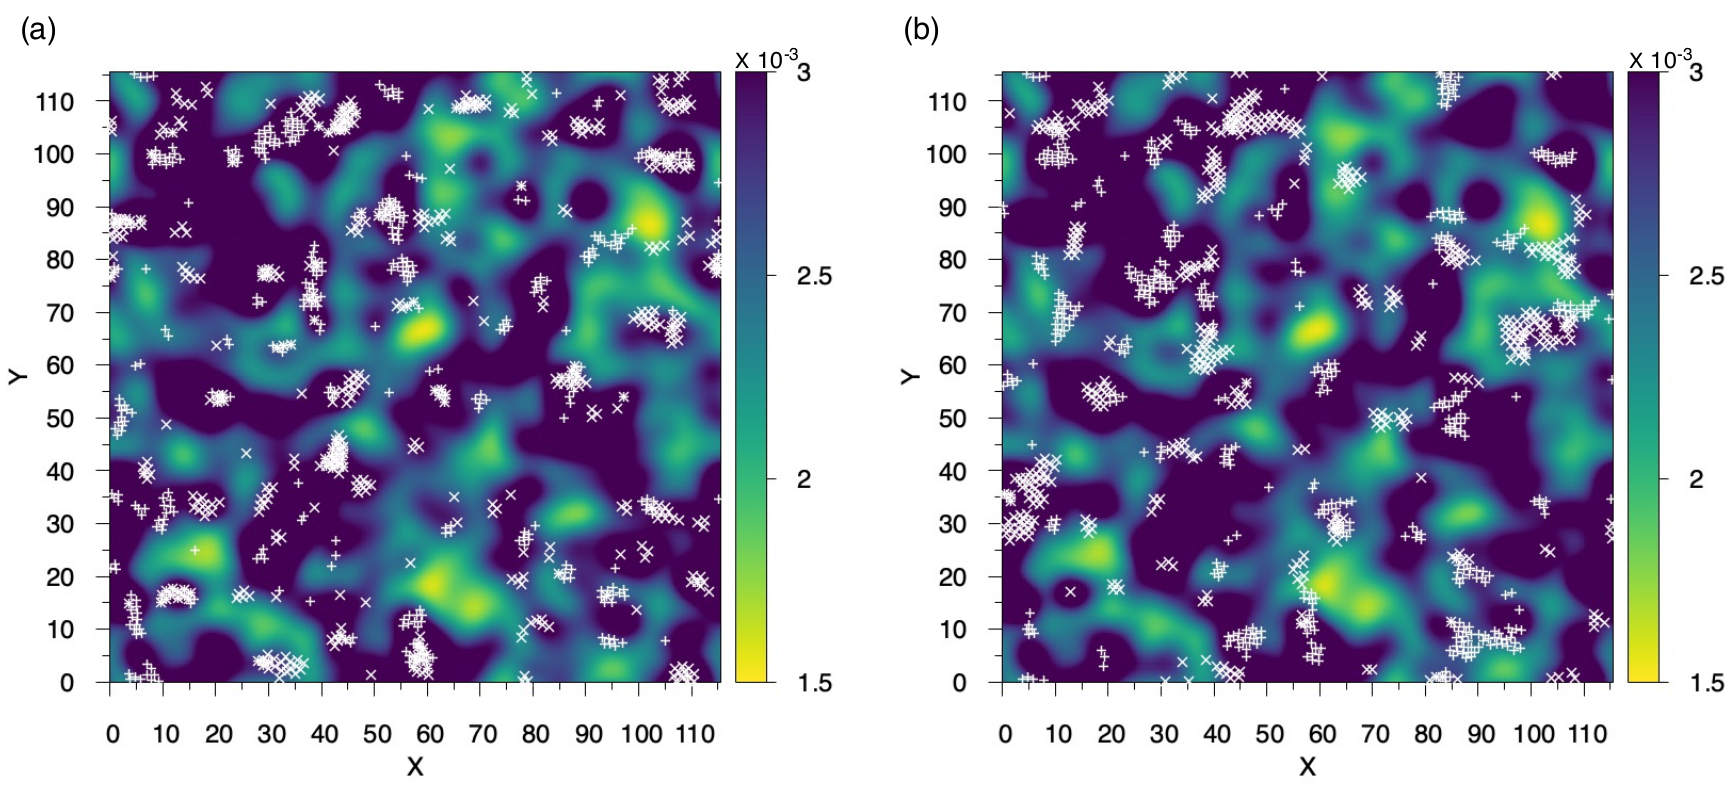
In order to have a visual impression of the correlation between the location of the TDs and the PEs we present in Fig. 3(e) the charge density field of these TDs (color map) as well as the location of the PEs (symbols). The graph demonstrates the strong correlation between zones with a high density of TDs and the PEs. (This strong correlation becomes even more visible if we just consider the TDs to generate the colormap, see Extended Data Fig. 8.) One also notices that basically all zones of high density do contain PEs, i.e., the negative TDs are indeed able to predict the location of the “soft spots”, the points at which the sample is yielding. Note that we have done the shearing in the and the direction and, as expected, the location of the corresponding plastic events (filled and open symbols) are not quite the same. However, both types of PEs do show a good correlation with the zones of strong negative charge, i.e., to a first approximation the tensorial character of the plastic response can be neglected. One also recognizes clearly the anti-correlation between the PE and the positive TDs (zones in red), showing that the former are forming “hard spots” in the samples that are stable under a shear transformation. This result is reasonable since the positive TDs correspond to the points of the vibrational excitations at which the vibrational amplitude goes smoothly to zero and hence it can be expected that the nearby particles will not be affected strongly by the external shear. This rational is consistent with earlier findings that particles with larger amplitude of the vibrational eigen-vector contribute more to the non-affine deformation and thus irreversible rearrangements Din14 ; Man11 .
Discussion: The identified correlations between the location of the topological defects and the plastic events indicate that these quantities are intimately related to each other. Zones of the sample which have a high density of defects with topological charge are stable towards shearing since in their vicinity the amplitude of the vibrational excitations are small or vary smoothly in space, i.e., the application of a local strain will not affect significantly these vibrational modes and thus will not give rise to a plastic event. This is also the case for the boundary between two neighboring regions of +1 TD with opposite chirality, since also then the flow field is a smooth function in space, see Fig. 1(e). For zones with a high density of TD with topological charge , the vector field of the eigen-modes will instead be strongly disturbed by the presence of a local strain, thus making it is highly probable for a plastic event to occur. Note that this connection between TD and PE can be expected to hold only if the local shear is indeed a smooth function in space, i.e., if the sample can locally be described as an elastic medium. This is only the case if the considered length scales are sufficiently large, which in turn rationalizes our finding that the correlation between PE and TD is pronounced if the distance between the TDs is larger than the lengths scale on which the system can support acoustic phonons, while for smaller scales the correlation is lost. Our results also shed light on the previous studies in which machine learning approaches have been used to predict the location of PE Bap20 ; Fon22 ; Sch17 ; Cub17 ; Fan21 ; Rid22 . Despite the success of these approaches, the understanding on the physical origin of these soft spots has so far not really been elucidated and our findings do now allow us to interpret these zones in terms of a simple physical quantity. Note that in contrast to previous studies, Refs. Mal04 ; Mal04a ; Bon19 ; Bag21 , we do not have to determine the normal modes as a function of the strain in order to predict the location of the PE. Instead this location is obtained directly from the normal modes at strain zero, i.e., it is a purely structural quantity in the unperturbed system. This feature should thus permit us to make headway with analytical calculations that aim to describe the yielding of amorphous systems and hence to obtain a better understanding of this important problem. Finally we mention that the approached presented here can be generalized in a straightforward manner to three dimensional systems and it will thus be highly interesting to determine for these cases the correlation between PE and TD.
Methods
MD simulation. The two-dimensional glass former we study
is an equimolar binary mixture of particles with size and that interact via a truncated Lennard-Jones potential:
| (1) |
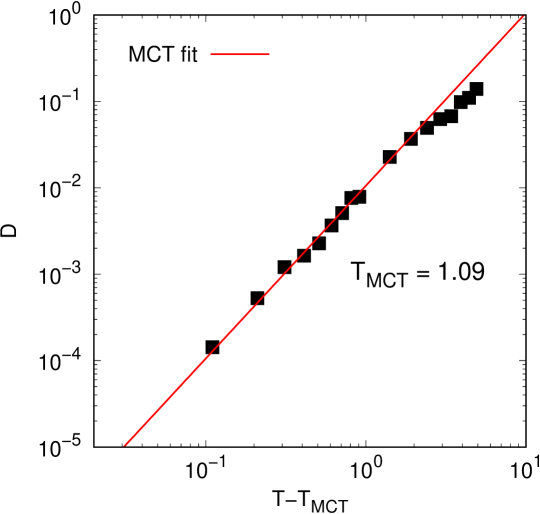
Here and the constant ensures that =0 at , so the potential is purely repulsive and continuous at the cutoff distance. The size ratio was set to 1.414 to prevent crystallization Ham06 ; Tan10 . A total of =10000 (or =1250) particles with the mass ratio were enclosed in a square box of length =115.47 (number density is 0.75) with periodic boundary conditions. The units of length, mass, and energy are , , and , respectively. Time and temperature are in units of and , with the Boltzmann constant. The time step of integration was 0.001. We first equilibrated the system in the liquid state at =5.0 during MD steps and then quenched it to the final temperature =0.1 within time steps using a linear cooling schedule, after which we annealed the sample for another MD steps. (=1.09 for our system, see Extended Data Fig. 6.)
Normal modes. The zero-temperature glass was generated by a conjugate gradient energy minimization process, and the vibrational normal modes were obtained by diagonalizing the full dynamical matrix.
Topological defects. To identify the topological defects of an eigenvector field , , we first assigned an angle on every site of a 100100 square lattice superposed to the sample. (We have checked that a 120120 grid does not change the main conclusions presented in the main text.) This angle is defined to be
| (2) |
where is the location of particle , and is a weight function (in practice a Gaussian Oya19 ; Gol05 : ). Hence this procedure allows to define a map from the eigenvector field, given at the positions of the particles, to a regular grid. The topological defects were then identified by integrating over a closed path on the lattice, and located by taking the position of the center of the smallest square with a value of () of this integral, defining thus charges of +1 and respectively.
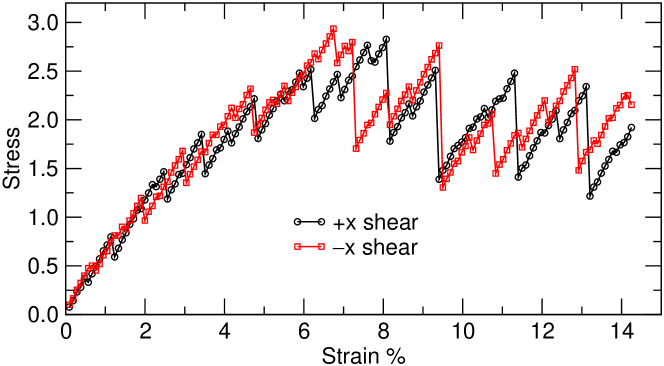
Plastic events. The athermal and quasistatic shear was realized by shearing the simulation box by a small strain increment and subsequently minimizing the energy of the configuration with a conjugate gradient algorithm. This procedure was repeated until the global strain reached %, using %, (and 5%, using %), the strain at which the data in Fig. 3 is shown. The resulting stress-strain curve is presented in Extended Data Fig. 5 for the strain in the and the direction. This figure also demonstrates that if the strain exceeds 7-8%, the average strain does not grow anymore, i.e., that the sample has yielded.
The locally irreversible rearrangements of particles in the glass are evaluated by the non-affine displacement introduced in Ref. Fal98 and which is defined as the minimum of
| (3) |
where the index runs over all the particles that are nearest neighbors of particle (thus the distance is less than 1.6, the first minimum
of the total pair correlation function), denotes the position of particle after the minimization of the box that is sheared by , and is the number of nearest neighbors of particle . The matrix is chosen such that it minimizes and it can be calculated based on the spatial coordinates of the corresponding particles Fal98 .
Correlation function between the TDs and and the PEs. For each eigenmode , we define the radial pair correlation function between the TDs and PEs, with , as
| (4) |
Here and are the number of TD of the mode and the number of PEs, respectively, and is the distance between the TD and the PE .
The average correlation function is then given by
| (5) |
where the sum over runs up to the cut-off frequency defined in the main text.
Acknowledgments
We thank M.Z. Li, P.F. Guan, and the other members of the “Beijing Metallic Glass Club”
for the long-term fruitful discussions. W.K. is senior member of the Institut universitaire de France. This work was supported by the National Natural
Science Foundation of China (Grant Nos. 11804027, 11935002, and 52031016).
Author contributions: ZWW, WK, and LX designed the project with advice from WHW. ZWW carried out the simulations, and YC assisted in the identification and analysis of the TDs. ZWW, WK, LX, and WHW analyzed the data. ZWW, WK, and LX wrote the paper.
References
- (1) Debenedetti, P. G. & Stillinger, F. H. Supercooled liquids and the glass transition. Nature 410, 259–267 (2001).
- (2) Binder, K. & Kob, W. Glassy Materials and Disordered Solids: Introduction to Their Statistical Mechanics (World Scientific, Singapore, 2011).
- (3) Varshneya, A. K. & Mauro, J. C. Fundamentals of Inorganic Glasses (Elsevier Science, 2019).
- (4) Wang, W. H. Dynamic relaxations and relaxation-property relationships in metallic glasses. Prog. Mater. Sci. 106, 100561 (2019).
- (5) Phillips, W. A. Two-level states in glasses. Rep. Prog. Phys. 50, 1657–1708 (1987).
- (6) Ramos, M. A. Low-Temperature Thermal and Vibrational Properties of Disordered Solids (World Scientific, 2022).
- (7) Dyre, J. C. The glass transition and elastic models of glass-forming liquids. Rev. Mod. Phys. 78, 953–972 (2006).
- (8) Kittel, C. Introduction to Solid State Physics 7th edition (John Wiley & Sons, New York, 1996).
- (9) Falk, M. L. & Langer, J. S. Dynamics of viscoplastic deformation in amorphous solids. Phys. Rev. E 57, 7192–7205 (1998).
- (10) Peng, H. L., Li, M. Z. & Wang, W. H. Structural signature of plastic deformation in metallic glasses. Phys. Rev. Lett. 106, 135503 (2011).
- (11) Manning, M. L. & Liu, A. J. Vibrational modes identify soft spots in a sheared disordered packing. Phys. Rev. Lett. 107, 108302 (2011).
- (12) Ding, J., Patinet, S., Falk, M. L., Cheng, Y. & Ma, E. Soft spots and their structural signature in a metallic glass. Proc. Natl. Acad. Sci. 111, 14052–14056 (2014).
- (13) Patinet, S., Vandembroucq, D. & Falk, M. L. Connecting local yield stresses with plastic activity in amorphous solids. Phys. Rev. Lett. 117, 045501 (2016).
- (14) Yang, X., Liu, R., Yang, M., Wang, W.-H. & Chen, K. Structures of local rearrangements in soft colloidal glasses. Phys. Rev. Lett. 116, 238003 (2016).
- (15) Richard, D. et al. Predicting plasticity in disordered solids from structural indicators. Phys. Rev. Materials 4, 113609 (2020).
- (16) Ridout, S. A., Rocks, J. W. & Liu, A. J. Correlation of plastic events with local structure in jammed packings across spatial dimensions. Proc. Natl. Acad. Sci. 119, e2119006119 (2022).
- (17) Chen, K. et al. Measurement of correlations between low-frequency vibrational modes and particle rearrangements in quasi-two-dimensional colloidal glasses. Phys. Rev. Lett. 107, 108301 (2011).
- (18) Cao, Y. et al. Structural and topological nature of plasticity in sheared granular materials. Nat. Commun. 9, 2911 (2018).
- (19) Nicolas, A., Ferrero, E. E., Martens, K. & Barrat, J.-L. Deformation and flow of amorphous solids: Insights from elastoplastic models. Rev. Mod. Phys. 90, 045006 (2018).
- (20) Malandro, D. L. & Lacks, D. J. Molecular-level mechanical instabilities and enhanced self-diffusion in flowing liquids. Phys. Rev. Lett. 81, 5576–5579 (1998).
- (21) Mitra, S., Marín-Aguilar, S., Sastry, S., Smallenburg, F. & Foffi, G. Correlation between plastic rearrangements and local structure in a cyclically driven glass. J. Chem. Phys. 156, 074503 (2022).
- (22) Lerner, E. & Bouchbinder, E. Low-energy quasilocalized excitations in structural glasses. J. Chem. Phys. 155, 200901 (2021).
- (23) Mazzacurati, V., Ruocco, G. & Sampoli, M. Low-frequency atomic motion in a model glass. Europhys. Lett. 34, 681–686 (1996).
- (24) Schober, H. R. & Ruocco, G. Size effects and quasilocalized vibrations. Philos. Mag. 84, 1361–1372 (2004).
- (25) Maloney, C. & Lemaître, A. Subextensive scaling in the athermal, quasistatic limit of amorphous matter in plastic shear flow. Phys. Rev. Lett. 93, 016001 (2004).
- (26) Maloney, C. & Lemaître, A. Universal breakdown of elasticity at the onset of material failure. Phys. Rev. Lett. 93, 195501 (2004).
- (27) Brito, C. & Wyart, M. Heterogeneous dynamics, marginal stability and soft modes in hard sphere glasses. J. Stat. Mech. 2007, L08003 (2007).
- (28) Widmer-Cooper, A., Perry, H., Harrowell, P. & Reichman, D. R. Irreversible reorganization in a supercooled liquid originates from localized soft modes. Nat. Phys. 4, 711–715 (2008).
- (29) Xu, N., Vitelli, V., Liu, A. J. & Nagel, S. R. Anharmonic and quasi-localized vibrations in jammed solids—modes for mechanical failure. Europhys. Lett. 90, 56001 (2010).
- (30) Tanguy, A., Mantisi, B. & Tsamados, M. Vibrational modes as a predictor for plasticity in a model glass. Europhys. Lett. 90, 16004 (2010).
- (31) Rottler, J., Schoenholz, S. S. & Liu, A. J. Predicting plasticity with soft vibrational modes: From dislocations to glasses. Phys. Rev. E 89, 042304 (2014).
- (32) Gartner, L. & Lerner, E. Nonlinear plastic modes in disordered solids. Phys. Rev. E 93, 011001 (2016).
- (33) Bonfanti, S., Guerra, R., Mondal, C., Procaccia, I. & Zapperi, S. Elementary plastic events in amorphous silica. Phys. Rev. E 100, 060602 (2019).
- (34) Baggioli, M., Kriuchevskyi, I., Sirk, T. W. & Zaccone, A. Plasticity in amorphous solids is mediated by topological defects in the displacement field. Phys. Rev. Lett. 127, 015501 (2021).
- (35) Font-Clos, F. et al. Predicting the failure of two-dimensional silica glasses. Nat. Commun. 13, 2820 (2022).
- (36) Schoenholz, S. S., Cubuk, E. D., Kaxiras, E. & Liu, A. J. Relationship between local structure and relaxation in out-of-equilibrium glassy systems. Proc. Natl. Acad. Sci. 114, 263–267 (2017).
- (37) Cubuk, E. D. et al. Structure-property relationships from universal signatures of plasticity in disordered solids. Science 358, 1033–1037 (2017).
- (38) Fan, Z. & Ma, E. Predicting orientation-dependent plastic susceptibility from static structure in amorphous solids via deep learning. Nat. Commun. 12, 1506 (2021).
- (39) Bapst, V. et al. Unveiling the predictive power of static structure in glassy systems. Nat. Phys. 16, 448–454 (2020).
- (40) Hamanaka, T. & Onuki, A. Transitions among crystal, glass, and liquid in a binary mixture with changing particle-size ratio and temperature. Phys. Rev. E 74, 011506 (2006).
- (41) Tanaka, H., Kawasaki, T., Shintani, H. & Watanabe, K. Critical-like behaviour of glass-forming liquids. Nat. Mater. 9, 324–331 (2010).
- (42) Oyama, N., Mizuno, H. & Saitoh, K. Avalanche interpretation of the power-law energy spectrum in three-dimensional dense granular flow. Phys. Rev. Lett. 122, 188004 (2019).
- (43) Goldenberg, C. & Goldhirsch, I. Friction enhances elasticity in granular solids. Nature 435, 188–191 (2005).