The zero-adjusted log-symmetric quantile regression model applied to extramarital affairs data
Abstract. In this work, we propose a zero-adjusted log-symmetric quantile regression model. Initially, we introduce zero-adjusted log-symmetric distributions, which allow for the accommodation of zeros. The estimation of the parameters is approached by the maximum likelihood method and a Monte Carlo simulation is performed to evaluate the estimates. Finally, we illustrate the proposed methodology with the use of a real extramarital affairs data set.
Keywords: Zero-adjusted log-symmetric distributions; Quantile regression; Extramarital affairs data.
1 Introduction
The classical log-symmetric distributions (LS) are a generalization of the log-normal distribution and are particularly flexible in providing models with positive asymmetry and that have lighter/heavier tails than those of the log-normal distribution (Vanegas and Paula,, 2016). Regression models based on LS distributions were recently studied by Vanegas and Paula, (2015, 2017), Medeiros and Ferrari, (2017), in which problems such as semi-parametric approach, presence of censored data, or hypothesis tests, are investigated.
Recently, Saulo et al., (2021) proposed a reparametrization of the LS distributions, here denoted by quantile-LS distributions. The authors’ idea was to insert a quantile parameter in the LS distributions and thus obtain the quantile-LS distributions. Then, based on these distributions, the authors proposed parametric quantile-LS quantile regression models. Parametric quantile regression models (Gilchrist,, 2000) are an alternative to semi-parametric models (distribution-free) (Koenker and Bassett Jr,, 1978), and to models based on pseudo-likelihood using the asymmetric Laplace distribution or a mixture distribution. Based on quantile-LS distributions, Cunha et al., (2021) proposed a quantile tobit model useful for modeling left censored data.
A limitation of the LS (Vanegas and Paula,, 2015) and quantile-LS (Saulo et al.,, 2021) distributions, and consequently of their respective regression models, is the impossibility of modeling (without the need for any type of transformation) data sets that contain zeros, since such distributions have positive support. In this sense, a strategy to circumvent such a problem is to consider a mixture of a continuous distribution with support with a degenerate distribution with mass at zero; see, for example, Aitchison and Brown, (1957) for the case of the log-normal distribution, Heller et al., (2006) for the inverse Gaussian distribution, Leiva et al., (2016) and Tomazella et al., (2019) for Birnbaum-Saunders distributions, and most recently Cosavalente and Cysneiros, (2021); Cosavalente, (2021) for LS distributions. The mixture of two components, distribution with support and a degenerate distribution with zero value, can be called “zero adjusted” as in Heller et al., (2006), and it is similar to the Cragg, (1971) approach.
In this context, the primary objective of this work is to propose a class of zero-adjusted log-symmetric quantile regression models. To this end, initially zero-adjusted quantile-LS distributions are proposed, which are denoted by quantile-ZALS distributions. Then, we propose the quantile-ZALS regression models. The immediate advantage of the proposed methodology lies in the flexibility of the quantile approach, which allows considering the effects of explanatory variables over the spectrum of the dependent variable, in addition to the possibility of including zero, which is not possible in the quantile regression models studied by Saulo et al., (2021). The quantile-ZALS regression models, proposed in this work, generalize for a quantile context, the works of Aitchison and Brown, (1957), Cosavalente and Cysneiros, (2021); Cosavalente, (2021) and Leiva et al., (2016). Secondary objectives include: (i) to obtain the estimates of the model parameters of using the maximum likelihood method; (ii) to carry out a Monte Carlo simulation to assess the performance of the maximum likelihood estimates; and (iii) to illustrate the proposed methodology using a real data set on extramarital affairs.
The rest of this work proceeds as follows. In Section 2, the quantile-LS distributions introduced by Saulo et al., (2021) are briefly discussed, then the quantile-ZALS distributions are introduced. In Section 3, the proposed quantile-ZALS regression model is presented. In Section 4, a Monte Carlo simulation is carried out to assess the performance of the maximum likelihood estimates. In Section 5, an application to real data is performed. Finally, in Section 6 presents the final conclusions.
2 Quantile-LS and quantile-ZALS distributions
In this section, the quantile-LS distributions introduced by Saulo et al., (2021) are initially described. Then, a zero-adjusted version of these distributions, denoted by quantile-ZALS, are proposed.
2.1 Quantile-LS distributions
A random variable follows a quantile-LS distribution if its probability density function (PDF) and cumulative distribution function (CDF) are given, respectively, by
| (1) |
and
| (2) |
where is a scale parameter and also the quantile of the distribution, is a power parameter, is a density generator, which may involve an extra parameter , and with , with being a normalizing constant.
Saulo et al., (2021) have shown that if , then the following properties hold: (P1) , with ; (P2) , with ; and (P3) the quantile function is given by . The properties (P1) and (P2) imply that , where .
The log-normal, Log-Student-, log-power-exponential and extended Birnbaum-Saunders distributions are obtained as particular cases for :
-
•
Log-normal(): ;
-
•
Log-Student-(): , ;
-
•
Log-power-exponential(): , ;
-
•
Extended Birnbaum-Saunders(): , .
2.2 Quantile-ZALS distributions
Consider a random variable with PDF and CDF given by and , respectively. We propose a quantile-LS distribution that accommodates the zeros, denoted by quantile-ZALS, by using a mixture approach given by
| or | |||||
| (3) |
where is a weight that determines the contribution of zeros, is the PDF of a random variable , and is an indicator function, that is,
3 Quantile-ZALS regression model
Based on the zero-adjusted quantile log-symmetric distributions proposed in Subsection 2.2, we propose the respective regression model. Consider an independent random sample with , for , such that
with
where , and are vectors of unknown parameters to be estimated, , and are the values of , and explanatory variable associated with the quantile , relative dispersion and probability of drawing a zero , respectively. Note that is the logistic function.
The estimation of the parameters of the quantile-ZALS regression model presented in (3) is performed using the maximum likelihood method. Let be an independent random sample such that , and be the corresponding observed values. Then, the likelihood function for can be written as
Taking the logarithm in 3, we obtain the log-likelihood function
Note that in 3, is factored in two terms (Pace and Salvan,, 1997), one that is associated with the probability of occurrence of zero, , and another that is associated with a continuous and positive part, . Therefore, the maximum likelihood estimates can be obtained independently for and , that is, the maximization is performed separately for and . Nevertheless, as there is no analytical solution, an iterative procedure can be used for non-linear optimization, in particular the Broyden-Fletcher-Goldfarb-Shanno (BFGS) method is used in this work.
The quantile-ZALS regression model proposed above can be interpreted as being divided into two equations:
-
•
Participation equation
(7) where if the individual participates and otherwise.,
-
•
Intensity equation
(8) where is the quantile o given that .
4 Monte Carlo simulation
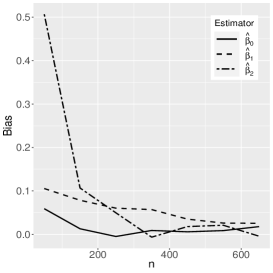
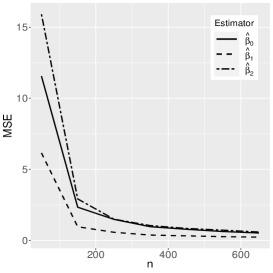
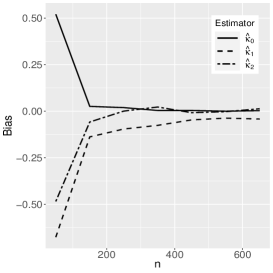
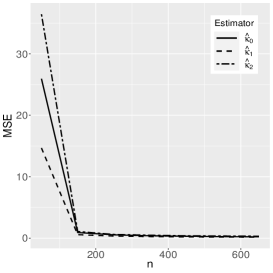
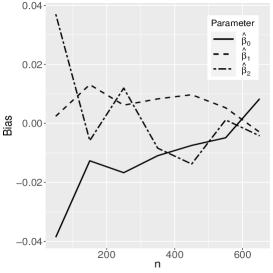
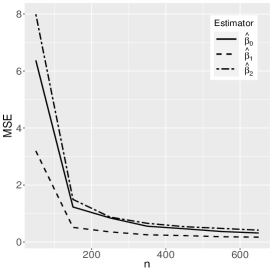
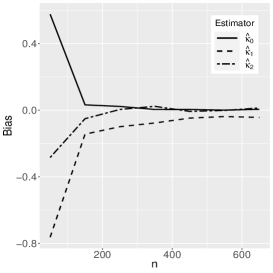
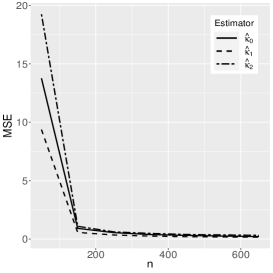
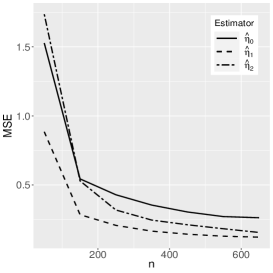
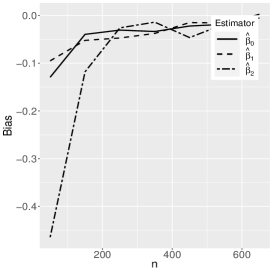
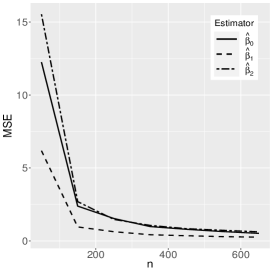
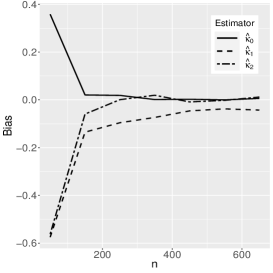
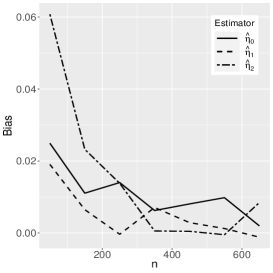
A Monte Carlo simulation study is carried out to evaluate the performance of the maximum likelihood estimates of the quantile-ZALS regression model. The performance is assessed using bias and mean square error (MSE) estimates, given by
where and denote the true parameter value and its respective -th maximum likelihood estimate, respectively, and NREP is the number of Monte Carlo replicas. We use the R software has been used to do all numerical calculations; see R Core Team, (2020). The model used to generate the samples is given by
where the reference distribution is log-normal (the results of the log-Student-, log-power-exponential and extended Birnbaum-Saunders are similar and are therefore omitted here). The simulation has the following setting: , , , with Monte Carlo replicas.The explanatory variables , and are generated from the Uniform(0,1) distribution. Figures 1-3 show the Monte Carlo simulation results for . An analysis of the results allows us to conclude that, in general, as the sample size increases, the bias and MSE decrease, as expected.


5 Application to extramarital affairs data
In this subsection, the quantile-ZALS regression models are illustrated using data from extramarital affairs. The database is available at Fair, (1978) and the objective here is to study the allocation of time in extramarital affairs for men and women married for the first time. There are 6,366 observations in the database, where the dependent variable () is the time spent in extramarital affairs, and the explanatory variables are
-
•
ratemarr: rating of the marriage, coded 1 to 4;
-
•
age: age, in years;
-
•
yrsmarr: number of years married;
-
•
numkids: number of children;
-
•
relig: religiosity, code 1 to 4, 1 = not, 4 = very;
-
•
educ: education, coded 9, 12, 14, 16, 17, 20, that is, 9 = elementary school, 12 = high school, . . . , 20 = doctorate or other;
-
•
wifeocc: wife’s occupation - Hollingshead scale;
-
•
husocc: husband’s occupation - Hollingshead scale.
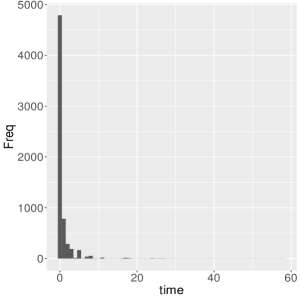
Descriptive statistics for the time spent in extramarital affairs () indicate that the mean, median and standard deviation are given by 0.705, 0 and 2.203, respectively. The coefficient of variation is 312.37%, indicating a high dispersion of data around the mean. The coefficients of skewness and kurtosis are equal to 8.761 and 131.912, respectively, which shows the presence of a high positive skewness and the presence of heavy tails. Then, the hypothesis of the use of log-symmetric distributions is plausible. Note that the asymmetric nature of the data is confirmed by the histogram shown in Figure 4(a). Note also a high concentration of zero values in the sample, about 4,313 individuals have 0 time spent in extramarital affairs.
The proposed quantile-ZALS regression models can accommodate heteroscedasticity, then specifications with and without explanatory variables in the relative dispersion can be fitted. We consider here quantile-ZALS regression models based on the log-normal (quantile-ZALNO), log-Student- (quantile-ZAL), log-power-exponential (quantile-ZALPE) and extended Birnbaum-Saunders (quantile-ZAEBS) distributions. An analysis of the significance of the coefficients suggested the following specification:
Table 1 reports the results of the averages of the AIC and BIC values based on for the proposed quantile-ZALS regression models. The results indicate that the lowest values of AIC and BIC are those based on the quantile-ZALPE and quantile-ZAEBS models, with a slight advantage of the latter.
| Model | ||||
|---|---|---|---|---|
| Criterion | quantile-ZALNO | quantile-ZAL | quantile-ZALPE | quantile-ZAEBS |
| AIC | 13165.14 | 13173.48 | 13163.49 | 13163.41 |
| BIC | 13259.77 | 13268.10 | 13258.12 | 13258.03 |
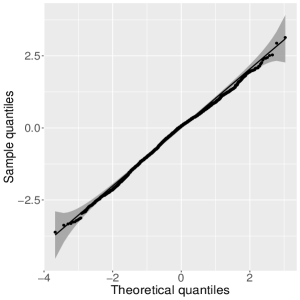
Since the results of the quantile-ZAEBS model showed the best results, we can compare them with the results of the zero-adjusted gamma (ZAGA) and zero-adjusted inverse Gaussian (ZAIG) regression models, studied by Heller et al., (2006) and Stasinopoulos et al., (2017). Table reports the results of AIC and BIC for these models, and we observe that the quantile-ZAEBS model has the best fit. The QQ plot for the randomized quantile residuals (Dunn and Smyth,, 1996) of this model for is shown in Figure 4(b); similar plots are obtained for other values of . The results then indicate that the proposed model present adjustments that are superior to existing models in the literature.
| Model | ||||
|---|---|---|---|---|
| quantile-ZAEBS | ZAGA | ZAIG | ||
| () | ||||
| AIC | 13163.18 | 13466.62 | 13953.84 | |
| BIC | 13257.80 | 13580.48 | 14067.71 | |
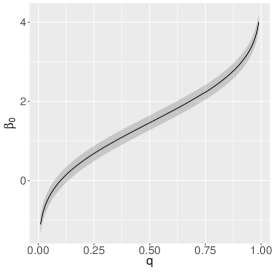
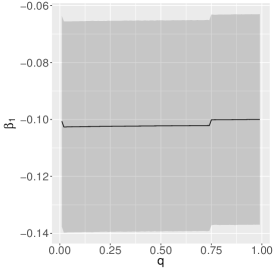
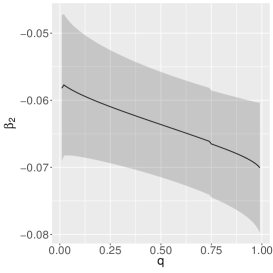
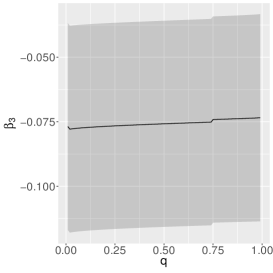
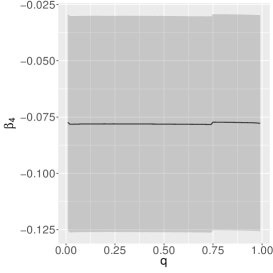
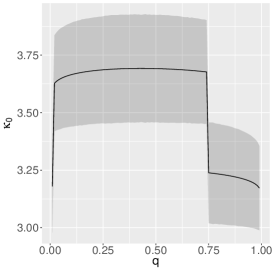
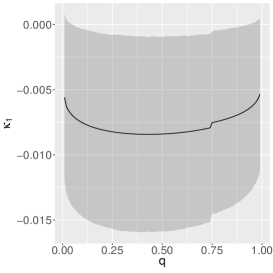
The estimates of the parameters of the quantile-ZAEBS model for (discrete component) are shown in Table 3, and those for and in Figure 5. The figure shows asymmetric dynamics. For example, the estimates of () tend to increase (decrease) with the increase of . In general, such results show the importance of considering a quantile approach.
| Interc. | ratemarr | age | yrsmarr | relig | educ | wifeocc | |
| Estimate | 3.7371* | -0.7153* | -0.0602* | 0.1095* | -0.3760* | -0.0380* | 0.1628* |
| Standard error | (0.2961) | (0.0314) | (0.0103) | (0.0097) | (0.0346) | (0.0153) | (0.0337) |
| * significant at 5% level. ** significant at 10% level. | |||||||
6 Concluding remarks
In this work, a class of zero-adjusted log-symmetric quantile regression models was proposed. The proposed regression model is based on a zero-adjusted version of the log-symmetric distributions parameterized by the quantile, also proposed in this work. The quantile proposal provides wide flexibility in the analysis of the effects of the explanatory variables on the dependent variable, which makes the proposed model a more interesting alternative than the existing zero-adjusted log-symmetric regression models (Cosavalente and Cysneiros,, 2021; Cosavalente,, 2021). The estimation of the parameters was performed by the maximum likelihood method and a Monte Carlo simulation study was carried out to evaluate the performance of the maximum likelihood estimates. An application of the proposed models is used to study the allocation of time in extramarital affairs of men and women married for the first time. The results showed that the proposed zero-adjusted log-symmetric quantile regression models perform better than the existing zero-adjusted gamma (ZAGA) and zero-adjusted inverse Gaussian (ZAIG) regression models studied by Heller et al., (2006) and Stasinopoulos et al., (2017).
References
- Aitchison and Brown, (1957) Aitchison, J. and Brown, J. A. C. (1957). The Lognormal Distribution with Special Reference to its Uses in Econometrics. University of Cambridge Department of Applied Economics Monograph: 5. Cambridge University Press, 1st edition.
- Cosavalente, (2021) Cosavalente, D. R. R. (2021). Distribução zero ajustada log-simétrica: estimação e modelagem. Dissertação de mestrado, Universidade Federal de Pernambuco, Programa de Pós-Graduação em Estatística do Centro de Ciências Exatas e da Natureza, Brasil.
- Cosavalente and Cysneiros, (2021) Cosavalente, D. R. R. and Cysneiros, F. (2021). The zero-adjusted log-symmetric distributions: point and intervalar estimation. Annals of the Brazilian Academy of Sciences.
- Cragg, (1971) Cragg, J. G. (1971). Some statistical models for limited dependent variables with application to the demand for durable goods. Econometrica, 39:829–844.
- Cunha et al., (2021) Cunha, D. R., Divino, J. A., and Saulo, H. (2021). On a log-symmetric quantile tobit model applied to female labor supply data. arXiv:2103.04449.
- Dunn and Smyth, (1996) Dunn, P. K. and Smyth, G. K. (1996). Randomized quantile residuals. Journal of Computational and Graphical Statistics, 5.
- Fair, (1978) Fair, R. (1978). A theory of extramarital affairs. Journal of Political Economy, 86:45–61.
- Gilchrist, (2000) Gilchrist, W. (2000). Statistical Modelling with Quantile Functions. Chapman & Hall/CRC, Boca Raton, FL, 1st edition.
- Heller et al., (2006) Heller, G., Stasinopoulos, M., and Rigby, B. (2006). The zero-adjusted inverse gaussian distribution as a model for insurance claims. In J. Hinde, J. E. and Newell, J., editors, Proceedings of the 21th International Workshop on Statistical Modelling, pages 226–233, Galway, Ireland. Statistical Modelling Society, University of Lancaster.
- Koenker and Bassett Jr, (1978) Koenker, R. and Bassett Jr, G. (1978). Regression quantiles. Econometrica, 46:33–50.
- Leiva et al., (2016) Leiva, V., Santos-Neto, M., Cysneiros, F. J. A., and Barros, M. (2016). A methodology for stochastic inventory models based on a zero-adjusted birnbaum-saunders distribution. Applied Stochastic Models in Business and Industry, 32(1):74–89.
- Medeiros and Ferrari, (2017) Medeiros, M. C. and Ferrari, S. L. P. (2017). Small-sample testing inference in symmetric and log-symmetric linear regression models. Statistica Neerlandica, 71:200–224.
- Pace and Salvan, (1997) Pace, L. and Salvan, A. (1997). Principles of Statistical Inference from a Neo-Fisherian Perspective. Advanced Series on Statistical Science & Applied Probability: Volume 4. World scientific, 1st edition.
- R Core Team, (2020) R Core Team (2020). R: A Language and Environment for Statistical Computing. R Foundation for Statistical Computing, Vienna, Austria.
- Saulo et al., (2021) Saulo, H., Dasilva, A., Leiva, V., Sánchez, L., and Fuente-Mella, H. L. (2021). Log-symmetric quantile regression models. Statistica Neerlandica, pages 1–26.
- Stasinopoulos et al., (2017) Stasinopoulos, M. D., Rigby, R. A., Heller, G. Z., Voudouris, V., and Bastiani, F. D. (2017). Flexible regression and smoothing : using GAMLSS in R. Chapman & Hall/CRC the R series (CRC Press). Chapman and Hall/CRC, 1 edition.
- Tomazella et al., (2019) Tomazella, V., Pereira, G. H. A., Nobre, J. S., and Santos-Neto, M. (2019). Zero-adjusted reparameterized birnbaum-saunders regression model. Statistics & Probability Letters, 149:142–145.
- Vanegas and Paula, (2015) Vanegas, L. H. and Paula, G. A. (2015). A semiparametric approach for joint modeling of median and skewness. Test, 24:110–135.
- Vanegas and Paula, (2016) Vanegas, L. H. and Paula, G. A. (2016). Log-symmetric distributions: statistical properties and parameter estimation. Brazilian Journal of Probability and Statistics, 30:196–220.
- Vanegas and Paula, (2017) Vanegas, L. H. and Paula, G. A. (2017). Log-symmetric regression models under the presence of non-informative left- or right-censored observations. Test, 26:405–428.