The Spin of New Black Hole Candidate: MAXI J1803-298 Observed by NuSTAR and NICER
1Key Laboratory for Computational Astrophysics, National Astronomical Observatories, Chinese Academy of Sciences,
Datun Road A20, Beijing 100012, China
2School of Astronomy and Space Sciences, University of Chinese Academy of Sciences, Datun Road A20, Beijing 100049, China
Abstract
MAXI J1803-298, a newly-discovered Galactic transient, and black hole candidate was first detected by MAXI/GSC on May 1st, 2021. In this paper, we present a detailed spectral analysis of MAXI J1803-298. Utilizing the X-ray reflection fitting method, we perform a joint fit to the spectra of MAXI J1803-298, respectively, observed by NuSTAR and NICER/XTI on the same day over the energy range between 0.7-79.0 keV in SIMS state, and the observed inner radius of the accretion disk is demonstrated to have extended to the ISCO radius (1.08 ). Implementing the relativistic reflection model relxillCp, we found its spin (and the inclination angle ) can be constrained to be close to an extreme value, 0.991 ( ), at 68% confidence interval. The results suggest that MAXI J1803-298 may be a fast-rotating black hole with a large inclination angle.
keywords:
NuSTAR, NICER, black hole physics, X-rays: binaries - stars: individual: MAXI J1803-2981 Introduction
Black holes (BHs) are the simplest objects in the universe, according to the theory of general relativity (GR). Mass, and angular momentum (also known as spin) can completely characterize an astrophysical black hole. Among the two parameters, spin is crucial for understanding black hole physics and jet power (Narayan & McClintock 2012). It is usually defined as mathematically, where is the angular momentum of the black hole, is the speed of light, is the black hole mass and is the gravitational constant. The dimensionless spin lies in a range from -1 to 1. For a Schwarzschild black hole, its spin is 0, while for a Kerr black hole, its spin is 1 ( here only means that a black hole is prograde or retrograde).
The X-ray reflection fitting method (also called as fitting method) is widely used in estimating the spin of black hole in X-ray binary (e.g., Miller et al. 2013; Draghis et al. 2020; Feng et al. 2021), which by means of modeling the relativistic reflection component in a spectrum (see Fabian et al. 1989 for details).
Generally, an outbursting black hole X-ray binary (BHXRB) usually presents four spectral states in turn, low hard state (LHS), hard intermediate state (HIMS), soft intermediate state (SIMS, also named as steep power-law (SPL)), and high soft state (HSS, also called as thermal dominant (TD)), as the q-like X-ray hardness-intensity diagram (HID) shows (see McClintock et al. 2006 for details). Typically, the photon index of a spectrum is 1.4-1.6 for LHS, 1.6-2.5 for HIMS/SIMS and 2.5-4.0 for HSS (Belloni et al. 2006).
MAXI J1803-298 is a new X-ray binary system hosting a black-hole candidate which was detected in outburst by the Gas Slit Camera of the Monitor of All-sky X-ray Image (MAXI/GSC) nova alert system at 19:50 UT on May 1st, 2021, which locates at R.A.=, Dec= (J2000) (Serino et al. 2021). On May 4th (MJD 59338.9), MAXI J1803-298 was observed for 15 minutes on-target at a central frequency of 1.284 GHz (L band) with a total bandwidth of 860 MHz by Meer Karoo Array Telescope (MeerKAT) (Espinasse et al. 2021). Later, other telescopes such as the Neutron star Interior Composition Explorer (NICER) (Gendreau et al. 2021; Bult et al. 2021), Neil Gehrels Swift Observatory (Swift) (Gropp et al. 2021), Multicolor Imaging Telescopes for Survey and Monstrous Explosions (MITSuME) (Hosokawa et al. 2021), the Southern African Large Telescope (SALT) (Buckley et al. 2021), International Gamma-Ray Astrophysics Laboratory (INTEGRAL) (Chenevez et al. 2021), Nuclear Spectroscopic Telescope Array (NuSTAR) (Xu & Harrison 2021), the Hard X-ray Modulation Telescope (HXMT) (Wang et al. 2021) and Astronomy Satellite (AstroSAT) (Jana et al. 2021) conducted follow-up observations at multiple energy bands. The transition of X-ray spectral states was observed in the following months after discovery (Steiner et al. 2021; Shidatsu et al. 2021). Swift (Miller & Reynolds 2021), NuSTAR (Xu & Harrison 2021) and NICER (Homan et al. 2021) observed strong periodic X-ray absorption dips in MAXI J1803-298, which demonstrate that MAXI J1803-298 has a large viewing angle within . In addition, NICER (Ubach et al. 2021), AstroSat (Chand et al. 2021) and HXMT (Wang et al. 2021) have detected quasi-periodic oscillations (QPOs), respectively.
Based on the X-ray reflection fitting method, we jointly fit the spectra of MAXI J1803-298 observed by NuSTAR and NICER/XTI on the same day over the energy range of 0.7-79.0 keV. Based on the reflection features of the new black hole candidate MAXI J1803-298, we constrain its spin and inclination angle.
The paper is organized as follows. We introduce the observations and data reduction about NuSTAR and NICER/XTI in Section 2. Then, we demonstrate the spectral analysis in detail in Section 3. In Section 4 and Section 5, we present the discussions and conclusions, respectively.


2 OBSERVATIONS AND DATA REDUCTION
The outburst of the new X-ray transient MAXI J1803-298, NuSTAR and the X-ray Timing Instrument payload on the NICER (NICER/XTI) were both observed on May 23rd, 2021. The observation data is marked with a red dashed line in the light curves of this source shown in Figure 1. During this outburst of MAXI J1803-298, its net light curve in Figure 1 shows obvious variabilities, which may indicate that the system has a high inclination (Frank et al. 1987). In order to explore the reflection features of MAXI J1803-298, the data from NuSTAR (Harrison et al. 2013) and NICER/XTI (Gendreau et al. 2012) are both utilized. The advantage of joint fit to the data of these two detectors lies in that the hydrogen column density () can be well constrained with the low energy observation from NICER/XTI, and the reflection composition can be better fitted with the broad energy band of NuSTAR. It is noted that neither observation was affected by the pile-up effect.
In general, there should be no dips, flares, or other obvious fluctuations in the spectra used to measure the spin during this period. As a result, we utilize the commands ftselect111https://heasarc.gsfc.nasa.gov/lheasoft/ftools/headas/ftselect.html and ftdelrow222https://heasarc.gsfc.nasa.gov/lheasoft/ftools/headas/ftdelrow.html to remove the dip time from NuSTAR and NICER/XTI event data. The detailed observational information of spectra is listed in Table 1. In the process of spectral fitting, the XSPEC v12.11.1 (Arnaud 1996) software package is implemented with statistics. Using command grppha, all the data are grouped to achieve at least 30 photons per energy bin. Moreover, we also ignore all bad channels for all the spectra. Considering the cross-calibration between NuSTAR/(FPMA|FPMB) and NICER/XTI, we also make the Crab correction in XSPEC using the multiplicative model crabcor for NuSTAR and NICER/XTI (see Steiner et al. 2010 for details).
2.1 NuSTAR OBSERVATION
MAXI J1803-298 was observed by NuSTAR on May 23, 2021 (ObsID: 90702318002). According to standard procedures333https://heasarc.gsfc.nasa.gov/docs/nustar/analysis/nustar_swguide.pdf, we process the NuSTAR data using HEAsoft v6.28 based on the calibration files v20210315. We use a circle centered on the position of the source with a radius of to extract the source spectra. The background spectra are extracted with the same radius. In addition, we also make the dead-time correction. FPMA and FPMB are fitted jointly over 3.0-79.0 keV.
2.2 NICER OBSERVATION
Considering that NICER has three observations on the same day with NuSTAR, we select the observation (OBsID: 4202130110) with more overlapping time with NuSTAR observation. We process the NICER data following the standard steps444https://heasarc.gsfc.nasa.gov/docs/nicer/analysis_threads/ based on the latest calibration files555https://heasarc.gsfc.nasa.gov/docs/heasarc/caldb/caldb_supported_missions.html v202107220315. We use tools nicerl2666https://heasarc.gsfc.nasa.gov/docs/nicer/analysis_threads/nicerl2/ and nibackgen3C50777https://heasarc.gsfc.nasa.gov/docs/nicer/tools/nicer_bkg_est_tools.html to extract the source and background spectra, respectively. The response matrix 20170601v003 and ancillary file 20170601v005888https://heasarc.gsfc.nasa.gov/docs/nicer/analysis_threads/arf-rmf/ are used. Dead-time correction is applied. Considering the impact of low energy noise (< 0.5 keV), in this work, the spectrum of NICER is fitted over the energy band of 0.7-10.0 keV, ignoring the energy range of 1.7-2.1 keV (calibration residuals remain found in Si band) and 2.2-2.3 keV (calibration residuals remain in Au edges), respectively. Details of NICER calibration are described in LaMarr et al. (2016). Furthermore, following Jaisawal et al. (2019), we also add the systematic error of 1.5% with command fparkey999https://heasarc.gsfc.nasa.gov/lheasoft/ftools/fhelp/fparkey.html.
3 SPECTRAL ANALYSIS
3.1 PHENOMENOLOGICAL MODEL
We first fit the NuSTAR and NICER/XTI data with our preliminary model: crabcor*constant*TBabs*(diskbb+powerlaw). Model crabcor is described in Section 2. Model constant coordinates the calibration differences in different instruments in the process of joint fit. As to the model constant, we mainly fix the constant of NICER to 1 and allow the constant of FPMA and FPMB to vary. The subsequent usage of constant is the same. TBabs is the Galactic interstellar medium absorption model, and we set the abundance in Wilms et al. (2000) and put the cross-section in Verner et al. (1996). Finally, we find a broadened iron line at 6.0-7.0 keV, and a Compton hump at 20.0-30.0 keV with a reduced chi-square (4244.66/2592), by ignoring the 6.0-8.0 keV and 20.0-40.0 keV energy range (Figure 2).
To study the reflection features of MAXI J1803-298, we firstly focus on the basic properties of the broadened iron line with model: crabcor*constant*TBabs*(diskbb+powerlaw+gauss). After setting the central energy of the Gaussian line profile to 6.4-6.97 keV, we obtain that the equivalent width of the broadened iron line is 618 eV for NICER data and 418 eV for NuSTAR data, respectively, and the line peak is pegged at keV, with (3670.21/2589).
3.2 PHYSICAL MODEL
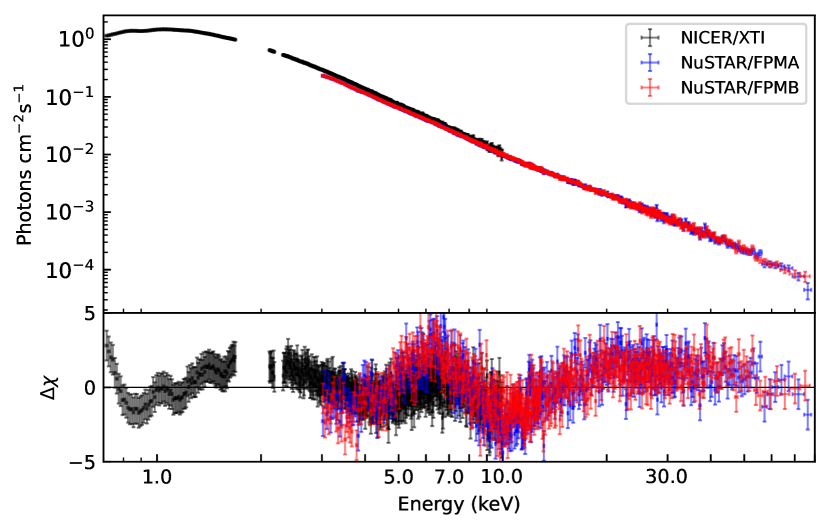
In order to analyze the reflection composition better, we use a physical model which utilizes a Comptonization continuum as an incident spectrum, i.e., crabcor*constant*TBabs*(diskbb+relxillCp). To ensure the inner radius of the accretion disk has extended to the innermost stable circular orbit (ISCO), during the fitting process, we set the disk inner radius () fitted freely, while we fix the dimensionless spin of black hole () to its maximum value (). We also bound the emissivity index of inner region () in 3-10, the emissivity index of outer region () in the range of 0-3, and the break radius () in , where is the gravitational radius (see Miller et al. 2018 for details), then allow them to fit freely within the range above. Owing to the limited fitting energy range, we also fix the electron temperature of corona () at 1/3 default value of the power-law cut-off energy (), i.e., . The outer radius of disk () is fixed at its default value (400 ), iron abundance () is fixed at a solar iron abundance, and redshift (z) is fixed at zero. We set other parameters (hydrogen column density (), inclination angle (), photon index of the X-ray spectrum (), ionization state of accretion disk (), reflection fraction () and normalization () ) to vary freely. We name the model above as Model A. We also define our baseline model, Model B, which differs only from Model A in freeing the spin and fixing the to an ISCO. We list the detailed fitting results for both Model A and B in Table 2, and the spectral fit of Model B is shown in Figure 3. We also use command steppar in XSPEC, to search for the best fit for the spin from 0.99 to 0.998 for our baseline model, as shown in Figure 4. The three dashed lines represent 99%, 90%, and 68% confidence levels from top to bottom.

4 DISCUSSION
4.1 A COMPACT CORONA CLOSE TO THE BLACK HOLE
From Model B, we can easily find a steep broken power-law emissivity profile, of which the upper limit of the inner emissivity index is pegged at 10 (taking as an example, the contour plot of and as shown in Figure 5), the outer emissivity index is pegged at 3, and a small break radius is pegged at 6 . This phenomenon is common among BHXRBs, which can be explained by a compact corona close to the black hole (e.g., Wilkins & Fabian 2012). This is because, if the corona is far away from the black hole, the light-bending will be weak, and the reflection fraction will be less than 1. Conversely, our results show that the reflection fraction of relxillCp in Model B is =, which confirms our inference.
4.2 EFFECT OF IRON ABUNDANCE
In Model B, we fix iron abundance to a standard solar iron abundance, but the reality may be more complex. To test the quantity effect on fitting results caused by variation of iron abundance, we change the iron abundance to its typical value () of most sources (García et al. 2018), and name it as Model C. For the convenience of comparison, we also list the result of Model C in Table 2. The spin only changes 0.5% from Model B (=1.063) to Model C (=1.007), while the inclination angle varies 3.7%. Therefore, for MAXI J1803-298, we conclude that the iron abundance has a negligible effect on our results.
4.3 EFFECT OF ELECTRON TEMPERATURE OF CORONA
Another parameter that may affect the result is the electron temperature of the corona. For Model D, we fix to its default maximum value (400 keV) and other parameters are the same as Model B. We still list the relevant result in Table 2. We can easily find that the best-fitting parameters did not change significantly, like spin (0.001) and inclination degree (70.8 1.1 degree) in Model D (Model B). Similarly, we can see that the electron temperature of the corona has no significant effect on the spin.
4.4 EFFECT OF THE CLOUD FAR AWAY FROM THE CENTER BLACK HOLE
Though we can not find additional narrow iron line composition from in Figure 3. To test the contribution of the cold plasma faraway to the spectra, we still add a second non-relativistic reflection Model xillverCp over Model B. The full expression is crabcor*constant*TBabs*(diskbb+relxillCp+xillverCp) (Model E). Except for the ionization state (), the reflection fraction (), and the normalization of xillverCp (), we link the parameters of model xillverCp with that of model relxillCp. Since the materials are neutral owing to the farther distance from the central black hole, we fix the in xillvercp. Moreover, we fix the reflection fraction of xillverCp to -1 and let be free. To simplify the fitting parameters, we also fix , and to the same value in Model B. We list the result in Table 2. Comparing the results between Model E and Model B, it can be seen that the addition of the non-relativistic reflection component does not improve the results, so we prefer not to add the second reflection component that xillverCp for MAXI J1803-298.


| ObsID | Instrument/Module | MJD | Start Time | End Time | Exposure (ks) | Count rates (cts ) |
| 90702318002 | NuSTAR/FPMA | 59357 | 2021-05-23 16:24:58.447 | 2021-05-23 20:32:57.207 | 7.2 | 91.73 |
| 90702318002 | NuSTAR/FPMB | 59357 | 2021-05-23 16:24:58.471 | 2021-05-23 20:32:57.207 | 7.1 | 83.93 |
| 4202130110 | NICER/XTI | 59357 | 2021-05-23 17:24:54.184 | 2021-05-23 20:58:45.184 | 4.9 | 3513 |
-
•
In columns 1-7, we display the following information: observation ID (ObsID); Instrument/Module; modified Julian date (MJD); start time; end time; exposure time in units of kiloseconds; and net count rates measured at 3.0-79.0 keV (0.7-10.0 keV) for NuSTAR (NICER) data in units of cts . It should be noted that the information in this table is after the dip time has been removed.
| Component | Parameter1 | Description | Model A | Model B | Model C | Model D | Model E |
| free | = | =5 | |||||
| constant | Cross-normalization | 1.0950.002 | 1.096 0.002 | 1.0960.002 | 1.0950.002 | 1.0950.002 | |
| constant | Cross-normalization | 1.1010.002 | 1.101 0.002 | 1.1020.002 | 1.101 0.002 | 1.1010.002 | |
| TBabs | Hydrogen column density | 5.00 0.01 | 4.96 0.01 | 4.76 0.01 | 5.06 0.01 | 4.99 0.01 | |
| diskbb | Temperature of disk | 0.780.01 | 0.780.01 | 0.740.01 | 0.790.01 | 0.780.01 | |
| diskbb | Normalization | 5.660.29 | 5.770.30 | 7.670.35 | 5.310.25 | 5.660.31 | |
| relxillCp | Emissivity index in the inner region | ||||||
| relxillCp | Emissivity index in the outer region | ||||||
| relxillCp | () | Break radius | |||||
| relxillCp | Black hole spin | 0.9910.001 | 0.9950.001 | ||||
| relxillCp | (∘) | Inclination angle | 73.35.5 | 70.81.1 | 73.41.6 | 74.7.04.6 | 73.41.3 |
| relxillCp | () | Disk inner radius | 1.080.08 | ||||
| relxillCp | Photon Index | 2.330.01 | 2.330.01 | 2.280.03 | 2.350.01 | 2.330.02 | |
| relxillCp | Ionization state of disk | 3.7 0.1 | 3.7 0.1 | 4.3 0.3 | 3.6 0.1 | 3.7 0.1 | |
| relxillCp | () | Iron abundance | |||||
| relxillCp | Electron temperature of the corona | ||||||
| relxillCp | Reflection fraction | 3.38 1.73 | 2.87 0.84 | 2.30 1.19 | 3.27 0.38 | 3.48 1.02 | |
| relxillCp | Normalization | 1.39 0.19 | 1.39 0.25 | 1.48 0.28 | 1.56 0.12 | 1.36 0.26 | |
| xillverCp | Normalization | - | - | - | - | 2.22 1.06 | |
| … | … | 1.064 | 1.063 | 1.007 | 1.037 | 1.060 | |
| … | … | 2749.7 (2585) | 2746.7 (2585) | 2601.84 (2585) | 2683.36 (2588) | 2739.21 (2584) |
-
•
Notes: Except for Model A, Model B/C/D/E are under the assume of =. Model A/B/C/D is crabcor*constant*TBabs*(diskbb+relxillCp). Model E is crabcor*constant*TBabs*(diskbb+relxillCp+xillverCp). The ∗ marker represents the parameter is fixed. The errors are calculated in 68 confidence interval by XSPEC.
5 CONCLUSIONS
We perform spectroscopic analysis of the reflection features for the new black hole candidate: MAXI J1803-298, and explore its spin and inclination angle, by analyzing the spectra from NuSTAR and NICER/XTI over the energy bands of 0.7-79.0 keV. Using the X-ray reflection fitting method with different models, we find that:
(1) During this observation in SIMS state, MAXI J1803-298 does not have a truncated inner disk.
(2) MAXI J1803-298 is a fast-rotating black hole with 0.001.
(3) MAXI J1803-298 is a high-inclination source with an inclination angle of 70.8∘ 1.1∘, which is consistent with the result (between 60∘-80∘) constrained from its light curve (Figure 1).
Acknowledgements
We thank the anonymous referee for the constructive comments. Y.F. thanks for the valuable discussions with Prof. Kenji Hamaguchi on extracting NICER spectrum. Y.F. thanks Prof. James F. Steiner for the model crabcor. Y.F. also thanks for the useful discussions with Youli Tuo, Prof. Bei You, and Ruican Ma. The software used is provided by the High Energy Astrophysics Science Archive Research Centre (HEASARC), a service of the Astrophysics Science Division at NASA/GSFC and the High Energy Astrophysics Division of the Smithsonian Astrophysical Observatory. This research has made use of the NuSTAR Data Analysis Software (NuSTARDAS) jointly developed by the ASI Space Science Data Center (SSDC, Italy) and the California Institute of Technology (Caltech, USA). NICER launched on June 3, 2017, which is a 0.2-12 keV X-ray telescope running on the International Space Station (ISS). L. G. is supported by the National Program on Key Research and Development Project (Grant No. 2016YFA0400804), and by the National Natural Science Foundation of China (Grant No. U1838114), and by the Strategic Priority Research Program of the Chinese Academy of Sciences (Grant No. XDB23040100).
DATA AVAILABILITY
This article was completed using NuSTAR and NICER data, which can be obtained from
https://heasarc.gsfc.nasa.gov/cgi-bin/W3Browse/w3browse.pl
References
- Arnaud (1996) Arnaud K. A., 1996, in Jacoby G. H., Barnes J., eds, Astronomical Society of the Pacific Conference Series Vol. 101, Astronomical Data Analysis Software and Systems V. p. 17
- Belloni et al. (2006) Belloni T., et al., 2006, MNRAS, 367, 1113
- Buckley et al. (2021) Buckley D. A. H., Brink J., Charles P. A., Groenewald D., 2021, The Astronomer’s Telegram, 14597, 1
- Bult et al. (2021) Bult P. M., et al., 2021, The Astronomer’s Telegram, 14602, 1
- Chand et al. (2021) Chand S., Dewangan G. C., Thakur P., Tripathi P., Agrawal V. K., 2021, The Astronomer’s Telegram, 14630, 1
- Chenevez et al. (2021) Chenevez J., Maartensson A. S., Andersen C. L., Jaisawal G. K., 2021, The Astronomer’s Telegram, 14601, 1
- Draghis et al. (2020) Draghis P. A., Miller J. M., Cackett E. M., Kammoun E. S., Reynolds M. T., Tomsick J. A., Zoghbi A., 2020, ApJ, 900, 78
- Espinasse et al. (2021) Espinasse M., Carotenuto F., Tremou E., Corbel S., Fender R., Woudt P., Miller-Jones J., 2021, The Astronomer’s Telegram, 14607, 1
- Fabian et al. (1989) Fabian A. C., Rees M. J., Stella L., White N. E., 1989, MNRAS, 238, 729
- Feng et al. (2021) Feng Y., et al., 2021, arXiv e-prints, p. arXiv:2109.07357
- Frank et al. (1987) Frank J., King A. R., Lasota J. P., 1987, A&A, 178, 137
- García et al. (2018) García J. A., Kallman T. R., Bautista M., Mendoza C., Deprince J., Palmeri P., Quinet P., 2018, in Workshop on Astrophysical Opacities. p. 282 (arXiv:1805.00581)
- Gendreau et al. (2012) Gendreau K. C., Arzoumanian Z., Okajima T., 2012, in Takahashi T., Murray S. S., den Herder J.-W. A., eds, Society of Photo-Optical Instrumentation Engineers (SPIE) Conference Series Vol. 8443, Space Telescopes and Instrumentation 2012: Ultraviolet to Gamma Ray. p. 844313, doi:10.1117/12.926396
- Gendreau et al. (2021) Gendreau K., et al., 2021, The Astronomer’s Telegram, 14588, 1
- Gropp et al. (2021) Gropp J. D., et al., 2021, The Astronomer’s Telegram, 14591, 1
- Harrison et al. (2013) Harrison F. A., et al., 2013, ApJ, 770, 103
- Homan et al. (2021) Homan J., et al., 2021, The Astronomer’s Telegram, 14606, 1
- Hosokawa et al. (2021) Hosokawa R., et al., 2021, The Astronomer’s Telegram, 14594, 1
- Jaisawal et al. (2019) Jaisawal G. K., et al., 2019, ApJ, 885, 18
- Jana et al. (2021) Jana A., Jaisawal G. K., Chhotaray B., Naik S., Kumari N., Gupta S., 2021, The Astronomer’s Telegram, 14629, 1
- LaMarr et al. (2016) LaMarr B., Prigozhin G., Remillard R., Malonis A., Gendreau K. C., Arzoumanian Z., Markwardt C. B., Baumgartner W. H., 2016, in den Herder J.-W. A., Takahashi T., Bautz M., eds, Society of Photo-Optical Instrumentation Engineers (SPIE) Conference Series Vol. 9905, Space Telescopes and Instrumentation 2016: Ultraviolet to Gamma Ray. p. 99054W, doi:10.1117/12.2232784
- McClintock et al. (2006) McClintock J. E., Shafee R., Narayan R., Remillard R. A., Davis S. W., Li L.-X., 2006, ApJ, 652, 518
- Miller & Reynolds (2021) Miller J. M., Reynolds M. T., 2021, The Astronomer’s Telegram, 14650, 1
- Miller et al. (2013) Miller J. M., et al., 2013, ApJ, 775, L45
- Miller et al. (2018) Miller J. M., et al., 2018, ApJ, 860, L28
- Narayan & McClintock (2012) Narayan R., McClintock J. E., 2012, MNRAS, 419, L69
- Serino et al. (2021) Serino M., et al., 2021, The Astronomer’s Telegram, 14587, 1
- Shidatsu et al. (2021) Shidatsu M., et al., 2021, The Astronomer’s Telegram, 14627, 1
- Steiner et al. (2010) Steiner J. F., McClintock J. E., Remillard R. A., Gou L., Yamada S., Narayan R., 2010, ApJ, 718, L117
- Steiner et al. (2021) Steiner J. F., Ubach S., Tomsick J. A., Coughenour B., Homan J., 2021, The Astronomer’s Telegram, 14994, 1
- Ubach et al. (2021) Ubach S., Steiner J., Homan J., Gendreau K. C., Arzoumanian Z., Altamirano D., Uttley P., Pasham D., 2021, The Astronomer’s Telegram, 14660, 1
- Verner et al. (1996) Verner D. A., Ferland G. J., Korista K. T., Yakovlev D. G., 1996, ApJ, 465, 487
- Wang et al. (2021) Wang Y., et al., 2021, The Astronomer’s Telegram, 14613, 1
- Wilkins & Fabian (2012) Wilkins D. R., Fabian A. C., 2012, MNRAS, 424, 1284
- Wilms et al. (2000) Wilms J., Allen A., McCray R., 2000, ApJ, 542, 914
- Xu & Harrison (2021) Xu Y., Harrison F., 2021, The Astronomer’s Telegram, 14609, 1