The Ophiuchus DIsk Survey Employing ALMA (ODISEA): Complete Size Distributions for the 100 Brightest Disks Across Multiplicity and SED Classes
Abstract
The size of a protoplanetary disk is a fundamental property, yet most remain unresolved, even in nearby star-forming regions (d 140-200 pc). We present the complete continuum size distribution for the brightest protoplanetary disks (M 2 M⊕) in the Ophiuchus cloud, obtained from ALMA Band 8 (410 GHz) observations at 0.05′′ (7 au) to 0.15′′ (21 au) resolution. This sample includes 54 Class II and 51 Class I and Flat Spectrum sources, providing a comprehensive distribution across evolutionary stages. We measure the Half Width at Half Maximum (HWHM) and the radius encircling of the flux () for most non-binary disks, yielding the largest flux-limited sample of resolved disks in any star-forming region. The distribution is log-normal with a median value of 14 au and a logarithmic standard deviation (factor of 2.9 in linear scale). Disks in close binary systems ( 200 au separation) have smaller radii, with median value of 5 au, indicating efficient radial drift as predicted by dust evolution models. The size distribution for young embedded objects (SED Class I and Flat Spectrum, age 1 Myr) is similar to that of Class II objects (age a few Myr), implying that pressure bumps must be common at early disk stages to prevent mm-sized particle migration at au scales.
1 Introduction
The sizes of protoplanetary disks, together with the distribution of mass within them, establish the basic architectures of planetary systems. Forming the rocky planets observed by Kepler (Burke et al., 2015) requires only a few Earth masses of dust within 1 au from the star while forming a Solar System analog requires significantly more mass and a much larger disk. Therefore, disk sizes and surface density profiles are the fundamental inputs for population synthesis models (Mordasini et al., 2012; Ronco et al., 2017) trying to understand and reproduce the observed population of extrasolar planets. However, disk sizes are surprisingly difficult to measure given that 1) disks do not have well-defined edges, disk sizes depend on the tracer (gas vs. dust), and the methods adopted to measure them, and 2) disks seem to be significantly smaller than originally observed.
The first interferometric surveys that were able to measure disk sizes at (sub)mm wavelengths (Dutrey et al., 1996; Andrews et al., 2009; Isella et al., 2009) observed the brightest (sub)mm sources identified by previous single-dish observations (Beckwith et al., 1990; Williams & Andrews, 2005) and obtained relatively large disk sizes (r 50 au). However, these early surveys suffered from a severe observational bias since brighter disks tend to be systematically larger than fainter ones (Tazzari et al., 2021; Andrews et al., 2018; Tripathi et al., 2017).
Recent ALMA surveys have dramatically increased the number of disks that have been imaged in nearby molecular clouds at modest resolution (e.g., 30 au; Ansdell et al. (2016); Pascucci et al. (2016); Barenfeld et al. (2016); Cieza et al. (2019)). One of the main results from these surveys has been the fact that most disks remain unresolved at this resolution and must be quite compact (i.e., r 15 au). Therefore, even after many years of ALMA operations, the full size distribution of protoplanetary disks in nearby star-forming regions still remains to be established. Disk size measurements are particularly scarce in binary systems, typically harboring unresolved, dynamically truncated disks (Zurlo et al., 2020, 2021). Disk size measurements are still scarce in binary systems, typically harboring unresolved, dynamically truncated disks (Zurlo et al. 2020, 2021). However, some observational and theoretical results suggest that dust disks in binary systems might be even smaller than their corresponding truncation radii (Zagaria et al., 2021a, b)
From a theoretical point of view, the dust continuum disk sizes observed at mm wavelengths are of great interest because, if left unimpeded, the timescale for the inward migration of mm-sized particles in a protoplanetary disk is of the order of 0.1 Myr (Brauer et al., 2007). This very short timescale is inconsistent with the observed mm fluxes and sizes of disks that are millions of years old. One of the most accepted solutions to prevent the catastrophic loss of mm-sized particles due to their very rapid radial drift is the presence of pressure bumps in the gaseous disk (Pinilla et al., 2012). These pressure bumps can be generated by disk instabilities or forming planets (Pinilla et al., 2012, 2020) and can slow down or even halt radial drift completely, trapping dust particles at pressure maxima and regulating the shrinkage of the continuum disk size with time. The rings seen in protoplanetary disks when observed at 5-15 au resolution (Andrews et al., 2018; Long et al., 2018; Cieza et al., 2021) are similar to the bumps predicted by numerical models and give credence to the idea that these pressure structures play a fundamental role in disk evolution. In this context, the continuum size of a protoplanetary disk provides direct constraints on the location of the most external pressure bumps in a given system, even when gaps are not spatially resolved by the observations.
As part of the Ophiuchus DIsk Survey Employing ALMA (ODISEA) project (Cieza et al., 2019; Williams et al., 2019), here we present ALMA Band 8 (410 GHz) continuum-only observations at 0.05′′ (7 au) to 0.15′′ (21 au) resolution of the brightest protoplanetary disks in the Ophiuchus Molecular cloud. This sample includes 54 Class II disks and 51 Class I and Flat Spectrum sources. We resolve every object and investigate the distribution of disk sizes as a function of multiplicity and SED Class. The observations and data reduction are described in Section 2. In Section 3, we present our main results, which are discussed in Section 4 in the context of disk evolution and planet formation.
2 Observation and Data Reduction
2.1 Sample Selection and Observations
Our Band 8 (410 GHz/0.73 mm) sample was selected from the ODISEA survey and is flux-limited. We selected all 100 targets brighter than 4 mJy in Band 6 (230 GHz/1.3 mm) from Williams et al. (2019), corresponding to Mdust 2 M⊕. Since 200 objects were detected by ODISEA in Band 6 (down to a 3- detection limit of 0.5 mJy), the Band 8 program is essentially restricted to the brightest half of all detected objects. Given the strong correlation between disk size and disk mass, the Band 8 observations were performed at two different resolutions. The 45 objects brighter than 20 mJy in Band 6 were observed in Band 8 at 0.15′′ (21 au) because they were already known to be resolved at those spatial scales from the lower-resolution Band 6 data. The 55 objects with Band 6 fluxes between 4 and 20 mJy were observed at 0.05′′ (7 au) angular resolution in Band 8. Some binary systems were observed at both resolutions because the different components fall in different flux ranges. In the end, a total of 105 disks were observed when counting the individual components in binary systems. The full sample of disks is listed in Table 1.
The observations at 0.15′′ resolution were taken during ALMA Cycle 8 under program 2021.1.00378.S (PI: L. Cieza) between August 4th and 11th, 2022, and have baselines between 15 m and 1300 m. The 0.05′′ angular resolution data were obtained between May 23rd and 29th, 2023, in ALMA Cycle 9, under program 2022.1.00480.S (PI: L. Cieza) with baselines ranging from 27 m to 3637 m. The continuum bandwidth was 7.5 GHz in both programs. The precipitable water vapor was around 2.3 mm during the Cycle 8 observations but stayed below 1 mm for the long-baseline observations in Cycle 9.
2.1.1 Data Reduction and Analysis
The data reduction was performed using the CASA (Common Astronomy Software Applications) (CASA Team et al., 2022) package, following the standard ALMA data processing pipeline. The calibration process included phase and amplitude corrections using observed calibrators, and residual bad data were flagged after initial calibration. Imaging of the data was carried out using the multi-scale CLEAN algorithm. We used the Briggs weighting scheme with a robust value of 0.5. The final beam sizes for the Cycle 8 and Cycle 9 data were 0.14′′ 0.18′′ and 0.04′′ 0.06′′, respectively. We performed auto masking and phase-only self-calibration to all the targets.
Amplitude self-calibration was attempted but was not implemented because it did not improve the quality of the data. A typical rms of 0.4-0.5 mJy/beam was achieved. All the objects were phase-centered. An automatic phase centering was performed for the targets without any central cavities, for targets with central cavities a manual phase centering was performed.
Since protoplanetary disks lack well-defined outer edges, there is no universally accepted method for measuring their sizes. Measuring the FWHM from a two-dimensional Gaussian fit is one of the simplest approaches. This can be done in CASA either in the image plane (via the imfit task) or in the visibility plane (via uvmodelfit). Both methods have some limitations. On the one hand, image-plane measurements require deconvolution from the beam and are sensitive to imaging parameters. On the other hand, visibility fitting becomes challenging for binary systems. However, we find that, for our sample, both methods agree within across the entire disk size range (see Fig. 3, in the Appendix). As reliable sizes for binaries are only available in the image plane, we adopt these measurements for our Gaussian fits. The Gaussian fit results (coordinates, FWHM of the major and minor axes, position angles, and fluxes) are listed in Table 1. Depending on the signal-to-noise (S/N) of the observations, imfit can provide deconvolved disk sizes that are even smaller than the beam. In our case, all the objects observed at 0.15′′ angular resolutions were well resolved and the S/N of the objects observed at 0.05′′ ranged from 10 to 200, allowing us to measure HWHM values as small as 0.015′′.
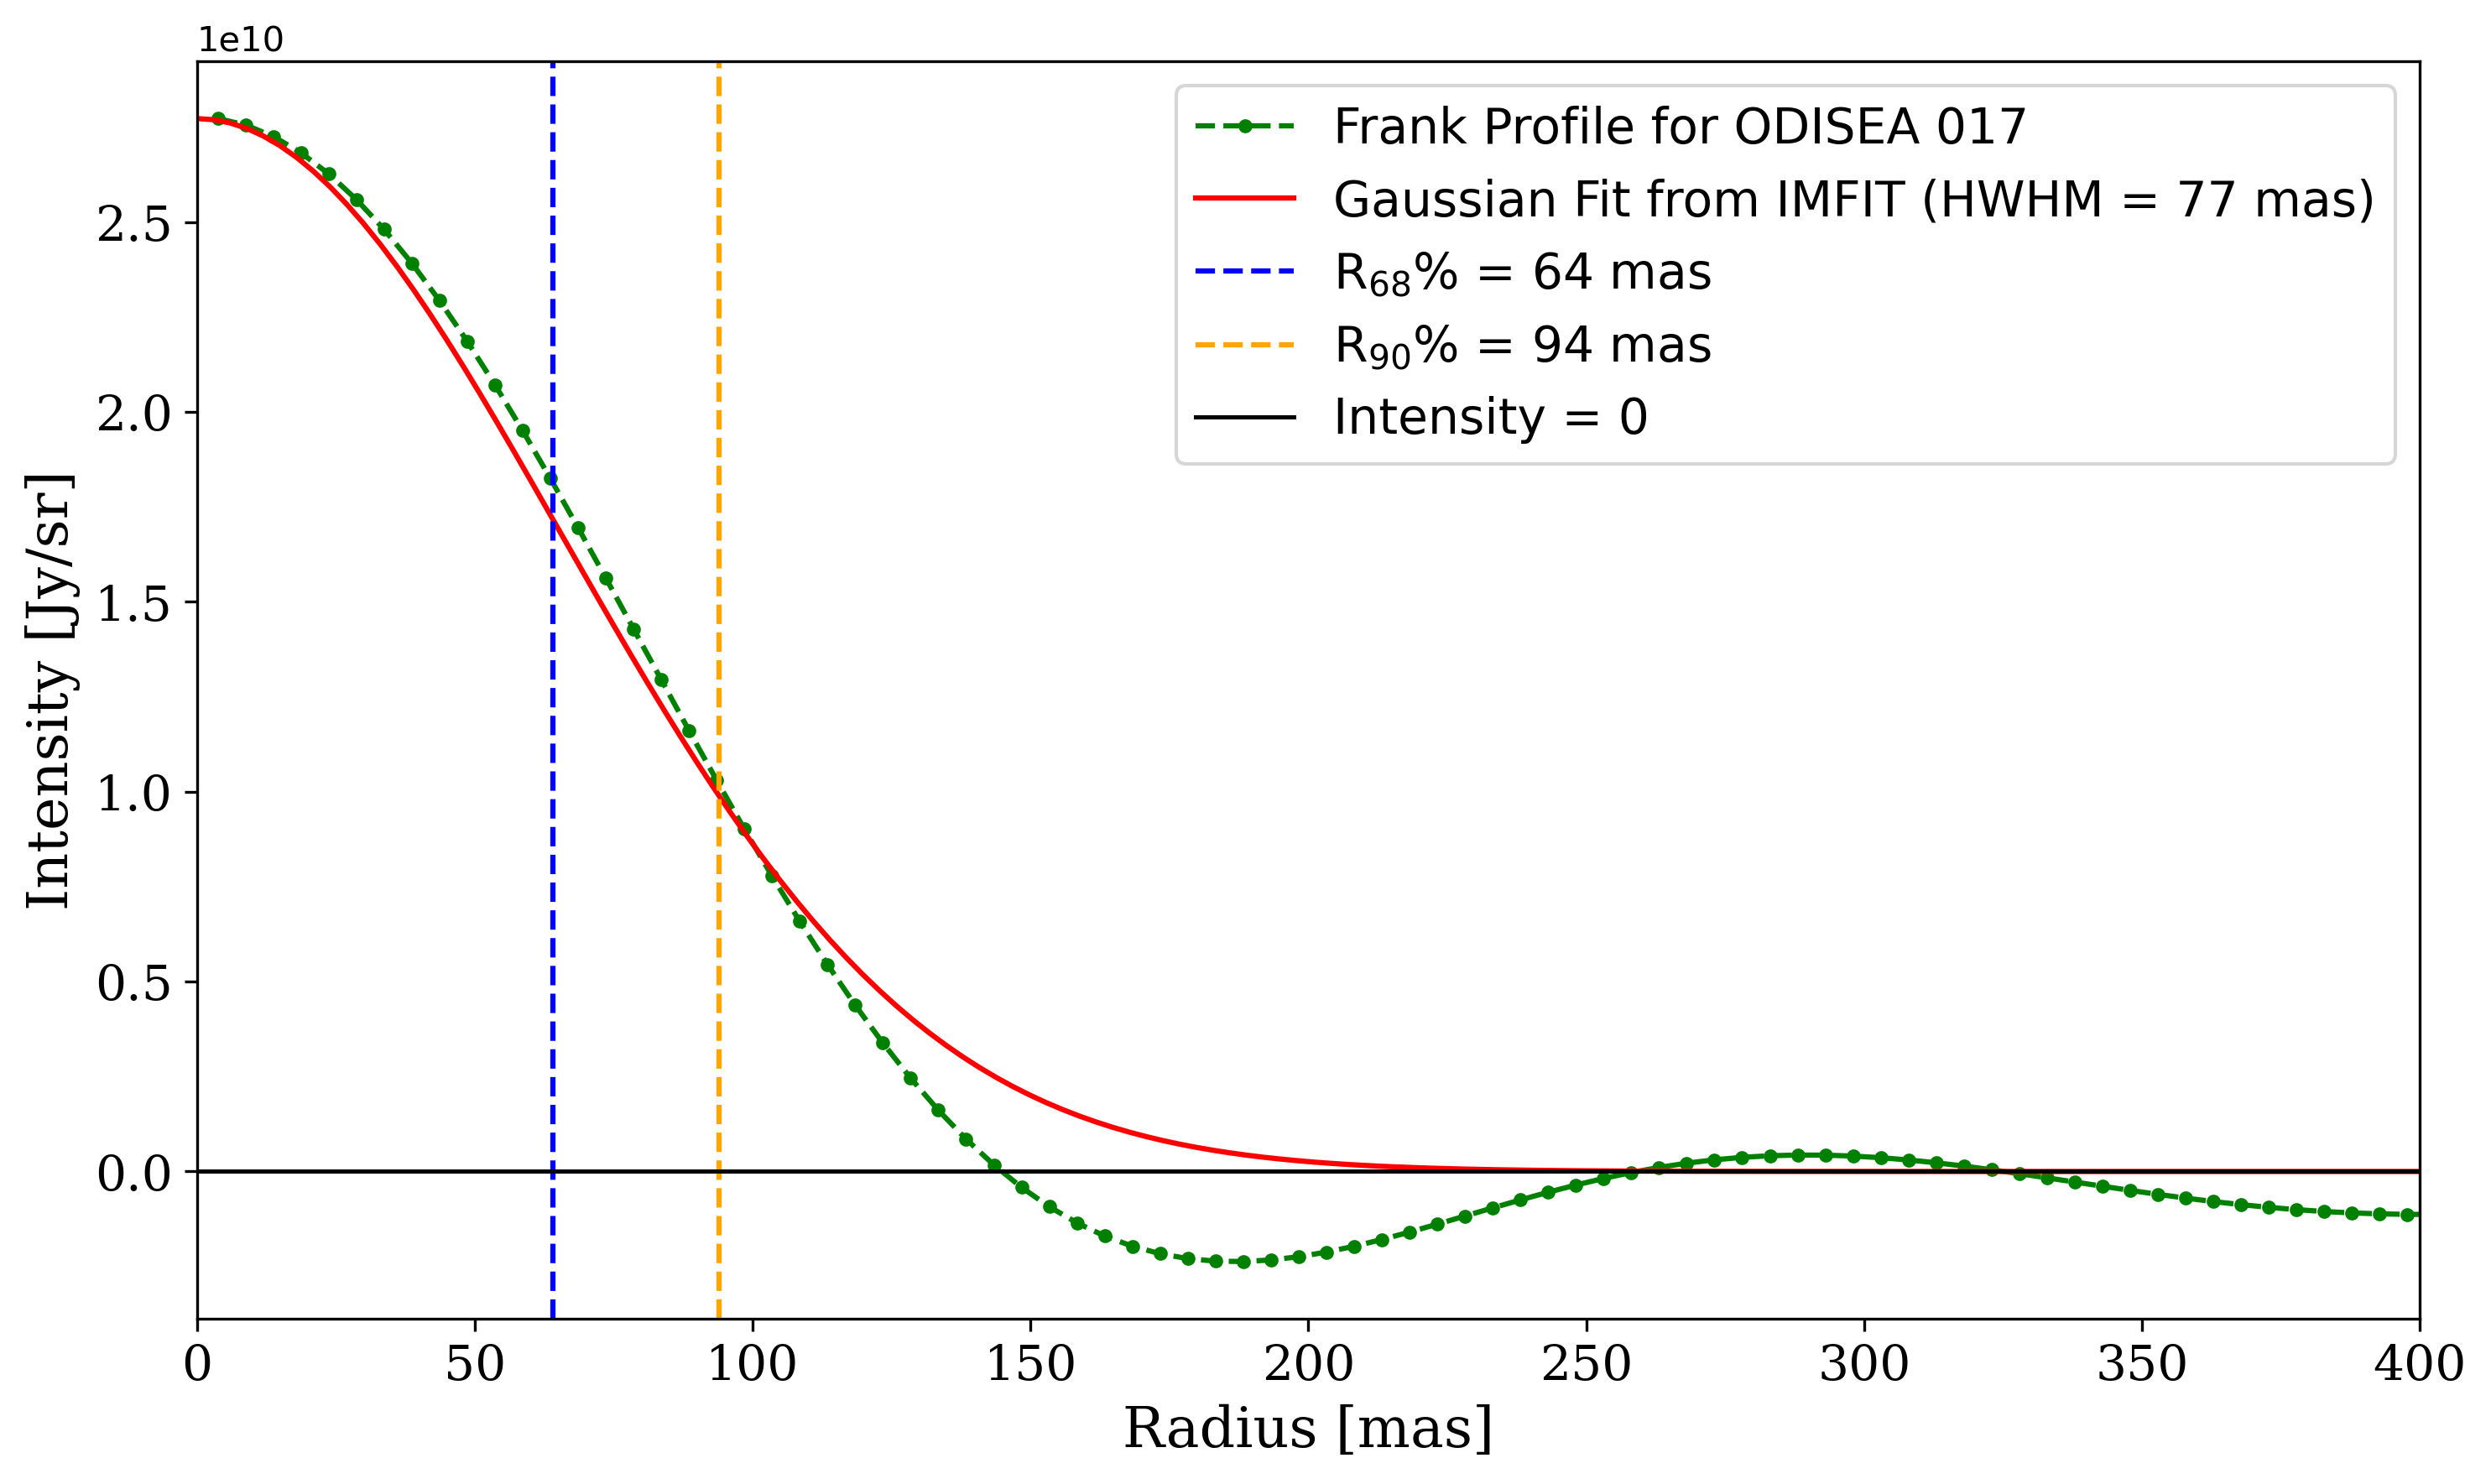
Another common approach to measure disk sizes is to create a deprojected radial profile from the image plane and calculate the radius that contains of the total flux (R68%), as described in Tripathi et al. (2017). R68% can also be estimated by fitting an analytical radial profile to the visibility plane (Hendler et al., 2020). Whenever possible, we obtained radial brightness profiles using the Frank code (Jennings, 2020) and the results of the Gaussian fitting as initial parameters. We integrated the flux until the radial profile first crossed zero and then calculated the radii enclosing (R68%) and (R90%) of the total flux as alternative size metrics. We note that Frank can fail on close binary systems or edge-on disks and when the S/N is low. Overall, we obtained Frank sizes for 80 disks. R68% and R90%111The R90% values are not used in our analysis but are provided to allow future comparisons. values are also listed in Table 1. A comparison of the R68 sizes from the Frank profiles and the HWHM values from the Gaussian fits (see Fig 3, right panel, in Appendix) shows a strong correlation, with a best-fit line slope of 0.78, representing a useful conversion factor between the two methods for measuring disk sizes. This correlation extends to the smaller sources, showing that both IMFIT and Frank are able to resolve even the faintest targets. To verify that even the smallest sources in our sample are partially resolved by the data, in Fig. 4 in the appendix, we plotted the deprojected visibilities as a function of baseline for one of our smallest sources (HWHM = 21 mas) and show that they are not consistent with a point source (which should have flat visibilities). We also compared the Frank profile to the deconvolved Gaussian size given by imfit for the same source and slightly larger source (Figure 5). We find that, for well-resolved sources, imfit reproduces well the intensity profile given by Frank. However, for very small sources, imfit might underestimate their size.
3 Results
3.1 Continuum Disk Sizes
In order to investigate the continuum disk sizes in our sample, the angular measurements from Table 1 were converted to physical sizes in au adopting the distance from Gaia Collaboration et al. (2018), when available. For objects without a Gaia distance, a mean distance of 139.4 pc (from Williams et al. (2019)) was assumed. The full-size distribution for the 105 disks in the sample is shown in Figure 1 (top-left panel), adopting the Gaussian measurements. We find that the HWHM values range from 1.7 au to 177 au. The distribution is log-normal, with a median value of 13 au and a logarithmic standard deviation of (corresponding to a factor of 2.9 in linear space), see Table 2).
Name RA Dec Dist Maj. Axis Min. Axis Pos. Angle B8 Flux Sep. SED ALMA Archive (deg) (deg) (pc) (mas) (mas) (deg) (mJy) (au) Class (mas) (mas) ODISEA_C4_001 245.38306 -23.02786 137.0 185.0 29.0 26.0 19.0 167.0 3.8 12.8 0.3 II 173.3 2.17 263.0 4.50 ODISEA_C4_021A 246.40308 -24.26180 142.8 53.0 4.2 41.0 4.5 139.0 17.0 20.4 0.76 46.0 II ODISEA_C4_100 246.90966 -24.61627 140.2 156.0 5.0 144.0 3.7 109.0 19.0 123.3 1.5 II 78.5 1.3 123.4 2.39 ODISEA_C4_117A 247.18866 -24.47191 81.9 385.0 29.0 329.0 24.0 85.0 33.0 224.0 13.0 17.0 II 158.3 6.93 213.2 1.45 ODISEA_C4_007 245.60530 -23.49830 138.3 149.0 9.5 117.0 9.2 9.7 14.1 40.6 1.4 II 63.5 4.94 98.5 7.33 Note: For the object ODISEA_C4_021A, an R68% and R90% value of is listed because it is part of a close binary system. R68% and R90% values were measured only for non-binary disks in this table.
3.2 Size distribution as a function of multiplicity
Since stellar companions are expected to truncate each other’s disks at 0.3-0.5 times the orbital separation (Papaloizou & Pringle, 1977; Artymowicz & Lubow, 1994), disks around close binary systems are expected to be significantly smaller than those around single stars (or wide-separation binaries). To examine the effect of stellar companions on disk sizes, we divide the sample into two groups: stars belonging to close-binary systems (projected sep. 200 au) and stars lacking close companions. The binary systems were identified from two sources, our own ALMA images and the Near-IR Adaptive Optics survey performed by Zurlo et al. (2020), which detected binary systems down to 6 au projected separations. Overall, our sample includes a total of 30 disks in 20 binary systems because only in cases the disks were detected around both components of the system. Of these 30 disks in multiple systems, 17 belong to close binaries and 13 are part of wide separation systems and are treated as single stars for statistical purposes.
In Figure 1, we also show the size distribution of disk sizes excluding disks in close binary systems (top-right panel) and the size distribution for close binaries alone (middle-left panel). The cumulative distribution of the full sample and the two sub-samples are plotted in the middle-right panel, together with the Gaussian fits for the observed distributions. We find that removing the close binaries has a minor effect on the full distribution, increasing the the median disk size from 14 au to 16 au and decreasing the standard deviation from = 0.46 to = 0.39. According to the Kolmogorov-Smirnov (K-S) test, the distributions of disk sizes including or excluding close binaries are very similar (see Table LABEL:tab:_table3). On the other hand, the size distribution of close binaries alone is clearly different with a median disk size of 4.6 au and a logarithmic standard deviation of (corresponding to a factor of 1.8 in linear space). We note that the binary systems include secondary disks that do not necessarily meet the flux requirements in our flux-limited sample or that were only detected in the Band 8 high-resolution observations. To correct for this bias, we define a “restricted binary sample” which excludes 4 secondary disks fainter than 4 mJy x [B8/B6], where [B8/B6] is equal to 3.34, the mean Band 8 to Band 6 ratio of the entire sample. This restricted binary sample is also shown in Fig. 1 (middle panels) and included in Table 2. As shown in Table 3, the K-S test confirms a significant difference with respect to the sample excluding close binaries, although with a slightly lower significance. We note that the results remain essentially the same if separation thresholds of 100 au or 300 au are used to define close binary systems, instead of the 200 au we adopted.
Another potential bias when comparing disk sizes is the difference in the underlying distributions of host stellar masses between single stars and binaries, given the known correlations between disk luminosity and stellar mass Manara et al. (2019) and between disk luminosity and disk sizes (Hendler et al., 2020). In particular, secondary objects in binary systems are likely to be biased toward lower host masses and disk luminosities and hence toward smaller disk sizes. To disentangle these dependencies, we plot the disk sizes as a function of flux for all disks and close-binary systems (See Fig. 1, bottom-left panel). We find that disks in binary systems indeed span a smaller range of disk fluxes. However, it is also clear that for a given mm flux, disks in binary systems are systematically smaller.
| Sample | Median () | Standard Deviation () |
|---|---|---|
| (au) | Log. (au) | |
| Whole sample and binaries | ||
| Whole Sample | ||
| Excluding Binaries | ||
| Binaries Only | ||
| Restricted Sample | ||
| SED Classes (Including close binaries) | ||
| Class I & F | ||
| Class II | ||
| SED Classes (Excluding close binaries) | ||
| Class I & F | ||
| Class II | ||
| SED Classes (Frank Sizes) | ||
| Class I & F | ||
| Class II | ||
| SED Classes (Fluxes) | ||
| Class I & F | ||
| Class II | ||
| Size Comparison | Sample Sizes | D-value | p-value | Figure Panels |
|---|---|---|---|---|
| Whole Sample vs. Excluding Close Binaries | (105, 88) | 0.10 | 0.58 | Fig. 1 (Middle Right) |
| Excluding Binaries vs. Close Binaries | (88,17) | 0.66 | Fig. 1 (Middle right) | |
| Excluding Binaries vs. Restricted Sample | (88,13) | 0.63 | Fig. 1 (Middle right) | |
| Class I + Flat vs. Class II (incl. close binaries) | (51,54) | 0.16 | 0.45 | Fig. 2 (Top Right) |
| Class I + Flat vs. Class II (excl. close binaries) | (46,42) | 0.22 | 0.16 | Fig. 2 (Middle Right) |
| Class I + Flat vs. Class II (Frank Sizes) | (42,38) | 0.12 | 0.87 | Fig. 2 (Bottom right) |
| Flux Comparison | Sample Sizes | D-value | p-value | Figure Panels |
| Class I + Flat vs. Class II (incl. close binaries) | (51,54) | 0.20 | 0.28 | Fig. 4 (Appendix) |
| Inclination Comparison | Sample Sizes | D-value | p-value | Figure Panels |
| Class I + Flat vs. Isotropic Distribution | (51, 1000) | 0.13 | 0.42 | Fig. 4 (Appendix) |


3.3 Size distribution as a function of SED Class
The Ophiuchus molecular cloud is characterized by a significant population of embedded stars (Class I and Flat Spectrum sources), with an estimated age of 0.5-1 Myr, and mostly located in the L1688 cluster (Evans et al., 2009). It also contained a more distributed population of Class II and Class III sources sources with a significant age spread, with stars as old as 6 Myr according to Esplin & Luhman (2020). We note however that most of the embedded and Class II sources in our sample are associated with the L1688 Cluster.
In order to investigate how continuum disk sizes evolve with time, we conducted a size distribution analysis for both groups (embedded stars vs. Class II sources). Figure 2 presents the size distribution of the two SED groups using the Gaussian measurements including close binaries and excluding them (top-left and middle-left panels, respectively). The bottom-left panel corresponds to the size distribution adopting the R68% values from Frank (only available for non-binary disks).
We further plot cumulative distribution functions for all cases with their corresponding Gaussian fits (panels on the right). As with the previous analysis, we performed K-S tests to compare the distributions between the two SED groups. The results of the K-S test are shown in Table LABEL:tab:_table3. These tests show that the distributions remain statistically indistinguishable from each other, regardless of the inclusion or exclusion of the binary systems, or whether we adopt Gaussian sizes or R68% values from Frank profiles. Our results indicate that disk sizes are not becoming smaller between the embedded stage and the Class II phase as expected from the radial drift of mm-sized particles. In fact, at face value, Class II disks are slightly larger than disks around embedded sources (see Table 2). Given the strong dependence of disk size on mm flux, this result would be expected if the Class II disks in our sample were significantly brighter than the embedded disks. However, we have verified that this is not the case as we find that the flux distributions of the two samples are indistinguishable from each other according to the K-S test (see Table 3 and left of Figure 4 in the Appendix). Another potential bias that we investigated is the possibility that the sample of embedded sources is contaminated by more evolved, but highly inclined, Class II objects (Ohashi et al., 2023). To test for this possibility we compare the observed distribution of inclinations to that expected for an isotropic distribution of disk orientations (see Figure 4, right panel in the appendix). However, we find that the observed inclination distribution of embedded sources is indistinguishable from random orientations (see K-S in Table 3) and conclude that our sample of embedded sources is not significantly contaminated by highly-inclined older objects.


4 Discussion
4.1 Impact of Multiplicity on Planetary Architectures
In our analysis of the 100 brightest protoplanetary disks in Ophiuchus, we examined how multiplicity influences size distribution. In our flux-limited sample, we find that the stars in close binary systems (sep. 200 au) have disks that are, on average, more than a factor of two smaller than disks around single stars or wide binary systems (HWHM 5 vs 13 au). The most straightforward implication is that the formation of Uranus and Neptune analogs should be strongly inhibited in close binary systems, which should be prone to producing compact planetary configurations. However, models by Zagaria et al. (2021b) recently suggested that stellar companions might also affect the formation of planets in additional ways. In particular, they find that dust grains should undergo more efficient radial drift in close binaries with respect to wide binaries and single stars. This would very quickly ( 1 Myr) reduce the amount of solids available for the formation of the cores of gas giants unless disk substructures can trap the dust and prevent its inward migration at the very early stages of disk evolution.
The bottom-left panel of Figure 1 shows that, for a given flux (a proxy for dust mass), disks in close binary tend to be smaller than the rest. This is consistent with a more efficient radial drift and supports the notion that dust evolution, and not only tidal truncation, play a role on the continuum disk sizes in binary systems. This idea can be tested by comparing binary separations to the expected truncation radius. The truncation radii are expected to be 0.3-0.5 the orbital separations (Papaloizou et al., 1997; Artymowicz & Lubow, 1994). Instead, we find that the continuum radii are 0.1 the projected orbital separations (see Figure 1, bottom-right panel), confirming the result found by Manara et al. (2019) for Taurus binaries. The tidal truncation radius depends strongly on eccentricity, but Manara et al. (2019) already demonstrated that the eccentricity values would need to be unrealistically high to explain the observed disk sizes by tidal truncation alone.
The observational results presented herein should allow more detailed comparisons to numerical models as those of Zagaria et al. (2021b), which can in principle explain disks smaller than the truncation radii in terms of grain growth and radial drift in binary systems. They compared the observed disk sizes in binary systems in Taurus (from Manara et al. (2019)) and Ophiuchus (from Cox et al. (2017)) and obtained good agreement with their models (Zagaria et al., 2021a), but concluded that more resolved disks were needed to derive more robust conclusions. We note that our results in Ophiuchus are highly complementary to those studied by Zagaria et al. (2021b) because our disk sizes come from binaries with projected separations smaller than 200 au, while resolved disk from Manara et al. (2019) and Cox et al. (2017) correspond to disks in binaries with separations larger than 200 au (see Figure 1, bottom-right panel).222 With the exception of Elias 2-33 (a.k.a ODISEAC494), all the disks in binaries were known and had ALMA observations (e.g., from Cox et al. 2017 and Zurlo et al. 2021). However, most disks in close binaries were previously unresolved and lacked disk measurements.
Detailed comparisons of disk sizes to the outer architectures of extrasolar planetary systems are also highly desirable, but our ability to detect extrasolar planets at separations beyond 5 au remains very limited, especially around binary systems. For instance, the detection of Uranus and Neptune analogos in extrasolar binary systems is currently restricted to the microlensing technique and few examples exist e.g., Poleski et al. (2014). However, the Nancy Grace Roman Space Telescope will dramatically change this situation (Penny et al., 2019) and should provide statistics on exoplanets at 1-30 au separations around binary systems that could be compared to disk demographic results.
4.2 The Size Distribution Across SED Classes: implications for disk evolution and planet formation
The lack of evolution in continuum disk sizes between embedded objects and Class II sources found in Section 3.3 is very interesting in the context of pressure bumps, grain growth and radial drift. Pressure bumps can trap dust particles, preventing inward drift and enabling growth into larger bodies (Pinilla et al., 2012, 2020). These pressure bumps are consistent with the rings around most of the massive Class II disks observed at high resolutions (Andrews et al., 2018; Long et al., 2018; Cieza et al., 2021) and with the relatively slow evolution of disk sizes seen between 1–10 Myr old systems (Hendler et al., 2020). Our new ALMA observations includes younger, less massive, and smaller disks than the previous studies mentioned above and suggest that these bumps are ubiquitous and must be present from the early stages of disk evolution (age 1 Myr). Additional observational evidence supports this idea. For instance, our Band 8 data has enough resolution and signal to noise to show gaps and rings in several disks that were previously considered smooth (Bhowmik et. in prep). The nearby disk around TW Hydra also shows gaps at au scales (Andrews et al., 2016), and even objects at the deuterium fusion limit can show substructures when observed at sufficiently high-enough resolution, e.g., González-Ruilova et al. (2020).
Future observations with ALMA and the ngVLA (Wu et al., 2024) at even higher angular resolution should be able to search for substructures in all the disks that remain smooth in our study. Meanwhile, the observed continuum size distribution can already provide constraints on the locations of the pressure bumps. As shown by Rosotti et al. (2019), disk sizes derived from ALMA continuum observations mostly trace the radius up to which the disks retain grains large enough to emit significantly at (sub)millimeter wavelengths (e.g., the locations of the outermost dust traps). Furthermore, if dust traps are assumed to be caused by the formation of planets (e.g. Zhang et al. (2018), numerical models that combine viscous evolution, planet-disk interactions, grain growth, and radial drift can be used to investigate the observed (lack of) evolution in disk sizes. The output of such models can be postprocessed with radiative transfer to allow for direct comparison to ALMA observations. Such comparisons can then constrain the underlying populations of planets (in terms of masses and semi-major axes) that are needed to reproduce the observed size distribution in our sample of Ophiuchus disks (Orcajo et al. in prep.), bridging the gap between disk demographics and planet population studies.
It is important to consider that our sample excludes all disks with dust masses 2 M⊕. Such disks might have a different population of planets (e.g., mostly terrestrial planets within 1 au). Therefore, to obtain a more complete picture and to test the idea that dust disk sizes are mostly regulated by planet formation that halts dust drift, it would be very beneficial to explore the full size distribution of disk in nearby molecular clouds. This is within current capabilities, as ALMA can reach a resolution of 1 au at 140 pc using its most extended configuration in Band 8.
The measurement of disk sizes as a function of age can also provide valuable constraints on disk evolution models. In particular, viscous models predict that the disk will expand with time, while models of disks driven by magnetic winds find that the disk sizes should remain close to constant (Tabone et al., 2022). However, most continuum ALMA surveys, including ours, lack the sensitivity to detect the faint emission from the outer disk (arising from small dust) to distinguish between the scenarios (Zagaria et al., 2022). Measuring the sizes of the gaseous disk might be a more direct way to distinguish between viscous and magnetic wind models. Trapman et al. (2023) recently found that gas disk sizes are significantly smaller in Upper Sco (age 5 Myr) than in Lupus and Taurus (Age 3 Myr). This seems to contradict both viscous and wind-driven evolution and suggests that external photoevaporation could also play an important role on the evolution of disk sizes. Investigating disk sizes as a function of time is one of the main goals of the AGE-PRO ALMA Large Program (ALMA Survey of Gas Evolution of PROtoplanetary Disks; Zhang et al. submitted). Thanks to very deep continuum and molecular line observations, AGE-PRO will help to constrain the importance of viscous spreading, magnetic winds and photoevaporation in disk evolution (Tabone et al. 2024, submitted; Anania et al. 2024, submitted).
5 Additional Figures


References
- Andrews et al. (2009) Andrews, S. M., Wilner, D. J., Hughes, A. M., Qi, C., & Dullemond, C. P. 2009, ApJ, 700, 1502, doi: 10.1088/0004-637X/700/2/1502
- Andrews et al. (2018) Andrews, S. M., Wilner, D. J., Macías, E., Carrasco-González, C., & Isella, A. 2018, in Astronomical Society of the Pacific Conference Series, Vol. 517, Science with a Next Generation Very Large Array, ed. E. Murphy, 137
- Andrews et al. (2016) Andrews, S. M., Wilner, D. J., Zhu, Z., et al. 2016, ApJ, 820, L40, doi: 10.3847/2041-8205/820/2/L40
- Ansdell et al. (2016) Ansdell, M., Williams, J. P., van der Marel, N., et al. 2016, ApJ, 828, 46, doi: 10.3847/0004-637X/828/1/46
- Artymowicz & Lubow (1994) Artymowicz, P., & Lubow, S. H. 1994, ApJ, 421, 651, doi: 10.1086/173679
- Barenfeld et al. (2016) Barenfeld, S. A., Carpenter, J. M., Ricci, L., & Isella, A. 2016, ApJ, 827, 142, doi: 10.3847/0004-637X/827/2/142
- Beckwith et al. (1990) Beckwith, S. V. W., Sargent, A. I., Chini, R. S., & Guesten, R. 1990, AJ, 99, 924, doi: 10.1086/115385
- Brauer et al. (2007) Brauer, F., Dullemond, C. P., Johansen, A., et al. 2007, A&A, 469, 1169, doi: 10.1051/0004-6361:20066865
- Burke et al. (2015) Burke, C. J., Christiansen, J. L., Mullally, F., et al. 2015, ApJ, 809, 8, doi: 10.1088/0004-637X/809/1/8
- CASA Team et al. (2022) CASA Team, Bean, B., Bhatnagar, S., et al. 2022, PASP, 134, 114501, doi: 10.1088/1538-3873/ac9642
- Cieza et al. (2019) Cieza, L. A., Ruíz-Rodríguez, D., Hales, A., et al. 2019, MNRAS, 482, 698, doi: 10.1093/mnras/sty2653
- Cieza et al. (2021) Cieza, L. A., González-Ruilova, C., Hales, A. S., et al. 2021, MNRAS, 501, 2934, doi: 10.1093/mnras/staa3787
- Cox et al. (2017) Cox, E. G., Harris, R. J., Looney, L. W., et al. 2017, ApJ, 851, 83, doi: 10.3847/1538-4357/aa97e2
- Dutrey et al. (1996) Dutrey, A., Guilloteau, S., Duvert, G., et al. 1996, A&A, 309, 493
- Esplin & Luhman (2020) Esplin, T. L., & Luhman, K. L. 2020, VizieR Online Data Catalog: Membership in Ophiuchus & Upper Scorpius complex (Esplin+, 2020), VizieR On-line Data Catalog: J/AJ/159/282. Originally published in: 2020AJ….159..282E, doi: 10.26093/cds/vizier.51590282
- Evans et al. (2009) Evans, Neal J., I., Dunham, M. M., Jørgensen, J. K., et al. 2009, ApJS, 181, 321, doi: 10.1088/0067-0049/181/2/321
- Gaia Collaboration et al. (2018) Gaia Collaboration, Babusiaux, C., van Leeuwen, F., et al. 2018, VizieR Online Data Catalog: 46 open clusters GaiaDR2 HR diagrams (Gaia Collaboration, 2018), VizieR On-line Data Catalog: J/A+A/616/A10. Originally published in: 2018A&A…616A..10G, doi: 10.26093/cds/vizier.36160010
- González-Ruilova et al. (2020) González-Ruilova, C., Cieza, L. A., Hales, A. S., et al. 2020, ApJ, 902, L33, doi: 10.3847/2041-8213/abbcce
- Hendler et al. (2020) Hendler, N., Pascucci, I., Pinilla, P., et al. 2020, ApJ, 895, 126, doi: 10.3847/1538-4357/ab70ba
- Isella et al. (2009) Isella, A., Carpenter, J. M., & Sargent, A. I. 2009, ApJ, 701, 260, doi: 10.1088/0004-637X/701/1/260
- Jennings (2020) Jennings, J. 2020, in Five Years After HL Tau: A New Era in Planet Formation (HLTAU2020), 15, doi: 10.5281/zenodo.4300077
- Long et al. (2018) Long, F., Pinilla, P., Herczeg, G. J., et al. 2018, ApJ, 869, 17, doi: 10.3847/1538-4357/aae8e1
- Manara et al. (2019) Manara, C. F., Mordasini, C., Testi, L., et al. 2019, A&A, 631, L2, doi: 10.1051/0004-6361/201936488
- Mordasini et al. (2012) Mordasini, C., Alibert, Y., Benz, W., Klahr, H., & Henning, T. 2012, A&A, 541, A97, doi: 10.1051/0004-6361/201117350
- Ohashi et al. (2023) Ohashi, N., Tobin, J. J., Jørgensen, J. K., et al. 2023, ApJ, 951, 8, doi: 10.3847/1538-4357/acd384
- Papaloizou & Pringle (1977) Papaloizou, J., & Pringle, J. E. 1977, MNRAS, 181, 441, doi: 10.1093/mnras/181.3.441
- Papaloizou et al. (1997) Papaloizou, J. C. B., Alberts, F., Pringle, J. E., & Savonije, G. J. 1997, MNRAS, 284, 821, doi: 10.1093/mnras/284.4.821
- Pascucci et al. (2016) Pascucci, I., Testi, L., Herczeg, G. J., et al. 2016, ApJ, 831, 125, doi: 10.3847/0004-637X/831/2/125
- Penny et al. (2019) Penny, M. T., Gaudi, B. S., Kerins, E., et al. 2019, ApJS, 241, 3, doi: 10.3847/1538-4365/aafb69
- Pinilla et al. (2012) Pinilla, P., Birnstiel, T., Ricci, L., et al. 2012, A&A, 538, A114, doi: 10.1051/0004-6361/201118204
- Pinilla et al. (2020) Pinilla, P., Pascucci, I., & Marino, S. 2020, A&A, 635, A105, doi: 10.1051/0004-6361/201937003
- Poleski et al. (2014) Poleski, R., Skowron, J., Udalski, A., et al. 2014, ApJ, 795, 42, doi: 10.1088/0004-637X/795/1/42
- Ronco et al. (2017) Ronco, M. P., Gulera, O. M., & de Elía, G. C. 2017, in Revista Mexicana de Astronomia y Astrofisica Conference Series, Vol. 49, Revista Mexicana de Astronomia y Astrofisica Conference Series, 76–76
- Rosotti et al. (2019) Rosotti, G. P., Tazzari, M., Booth, R. A., et al. 2019, MNRAS, 486, 4829, doi: 10.1093/mnras/stz1190
- Tabone et al. (2022) Tabone, B., Rosotti, G. P., Lodato, G., et al. 2022, MNRAS, 512, L74, doi: 10.1093/mnrasl/slab124
- Tazzari et al. (2021) Tazzari, M., Testi, L., Natta, A., et al. 2021, MNRAS, 506, 5117, doi: 10.1093/mnras/stab1912
- Trapman et al. (2023) Trapman, L., Rosotti, G., Zhang, K., & Tabone, B. 2023, ApJ, 954, 41, doi: 10.3847/1538-4357/ace7d1
- Tripathi et al. (2017) Tripathi, A., Andrews, S. M., Birnstiel, T., & Wilner, D. J. 2017, ApJ, 845, 44, doi: 10.3847/1538-4357/aa7c62
- Williams & Andrews (2005) Williams, J., & Andrews, S. 2005, in American Astronomical Society Meeting Abstracts, Vol. 207, American Astronomical Society Meeting Abstracts, 39.01
- Williams et al. (2019) Williams, J. P., Cieza, L., Hales, A., et al. 2019, ApJ, 875, L9, doi: 10.3847/2041-8213/ab1338
- Wu et al. (2024) Wu, Y., Liu, S.-F., Jiang, H., & Nayakshin, S. 2024, ApJ, 965, 110, doi: 10.3847/1538-4357/ad323b
- Zagaria et al. (2022) Zagaria, F., Rosotti, G. P., Clarke, C. J., & Tabone, B. 2022, MNRAS, 514, 1088, doi: 10.1093/mnras/stac1461
- Zagaria et al. (2021a) Zagaria, F., Rosotti, G. P., & Lodato, G. 2021a, MNRAS, 504, 2235, doi: 10.1093/mnras/stab985
- Zagaria et al. (2021b) —. 2021b, MNRAS, 507, 2531, doi: 10.1093/mnras/stab2024
- Zhang et al. (2018) Zhang, S., Zhu, Z., Huang, J., et al. 2018, ApJ, 869, L47, doi: 10.3847/2041-8213/aaf744
- Zurlo et al. (2020) Zurlo, A., Cieza, L. A., Pérez, S., et al. 2020, MNRAS, 496, 5089, doi: 10.1093/mnras/staa1886
- Zurlo et al. (2021) Zurlo, A., Cieza, L. A., Ansdell, M., et al. 2021, MNRAS, 501, 2305, doi: 10.1093/mnras/staa3674