The effects of stellar gravity darkening on high-resolution transmission spectra
Abstract
High-resolution transmission spectroscopy is a powerful method for probing the extended atmospheres of short-period exoplanets. With the advancement of ultra-stable echelle spectrographs and the advent of 30-meter class telescopes on the horizon, even minor observational and physical effects will become important when modeling atmospheric absorption of atomic species. In this work we demonstrate how the non-uniform temperature across the surface of a fast rotating star, i.e., gravity darkening, can affect the observed transmission spectrum in a handful of atomic transitions commonly observed in short-period exoplanet atmospheres. We simulate transits of the ultra-hot Jupiters KELT-9 b and HAT-P-70 b but our results are applicable to all short-period gas giants transiting rapidly rotating stars. In general, we find that gravity darkening has a small effect on the average transmission spectrum but can change the shape of the absorption light curve, similar to the effect observed in broadband photometric transits. While the magnitude of gravity darkening effects are on the same order as the noise in transmission spectra observed with 10-meter class telescopes, future high-quality spectroscopic light curves for individual atomic absorption lines collected with 30-meter class telescopes will need to account for this effect.
1 INTRODUCTION
Transmission spectroscopy is one of the primary tools for measuring the properties of exoplanet atmospheres. Different layers of planetary atmospheres can be observed by exploiting the varying populations of molecular and atomic transitions across a range of temperatures and pressures. As a result, transmission spectroscopy has revealed detailed physical and chemical information about planetary atmospheres, from photospheres (Deming et al., 2013; Kreidberg et al., 2014; Sing et al., 2016; Weaver et al., 2021) to thermospheres (Redfield et al., 2008; Wyttenbach et al., 2015; Casasayas-Barris et al., 2017; Salz et al., 2018; Yan & Henning, 2018; Cauley et al., 2019; Seidel et al., 2020; Hoeijmakers et al., 2019; Cauley et al., 2021) and all the way out to unbound exospheres (e.g., Bourrier et al., 2013; Ehrenreich et al., 2015; Allart et al., 2018; Bourrier et al., 2018; Zhang et al., 2021).
As instruments become more sensitive and processing techniques more advanced, it is becoming important to understand all of the physical and observational factors which contribute to transmission spectrum signals. This includes the possible contributions of stellar activity (Rackham et al., 2018; Cauley et al., 2018; Salz et al., 2018), stellar center-to-limb variations (CLVs) and the planet’s Doppler shadow (Czesla et al., 2015; Yan et al., 2015, 2017), stellar pulsations (Yan et al., 2021; Cauley et al., 2021), and changes in the transit chord due to orbital precession (Herman et al., 2018; Johnson et al., 2018; Watanabe et al., 2020; Szabó et al., 2020). For high-resolution transmission spectra these effects can alter the observed line profile morphologies, as well as the shape of light curves for individual atomic absorption lines.
One aspect of transmission spectroscopy contamination that is relevant to planets transiting rapidly rotating stars is the non-spherical shape and non-uniform surface temperature of their host stars, the result of gravity darkening from the star’s high spin rate (Barnes, 2009). For transiting planets with large spin-orbit misalignment it is possible to derive the star’s gravity darkened parameters, which includes the true inclination of the stellar spin axis in the plane of the sky, the ratio of the polar to equatorial radii, i.e. the star’s oblateness, and the surface temperature as a function of latitude (e.g., Barnes et al., 2011; Masuda, 2015; Zhou et al., 2019; Ahlers et al., 2020a, b; Garai et al., 2021).
Recently, a number of ultra-hot gas giants transiting rapidly rotating A-type stars have been the focus of detailed transmission spectroscopy campaigns due to their novel atmospheric chemistry and high signal-to-noise absorption signatures (Yan & Henning, 2018; Hoeijmakers et al., 2019; Cauley et al., 2019; Casasayas-Barris et al., 2019; Nugroho et al., 2020; Hoeijmakers et al., 2020; Stangret et al., 2020; Rainer et al., 2021; Yan et al., 2021; Cauley et al., 2021; Bello-Arufe et al., 2021). Given the intense interest in these systems, and the likely discovery of more such objects in the TESS data, it is important to understand the magnitude and details of how gravity darkening can affect the observed transmission spectrum.
In this paper we explore this question for two ultra-hot Jupiter systems, KELT-9 b (Gaudi et al., 2017) and HAT-P-70 b (Zhou et al., 2019), by comparing transmission spectroscopy models of strong atomic transitions for the gravity-darkened and non-gravity darkened cases. KELT-9 b and HAT-P-70 b are useful cases to examine due to the large spin-orbit misalignment in both systems, which results in the planets transiting chords of non-uniform temperature. For both systems we compare the transit light curves and the transmission spectrum line profile morphology, for each atomic absorber, in the case of a gravity-darkened and uniform temperature host star. In Section 2 we derive the gravity-darkened parameters of both systems using TESS photometry. We then describe the transmission spectrum models in Section 3 and show the model comparisons in Section 4. We finish by summarizing our main findings in Section 5.
2 GRAVITY-DARKENED STELLAR PARAMETERS
In our analysis of the KELT-9 and HAT-P-70 systems, we account for the rapid rotation observed in both host stars. Rapid rotation induces two effects on a star that change its total flux output. First, the star flattens into an oblate shape, with an equatorial radius larger than a polar radius. Second, the star’s effective temperature varies in a pole-to-equator gradient, with hot, bright poles and a cooler, dim equator.
We model these effects in both stars using the rotating star model derived in Espinosa Lara & Rieutord (2011). Our transit fitting model accounts for stellar flattening and gravity darkening following the same path established by Barnes (2009), but with the von Zeipel theorem (Von Zeipel, 1924) replaced by the Roche model of a rotating star. We model each system’s primary transit using Equations 6 and 7 of Barnes (2009), but we use updated expressions for the star’s flattening and temperature gradient due to rotation. We calculate each host star’s radius and effective temperature using Equations 30 and 31, respectively, from Espinosa Lara & Rieutord (2011). These equations replace the expressions in Barnes (2009) for stellar radius and temperature (Equations 12 and 9, respectively). Aside from these changes, we follow the transit-fitting method derived in Barnes (2009) and applied in several works (e.g., Barnes et al., 2011; Ahlers et al., 2014, 2020a, 2020b).
For both stars, we measure gravity-darkened stellar parameters from TESS photometry using the same approach as Ahlers et al. (2020a). We use the light curve fitting package transitfitter (Barnes, 2009), which accounts for gravity darkening in primary transit photometry and which has been updated to use the rotating star model derived in Espinosa Lara & Rieutord (2011). Taking advantage of the asymmetry in the primary transit of both systems, we measure each planet’s projected alignment and the stellar inclination, which together yield the planet’s true spin-orbit angle. We simultaneously fit for the stellar rotation rate, oblateness, and temperature gradient, yielding a full description of each host star’s gravity darkening. The best-fit parameters for each system are given in Section 2. We show the best-fit models to the TESS photometry in Figure 1 and list relevant parameters of both systems in Section 2. We show the best-fit temperature as a function of co-latitude for both planets in Figure 2.
Our measured values for HAT-P-70 differ slightly from the measured values in Zhou et al. (2019). Specifically, our measured stellar inclination of degrees does not overlap with their results of degrees. This difference likely occurs due to the difference in our stellar models. Zhou et al. (2019) used the von Zeipel rotating star model (Von Zeipel, 1924) and fit the gravity-darkening exponent , which serves as a scaling factor for the strength of the star’s temperature gradient. In this work, we use the rotating star model derived in Espinosa Lara & Rieutord (2011), which does not include a term. As a comparison, we find that the that best recreates the temperature gradient in the Espinosa Lara & Rieutord (2011) model is , which is significantly lower than the measured value in Zhou et al. (2019). A higher can skew values toward (Barnes, 2009). Therefore, our HAT-P-70 results likely differ from Zhou et al. (2019) because we model the star’s temperature to vary less between equator and pole. We note that Espinosa Lara & Rieutord (2011) use two-dimensional rotating star models to find the best-fit values as a function of stellar oblateness. They find that for HAT-P-70’s oblateness value . Thus we recommend that future studies of HAT-P-70 adopt the slightly lower values of found here and in Espinosa Lara & Rieutord (2011) to better approximate HAT-P-70’s temperature gradient.
We also find slightly different stellar parameters for KELT-9 b compared with those from Ahlers et al. (2020a). This is again likely the result of our implementation of the rotating star model from Espinosa Lara & Rieutord (2011) compared with the use of the von Zeipel theorem in Ahlers et al. (2020a). We find a slightly hotter, slightly less oblate star than Ahlers et al. (2020a). Our derived rotation period for KELT-9 is also longer, although the values from both studies are consistent at the level.
 |
 |
| KELT-9 | HAT-P-70 | ||||
|---|---|---|---|---|---|
| Parameter | Description | Value | Reference | Value | Reference |
| Uniform surface parameters: | |||||
| Stellar mass | () | 1 | 2 | ||
| Stellar radius | () | 1 | 2 | ||
| Stellar surface gravity | log (cm -2) | 1 | 2 | ||
| Effective temperature | (K) | 1 | 2 | ||
| Metallicity† | [Fe/H] | 1 | 2 | ||
| Stellar rotational velocity | sin (km s-1) | 1 | 2 | ||
| Gravity-darkened parameters: | |||||
| Stellar equatorial radius | () | 3 | 3 | ||
| Stellar oblateness | 3 | 3 | |||
| Stellar inclination⋆ | (∘) | 3 | 3 | ||
| Stellar rotation period | (hours) | 3 | 3 | ||
| Polar effective temperature | (K) | 3 | 3 | ||
| Equatorial effective temperature | (K) | 3 | 3 | ||
| Planetary parameters: | |||||
| Projected alignment angle | (∘) | 3 | 3 | ||
| Orbital inclination | (∘) | 3 | 3 | ||
| Orbital period | (days) | 1 | 2 | ||
| Semi-major axis | (AU) | 1 | 2 | ||
| Planetary radius | () | 1 | 2 | ||
| Transit duration | (days) | 1 | 2 | ||


Once we have the range of temperatures from the equator to the pole we generate synthetic spectra across that temperature range using Spectroscopy Made Easy (SME; Piskunov & Valenti, 2017). For each atomic transition of interest we create stellar spectra in steps of K from the maximum polar temperature down to the equatorial temperature. At each temperature we also synthesize spectra at 15 different values of , where is the latitude on the stellar surface, to account for limb darkening and center-to-limb variations. In Figure 3 we show the disk-center () spectra for the approximate polar and equatorial temperatures of each star. In general, the temperature gradient between pole and equator is not large enough to dramatically change the depth and shape of most atomic absorption lines. The most noticeable difference is the relative flux levels of the pole versus the equator, which will impact the shape of the spectroscopic light curve (see Section 4).
We then populate a Cartesian grid of the stellar surface, where each pixel has dimensions , by interpolating the synthesized spectra onto the specific temperature and value of each pixel, while also accounting for the local rotational velocity of the star. The result is a cube with two spatial axes and a wavelength axis containing a velocity-shifted and limb-darkened spectrum at each point on the oblate and inclined stellar surface. By summing over the stellar surface, i.e., the spatial dimensions of the cube, we generate the star’s integrated spectrum which is used as the out-of-transit spectrum in the transmission calculations. We display the final surface temperature maps, accounting for stellar inclination, in Figure 4. We also show the planet transit chords which are calculated using EXOFAST (Eastman et al., 2013).
3 TRANSMISSION SPECTRUM MODELS
We use parameterized atmospheric models to calculate transmission spectra for KELT-9 b and HAT-P-70 b. The models are the same as those described in Cauley et al. (2019) and Cauley et al. (2021) and we briefly review them here. The planetary atmosphere is parameterized by the following values: the number density of the relevant atomic species, the radial distance above the optical planet radius, the thermal broadening , Lorentzian broadening , and rotational broadening . For simplicity we assume a uniform density atmosphere. We stress that the specific values of these parameters chosen for this study are not important since we are interested in the relative changes between the gravity darkened and non-gravity darkened cases. Thus we are more concerned with consistency of the planetary parameters between the gravity darkened and uniform temperature scenarios and less concerned about the accuracy of the atmospheric absorption compared with observations. No current detections of HAT-P-70 b’s atmosphere have been published and we chose KELT-9 b’s atmospheric parameters to roughly match the line depths and morphologies from the literature (Yan & Henning, 2018; Cauley et al., 2019; Hoeijmakers et al., 2019).
We construct the planet’s atmosphere on a Cartesian grid with the same spatial resolution as the stellar grid described in Section 2. Once the 3D atmosphere is generated we collapse the 3D grid into a 2D grid of column densities at each pixel in the planet’s atmosphere. We note that our assumptions of a spherically symmetric and uniform density atmosphere render 3D treatment unnecessary; however, the code is built to handle non-symmetric cases and 3D velocity fields so the initial 3D structure is critical in these cases. We then extinct the stellar spectrum at each pixel with non-zero column density, accounting for all sources of velocity shifts (e.g., the local planetary orbital and rotational velocities) and line broadening. We ignore multiple scattering events and refraction given their negligible impact on the transmission spectra of hot Jupiters (e.g., Bétrémieux, 2016; Robinson et al., 2017).
We simulate transmission spectra for three different atomic transitions that have been detected in a number of hot and ultra-hot Jupiter atmospheres: the Balmer line H, the Na I D2 5889.95 Å doublet member, and an Fe II transition at 5169.03 Å. We chose this particular Fe II line because it was one of the strongest Fe II transitions detected in the atmospheres of KELT-9 b and KELT-20 b (Cauley et al., 2019; Casasayas-Barris et al., 2019), although our results are applicable to other Fe II lines with similar temperature sensitivity. The atomic line parameters are sourced from the NIST Atomic Spectra Database111https://dx.doi.org/10.18434/T4W30F.
For each line we calculate the transmission spectrum at 200 equally spaced points across the transit chords shown in Figure 4. We repeat the transmission spectrum calculations for the uniform temperature case. We then shift the transmission spectra into the rest frame of the planet and calculate an average in-transit transmission spectrum which excludes transit points during ingress and egress. We also calculate spectroscopic light curves for each line by integrating the equivalent width of the planetary rest-frame transmission spectrum across 1.5 Å centered on the rest wavelength of the transition.
4 RESULTS

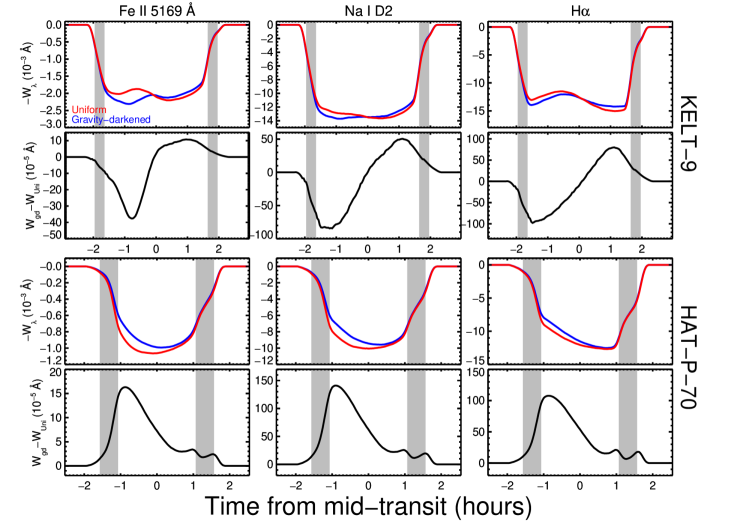
We show the results of our simulations in Figure 5 and Figure 6 which detail differences in the average transmission spectra and spectroscopic light curves, respectively. In both figures we display the gravity darkened case in blue and the uniform temperature case in red. In the first and third rows of each figure we show the two different cases plotted on top of one another and in the second and fourth rows we plot the difference between the gravity-darkened and uniform temperature simulations.
It is immediately clear from Figure 5 that the difference between gravity-darkened transmission spectra and those calculated using a uniform temperature stellar surface is small in all cases. For KELT-9 b the difference is for all lines; for HAT-P-70 b the differences are larger but still below the level of . There are small changes in line morphology for H in both systems and a small difference in morphology for Na I D2 for KELT-9 but the line shape changes are an order of magnitude smaller than the already negligible changes in line depth. We note that any morphology changes between the gravity-darkened and uniform scenarios are too small to result in a detectable velocity shift in the transmission spectrum. Thus wind measurements for hot and ultra-hot Jupiters, which are generally on the order of a few kilometers per second (e.g., Brogi et al., 2016; Seidel et al., 2019; Ehrenreich et al., 2020; Bello-Arufe et al., 2021), are likely unaffected by the assumption of a uniform surface temperature.
Currently, the most sensitive telescope-spectrograph combinations can achieve uncertainties on average optical atomic transmission spectra of for hot Jupiters around magnitude stars (e.g., Cauley et al., 2019; Yan et al., 2021; Cauley et al., 2021). Cross-correlation retrievals of metal species can reach precision levels of by leveraging absorption from many lines of single atomic or molecular species (e.g., Hoeijmakers et al., 2019; Ehrenreich et al., 2020; Hoeijmakers et al., 2020; Bello-Arufe et al., 2021), although in this case the interpretation of changes in line depth, i.e., whether or not differences in line depth can be attributed to gravity-darkening, may be obscured by the effective co-adding of dozens or hundreds of lines. We speculate that changes in the cross-correlation signal strength due to gravity-darkening would be even smaller than in the single line case since changes in the more temperature-sensitive transitions will be averaged out by the less temperature-sensitive lines in the cross-correlation analysis. Thus the possible differences induced by gravity-darkening are comparable to the noise levels in the most precise high-resolution transmission spectrum signals presently achievable.
The differences in the spectroscopic light curves from Figure 6 are potentially more interesting. For both objects, which have very different transit chords, the spectroscopic light curves change in both shape and depth for all of the atomic lines. For KELT-9 b the gravity-darkened case shows deeper absorption at the beginning of the transit and shallower absorption near the end which reflects the fact that the planet’s transit chord initially crosses the hotter polar region and then the cooler equatorial region. For HAT-P-70 b the transit chord primarily intersects the cooler equatorial region which produces the uniformly weaker spectroscopic light curves for the gravity-darkened case. For both systems the equivalent width differences between the gravity-darkened and uniform temperature curves is . Thus a general rule for determining how the transmission spectrum of a planet will change when gravity-darkening is included is to estimate the difference between the uniform value and the average temperature of the stellar surface being occulted. If the occulted region is cooler, the gravity-darkened transit will be shallower; if it is hotter then the gravity-darkened transit will be stronger. Thus the flux contribution from the local stellar surface is more important for the strength of the transmission spectrum than changes in the photospheric line strength due to the stellar temperature gradient.
The difference in shape between the uniform and gravity-darkened case for KELT-9 b is informative concerning the negligible difference in the planet’s average transmission spectrum: the transmission spectra during the first half of the transit are deeper in the gravity-darkened case but then are weaker during the second half. The in-transit spectra thus average out to be quite similar to those from the uniform temperature scenario. The same reasoning illustrates why HAT-P-70 b’s gravity-darkened spectra are shallower: the entire spectroscopic light curve is shallower thus resulting in weaker average transmission spectra.

Although the differences between the light curves in Figure 6 are small, they are approaching the level of the uncertainties for individual equivalent width, or absorption percentage, in hot planet spectroscopic time series measurements. For example, Cauley et al. (2019) report uncertainties on H transmission spectrum equivalent widths of for KELT-9 b. Yan et al. (2021), using the HARPS-N and CARMENES instruments, are able to achieve errors on individual H transmission spectrum equivalent widths of for WASP-33 b. Assuming similar transmission efficiencies for the next generation of high-resolution optical spectrographs and the collecting area of a 30-meter telescope versus a 10-meter facility, spectroscopic light curve uncertainties for individual atomic lines could reach the level of . Such precision would allow the uniform and gravity-darkened cases to be distinguished for systems with pole-to-equator temperature differentials similar to those for KELT-9 and HAT-P-70.
5 CONCLUSIONS
We explored how non-uniform stellar surface temperatures, caused by gravity-darkening as a result of high stellar spin rates, can affect the observed atomic transmission spectra of short-period giant planets. We focus on two systems, KELT-9 b and HAT-P-70 b, and find that the magnitude of the gravity-darkening effect is currently comparable to or smaller than the noise levels achievable for high-resolution transmission spectra using state-of-the-art facilities. Although we specifically simulate two systems our results should be widely applicable to any hot and ultra-hot Jupiters transiting gravity-darkened stars. In other words, the magnitude of the gravity-darkening effect should be comparable for most similar systems of interest. Other effects at play in the interpretation and modeling of high-resolution transmission spectra are currently more important considering the present level of achievable precision (e.g., stellar activity, accurate modeling of CLVs and the planetary Doppler shadow, intrinsic atmospheric variability). For the time being we suggest that gravity-darkened stellar surfaces can safely be ignored when modeling and interpreting high-resolution transmission spectra of hot gas giants. However, it is likely that the era of 30-meter telescopes will require gravity-darkening to be taken into account when modeling transmission spectra of planet’s orbiting such stars.
We thank the referee for their careful reading of the manuscript, which resulted in a much improved paper. This research has made use of the NASA Exoplanet Archive, which is operated by the California Institute of Technology, under contract with the National Aeronautics and Space Administration under the Exoplanet Exploration Program. Additionally, this work has made use of NASA’s Astrophysical Data System and of the SIMBAD database, which is operated at CDS, Strasbourg, France. This work has also made use of the VALD database, operated at Uppsala University, the Institute of Astronomy RAS in Moscow, and the University of Vienna.
References
- Ahlers et al. (2014) Ahlers, J. P., Seubert, S. A., & Barnes, J. W. 2014, The Astrophysical Journal, 786, 131
- Ahlers et al. (2020a) Ahlers, J. P., Johnson, M. C., Stassun, K. G., et al. 2020a, AJ, 160, 4, doi: 10.3847/1538-3881/ab8fa3
- Ahlers et al. (2020b) Ahlers, J. P., Kruse, E., Colón, K. D., et al. 2020b, ApJ, 888, 63, doi: 10.3847/1538-4357/ab59d0
- Allart et al. (2018) Allart, R., Bourrier, V., Lovis, C., et al. 2018, Science, 362, 1384, doi: 10.1126/science.aat5879
- Barnes (2009) Barnes, J. W. 2009, ApJ, 705, 683, doi: 10.1088/0004-637X/705/1/683
- Barnes et al. (2011) Barnes, J. W., Linscott, E., & Shporer, A. 2011, ApJS, 197, 10, doi: 10.1088/0067-0049/197/1/10
- Bello-Arufe et al. (2021) Bello-Arufe, A., Cabot, S. H. C., Mendonça, J. M., Buchhave, L. A., & Rathcke, A. D. 2021, arXiv e-prints, arXiv:2112.03292. https://arxiv.org/abs/2112.03292
- Bétrémieux (2016) Bétrémieux, Y. 2016, MNRAS, 456, 4051, doi: 10.1093/mnras/stv2955
- Bourrier et al. (2013) Bourrier, V., Lecavelier des Etangs, A., Dupuy, H., et al. 2013, A&A, 551, A63, doi: 10.1051/0004-6361/201220533
- Bourrier et al. (2018) Bourrier, V., Lecavelier des Etangs, A., Ehrenreich, D., et al. 2018, A&A, 620, A147, doi: 10.1051/0004-6361/201833675
- Brogi et al. (2016) Brogi, M., de Kok, R. J., Albrecht, S., et al. 2016, ApJ, 817, 106, doi: 10.3847/0004-637X/817/2/106
- Casasayas-Barris et al. (2017) Casasayas-Barris, N., Palle, E., Nowak, G., et al. 2017, A&A, 608, A135, doi: 10.1051/0004-6361/201731956
- Casasayas-Barris et al. (2019) Casasayas-Barris, N., Pallé, E., Yan, F., et al. 2019, A&A, 628, A9, doi: 10.1051/0004-6361/201935623
- Cauley et al. (2018) Cauley, P. W., Kuckein, C., Redfield, S., et al. 2018, AJ, 156, 189, doi: 10.3847/1538-3881/aaddf9
- Cauley et al. (2019) Cauley, P. W., Shkolnik, E. L., Ilyin, I., et al. 2019, AJ, 157, 69, doi: 10.3847/1538-3881/aaf725
- Cauley et al. (2021) Cauley, P. W., Wang, J., Shkolnik, E. L., et al. 2021, AJ, 161, 152, doi: 10.3847/1538-3881/abde43
- Czesla et al. (2015) Czesla, S., Klocová, T., Khalafinejad, S., Wolter, U., & Schmitt, J. H. M. M. 2015, A&A, 582, A51, doi: 10.1051/0004-6361/201526386
- Deming et al. (2013) Deming, D., Wilkins, A., McCullough, P., et al. 2013, ApJ, 774, 95, doi: 10.1088/0004-637X/774/2/95
- Eastman et al. (2013) Eastman, J., Gaudi, B. S., & Agol, E. 2013, PASP, 125, 83, doi: 10.1086/669497
- Ehrenreich et al. (2015) Ehrenreich, D., Bourrier, V., Wheatley, P. J., et al. 2015, Nature, 522, 459, doi: 10.1038/nature14501
- Ehrenreich et al. (2020) Ehrenreich, D., Lovis, C., Allart, R., et al. 2020, Nature, 580, 597, doi: 10.1038/s41586-020-2107-1
- Espinosa Lara & Rieutord (2011) Espinosa Lara, F., & Rieutord, M. 2011, A&A, 533, A43, doi: 10.1051/0004-6361/201117252
- Garai et al. (2021) Garai, Z., Pribulla, T., Parviainen, H., et al. 2021, MNRAS, 508, 5514, doi: 10.1093/mnras/stab2929
- Gaudi et al. (2017) Gaudi, B. S., Stassun, K. G., Collins, K. A., et al. 2017, Nature, 546, 514, doi: 10.1038/nature22392
- Herman et al. (2018) Herman, M. K., de Mooij, E. J. W., Huang, C. X., & Jayawardhana, R. 2018, AJ, 155, 13, doi: 10.3847/1538-3881/aa991f
- Hoeijmakers et al. (2019) Hoeijmakers, H. J., Ehrenreich, D., Kitzmann, D., et al. 2019, A&A, 627, A165, doi: 10.1051/0004-6361/201935089
- Hoeijmakers et al. (2020) Hoeijmakers, H. J., Cabot, S. H. C., Zhao, L., et al. 2020, A&A, 641, A120, doi: 10.1051/0004-6361/202037437
- Johnson et al. (2018) Johnson, M. C., Rodriguez, J. E., Zhou, G., et al. 2018, AJ, 155, 100, doi: 10.3847/1538-3881/aaa5af
- Kreidberg et al. (2014) Kreidberg, L., Bean, J. L., Désert, J.-M., et al. 2014, Nature, 505, 69, doi: 10.1038/nature12888
- Masuda (2015) Masuda, K. 2015, ApJ, 805, 28, doi: 10.1088/0004-637X/805/1/28
- Nugroho et al. (2020) Nugroho, S. K., Gibson, N. P., de Mooij, E. J. W., et al. 2020, MNRAS, 496, 504, doi: 10.1093/mnras/staa1459
- Piskunov & Valenti (2017) Piskunov, N., & Valenti, J. A. 2017, A&A, 597, A16, doi: 10.1051/0004-6361/201629124
- Rackham et al. (2018) Rackham, B. V., Apai, D., & Giampapa, M. S. 2018, ApJ, 853, 122, doi: 10.3847/1538-4357/aaa08c
- Rainer et al. (2021) Rainer, M., Borsa, F., Pino, L., et al. 2021, A&A, 649, A29, doi: 10.1051/0004-6361/202039247
- Redfield et al. (2008) Redfield, S., Endl, M., Cochran, W. D., & Koesterke, L. 2008, ApJ, 673, L87, doi: 10.1086/527475
- Robinson et al. (2017) Robinson, T. D., Fortney, J. J., & Hubbard, W. B. 2017, ApJ, 850, 128, doi: 10.3847/1538-4357/aa951e
- Salz et al. (2018) Salz, M., Czesla, S., Schneider, P. C., et al. 2018, A&A, 620, A97, doi: 10.1051/0004-6361/201833694
- Seidel et al. (2019) Seidel, J. V., Ehrenreich, D., Pino, L., et al. 2019, arXiv e-prints, arXiv:1912.02787. https://arxiv.org/abs/1912.02787
- Seidel et al. (2020) Seidel, J. V., Ehrenreich, D., Bourrier, V., et al. 2020, A&A, 641, L7, doi: 10.1051/0004-6361/202038497
- Sing et al. (2016) Sing, D. K., Fortney, J. J., Nikolov, N., et al. 2016, Nature, 529, 59, doi: 10.1038/nature16068
- Stangret et al. (2020) Stangret, M., Casasayas-Barris, N., Pallé, E., et al. 2020, A&A, 638, A26, doi: 10.1051/0004-6361/202037541
- Szabó et al. (2020) Szabó, G. M., Pribulla, T., Pál, A., et al. 2020, MNRAS, 492, L17, doi: 10.1093/mnrasl/slz177
- Valenti & Piskunov (1996) Valenti, J. A., & Piskunov, N. 1996, A&AS, 118, 595
- Von Zeipel (1924) Von Zeipel, H. 1924, Monthly Notices of the Royal Astronomical Society, 84, 684
- Watanabe et al. (2020) Watanabe, N., Narita, N., & Johnson, M. C. 2020, PASJ, 72, 19, doi: 10.1093/pasj/psz140
- Weaver et al. (2021) Weaver, I. C., López-Morales, M., Alam, M. K., et al. 2021, AJ, 161, 278, doi: 10.3847/1538-3881/abf652
- Wyttenbach et al. (2015) Wyttenbach, A., Ehrenreich, D., Lovis, C., Udry, S., & Pepe, F. 2015, A&A, 577, A62, doi: 10.1051/0004-6361/201525729
- Yan et al. (2015) Yan, F., Fosbury, R. A. E., Petr-Gotzens, M. G., Zhao, G., & Pallé, E. 2015, A&A, 574, A94, doi: 10.1051/0004-6361/201425220
- Yan & Henning (2018) Yan, F., & Henning, T. 2018, Nature Astronomy, 2, 714, doi: 10.1038/s41550-018-0503-3
- Yan et al. (2017) Yan, F., Pallé, E., Fosbury, R. A. E., Petr-Gotzens, M. G., & Henning, T. 2017, A&A, 603, A73, doi: 10.1051/0004-6361/201630144
- Yan et al. (2021) Yan, F., Wyttenbach, A., Casasayas-Barris, N., et al. 2021, A&A, 645, A22, doi: 10.1051/0004-6361/202039302
- Zhang et al. (2021) Zhang, M., Knutson, H. A., Wang, L., et al. 2021, arXiv e-prints, arXiv:2106.05273. https://arxiv.org/abs/2106.05273
- Zhou et al. (2019) Zhou, G., Huang, C. X., Bakos, G. Á., et al. 2019, AJ, 158, 141, doi: 10.3847/1538-3881/ab36b5