The effect of magnetic field on the inner Galactic rotation curve
Abstract
In the past few decades, some studies pointed out that magnetic field might affect the rotation curves in galaxies. However, the impact is relatively small compared with the effects of dark matter and the baryonic components. In this letter, we revisit the impact of magnetic field on the rotation curve of our Galaxy. We show that the inner Galactic rotation curve could be affected significantly by the magnetic field. The addition of the inner bulge component, which has been proposed previously to account for the inner rotation curve data, is not necessary. The magnetic field contribution can fully account for the excess of the inner rotation velocity between 5 pc to 50 pc from the Galactic Centre. Our analysis can also constrain the azimuthal component of the central regular magnetic field strength to G, which is consistent with the observed range.
keywords:
Galaxy: centre; Galaxy: kinematics and dynamics1 Introduction
The rotation curves of galaxies are important indicators of mass distribution in galaxies. Many rotation curves were revealed by the neutral atomic gas (e.g. HI, CO) which is believed to be a very good tracer of the gravitational field (e.g. Spitzer Photometry and Accurate Rotation Curves (Lelli, McGaugh & Schombert, 2016)). In particular, many past studies have shown that large-scale magnetic field can affect the gas dynamics in spiral galaxies (Piddington, 1964; Nelson, 1988; Battaner et al., 1992; Battaner & Florido, 1995). Some studies even show that this magnetic field effect can explain the flatness of rotation curves in galaxies without the need of dark matter (Nelson, 1988; Battaner et al., 1992; Battaner & Florido, 1995). This is known as the ‘magnetic alternative to dark matter’ (Sánchez-Salcedo & Reyes-Ruiz, 2004). Nevertheless, later studies have shown that the boost of rotation curves due to magnetic field contribution is less than 20 km/s at the outermost point of rotation curves (Sánchez-Salcedo & Reyes-Ruiz, 2004; Sánchez-Salcedo & Santillán A., 2013). Since then, the ‘magnetic alternative to dark matter’ was no longer a popular model.
In the past decade, the idea of the magnetic field effect on galactic rotation curves was revived. Some studies have shown that the magnetic field effect can explain why rotation curves in some galaxies start to rise again at the outer edges of the HI discs, such as our Galaxy (Ruiz-Granados et al., 2012) and the M31 galaxy (Ruiz-Granados et al., 2010). Considering the effects of magnetic field can somewhat improve the fits of the outer part of galactic rotation curves. However, some other studies have argued that the effect in the outer rotation curve region is not very significant (Sánchez-Salcedo & Santillán A., 2013; Elstner, Beck & Gressel, 2014).
Although the effect of magnetic field in the outer rotation curve region has been greatly debated, such effect in the inner region of a galaxy has not been discussed thoroughly. In this letter, we particularly investigate the magnetic field effect on the inner rotation curve of our Galaxy. There is a small rotation velocity excess range (between 5 pc to 50 pc from the Galactic Centre) which could not be accounted by the contributions of the supermassive black hole and the central bulge component (Sofue, 2013). An extra inner bulge has to be added to account for this abnormal excess range. We show that this small excess range could be explained by the magnetic field effect so that adding the extra inner bulge component is not necessary.
2 Magnetic field effect on rotation curve
In a gaseous disc in equilibrium, magnetic field effects on the gas can be modelled as a pressure term in the asymmetric drift (Sánchez-Salcedo & Santillán A., 2013). Such asymmetric drift is a consequence of the support by thermal, turbulent, cosmic ray and magnetic pressures. The dynamical effects of the regular magnetic field can significantly boost the gravitational orbital velocity due to the magnetic tension (Nelson, 1988). The total magnetic field in a galaxy can be simply expressed as a sum of the regular field term (the azimuthal component) and a random field term (the turbulent magnetic field component) (Sánchez-Salcedo & Santillán A., 2013; Elstner, Beck & Gressel, 2014). In particular, the random field can be isotropic or anisotropic. The contribution of the regular magnetic field component to the circular velocity is given by (Ruiz-Granados et al., 2010)
| (1) |
where is the gas density and is the radial distance from the Galactic Centre. The random magnetic field component would contribute to the circular velocity via the magnetic pressure term as (Sánchez-Salcedo & Santillán A., 2013)
| (2) |
where is the mean-square value of the random magnetic field strength. Therefore, the total contribution of the magnetic field to the circular velocity is:
| (3) |
In the inner Galactic Centre region ( pc), the rotation curve is also contributed by the supermassive black hole and the baryonic bulge components. Therefore, including the magnetic field contribution, the observed total rotation curve is
| (4) |
The supermassive black hole rotation curve contribution is
| (5) |
where is the mass of the supermassive black hole (Abuter et al., 2020). The bulge mass density can be modeled by the exponential spheroid model with scale radius as (Sofue, 2013):
| (6) |
where is the central bulge mass density. Therefore, the bulge rotation curve contribution is given by
| (7) |
where and (Sofue, 2013). We take the values and kpc obtained in Sofue (2013) to perform our analysis.
To match the inner Galactic rotation curve data without considering the magnetic field contribution, two bulge components (inner bulge and outer bulge) were assumed in previous studies (Sofue, 2013). However, in the followings, we will investigate whether the magnetic field contribution can mimic the effect of the inner bulge component. Therefore, we assume that there is only one bulge component to minimise the number of parameters in our analysis.
Moreover, the dark matter contribution is not considered here because it is not significant in the inner Galactic Centre region ( pc). Assuming the Navarro-Frenk-White (NFW) profile (Navarro, Frenk & White, 1997), the total mass of dark matter is less than 5% of the bulge mass inside 500 pc, with the fitted parameters in Sofue (2015). Therefore, we neglect the contribution of dark matter for simplicity. We also neglect the gravitational contribution of gas in the inner Galactic Centre region as the gas mass is less than 3% of the bulge mass inside 500 pc (Ferrière, Gillard & Jean, 2007).
Over pc along the Galactic plane and pc in the vertical direction at the Galactic Centre, the magnetic field is approximately horizontal and the strength is very strong, which can range from mG for general intercloud medium (Ferrière, 2009). The equipartition between magnetic field energy and turbulent energy suggests that (Schleicher et al., 2010). This is also supported by the observed relation between magnetic field and star-formation rate (Heesen et al., 2014; Tabatabaei et al., 2017). Therefore, we assume that the regular magnetic field profile follows the exponential spheroid model as
| (8) |
where is the central regular magnetic field strength. Note that Eq. (8) follows from Eq. (6) only if gas density is assumed to be proportional to the baryonic bulge mass density . For the random magnetic field, it is an important component in the interstellar medium of galaxies (Beck et al., 2019). We define as the ratio of the regular magnetic field to the total magnetic field so that the random magnetic field strength can be expressed as . Although some earlier studies found that the ratio is around in some galaxies (Fletcher et al., 2004; Beck, 2007; Sánchez-Salcedo & Santillán A., 2013), recent studies have shown that these ordered fields are dominated by anisotropic random fields and the ratio should be in galactic disk region (Beck et al., 2019). Nevertheless, the actual value of at the Galactic Centre is uncertain and the value of may be larger. In the followings, we will first assume . Then, we will also demonstrate the cases for and for comparison.
For the gas density, observational data show that the gas number density is close to cm-3 at the inner Galactic Centre and cm-3 out to pc along the Galactic plane (Ferrière, Gillard & Jean, 2007; Ferrière, 2009). We follow Ferrière, Gillard & Jean (2007) to assume that the gas density decreases exponentially with for small and then approaches a constant value when becomes large. Therefore, we write the gas density profile as
| (9) |
Putting Eq. (8) and Eq. (9) into Eq. (3), we get
| (10) |
where , . Here, and are free parameters in our model.
3 Data analysis
The inner rotation curve data have been obtained in Sofue (2013). We will focus on the region pc because the rotation curve attains its maximum at around pc. At this position, the percentage contribution of the bulge component is maximised. Larger than pc, the dark matter and disc components start to contribute more to the Galactic rotation curve. We fit our predicted total rotation curve with the observed data . To quantify the goodness of fits, we calculate the reduced value of the fits, which is defined as
| (11) |
where is the uncertainty of the observed rotation curve data, is the total number of data points and is the number of free parameters. Here, we have .
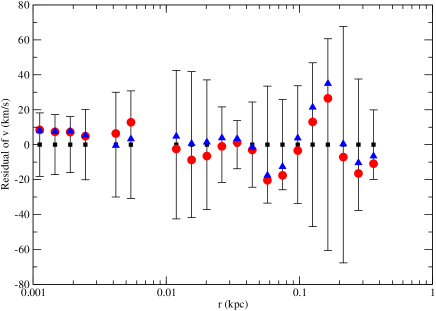
In Fig. 1, we present the best fit of our model (with ) and separate the corresponding rotation curve contributions. The best-fit values are km/s and , with . We can see that including the magnetic field contribution could provide an excellent fit to the observed inner rotation curve without introducing any inner bulge component suggested in Sofue (2013). The reduced value for adding an inner bulge component without magnetic field contribution is , almost the same goodness of fit. Note that the contribution of the magnetic field effect to the rotation velocity could be slightly negative when kpc. Fig. 2 shows the comparison of the residual plots between the Galactic total rotation curve data and the two scenarios. No systematic trend of the residuals is shown for both scenarios.
At the Galactic Centre, the gas density is , where is the proton mass. If we take the asymptotic number density cm-3 (Ferrière, Gillard & Jean, 2007), we have g/cm3. Using the best-fit values and km/s, we get g/cm-3 (i.e. cm-3) and G. These values are consistent with the number density observed and the central total magnetic field constrained ( G) (Ferrière, Gillard & Jean, 2007; Ferrière, 2009; Guenduez et al., 2020).
As the actual value of at the Galactic Centre is uncertain, we also investigate the cases for and . For , we also get a very good fit with km/s ( G) and (). However, for , a relatively poor fit is obtained (). We plot the corresponding components and the total rotation curves fitted in Fig. 3. Generally speaking, for , a very good fit would be obtained ().


4 Discussion
In this letter, we show that adding the magnetic field contribution can satisfactorily explain the inner Galactic rotation curve data without invoking an inner bulge component. The magnetic field effect on rotation curve is a predicted effect in magneto-hydrodynamics (MHD). Our results provide an indirect evidence that magnetic field can affect the galactic rotation curve significantly. Previous studies have shown that the magnetic field contribution cannot boost the gas rotating speed by more than 20 km/s in the outermost region (Sánchez-Salcedo & Santillán A., 2013). Now we show that such effect can be large in the central region of a galaxy. The maximum contribution of the magnetic field on the rotation curve is 97 km/s at pc.
In our analysis, we have assumed that magnetic field strength traces the baryonic distribution (i.e. the bulge density), which is predicted by theoretical models. For example, numerical simulations and the equipartition theory show that the magnetic field strength follows the baryonic density in galaxy clusters and galaxies (Dolag et al., 2001; Govoni et al., 2017; Schleicher et al., 2010) and it is supported by observational data (Heesen et al., 2014; Tabatabaei et al., 2017; van Weeren et al., 2019). Our constrained magnetic field strength at the Galactic Centre ( G) is also consistent with the order of magnitude of the observed total magnetic field strength G (Ferrière, 2009; Guenduez et al., 2020). These could be verified by future observational data of magnetic field at the Galactic Centre. Moreover, we have first taken the value of to be a constant . Some other studies have found that the magnetic field strength might be dominated by anisotropic random field rather than the regular field (Houde et al., 2013; Beck et al., 2019). The value of can be as small as for the disk region in spiral galaxies (Beck et al., 2019). However, some studies have revealed a very large regular field strength mG at the Galactic Centre (Eatough et al., 2013). Therefore, the actual value of in the Galactic Centre region is uncertain. We have particularly investigated the cases of and for comparison. We have found that can also give a good fit for the data. Generally, could provide good fits with the rotation curve data without invoking the inner bulge component. Further radio observations are definitely required to examine the value of as well as our model presented.
On the other hand, we have also assumed that the gas density follows the exponential density profile in the deep central region and approaches a constant value at a relatively large pc. The constant gas density at pc is supported by observational data (Ferrière, Gillard & Jean, 2007; Ferrière, 2009). We have also tried the isothermal density profile, which is commonly used as a model for interstellar medium (Kalashnikov & Chechetkin, 2022), to model the gas density distribution. A good fit can still be obtained (with G and ). Therefore, our results are not very sensitive to the gas density profile assumed.
To conclude, we show that magnetic field can affect inner rotation curve significantly. We anticipate that such effect can also be seen in the inner region of other galaxies. Future high-quality observations of the inner galactic rotation curves could verify our suggestion.
5 acknowledgements
We thank the anonymous referee for useful constructive feedback and comments. This work was partially supported by the Seed Funding Grant (RG 68/2020-2021R) and the Dean’s Research Fund (activity code: 04628) from The Education University of Hong Kong.
6 Data availability statement
The data underlying this article will be shared on reasonable request to the corresponding author.
References
- Abuter et al. (2020) Abuter R. et al., 2020, Astron. Astrophys. 636, L5.
- Battaner et al. (1992) Battaner E., Garrido J. L., Membrado M. & Florido E., 1992, Nature 360, 652.
- Battaner & Florido (1995) Battaner E. & Florido E., 1995, Mon. Not. R. Astron. Soc. 277, 1129.
- Beck (2007) Beck R., 2007, Astron. Astrophys. 470, 539.
- Beck et al. (2019) Beck R., Chamandy L., Elson E. & Blackman E. G., 2019, Galaxies 8, 4.
- Dolag et al. (2001) Dolag K., Schindler S., Govoni F. & Feretti L., 2001, Astron. Astrophys. 378, 377.
- Eatough et al. (2013) Eatough R. P. et al., 2013, Nature 501, 391.
- Elstner, Beck & Gressel (2014) Elstner D., Beck R. & Gressel O., 2014, Astron. Astrophys. 568, A104.
- Ferrière, Gillard & Jean (2007) Ferrère K., Gillard W. & Jean P., 2007, Astron. Astrophys. 467, 611.
- Ferrière (2009) Ferrière K., 2009, Astron. Astrophys. 505, 1183.
- Fletcher et al. (2004) Fletcher A., Berkhuijsen E. M., Beck R. & Shukurov A., 2004, Astron. Astrophys. 414, 53.
- Govoni et al. (2017) Govoni F. et al., 2017, Astron. Astrophys. 603, A122.
- Guenduez et al. (2020) Guenduez M., Tjus J. B., Ferrière K., Dettmar R.-J., 2020, Astron. Astrophys. 644, A71.
- Heesen et al. (2014) Heesen V., Brinks E., Leroy A. K., Heald G., Braun R., Bigiel F. & Beck R., 2014, Astron. J. 147, 103.
- Houde et al. (2013) Houde M., Fletcher A., Beck R., Hildebrand R. H., Vaillancourt J. E. & Stil J. M., 2013, Astrophys. J. 766, 49.
- Kalashnikov & Chechetkin (2022) Kalashnikov I. Y. & Chechetkin V. M., 2022, Mon. Not. R. Astron. Soc. 514, 1351.
- Lelli, McGaugh & Schombert (2016) Lelli F., McGaugh S. S. & Schombert J. M., 2016, Astron. J. 152, 157.
- Navarro, Frenk & White (1997) Navarro J. F., Frenk C. S. & White, S. D. M., 1997, Astrophys. J. 490, 493.
- Nelson (1988) Nelson A. H., 1988, Mon. Not. R. Astron. Soc. 233, 155.
- Piddington (1964) Piddington J. H., 1964, Mon. Not. R. Astron. Soc. 128, 345.
- Ruiz-Granados et al. (2010) Ruiz-Granados B., Rubiño-Martìn J. A., Florido E. & Battaner E., 2010, Astrophys. J. 723, L44.
- Ruiz-Granados et al. (2012) Ruiz-Granados B., Battaner E., Calvo J., Florido E. & Rubiño-Martìn J. A., 2012, Astrophys. J. 755, L23.
- Sánchez-Salcedo & Reyes-Ruiz (2004) Sánchez-Salcedo F. J. & Reyes-Ruiz, 2004, Astrophys. J. 607, 247.
- Sánchez-Salcedo & Santillán A. (2013) Sánchez-Salcedo F. J. & Santillán A., 2013, Mon. Not. R. Astron. Soc. 433, 2172.
- Schleicher et al. (2010) Schleicher D. R. G., Banerjee R., Sur S., Arshakian T. G., Klessen R. S., Beck R. & Spaans M., 2010, Astron. Astrophys. 522, A115.
- Sofue (2013) Sofue Y., 2013, Pub. Astron. Soc. Jpn. 65, 118.
- Sofue (2015) Sofue Y., 2015, Pub. Astron. Soc. Jpn. 67, 75.
- Tabatabaei et al. (2017) Tabatabaei F. S. et al., 2017, Astrophys. J. 836, 185.
- van Weeren et al. (2019) van Weeren R. J., de Gasperin F., Akamatsu H., Brüggen M., Feretti L., Kang H., Stroe A. & Zandanel F., 2019, Sp. Sci. Rev. 215, 16.