The ALMaQUEST Survey XIII: Understanding radial trends in star formation quenching via the relative roles of gas availability and star formation efficiency
Abstract
Star formation quenching is one of the key processes that shape the evolution of galaxies. In this study, we investigate the changes in molecular gas and star formation properties as galaxies transit from the star-forming main sequence to the passive regime. Our analysis reveals that as galaxies move away from the main sequence towards the green valley the radial profile of specific star formation rate surface density () is suppressed compared with main sequence galaxies out to a galactocentric radius of 1.5( 7 kpc for our sample). By combining radial profiles of gas fraction () and star formation efficiency (SFE), we can discern the underlying mechanism that determines at different galactocentric radii. Analysis of relative contributions of and SFE to uncovers a diverse range of quenching modes. Star formation in approximately half of our quenching galaxies is primarily driven by a single mode (i.e. either or SFE), or a combination of both. A collective analysis of all galaxies reveals that the reduction in star formation within the central regions ( 0.5 ) is primarily attributable to a decrease in SFE. Conversely, in the disk regions ( 0.5 ), both and SFE contribute to the suppression of star formation. Our findings suggest that multiple quenching mechanisms may be at play in our sample galaxies, and even within a single galaxy. We also compare our observational outcomes with those from galaxy simulations and discuss the implications of our data.
1 Introduction
Galaxies are typically classified into two main populations on the global star formation rate (SFR) versus stellar mass () diagram: the star-forming main sequence and the passive population (Strateva et al., 2001; Brinchmann et al., 2004; Elbaz et al., 2007; Noeske et al., 2007). The star-forming main sequence consists of mostly disk galaxies with higher specific star formation rate (sSFR = SFR/, where is global stellar mass of a galaxy), while the passive population is predominantly composed of quiescent spheroidal galaxies with lower sSFR (Schawinski et al., 2014). However, there is an intermediate population that is sparsely populated between these two regimes, known as the green valley (Wyder et al., 2007; Martin et al., 2007; Salim, 2014). Green valley galaxies represent a transitional population that is likely undergoing a shift from the star-forming phase to the quiescent phase. Therefore, studying the physical properties of green valley galaxies is crucial for gaining insights into the processes of star formation quenching and galaxy evolution.
On a spatially-resolved scale, previous works have shown that the differences in global sSFR between star-forming, green valley, and quiescent galaxies is driven by variations in the fraction of “retired” regions that have ceased to form new stars, with red galaxies exhibiting the highest fraction of retired spaxels, and vice versa (Hsieh et al., 2017; Pan et al., 2018a; Cano-Díaz et al., 2019; Lin et al., 2022). Since star formation primarily occurs in molecular gas clouds, the presence of retired regions is expected to be linked to the changes in the properties of molecular gas. Specifically, the decline in star formation activity can be attributed to a depletion of molecular gas and/or a reduction in its efficiency in forming stars, which could result from factors such as inefficient cooling or turbulent pressure support (McKee & Ostriker, 2007). These scenarios correspond to the changes in two observable parameters: the gas fraction (), defined as the molecular gas mass of a galaxy relative to its stellar mass (/), and the star formation efficiency (SFE), which quantifies the conversion of gas into stars as the number of stars formed per unit time (SFR/). Previous global studies of molecular gas have demonstrated that star formation quenching is associated with changes in both global and SFE (e.g., Sargent et al., 2014; Saintonge et al., 2016; Colombo et al., 2020; Piotrowska et al., 2020; Wylezalek et al., 2022), but there is no definitive conclusion regarding the relative importance of one factor over the other.
A crucial step towards understanding the process of star formation quenching is the investigation of the spatially-resolved molecular gas properties of galaxies. The ALMaQUEST survey (ALMA-MaNGA Quenching and Star-Formation Survey; Lin et al. 2020) was specifically designed to study the resolved molecular gas properties of various types of galaxies, including those above (Ellison et al., 2020a) and below (Lin et al., 2022) the global star-forming main sequence, as well as galaxy mergers (Thorp et al., 2022).
Our most recent studies have unveiled important insights into the molecular gas properties of galaxies. Specifically, we have found that retired regions within galaxies generally exhibit lower and/or SFE compared to active star-forming regions (Ellison et al., 2021b; Lin et al., 2022). Interestingly, we have also observed that even the star-forming regions within green-valley galaxies, which are in a transitional state, show lower sSFR, SFE, and compared to star-forming regions of the star-forming main sequence (Lin et al. 2022, see also Brownson et al. 2020 for the similar results, but from different observations). This suggests that the overall reduction in sSFR in green-valley galaxies is a result of not only an increased fraction of retired regions but also by a decrease in sSFR within their active star-forming regions (Lin et al. 2022, see also Ellison et al. 2018 and Belfiore et al. 2018). The suppressed sSFR, , and SFE in green-valley galaxies naturally gives rise to a range of resolved scaling relations that deviate from those observed in normal star-forming galaxies (Ellison et al. 2021a; Baker et al. 2022; Lin et al. 2022; Baker et al. 2023; Ellison et al. 2024; see also Garay-Solis et al. 2023 for a discussion based on non-ALMaQUEST observations).
On the other hand, the chosen analytical approach also plays a pivotal role in interpreting the data. For instance, our analysis of the ALMaQUEST merger sample (cf. Section 2.1) reveals that when all spaxels are considered together, one might conclude that approximately half of the interaction-triggered star formation is driven by , and the remaining half by SFE (Thorp et al., 2022). However, when examined on a per-galaxy basis, it becomes evident that some galaxies are entirely driven by , while others are exclusively powered by SFE. Therefore, combining all data may lead to a loss of information.
While our previous ALMaQUEST studies that focus on star formation quenching (Ellison et al., 2021b; Lin et al., 2022) have primarily considered the integral behaviors of the entire sample, this work specifically focuses on the continuous changes in star formation and molecular gas properties as a function of a galaxy’s distance to the star-forming main sequence. Furthermore, we investigate the relative roles of and SFE within individual galaxies, an aspect that has not been extensively addressed thus far. Specifically, we aim to answer questions regarding 1) how the radial profiles of star formation and molecular gas properties change as a function of a galaxy’s distance to the star-forming main sequence, and 2) whether there is a preference for a specific quenching driver ( or SFE) at different galactocentric radii. Finally, we will compare our observational findings with those obtained from galaxy simulations in the literature.
The paper is structured as follows: Section 2 provides a description of the multiwavelength data employed in this study. The main findings are presented in Section 3, including the radial profiles of star formation and molecular gas properties in Section 3.1 and the relative importance of and SFE in Section 3.2. We discuss the implications of our results and compare our observational results with those from galaxy simulations in Section 4. Section 5 provides a summary of the results obtained in this work. Throughout this paper, we adopt the following cosmological parameters: = 70 km s-1 Mpc-1, = 0.3, and = 0.7. A Salpeter initial mass function (Salpeter, 1955) is assumed in this work.
2 Data and Observations
2.1 The ALMaQUEST Survey
The main ALMaQUEST survey (Lin et al., 2020)111http://arc.phys.uvic.ca/ almaquest/ aims to investigate the molecular gas properties of 46 galaxies selected from the MaNGA (Mapping Nearby Galaxies at APO) integral-field unit (IFU) spectroscopic survey (Bundy et al., 2015). The 46 galaxies consist of 34 non-starburst and 12 starburst galaxies. The survey focuses on galaxies spanning a wide range of log(sSFR/yr-1) from 9.4 to 12.2, covering the starburst to green valley regime below the global star-forming main sequence on the SFR versus plane. The ALMaQUEST sample have been expanded to include 20 galaxy mergers (Thorp et al., 2022; Ellison et al., 2024), which are not included in this work.
The stellar mass of the ALMaQUEST main sample spans from log(/M⊙) 10.2 to 11.6. While the majority of the galaxies are selected based on their global and sSFR, an additional criterion is applied to select 12 starburst galaxies. These galaxies are required to exhibit an elevated relative to the control spaxels within 0.5 by at least 50% (see Ellison et al., 2020a, for details). These control spaxels are characterized by their similarity in and location within a comparable galactic radius to the spaxel in question, and belong to galaxies with similar global . Since the selection of starburst galaxies in Ellison et al. (2020a) was based on the relative profile, rather than an absolute value, these galaxies do not necessarily exhibit higher sSFR, both locally and globally, compared to other galaxies in the ALMaQUEST sample, although a majority of them indeed do. It is important to note that other galaxy properties and environmental factors are not considered in the sample selection for the ALMaQUEST survey.
2.2 Star Formation Tracers: MaNGA
The MaNGA data used in this study are obtained from the MaNGA DR15 Pipe3D value-added products (Sánchez et al., 2018). These Pipe3D products provide both global properties of galaxies integrated over the MaNGA bundle field-of-view, as well as spaxel-based measurements of local stellar mass and emission-line fluxes. The stellar mass is derived based on the best-fit stellar population model that describes the stellar continuum of a given spectrum. The best-fit stellar continuum is then subtracted from the spectrum to obtain the emission-line measurements. To account for the effect of dust extinction, we apply a correction to the emission line fluxes using the Balmer decrement computed at each spaxel. The correction is based on a Milky Way extinction curve with a standard reddening parameter of 3.1 (Cardelli et al., 1989).
In this study, we adopt H emission as a tracer of ongoing star formation activity. The extinction-corrected H luminosity is converted to the SFR using the calibration provided by Kennicutt (1998). To calculate the SFR and stellar mass surface densities ( and ) for each spaxel, we utilize the spaxel-based stellar mass and SFR measurements from Pipe3D, taking into account the physical area of the spaxel and applying an inclination correction.
However, it is important to note that H emission can arise from sources other than young stars, such as AGN and old stellar populations (Kewley et al., 2006; Yan & Blanton, 2012). To classify the spaxels based on the powering sources, we follow the method outlined in our previous papers (Bluck et al., 2020a; Lin et al., 2022). In summary, we first utilize the Baldwin–Phillips–Terlevich (BPT) diagnostics, a commonly used tool for distinguishing between different sources of H emission. Specifically, we apply the Kewley and Kauffmann star-forming cut based on the [O III]5007/H versus [N II]6584/H line ratios (Kauffmann et al., 2003; Kewley et al., 2006) to classify spaxels into star formation, composite, or AGN. Our BPT analysis is limited to spaxels with a signal-to-noise ratio (S/N) greater than 2 for all required emission lines. Star-forming spaxels are defined as those satisfying both the BPT star-forming criteria and an H equivalent width (EW) greater than 6Å (Sánchez, 2020; Sánchez et al., 2021). H luminosity is used to estimate the for star-forming spaxels.
We also compute for two categories of non-star-forming spaxels. The AGN-contaminated spaxels are those in the AGN and composite regimes on the BPT diagram. The retired spaxels where the star formation is largely suppressed are identified as those having S/N 2 and EW 3 Å in H (Lin et al., 2022). We estimate for spaxels that are not dominated by active star formation (either AGN-contaminated or retired spaxels) using the relationship between and 4000 Å break (D4000) as employed in previous MaNGA and ALMaQUEST papers (e.g., Spindler et al., 2018; Wang et al., 2019; Bluck et al., 2020a; Thorp et al., 2022). In Figure 1, we show the method used to estimate for these spaxels. We first construct the -D4000 relation for our sample using star-forming spaxels from the 34 non-starburst star forming galaxies. The median value in each D4000 bin is calculated and represented by the green solid curve. For any spaxel that does not meet our star-forming criteria based on the BPT and EW cuts, we assign a value based on its D4000 and the corresponding median curve. Then, we convert the to by multiplying it with the value of these spaxels. The empirical -D4000 relation shown in Figure 1 is consistent with that derived from the full MaNGA sample (Bluck et al., 2020a; Thorp et al., 2022).
Spaxels with D4000 1.45 are generally considered quenched, and thus the sSFR-D4000 relation is no longer applicable (Wang et al., 2018; Bluck et al., 2020a). Therefore, we only utilize the -D4000 calibration for spaxels with D4000 1.45. This means that the -D4000 calibration limits the analysis to the suppressed (D4000 1.45), but not fully quenched (D4000 1.45) regions (see the discussion in Wang et al. 2018 and Bluck et al. 2020a). Note that since the values of the AGN-contaminated and retired spaxels are inferred based on their D4000 values, some accuracy is traded for completeness. Thus, the values of these spaxels should be interpreted with caution.
Finally, it is important to utilize the full sample of spaxels in order to probe quenching (Bluck et al., 2020a). Therefore, we define fully-quenched spaxels as those having S/N 2 in H or D4000 1.45. In the examined dataset, star-forming spaxels with a D4000 value of 1.45 span a range from 11.7 to 9.5 in log(/yr-1), with a median value of -10.7. Therefore, the fully-quenched spaxels are artificially assigned to a fixed value of log(/yr-1) 12 (i.e., just below 11.7 as an upper limit for ), following Bluck et al. (2020a). Our spaxel classification that includes star-forming, AGN-contaminated, retired, and fully-quenched spaxels ensures that 98% of spaxels have a valid value. This allows for the construction of a continuous star formation profile as a function of galactocentric radius for all the galaxies in this work. Nevertheless, we have verified that our conclusions remain qualitatively consistent even when excluding the fully-quenched spaxels, which were assigned log(/yr-1) 12 manually.
2.3 Molecular Gas Observations: ALMA
The ALMA observations at 12CO ( 1 0; 115.271 GHz) were designed to match the point-spread function (2.5) of the MaNGA observations, allowing for a simultaneous study of spatially-resolved star formation and molecular gas properties at the same physical scale (PI: L. Lin – 2015.1.01225. S, 2017.1.01093.S, 2018.1.00558.S; PI: S. Ellison – 2018.1.00541.S). Detailed information regarding ALMA data reduction and imaging can be found in the survey paper by Lin et al. (2020).
In this study, the molecular mass surface density () is calculated from the 12CO ( 1 0) luminosity using a constant Milky Way conversion factor () of 4.35 M⊙ (K km s-1 pc2)-1 (Bolatto et al., 2013). The value of is not universal and can vary with factors such as metallicity, cosmic ray density, and UV radiation field (see the review by Bolatto et al., 2013). The assumption of a constant has been examined in previous ALMaQUEST papers (Ellison et al., 2021a; Lin et al., 2020; Ellison et al., 2024). On average, the difference in the global molecular gas mass () obtained using a metallicity-dependent compared to the original is approximately 0.1 dex. Given the small difference, a constant is adopted in this work to maintain consistency with previous ALMaQUEST papers. However, it is worth noting that although the radial profiles of are generally flat within a given galaxy at kpc scale, galaxies often exhibit a decrease in within the inner 1 kpc (Sandstrom et al., 2013), which corresponds to (or is slightly smaller than) the spatial scale that our ALMA and MaNGA observations can resolve.
To recover the CO non-detection spaxel for spaxel completeness, a 3 upper limit is assigned to spaxels with S/N 2 in CO integrated intensity map. The 3 upper limits of flux are calculated with , where is the rms noise from the spectral line data cube, 11 km s-1 is the velocity resolution of the data cube, and is the assumed 40 km s-1 line width for a bulk of molecular cloud observed at kpc resolution. Two methods were employed for measuring the local line width: pixel-by-pixel Gaussian fitting of the data cubes and the CASA task immoment (moment 2), which represents intensity-weighted line width around the mean without making any assumptions about the line profile. Both methods show a median line width of 40 km s-1. However, it is important to note that these estimates inherently rely on the spaxels that have a CO detection.

2.4 Sample Classification
The primary goal of this study is to investigate the continuous variations in gas and star formation properties as galaxies transit away from the star-forming main sequence. To achieve this, we classify the 34 non-starburst galaxies into three groups based on their deviation from the global star-forming main sequence (MS). The 12 starburst galaxies (which are included in our sample, but treated as a separate class, see below) are also on or slightly above the main sequence, exhibiting enhanced SFR in the centers by design.
Figure 2 illustrates the global SFR- relation of our sample. The background contours and gray scale show the galaxies from the MaNGA (SDSS DR15) sample. The solid and dashed black lines represent the global star-forming main sequence and its typical scatter of 0.32 dex for the MaNGA sample, as determined by Sánchez et al. (2019) as
| (1) |
where the SFR is in units of M☉ yr-1 and is in units of M☉.
In the work presented here, we have categorized the sample into three distinct classes based on their sSFR: those with relatively high global sSFR (log(sSFR/yr-1) 10.5; blue squares in Figure 2), moderate sSFR (11.0 log(sSFR/yr-1) 10.5; green circles), and low sSFR (log(sSFR/yr-1) 11.0; rad diamonds), which we hereafter refer to as the SFh, SFm, and SFl samples, respectively. Broadly speaking, SFh galaxies are the main-sequence, normal star-forming galaxies, SFm galaxies are located at the lower end or just below the main-sequence, and SFl galaxies reside below the main-sequence. For the 34 non central starburst galaxies, there are a total of 12 galaxies classified as SFh, 11 galaxies classified as SFm, and 11 galaxies classified as SFl. Although the sample classification is defined by the absolute value of global sSFR in this work, it is correlated with the distance to the star-forming main sequence (MS), which has been used in other studies to distinguish star-forming and quenched galaxies (e.g., Ellison et al., 2018). Our sSFR boundaries in absolute unit correspond to MS of 0.2 MS 0.4 dex for SFh, 0.7 MS 0.2 dex for SFm, and 1.7 MS 0.7 dex for SFl, where the MS is calculated as the log difference between the SFR and the star-forming main sequence in Equation 1 for given . Table 1 provides an overview of the sample classification and the corresponding range of global sSFR and MS.
The central starburst galaxies (cSB) are shown as yellow triangles in Figure 2. cSB are all lying above the line of star-forming main sequence, with MS of 0.04 – 0.90 dex. In the subsequent analysis, we will focus on characterizing the spatial distribution of various gas and star formation properties using radial analysis. As such, the 12 cSBs that were specifically selected to exhibit centrally peaked starbursts (Ellison et al., 2020a) are treated as their own class. They are presented where applicable for the purpose of comparison.
| log(sSFR)[yr-1] | MS [dex] | # of galaxies | |
| star-forming main sequence | |||
| SFh | 10.5 | 0.2 to 0.4 | 12 |
| quenching galaxies | |||
| SFm | 11.0 to 10.5 | 0.7 to 0.2 | 11 |
| SFl | 11.0 | 1.7 to 0.7 | 11 |

3 Results
3.1 Radial Profiles of Star Formation and Molecular Gas Properties
3.1.1 Radial Profiles of , and
We begin by analyzing the galaxy radial profiles in the ALMaQUEST sample. Figures 3(a)-(c) present the radial profiles of , , and , respectively. The subsets, namely SFh, SFm, SFl, and cSB, are denoted by blue, green, red, and yellow colors, respectively. The radial profile is sampled with a 0.18 ( 0.8 kpc) steps within 1.5 ( 7 kpc at redshift 0.03). The inclination angle, along with the galaxy’s position angle, is considered to deproject the geometries of the galaxies. The radial quantities are determined by calculating the median value222In this work, we choose median instead of mean so that the result suffers less from some extreme outliers. of the star formation and molecular gas properties within each deprojected annulus. Radial profiles are constructed using all spaxels with valid values, regardless of whether these values were measured, inferred, or represented as upper limits (see Section 2.2 and 2.3). As mentioned earlier, this is to probe the quenched and gas-deficient regions. For each individual galaxy, we display the radial properties using thin lines. The median profiles of each subset, which are obtained by taking the median values from the individual profiles, are shown using shaded colored regions. The height of the shaded regions represents the standard error of the mean at each radial bin. Note again that the cSB subset should be considered as a distinct population since the sample was selected based on their radial profiles of local sSFR by design (cf. Section 2.1).
The radial profiles of exhibit a ranking across the explored radial range, with a consistent increase in magnitude from SFl to SFm, SFh, and to cSB galaxies at almost all radii (Figure 3(a)). Notably, the differences between SFh, SFm, and cSB populations are more pronounced in the inner region ( 0.5 ) of galaxies compared to the outer region ( 1.0 ), consistent with the finding in previous work with larger sample size (e.g., Ellison et al., 2018; Wang et al., 2019; Bluck et al., 2020a). Conversely, the of SFl galaxies is significantly lower than that of the other populations at all galactocentric radii. Several SFh galaxies exhibit a higher than that of cSB galaxies. However, note that when normalized by (Figure 5(a)), these galaxies typically show a lower compared to cSB galaxies.
Due to the trade-off between accuracy and completeness, as discussed in Section 2.2, it is important to interpret Figure 3(a) with caution. Figure 4 shows the radial profiles of the percentage of different type of spaxels. All the available spaxels from each individual galaxy class are combined to generate the plot. Results for cSB, SFh, SFm, and SFl galaxies are presented in panel (a) to (d), respectively. As shown in the figure, there is a significant decline in the fraction of star-forming spaxels (purple curve) when transitioning from cSB to SFl galaxies. Within SFl galaxies (panel (d)), fully-quenched regions (light pink) dominate, constituting over 50% of the regions at all radii. In these regions, the log(/yr-1) is manually set to 12, and therefore their values depend on the of the spaxel. Given that SFl galaxies are predominantly characterized by fully-quenched regions at all radii, their is notably lower compared to other populations, as shown in Figure 3(a). While the majority of SFl galaxies exhibit low across their disks, one galaxy (7977-9101) displays high in its central region. This is attributed to a relatively low D4000 value ( 1.2, comparable to that of star-forming regions) in its center, which is identified as a composite region based on the BPT analysis. The center of this galaxy is associated with an AGN (Lin et al., 2017). Typically, such composite AGNs are commonly linked with young stellar populations and low D4000 values, indicative of a recent cessation of star-forming activities (e.g., Wang & Wei, 2008). The timescale of quenching is beyond the scope of this paper, but we aim to delve into this question in future studies, focusing not only on the ALMaQUEST sample but also extending the analysis to include the entire MaNGA sample.
The proportion of retired regions (with D4000-based ), albeit at a low level, also increases from cSB to SFl galaxies (pink curve), though not as substantially as observed for fully-quenched regions. The occurrence of AGN-contaminated regions (also with D4000-based ) exhibits no discernible trend with galaxy populations and remains at a low level, below 20%, across all populations (magenta curves). Hence, the contribution of retired regions and AGN-contaminated regions to Figure 3(a) is comparatively lower in contrast to star-forming and fully-quenched regions.
Taking all of these factors into account, we can deduce that the offsets of SFl from more star-forming galaxies are likely to be real (e.g., Bluck et al., 2020b), but we refrain from drawing strong conclusions regarding the exact profile and magnitude of this offset. Also, some green-valley galaxies in the ALMaQUEST sample have high inclination (see Figure 2 in Lin et al. 2022). While the inclination and position angle of a galactic disk are taken into account during the construction of the radial profile for individual galaxies, accurately deriving azimuthally-averaged radial profiles of (as well as other physical properties) remains challenging for highly-inclined galaxies (Ibarra-Medel et al., 2019; Barrera-Ballesteros et al., 2022).
Turning to in Figure 3(b), our galaxies show a strong and smooth dependence of on galactic radius. The median profiles of exhibit significant overlap among the different populations across all the radii explored. This is somewhat expected, as our four populations share the similar range in global as shown in Figure 2 (García-Benito et al., 2017). Due to the uniform distribution of , any observed differences in star formation and gas properties among the galaxy populations (if present) are more likely to be genuine rather than a result of systematic dependence on stellar mass.
Figure 3(c) displays the radial distribution of . For our galaxies, while there are no dramatic differences observed in the median profiles among the galaxy populations, there is significant individual variation in , ranging from one to two orders of magnitude from galaxy to galaxy. This variation can be attributed, at least in part, to the structured and non-smooth disk of the ALMaQUEST galaxies and the clumpy nature of molecular gas (Leroy et al., 2013; Stuber et al., 2023). The dark blue and blue curves in Figure 4 represent the fractions of spaxels with CO detection and those without detection (upper limits), respectively. For cSB, SFh, and SFm galaxies, the relative proportions of these two types of spaxels exhibit a considerable degree of similarity across the radial range explored. However, it is noteworthy that SFl galaxies display notably lower values than the other galaxy populations for 1.0. This reduction in is attributed to the significant presence of CO non-detection in this region, as illustrated in Figure 4 (panel (d)). This is particularly true for the outer regions. Beyond 1.0, the radial profile of flattens due to the increased prevalence ( 50%) of CO non-detection in this regime. However, it is worth noting that in the inner region, specifically at 0.5, the detection of CO emission remains relatively robust in SFl galaxies, even in the presence of low .
To summarize, the largely overlapping radial profiles of (shaded lines in Figure 3(c)) suggest that galaxies with the lowest levels of star formation activity (SFl) do not consistently display a significant deficit in molecular gas. However, since there is considerable variation in the profiles (Figure 3(a)), this implies that there must be a radial variations in and SFE, which will be further discussed in the next section.
Finally, while our primary focus is on the median profiles, it is important to note the substantial variation from galaxy to galaxy within a given category. This variation is particularly pronounced for and , but less so for . The diverse morphologies of the galaxies in the ALMaQUEST sample contribute to these diverse profiles due to varied distributions of the clumpy star-forming regions and molecular clouds across their disks (Leroy et al., 2013; Pan et al., 2022; Stuber et al., 2023). Our sample includes a broad spectrum of Hubble types, ranging from T-types of -1.6 to 6.5 (S0 to Scd), and features both barred and non-barred galaxies along with different spiral patterns333The T-type values for the ALMaQUEST galaxies are taken from the MaNGA Deep Learning Morphology Value Added Catalogue (MDLM-VAC-DR17 Domínguez Sánchez et al., 2022). This catalog has been developed through an automated classification system that employs supervised deep learning. The Hubble T-type classification primarily takes into account the ellipticity and the prominence of spiral arms, but it does not specifically account for the presence or absence of a galactic bar. The identification of a galactic bar and the further verification of spiral arms are based on the updated Galaxy Zoo classification (Walmsley et al., 2022) and by our kinematic analysis in the forthcoming study by Lopez-Coba et al. (in preparation). Additionally, several galaxies display asymmetric disks, suggesting a history of past interactions (Ellison et al., 2024). Our current sample size is too limited to systematically explore the potential effects of morphology and environment on the radial profiles. However, such analysis can be conducted in a statistically significant manner using the full MaNGA sample. This will be similar to what has been done with the CALIFA galaxies, albeit with a smaller sample size (González Delgado et al., 2016; Sánchez et al., 2021). .


3.1.2 Radial Profiles of , SFE, and
In this section, we present the radial profiles of various physical properties derived from , , and . Specifically, we present the radial specific SFR () defined as /. We note that the symbol for surface density, , is not necessary in the expression for the radial (local) specific SFR as the “per area” component cancels out. However, in order to distinguish between the global and local sSFR in this paper, we retain the in the symbol. Additionally, we examine the molecular gas fraction () defined as / and the star formation efficiency (SFE) defined as /. Figures 5(a)-(c) illustrate the radial profiles of , , and SFE, respectively. The color scheme and line styles employed are the same as for those used in Figure 3. We will begin by examining the results obtained from the non-cSB sample, followed by an examination of the results from the cSB population.
As galaxies move from the star-forming main sequence to lower SFR regimes, the radial profiles of exhibit a dependency with respect to global sSFR, displaying a decreasing trend in magnitude from SFh to SFl (Figure 5(a)). This dependence agrees with previous studies conducted on global scale (e.g., Saintonge et al., 2017; Piotrowska et al., 2020). Furthermore, the decline in local is observed consistently from the galactic center to 1.5 , indicating that star formation quenching is a phenomenon that occurs globally within galaxies (see also Catalán-Torrecilla et al., 2017; Belfiore et al., 2018; Bluck et al., 2020a, b).
The radial profiles of SFh and SFm galaxies show in Figure 5(a) exhibit remarkable similarity to that presented in Bluck et al. (2020b), which were derived using the complete MaNGA DR15 sample, and with the fully-quenched regions considered. The comparison validates that the trends of the ALMaQUEST sample, despite its smaller size, is representative of that from larger sample of galaxies. However, the profiles in Figure 5(a) are only qualitatively consistent with the findings of Belfiore et al. (2018) and Ellison et al. (2018) using full MaNGA sample and González Delgado et al. (2016) using different IFU dataset from the CALIFA survey. While these studies did demonstrate a dependence of local on global sSFR, the radial profiles of exhibit some discrepancies. This discrepancy arises because Belfiore et al. (2018), Ellison et al. (2018), and González Delgado et al. (2016) did not account for fully-quenched regions in their analyses. For instance, in Ellison et al. (2018), the quiescent population display an increase in with radius, as evident in their Figure 8, whereas in this work and Bluck et al. (2020b), the profile remains relatively constant. The underlying reason for this contrast is that our work and Bluck et al. (2020b) take into consideration the presence of fully-quenched regions, whereas Ellison et al. (2018) (and other studies) primarily focused on the regions with H (emission lines) detection. In short, these studies demonstrate that the observed radial is sensitive to the choice of methodology, namely, between completeness and accuracy.
From SFh to SFm galaxies, the observed decrease in with decreasing radius, as illustrated in Figure 5(a), also implies an inside-out quenching scenario, in which star formation ceases in the inner region of the galaxy more pronouncedly than the outer regions. The inside-out quenching scenario is in agreement with previous studies that utilized photometric colors, such as or UV-optical gradients, as indicators of star formation profiles (Pan et al., 2016; Liu et al., 2016; Wang et al., 2017). Additionally, studies employing IFU (MaNGA, CALFA, and SAMI) with based on emission lines analysis have yielded consistent results (González Delgado et al., 2016; Belfiore et al., 2018; Medling et al., 2018; Sánchez et al., 2018; Ellison et al., 2018; Lin et al., 2019a; Sánchez et al., 2021; Villanueva et al., 2023). Recently, analysis of the stellar-age gradients in late-type galaxies further reinforces the notion of an inside-out cessation of star-forming activity in massive galaxies (Breda et al., 2020; Wang et al., 2022; Lah et al., 2023).
Nevertheless, it is worth mentioning that Bluck et al. (2020b) demonstrated that satellite galaxies with lower (log(/M☉) 10, i.e., lower than that of ALMaQUEST sample) undergoing quenching display rising star formation profiles, indicating outside-in quenching, unlike high-mass central and satellites galaxies which clearly quench inside-out. Lin et al. (2019a) also show the relative fraction of outside-in and inside-out quenching mode indeed strongly dependent on , with high- galaxies exhibiting a greater fraction of inside-out quenching compared to low- ones. Therefore, while the ALMaQUEST sample lacks low- systems, it is important to note that the radial profiles of shown in Figure 5(a) cannot be extrapolated to low- population.
It is challenging to precisely quantify the extent of the decrease in from SFm to SFl due to inherent limitations in the accuracy of measurements, particularly for the SFl population. This limitation is also emphasized in the analysis conducted by previous observational studies (e.g., Belfiore et al., 2018; Ellison et al., 2018; Wang et al., 2018; Bluck et al., 2020b), despite their larger sample size. Nevertheless, it is apparent that SFl galaxies are experiencing star formation at a substantially lower rate across their entire disk, even after accounting for the normalization by stellar mass (i.e., ), indicating a global quenching scenario.
The radial profile of consistently shifts vertically downwards decreasing global sSFR at almost all radii. Computed using and , demonstrates less sensitivity to completeness and accuracy issues compared to -related quantities. SFh and SFm galaxies show a mild increasing trend with radius within the 1.0 regime. However, it is important to note again that caution should be exercised when interpreting the radial profile of beyond 1.0 in all populations, owing to the decreased accuracy of the medians due to the increase in spaxel without CO detection, as illustrated in Figure 4. For SFl galaxies, we are not able to precisely quantifying their profile due to a significant number of CO non-detections. Nonetheless, it is evident that SFl galaxies consistently exhibit lower gas content compared to the other populations across all radii considered. A similar conclusion is reached by other analysis based on CO analyses, as well as those using the dust-to-gas relation as a proxy for molecular gas mass (Saintonge et al., 2017; Sánchez et al., 2018; Lin et al., 2019b; Colombo et al., 2020; Brownson et al., 2020; Piotrowska et al., 2022; Lin et al., 2022). Our finding is further corroborated by the most recent analysis of radial profiles for green valley galaxies using EDGE-CALIFA data by Villanueva et al. (2023) (see their Figure 12), but note that this study utilizes a smaller sample size.
The radial distribution of SFE also exhibits a clear ranking with global sSFR in Figure 5(c). The median log(SFE/yr-1) for SFh galaxies ranges from approximately 9.5 to 9.0, showing a rather flat profile from the galactic center to the outer regions. The derived constant SFE for SFh galaxies agrees with that of nearby large normal star-forming galaxies observed at kpc scales (Leroy et al., 2008; Bigiel et al., 2011; Muraoka et al., 2019; Sun et al., 2023). While the disk SFE of SFm is lower than that of SFh by only 0.2 dex, a central suppression of SFE is seen, as a result of a decease (increase) in the amount of star-forming (fully-quenched) regions (Figure 5). A recent study by Villanueva et al. (2023), utilizing EDGE-CALIFA data, also observes a systematic increase of SFE with increasing radius in green valley galaxies; in contrast, the SFE in main sequence galaxies remains almost constant across their disks. Although the radial profile of SFE for SFl galaxies cannot be determined precisely due to the uncertainty associated with measurements, it is evident that the SFE of molecular gas in SFl galaxies is significantly suppressed by at least an order of magnitude compared to normal star-forming galaxies (SFh). A similar conclusion is also reached by other studies on both global and radial SFEs (Saintonge et al., 2017; Sánchez et al., 2018; Lin et al., 2019b; Colombo et al., 2020; Brownson et al., 2020; Piotrowska et al., 2022; Lin et al., 2022).
Mathematically, the decrease in and SFE can be attributed to an increase in the denominator ( and , respectively) or a reduction in the numerator ( and , respectively). Figure 3(b) provides evidence that, statistically, radial remains relatively consistent across the sample. Consequently, any variations in primarily arise from changes in (as also shown in Figure 9 of our previous paper in Lin et al. 2022). In terms of SFE, both and exhibit lower values for SFl galaxies compared to SFm and SFh galaxies. Therefore, the observed variations in SFE within our sample are a combined outcome of changes in both and .
Moving to the cSB galaxies, it is evident that their median magnitudes are higher than those of other populations at all radial bins (Figure 5(a)). Specifically, compared to galaxies located around the star-forming main sequence (i.e., SFh galaxies in our sample), cSB galaxies exhibit an enhancement in of approximately 0.5 dex in the innermost region and a consistently smaller enhancement of approximately 0.3 dex in the 0.75 regime. We note again that the significant central enhancement in is a result of sample selection (see §2.4).
Figure 5(b) and (c) shows enhancement in both and SFE for cSB galaxies, the largest enhancements are seen in the inner regions ( 0.5 ), which corresponds to the region where is most enhanced. This similarity suggests a potential link between the enhanced and SFE and/or in cSB galaxies. We refer readers to Ellison et al. (2020a) for a more detailed analysis and the implications on the link between , SFE and in cSB.
Finally, it is important to note that star formation and molecular gas can extend beyond the galactocentric radius examined in this study (1.5), as highlighted in previous works (e.g., Watson et al., 2016; Bacchini et al., 2020; Koda et al., 2022). IFU observations conducted by MaNGA and CALIFA have indicated that beyond the radius of 1.5 is typically lower than that within 1.5 (e.g., González Delgado et al., 2016; Belfiore et al., 2018; Sánchez et al., 2021). Hence, our results are not expected to be strongly influenced by star formation in the outskirts. Furthermore, the comparison of radial profiles between different galaxy populations is valid in this study due to the relatively narrow range of global within the ALMaQUEST sample. Previous studies have shown that the radial profiles of star formation and (molecular) gas properties, including their shapes and magnitudes, depend on the of galaxies (García-Benito et al., 2017; Belfiore et al., 2018; Sánchez et al., 2021; Barrera-Ballesteros et al., 2022). Therefore, such comparisons between galaxy populations (sub-samples) should be approached with caution when dealing with a wide range of mass values.
3.2 Relative Importance of and SFE in Quenching
Many previous studies have assessed the relative role of and SFE for boosting star formation. For example, on global scale, there exists a correlation between global SFE and distance above the main sequence (e.g., Sargent et al., 2014; Genzel et al., 2015; Saintonge et al., 2017; Tacconi et al., 2018). Conversely, other studies have shown that increased plays a pivotal role in regulating star formation (e.g., Scoville et al., 2016; Lee et al., 2017). Pan et al. (2018) also found a correlation between the level of merger-triggered starburst and global . To avoid the potential dilution of key physical processes that may occur when averaging properties across entire galaxies, in our previous work, we quantify the relative role of and SFE for the cSB sample in the ALMaQUEST survey on a spatially resolved manner (Ellison et al., 2020a). Our findings suggest that an elevated SFE is the primary driver of central starburst activity. We also investigate the mechanisms responsible for merger-triggered star formation using the ALMaQUEST merger sample (Thorp et al., 2022). The analysis indicates that both and SFE can drive merger-triggered star formation. In this work, our focus shifts to assessing the relative significance of and SFE in the context of suppressing, rather than boosting, star formation.
To gain a deeper understanding of the factors influencing the radial profiles of in quenching galaxies, we compare the extent of quenching with the changes in and SFE relative to the normal star-forming galaxies (SFh) within our sample. More specifically, for each individual galaxy classified as SFm or SFl, we first calculate the deviation of their (i.e., ) from the median of all SFh galaxies (represented by the thick blue curve in Figure 5(a)) at each radial bin. Similarly, we compute the radial and SFE using the same approach. Then the relative significance of SFE and can be quantified by comparing and SFE, specifically the value of the expression SFE. This expression allows for a ranking of the two drivers (e.g., Ellison et al., 2020a; Brownson et al., 2020; Moreno et al., 2021; Thorp et al., 2022; Garay-Solis et al., 2023), revealing which one exerts a more pronounced influence on quenching star formation at different galactocentric radii. A positive value for this expression indicates that the deviation of from that of the main-sequence galaxies is primarily, but not necessarily exclusively, driven by an increase in SFE. Conversely, a negative value signifies a scenario primarily influenced by . Note that regardless of which quenching driver plays the dominant role, we do not deny the significance of the other one. The uncertainty of SFE is determined through error propagation from the uncertainties of the raw curves.
Figure 6 displays the radial profiles of SFE for SFm galaxies on the left and SFl galaxies on the right. The galaxies are color-coded based on their global sSFR, which is related to their distance from the main sequence. The darkness of the curve color increases with global sSFR values. The yellow horizontal shaded region represents the regime (0.15 SFE 0.15) where is determined by the combined effect of both and SFE. The limit of 0.15 is approximately twice the typical uncertainty of the SFE profiles. The choice of this limit should be considered as a conservative choice to avoid the risk of over-interpretation. While the majority of galaxies in both the SFm and SFl categories tend to be skewed towards being primarily driven by SFE, there exists a diverse configurations in terms of the dominant factors influencing star formation.
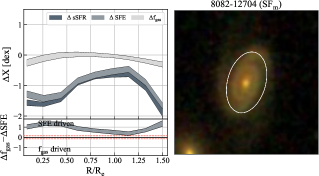
Figure 7 provides four illustrative examples. In each sub-figure, the upper-left panel displays gray curves, with increasing darkness representing , SFE, and , respectively. Meanwhile, the lower-left panel presents the radial SFE profile. The right panel exhibits the SDSS composite image of the galaxy, with the outermost ellipse highlighting the radius of 1.5. The upper-left panel of Figure 7 exemplifies a case (8082-12704) where the radial is primarily influenced by SFE across the entire radial range. Conversely, other panels show galaxies that demonstrate signs of multiple mechanisms influencing their star formation. Specifically, in the case of galaxy 8083-9101 (upper-right), SFE dominates in the inner regions, while takes over in the outer regions, with a transition occurring at approximately 0.6 . The lower two panels show galaxies (8086-9101 and 8952-12701) exhibiting a more complex pattern. Star formation in the inner regions (within 0.3 ) of 8086-9101 is primarily driven by , while in the intermediate radial range (0.3 – 1.0 ), SFE takes the lead. In the outermost regime, both and SFE seem to play a role in shaping star formation. For galaxy 8952-12701, star formation in the inner and outermost regions is primarily governed by SFE. However, in the intermediate radial range (0.5 – 1.0 ), both and SFE work together to regulate star formation.
Figure 6 and 7 provides compelling evidence that star formation in quenching galaxies is governed by a range of diverse modes, SFE-driven, -driven, and by the combination of the two; such complexity is also observed in galaxies experiencing enhanced star formation (Ellison et al., 2020b; Thorp et al., 2022). Given the small size of our sample in this work, it is challenging to pinpoint the exact underlying origin of the multiple-mode drivers, such as different underlying mechanisms being responsible for star formation quenching in different galactocentric regimes. Further studies with larger sample sizes and increased statistical significance are necessary to provide more robust constraints on the prevalence and the nature of such multi-mode driver. Moreover, employing different tracers that are insensitive to contamination from AGNs and older stellar populations, or are unaffected by dust attenuation, will contribute to confirming our findings based on the H and D4000 star formation measurements.


3.2.1 Relative Importance of and SFE in Individual Galaxies
In this section, we aim to discuss the spatial characteristics of individual galaxies. Using the radial profiles of -SFE in Figure 6, we undertake a visual classification of galaxies into two distinct groups based on the number of dominant factors influencing star formation within their galactic disks. These groups are characterized as either “single mode” or “multiple driver”. For example, the galaxy shown in the upper-left panel of Figure 7 would be classified as a “single mode” system, driven primarily by SFE. In contrast, other galaxies in Figure 7 would fall into the “multiple driver” category, each displaying a complex combination of factors influencing their star formation.
Using this classification approach, we identify 10 galaxies (4 SFm and 6 SFl; 1 -driven and 9 SFE-driven) categorized as being driven by a single mode and 12 galaxies (7 SFm and 5 SFl) classified as being influenced by multiple modes. There is no significant difference in the number of galaxies between these two modes, and there is no apparent trend regarding the dominant mode of quenching for SFm and SFl galaxies. By combining the previous ALMaQUEST results on enhanced star formation (Ellison et al., 2020b; Thorp et al., 2022), we conclude that both quenching and star formation boosting is both individualized (from galaxy-to-galaxy) and can be complex even with a given galaxy.
3.2.2 Relative Importance of and SFE at Different Radial Range
In the previous section, we discussed the individual behavior of the 22 galaxies below the main sequence (SFm and SFh), in this section, we will answer the question of whether there is a preference for a specific quenching driver (, SFE, or a combination of both) at different galactocentric radii. Figure 8 illustrates the distribution of the different drivers across 198 azimuthal bins in the 22 quenching galaxies. When the value of SFE is precisely zero or when the associated uncertainty encompasses 0.15, the region is considered to be equally influenced by both drivers. First, we will examine all the radial bins as a whole. Moreover, since the central region ( 0.5) exhibits the most pronounced quenching as galaxies begin to deviate downwards from the main sequence (Figure 5(a); see also Ellison et al. 2018, Belfiore et al. 2018, and Bluck et al. 2020b), it merits distinct discussion and is separated from the remainder of the disk for discussion purposes. The definition of the central region as 0.5, typically dominated by galactic bulges (Kalinova et al., 2021, 2022), is also consistent with the analysis taken in previous ALMaQUEST papers (Ellison et al., 2020a; Lin et al., 2022). Correspondingly, the disk region is defined as the area beyond 0.5.
Considering all the radial bins collectively (as represented by the dark gray bars in Figure 8), SFE emerges as the dominant factor, accounting for approximately 51% in determining the . Following closely behind is a mode where and SFE contribute equally, constituting approximately 40%, while cases primarily driven by account for only 9%. In the central region (consisting 66 radial bins for 0.5 ; gray bars in Figure 8), the trend aligns with the overall dataset, with SFE driving 66% of radial regions, the combination of and SFE playing a significant role in 29% of the regions, and being the primary driver in 5% of cases. Our findings regarding the central region are consistent with the results of an integrated analysis conducted by Colombo et al. (2020). Their study, based on EDGE-CARMA and APEX observations for approximately 470 galactic centers, similarly suggests that as galaxies depart from the main sequence, it is the changes in SFE that primarily push a galaxy (more specifically, their quenching center) further into the passive regime. It is important to note that the term “center” as used in Colombo et al. (2020) corresponds to 1.0, defined by the APEX beam at 230 GHz. This is larger than the definition of “center” used in our work. This distinction in spatial definitions should be taken into account when comparing results across different studies. We have evaluated our results using an alternative definition of the center as 1.0. While this adjustment alters the fraction of individual categories in Figure 8, the relative differences among the various categories remain consistent.
In the disk region (consisting of 132 radial bins for 0.5; light gray bars), a different pattern emerges. Here, and SFE are equally important in driving star formation in 47% of the radial bins, becoming the most prevalent mode in this radial regime. At the same time, SFE takes the lead as the dominant factor in 43% of these radial bins, with remaining the least common driver, accounting for only 10% of the regions in the disk region. Several prior studies, relying on integrated measurements of entire galaxies, have demonstrated the significance of both decreasing and SFE in determining the distance from the star-forming main sequence (e.g., Saintonge et al., 2017; Piotrowska et al., 2020). While these studies cannot distinguish between the central and disk regions of galaxies, their findings are presumably heavily influenced by the events transpiring in the disk regions. This is due to the extensive size of these regions, which therefore contributes significantly to the overall average quantity. Consequently, our findings that the combination of and SFE is the most prevalent mode in the disk regions can offer an explanation for the findings of previous integrated studies.
In our analysis, we find that star formation in the radial regions considered is primarily governed either by SFE or by the combined influence of and SFE. The implication is consistent to that reported in previous spatially-resolved analysis (Lin et al., 2017, 2022; Brownson et al., 2020), namely that, statistically, both and SFE contribute to the sSFR suppression in central and disk regions, but the relative importance between the and SFE in lowering the vary from galaxy to galaxy. It is essential to note that while may not emerge as the statistically dominant driver of star formation in any of the regions we have examined, this result does not negate the fact that is indeed reduced in quenching galaxies. Instead, what becomes evident is that the magnitude of the reduction in alone is not substantial enough to account for the degree of the suppression observed in star formation.

4 Discussion
The analysis of the radial profiles in this study, as shown in Figure 5, provides a direct visualization of the significance of both and SFE in shaping the star formation behavior in galaxies undergoing quenching. The clear ranking of radial and SFE values in relation to the distance from the global star-forming main sequence, observed across all radial ranges up to 1.5, suggests a gradual suppression of both and SFE as galaxies moving downwards from the main sequence. This finding is consistent with our previous work within the ALMaQUEST series (Lin et al., 2017, 2022), as well as other spatially-resolved studies (e.g., Brownson et al., 2020; Sánchez et al., 2021; Villanueva et al., 2023).
4.1 Quenching Mechanisms
The diverse configuration of dominant quenching drivers, observed both within individual galaxies and across all 22 quenching galaxies, points to a complex set of quenching mechanisms operating within our galaxy sample. Several mechanisms have been proposed to operate in the central regions of galaxies. For instance, feedback from star formation (e.g., Murray et al., 2005; Hopkins et al., 2014) and AGNs (e.g., Sijacki et al., 2007; Hlavacek-Larrondo et al., 2012; Schaye et al., 2015; Weinberger et al., 2018) can disrupt and disperse star-forming clouds, reducing the (e.g., Ellison et al., 2021c; García-Burillo et al., 2021) and consequently lowering . Conversely, gas in galaxies can also be supported thermally by AGN heating or by the non-thermal pressure from the magnetic field, cosmic rays and turbulence to counteract gravitational collapse (Tabatabaei et al., 2018). These effects can lower the SFE while not necessarily reducing . Figure 4 shows that AGN-contaminated spaxels exist in all populations, but there does not appear to be a clear relationship between the fraction of AGN-contaminated spaxels and the galaxy’s deviation from the main sequence within our sample. Nonetheless, there might be a significant time-lag between the initiation of star formation quenching and the emergence of observable AGN signatures (Schawinski et al., 2009).
Beyond the central regions of galaxies, in the context of the morphological quenching scenario (Martig et al., 2009), the formation of a bulge acts to stabilize the gaseous disk of the galaxy, preventing its collapse (i.e., reduction of SFE), without necessarily requiring a mechanism to remove the gas within it (Colombo et al., 2018; Méndez-Abreu et al., 2019). On the other hand, molecular gas within the galactic disk can be removed when the ram pressure of the ISM exceeds the gravitational force provided by the galaxy’s disk (Gunn & Gott, 1972). This removal leads to a reduction in due to the loss of molecular gas content () (Boselli et al., 2014a, 2016; Simpson et al., 2018; Owers et al., 2019; Brown et al., 2023).
The presence of a stellar bar in galaxies also introduces a complex interplay in star formation quenching (Masters et al., 2010; Fraser-McKelvie et al., 2020). The bar-induced torque drives gas inflows toward the galactic center, enhancing the gas content and star formation in the central region (this phenomenon in fact contrasts with the quenching process we have observed for both molecular gas and star formation here) while depleting the bar region of the gas () necessary for star formation (Kuno et al., 2007; Ellison et al., 2011; Zhou et al., 2015; Spinoso et al., 2017; Khoperskov et al., 2018; Chown et al., 2019; George & Subramanian, 2021). Conversely, the bar can also induce shocks and shear, which increase the turbulence of the gas in the bar region; this, in turn, stabilizes the gas against gravitational collapse, leading to the suppression of disk star formation by lowering the SFE (Reynaud & Downes, 1998; Verley et al., 2007; Haywood et al., 2016). A subset of the ALMaQUEST galaxies has been visually identified as barred galaxies through the Galaxy Zoo project; there is also an increasing possibility (based on Galaxy Zoo) of a galaxy being a barred one from SFh, to SFm, and to SFl galaxies. In our forthcoming papers (Hogarth et al. submitted, Lopez-Coba et al. in preparation), we will investigate the properties of these bars in relation to molecular gas and star formation characteristics to gain a deeper understanding of their role in star formation quenching.
Within the ALMaQUEST sample, a few galaxies exhibit asymmetric optical disks, indicating past or ongoing interactions with other galaxies. Previous studies have demonstrated that galaxy interactions have a significant impact on star formation and cold gas properties (Pan et al., 2018; Thorp et al., 2022; Garay-Solis et al., 2023). However, the question of whether the merging process of galaxies can lead to the quenching of star formation remains a topic of debate (e.g., Gabor et al., 2010; Weigel et al., 2017; Rodríguez Montero et al., 2019; Davies et al., 2022; Ellison et al., 2022; Quai et al., 2023). Nevertheless, a larger sample is certainly needed to distinguish between internal processes, such as bulge growth and bar formation, and external processes like galaxy interactions and mergers that regulate star formation and gas properties in galaxies.
While identifying the precise quenching mechanisms and their specific contributions to the observed , , and SFE is beyond the scope of this paper, it is plausible that distinct quenching mechanisms play a role in suppressing star formation across different radial regimes. These mechanisms could exert varying impacts on molecular gas content, resulting in the observed diversity in dominant quenching drivers (, SFE, or both) within our sample. Furthermore, the underlying quenching mechanisms may operate over varying time scales. There is a growing consensus that quenching is not necessarily a rapid process (Ellison et al., 2022) but instead unfolds gradually over a period of 1 – 4 Gyrs (Hahn et al., 2017; Foltz et al., 2018; Wright et al., 2019; Sánchez et al., 2019). The exact timescale of quenching depends on various factors, including galaxy stellar mass (), whether the galaxy is central or a satellite, and the particular underlying quenching mechanisms at play.
4.2 Comparison with Simulations
Several recent studies have explored in simulated green-valley galaxies using galaxy simulations such as FIRE, Illustris, IllustrisTNG, EAGLE, and SIMBA (e.g., Orr et al., 2017; Starkenburg et al., 2019; Appleby et al., 2020; Nelson et al., 2021; Corcho-Caballero et al., 2023a, b; McDonough et al., 2023). Overall, most of the simulated galaxies below the main sequence exhibit lower at nearly every radius compared to star-forming galaxies with similar . The agreement between our observed radial profiles and the trend observed in simulations strengthens the evidence for the global quenching phenomenon. However, we also note that some simulations find centrally enhanced sSFR, rather than the suppressed sSFR found in other simulations (and observations) (FIRE of Orr et al. 2017 and Illustris and EAGLE of Starkenburg et al. 2019).
While inside-out quenching mode is observed commonly in observations for high-mass galaxies (this work; Belfiore et al. 2018; Brownson et al. 2020, ; Bluck et al. 2020b; Nelson et al. 2021; Sánchez et al. 2021; Villanueva et al. 2023), both inside-out and outside-in modes are predicted by simulations for galaxies with similar mass to our sample. The outside-in mode is concluded to be as a result of a strong truncation in the sSFR profiles at 1 for some simulated green-valley galaxies (Illustris and EAGLE of Starkenburg et al. 2019 and SIMBA of Appleby et al. 2020). The sharp cut-off is present in all AGN feedback variants; therefore, this may be originated from the adopted star formation (rather than AGN) prescriptions (Appleby et al., 2020). Furthermore, it is important to note that there is no detection limit for in simulations, unlike in observations. The approach of dealing with the observed fully-quenched regions (i.e., assigning an extremely low but not zero ) would naturally result in simulated galaxies experiencing quenching to a greater degree than our observational galaxies.
Our most-quenched green-valley galaxies (SFl) consistently demonstrate lower cold gas content ( and ) compared to other population groups, consistent with findings from simulations (Appleby et al., 2020). Nevertheless, simulations show a rapid decline in and at radial regimes below approximately 0.6 for both main-sequence and green-valley galaxies, with the drop being more pronounced for green-valley galaxies. However, our observed data do not exhibit this pronounced decrease in central and (Figure 3(c) and 5(b)). This could be due to the overestimate of the feedback/energy injection of the simulated AGNs and their influence in the quenching (Corcho-Caballero et al., 2023a, b). On the other hand, the discrepancy of the central molecular gas between simulated and observed galaxies could potentially be attributed to the assigned CO upper limits for the central quenched regions, which result in an overestimation of and, consequently, in observations. Nevertheless, the accuracy of is presumed to be high, as the majority of spaxels in the central regions, even within the most-quenched population (Figure 4), are detectable in CO. Simulations have demonstrated that the gas content, including H I, H2, and CO, of simulated main-sequence and green-valley galaxies is sensitive to feedback processes from both star formation and AGN (e.g., Lagos et al., 2015; Crain et al., 2017; Diemer et al., 2019; Davé et al., 2020; Ma et al., 2022). Further investigation is required to understand the discrepancy between observations and simulations, but it is evident that cold gas content and its distribution within a galaxy provide strong constraints on feedback processes and galaxy evolution models.
5 Summary
We utilize galaxies obtained from the ALMaQUEST survey (Lin et al., 2020) to investigate the variations in radial profiles of star formation and molecular gas properties. Our aim is to understand how these variations relate to star formation quenching. For this purpose, the 34 non-starburst galaxies in the ALMaQUEST main sample are categorized into three groups, including the star-forming main sequence (SFh), galaxies at the lower end of the main sequence scatter (SFm), and galaxies residing significantly below the main sequence (SFl). Additionally, we also explore whether there exists a preference for a particular quenching driver, such as gas fraction () or star formation efficiency (SFE), at different galactocentric radii. The 12 starburst galaxies in the ALMaQUEST survey were specifically selected to exhibit centrally peaked starbursts (Ellison et al., 2020a). These starburst galaxies are presented as a distinct category and are included in the relevant sections and figures for the purpose of comparison.
Our findings are as follows:
-
•
The median radial profiles of local stellar mass () and molecular gas mass () of each subset, derived by computing the median values from individual profiles, show no significant variation among the three populations. However, the radial profiles of local SFR () exhibit a trend across the examined radial range, with a consistent increase in magnitude observed from the SFl galaxies to the SFm, and finally to the SFh galaxies at almost all radii (Section 3.1.1 and Figure 3).
-
•
Subsequently, we investigate the radial profiles of various physical properties derived from , , and . Specifically, we analyze the radial distribution of the specific SFR ( /), molecular gas fraction ( /), and star formation efficiency (SFE /). Our findings reveal a significant correlation in both magnitude and radial profile between these properties and the transition of galaxies from the star-forming main sequence to lower SFR regimes. The radial profiles of , , and SFE consistently exhibit a gradual decrease in magnitude from the SFh group to the SFl group across almost all radii. These observed trends are not a result of any inherent dependence of gas and star formation properties on global or local , as the selected galaxies have a relatively narrow range of (10.2 – 11.6 M☉ in log scale) and rather uniform profiles. Our findings also support an inside-out quenching scenario for these relatively massive galaxies. (Section 3.1.2 and Figure 5).
-
•
We quantify the relative importance of and SFE at different galactic radii for the galaxies undergoing quenching (SFm and SFl). This is done by comparing the radial profile of and SFE of individual quenching galaxies with the median profiles derived for the main sequence galaxies. We found star formation in quenching galaxies is governed by a range of diverse modes, -driven, SFE-driven, or equally-driven (combination of and SFE). In roughly half of our quenching galaxies, star formation is predominantly regulated by modes that operate across the entire galaxy – whether it is , SFE, or a combination of both. In contrast, the other half exhibits notable complexity, with different drivers influencing star formation at various radial ranges within these galaxies (Section 3.2.1, Figure 6 and 7).
-
•
When analyzing all galaxies together, statistical analysis reveals that the decline in star formation within the central regions ( 0.5 ) of galaxies is primarily attributed to a reduction in SFE. Conversely, in the disk regions ( 0.5 ), both and SFE contribute to the suppression of (Section 3.2.2 and Figure 8).
-
•
The diverse configuration of dominant quenching drivers, observed both within individual galaxies and across all 22 quenching galaxies, suggests that distinct quenching mechanisms may be responsible for suppressing star formation across different radial regimes. These mechanisms, likely operating over varying timescales, could have varying effects on molecular gas content, leading to the observed diversity in the dominant quenching drivers, including , SFE, or a combination of both, within our sample (Section 4.1).
-
•
We compare the radial profiles of and molecular gas properties observed in our study with those derived from galaxy simulations. While inside-out quenching is frequently observed in high-mass galaxies in our sample and other observations, simulations predict both inside-out and outside-in quenching modes for galaxies with similar masses to the ALMaQUEST sample. Additionally, simulations indicate a decrease in and at radial distances below 0.6 for both main-sequence and green-valley galaxies, a trend not observed in the current observational data. These discrepancies is likely attributed to factors on both the simulation and observation sides, including the adopted AGN and star formation prescriptions, as well as the treatments of observational limitations and biases (Section 4.2).
In summary, our results offer valuable insights into the evolution of radial star formation and molecular gas distribution as galaxies moving downwards from the star-forming main sequence. To validate our findings, a larger sample size is essential, enabling a more comprehensive analysis and the differentiation of various quenching mechanisms and their impact on star formation and molecular gas properties. In a companion paper (Lin et al. 2024 ApJ in press), we further investigate the dense gas content traced by HCN and HCO+ of selected ALMaQUEST galaxies to shed light on the origin of low level of star formation activity in transitioning galaxies. On the other hand, achieving a successful galaxy quenching model also requires a thorough comparison between simulations and observations.
We would like to thank the anonymous referee for their careful review and valuable comments which improved the presentation of this manuscript. This work is supported by the National Science and Technology Council of Taiwan under grant 110-2112-M-032-020-MY3. LL acknowledges support from NSTC 111-2112-M-001-044- and NSTC 112-2112-M-001-062-. S.F.S. thanks the PAPIIT-DGAPA AG100622 and CONACYT grant CF1939578 projects. JMS acknowledges support from the National Science Foundation under Grant No 2205551.
This paper makes use of the following ALMA data: ADS/JAO.ALMA#2015.1.01225.S, ADS/JAO.ALMA#2017.1.01093.S,
ADS/JAO.ALMA#2018.1.00541.S,
and ADS/JAO.ALMA#2018.1.00558.S. ALMA is a partnership of ESO (representing its member states), NSF (USA) and NINS (Japan), together with NRC (Canada), MOST and ASIAA (Taiwan), and KASI (Republic of Korea), in cooperation with the Republic of Chile. The Joint ALMA Observatory is operated by ESO, AUI/NRAO, and NAOJ.
Funding for the Sloan Digital Sky Survey IV has been provided by the Alfred P. Sloan Foundation, the U.S. Department of Energy Office of Science, and the Participating Institutions. SDSS-IV acknowledges support and resources from the Center for High-Performance Computing at the University of Utah. The SDSS website is www.sdss.org. SDSS-IV is managed by the Astrophysical Research Consortium for the Participating Institutions of the SDSS Collaboration including the Brazilian Participation Group, the Carnegie Institution for Science, Carnegie Mellon University, the Chilean Participation Group, the French Participation Group, Harvard-Smithsonian Center for Astrophysics, Instituto de Astrofísica de Canarias, The Johns Hopkins University, Kavli Institute for the Physics and Mathematics of the Universe (IPMU)/University of Tokyo, Lawrence Berkeley National Laboratory, Leibniz Institut für Astrophysik Potsdam (AIP), Max-Planck-Institut für Astronomie (MPIA Heidelberg), Max-Planck-Institut für Astrophysik (MPA Garching), Max-Planck-Institut für Extraterrestrische Physik (MPE), National Astronomical Observatory of China, New Mexico State University, New York University, University of Notre Dame, Observatário Nacional/MCTI, The Ohio State University, Pennsylvania State University, Shanghai Astronomical Observatory, United Kingdom Participation Group, Universidad Nacional Autónoma de México, University of Arizona, University of Colorado Boulder, University of Oxford, University of Portsmouth, University of Utah, University of Virginia, University of Washington, University of Wisconsin, Vanderbilt University, and Yale University.
Appendix A Radial Profiles for Individual Galaxies
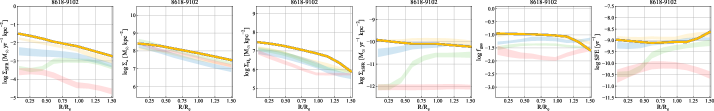
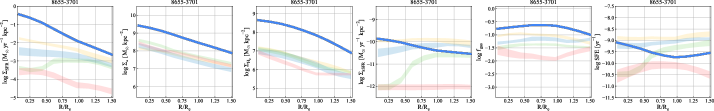
Figure 9 to Figure 14 displays the radial profiles of 46 galaxies in the ALMaQUEST main sample. For each galaxy, from left to right, the radial profiles of , , , , , and SFE are presented. Each individual galaxy’s radial profile is shown as opaque dark-colored bands, with the color representing the galaxy category (yellow for cSB, blue for SFh, green for SFm, and red for SFl). The transparent colored bands represent the median profiles of these properties for galaxies in each category, with the thickness of the bands indicating the standard error of the mean at each radial bin. The median profiles presented here are identical to those shown in Figures 3 and 5.


References
- Appleby et al. (2020) Appleby, S., Davé, R., Kraljic, K., et al. 2020, MNRAS, 494, 6053. doi:10.1093/mnras/staa1169
- Bacchini et al. (2020) Bacchini, C., Fraternali, F., Pezzulli, G., et al. 2020, A&A, 644, A125. doi:10.1051/0004-6361/202038962
- Baker et al. (2022) Baker, W. M., Maiolino, R., Bluck, A. F. L., et al. 2022, MNRAS, 510, 3622. doi:10.1093/mnras/stab3672
- Baker et al. (2023) Baker, W. M., Maiolino, R., Belfiore, F., et al. 2023, MNRAS, 518, 4767. doi:10.1093/mnras/stac3413
- Barrera-Ballesteros et al. (2022) Barrera-Ballesteros, J. K., Sánchez, S. F., Espinosa-Ponce, C., et al. 2022, arXiv:2206.07058. doi:10.48550/arXiv.2206.07058
- Belfiore et al. (2018) Belfiore, F., Maiolino, R., Bundy, K., et al. 2018, MNRAS, 477, 3014. doi:10.1093/mnras/sty768
- Bigiel et al. (2011) Bigiel, F., Leroy, A. K., Walter, F., et al. 2011, ApJ, 730, L13. doi:10.1088/2041-8205/730/2/L13
- Bluck et al. (2020a) Bluck, A. F. L., Maiolino, R., Sánchez, S. F., et al. 2020a, MNRAS, 492, 96. doi:10.1093/mnras/stz3264 doi:10.1093/mnras/stz3264
- Bluck et al. (2020b) Bluck, A. F. L., Maiolino, R., Piotrowska, J. M., et al. 2020b, MNRAS, 499, 230. doi:10.1093/mnras/staa2806
- Bolatto et al. (2013) Bolatto, A. D., Wolfire, M., & Leroy, A. K. 2013, ARA&A, 51, 207. doi:10.1146/annurev-astro-082812-140944
- Boselli et al. (2014a) Boselli, A., Cortese, L., Boquien, M., et al. 2014, A&A, 564, A67. doi:10.1051/0004-6361/201322313
- Boselli et al. (2016) Boselli, A., Roehlly, Y., Fossati, M., et al. 2016, A&A, 596, A11. doi:10.1051/0004-6361/201629221
- Breda et al. (2020) Breda, I., Papaderos, P., Gomes, J. M., et al. 2020, A&A, 635, A177. doi:10.1051/0004-6361/201937193
- Brinchmann et al. (2004) Brinchmann, J., Charlot, S., White, S. D. M., et al. 2004, MNRAS, 351, 1151. doi:10.1111/j.1365-2966.2004.07881.x
- Brown et al. (2023) Brown, T., Roberts, I. D., Thorp, M., et al. 2023, arXiv:2308.10943. doi:10.48550/arXiv.2308.10943
- Brownson et al. (2020) Brownson, S., Belfiore, F., Maiolino, R., et al. 2020, MNRAS, 498, L66. doi:10.1093/mnrasl/slaa128
- Bundy et al. (2015) Bundy, K., Bershady, M. A., Law, D. R., et al. 2015, ApJ, 798, 7. doi:10.1088/0004-637X/798/1/7
- Cano-Díaz et al. (2019) Cano-Díaz, M., Ávila-Reese, V., Sánchez, S. F., et al. 2019, MNRAS, 488, 3929. doi:10.1093/mnras/stz1894
- Cardelli et al. (1989) Cardelli, J. A., Clayton, G. C., & Mathis, J. S. 1989, ApJ, 345, 245. doi:10.1086/167900
- Catalán-Torrecilla et al. (2017) Catalán-Torrecilla, C., Gil de Paz, A., Castillo-Morales, A., et al. 2017, ApJ, 848, 87. doi:10.3847/1538-4357/aa8a6d
- Chown et al. (2019) Chown, R., Li, C., Athanassoula, E., et al. 2019, MNRAS, 484, 5192. doi:10.1093/mnras/stz349
- Colombo et al. (2018) Colombo, D., Kalinova, V., Utomo, D., et al. 2018, MNRAS, 475, 1791. doi:10.1093/mnras/stx3233
- Colombo et al. (2020) Colombo, D., Sanchez, S. F., Bolatto, A. D., et al. 2020, A&A, 644, A97. doi:10.1051/0004-6361/202039005
- Corcho-Caballero et al. (2023a) Corcho-Caballero, P., Ascasibar, Y., Sánchez, S. F., et al. 2023a, MNRAS, 520, 193. doi:10.1093/mnras/stad147
- Corcho-Caballero et al. (2023b) Corcho-Caballero, P., Ascasibar, Y., Cortese, L., et al. 2023b, MNRAS, 524, 3692. doi:10.1093/mnras/stad2096
- Crain et al. (2017) Crain, R. A., Bahé, Y. M., Lagos, C. del P., et al. 2017, MNRAS, 464, 4204. doi:10.1093/mnras/stw2586
- Davé et al. (2020) Davé, R., Crain, R. A., Stevens, A. R. H., et al. 2020, MNRAS, 497, 146. doi:10.1093/mnras/staa1894
- Davies et al. (2022) Davies, J. J., Pontzen, A., & Crain, R. A. 2022, MNRAS, 515, 1430. doi:10.1093/mnras/stac1742
- Diemer et al. (2019) Diemer, B., Stevens, A. R. H., Lagos, C. del P., et al. 2019, MNRAS, 487, 1529. doi:10.1093/mnras/stz1323
- Domínguez Sánchez et al. (2022) Domínguez Sánchez, H., Margalef, B., Bernardi, M., et al. 2022, MNRAS, 509, 4024. doi:10.1093/mnras/stab3089
- Elbaz et al. (2007) Elbaz, D., Daddi, E., Le Borgne, D., et al. 2007, A&A, 468, 33. doi:10.1051/0004-6361:20077525
- Ellison et al. (2011) Ellison, S. L., Nair, P., Patton, D. R., et al. 2011, MNRAS, 416, 2182. doi:10.1111/j.1365-2966.2011.19195.x
- Ellison et al. (2018) Ellison, S. L., Sánchez, S. F., Ibarra-Medel, H., et al. 2018, MNRAS, 474, 2039. doi:10.1093/mnras/stx2882
- Ellison et al. (2020a) Ellison, S. L., Thorp, M. D., Pan, H.-A., et al. 2020a, MNRAS, 492, 6027. doi:10.1093/mnras/staa001
- Ellison et al. (2020b) Ellison, S. L., Thorp, M. D., Lin, L., et al. 2020b, MNRAS, 493, L39. doi:10.1093/mnrasl/slz179
- Ellison et al. (2021a) Ellison, S. L., Lin, L., Thorp, M. D., et al. 2021a, MNRAS, 501, 4777. doi:10.1093/mnras/staa3822
- Ellison et al. (2021b) Ellison, S. L., Lin, L., Thorp, M. D., et al. 2021b, MNRAS, 502, L6. doi:10.1093/mnrasl/slaa199
- Ellison et al. (2021c) Ellison, S. L., Wong, T., Sánchez, S. F., et al. 2021c, MNRAS, 505, L46. doi:10.1093/mnrasl/slab047
- Ellison et al. (2022) Ellison, S. L., Wilkinson, S., Woo, J., et al. 2022, MNRAS, 517, L92. doi:10.1093/mnrasl/slac109
- Ellison et al. (2024) Ellison, S. L., Pan, H.-A., Bluck, A. F. L., et al. 2024, MNRAS, 527, 10201. doi:10.1093/mnras/stad3778
- Foltz et al. (2018) Foltz, R., Wilson, G., Muzzin, A., et al. 2018, ApJ, 866, 136. doi:10.3847/1538-4357/aad80d
- Fraser-McKelvie et al. (2020) Fraser-McKelvie, A., Merrifield, M., Aragón-Salamanca, A., et al. 2020, MNRAS, 499, 1116. doi:10.1093/mnras/staa2866
- Gabor et al. (2010) Gabor, J. M., Davé, R., Finlator, K., et al. 2010, MNRAS, 407, 749. doi:10.1111/j.1365-2966.2010.16961.x
- Garay-Solis et al. (2023) Garay-Solis, Y., Barrera-Ballesteros, J. K., Colombo, D., et al. 2023, ApJ, 952, 122. doi:10.3847/1538-4357/acd781
- García-Benito et al. (2017) García-Benito, R., González Delgado, R. M., Pérez, E., et al. 2017, A&A, 608, A27. doi:10.1051/0004-6361/201731357
- García-Burillo et al. (2021) García-Burillo, S., Alonso-Herrero, A., Ramos Almeida, C., et al. 2021, A&A, 652, A98. doi:10.1051/0004-6361/202141075
- Genzel et al. (2015) Genzel, R., Tacconi, L. J., Lutz, D., et al. 2015, ApJ, 800, 20. doi:10.1088/0004-637X/800/1/20
- George & Subramanian (2021) George, K. & Subramanian, S. 2021, A&A, 651, A107. doi:10.1051/0004-6361/202140697
- González Delgado et al. (2016) González Delgado, R. M., Cid Fernandes, R., Pérez, E., et al. 2016, A&A, 590, A44. doi:10.1051/0004-6361/201628174
- Gunn & Gott (1972) Gunn, J. E. & Gott, J. R. 1972, ApJ, 176, 1. doi:10.1086/151605
- Hahn et al. (2017) Hahn, C., Tinker, J. L., & Wetzel, A. 2017, ApJ, 841, 6. doi:10.3847/1538-4357/aa6d6b
- Haywood et al. (2016) Haywood, M., Lehnert, M. D., Di Matteo, P., et al. 2016, A&A, 589, A66. doi:10.1051/0004-6361/201527567
- Hlavacek-Larrondo et al. (2012) Hlavacek-Larrondo, J., Fabian, A. C., Edge, A. C., et al. 2012, MNRAS, 421, 1360. doi:10.1111/j.1365-2966.2011.20405.x
- Hopkins et al. (2014) Hopkins, P. F., Kereš, D., Oñorbe, J., et al. 2014, MNRAS, 445, 581. doi:10.1093/mnras/stu1738
- Hsieh et al. (2017) Hsieh, B. C., Lin, L., Lin, J. H., et al. 2017, ApJ, 851, L24. doi:10.3847/2041-8213/aa9d80
- Ibarra-Medel et al. (2019) Ibarra-Medel, H. J., Avila-Reese, V., Sánchez, S. F., et al. 2019, MNRAS, 483, 4525. doi:10.1093/mnras/sty3256
- Kalinova et al. (2021) Kalinova, V., Colombo, D., Sánchez, S. F., et al. 2021, A&A, 648, A64. doi:10.1051/0004-6361/202039896
- Kalinova et al. (2022) Kalinova, V., Colombo, D., Sánchez, S. F., et al. 2022, A&A, 665, A90. doi:10.1051/0004-6361/202243541
- Kauffmann et al. (2003) Kauffmann, G., Heckman, T. M., Tremonti, C., et al. 2003, MNRAS, 346, 1055. doi:10.1111/j.1365-2966.2003.07154.x
- Kennicutt (1998) Kennicutt, R. C. 1998, ARA&A, 36, 189. doi:10.1146/annurev.astro.36.1.189
- Kewley et al. (2006) Kewley, L. J., Groves, B., Kauffmann, G., et al. 2006, MNRAS, 372, 961. doi:10.1111/j.1365-2966.2006.10859.x
- Khoperskov et al. (2018) Khoperskov, S., Haywood, M., Di Matteo, P., et al. 2018, A&A, 609, A60. doi:10.1051/0004-6361/201731211
- Koda et al. (2022) Koda, J., Watson, L., Combes, F., et al. 2022, ApJ, 941, 3. doi:10.3847/1538-4357/ac9dfc
- Kuno et al. (2007) Kuno, N., Sato, N., Nakanishi, H., et al. 2007, PASJ, 59, 117. doi:10.1093/pasj/59.1.117
- Lagos et al. (2015) Lagos, C. del P., Crain, R. A., Schaye, J., et al. 2015, MNRAS, 452, 3815. doi:10.1093/mnras/stv1488
- Lah et al. (2023) Lah, P., Scott, N., Barone, T. M., et al. 2023, PASA, 40, e002. doi:10.1017/pasa.2022.58
- Lee et al. (2017) Lee, N., Sheth, K., Scott, K. S., et al. 2017, MNRAS, 471, 2124. doi:10.1093/mnras/stx1753
- Leroy et al. (2008) Leroy, A. K., Walter, F., Brinks, E., et al. 2008, AJ, 136, 2782. doi:10.1088/0004-6256/136/6/2782
- Leroy et al. (2013) Leroy, A. K., Lee, C., Schruba, A., et al. 2013, ApJ, 769, L12. doi:10.1088/2041-8205/769/1/L12
- Lin et al. (2017) Lin, L., Belfiore, F., Pan, H.-A., et al. 2017, ApJ, 851, 18. doi:10.3847/1538-4357/aa96ae
- Lin et al. (2019a) Lin, L., Hsieh, B.-C., Pan, H.-A., et al. 2019a, ApJ, 872, 50. doi:10.3847/1538-4357/aafa84
- Lin et al. (2019b) Lin, L., Pan, H.-A., Ellison, S. L., et al. 2019b, ApJ, 884, L33. doi:10.3847/2041-8213/ab4815
- Lin et al. (2020) Lin, L., Ellison, S. L., Pan, H.-A., et al. 2020, ApJ, 903, 145. doi:10.3847/1538-4357/abba3a
- Lin et al. (2022) Lin, L., Ellison, S. L., Pan, H.-A., et al. 2022, ApJ, 926, 175. doi:10.3847/1538-4357/ac4ccc
- Lin et al. (2024) Lin, L., Pan, H.-A., Ellison, S. L., et al. 2024, arXiv:2401.05976. doi:10.48550/arXiv.2401.05976
- Liu et al. (2016) Liu, F. S., Jiang, D., Guo, Y., et al. 2016, ApJ, 822, L25. doi:10.3847/2041-8205/822/2/L25
- Ma et al. (2022) Ma, W., Liu, K., Guo, H., et al. 2022, ApJ, 941, 205. doi:10.3847/1538-4357/aca326
- Martig et al. (2009) Martig, M., Bournaud, F., Teyssier, R., et al. 2009, ApJ, 707, 250. doi:10.1088/0004-637X/707/1/250
- Martin et al. (2007) Martin, D. C., Wyder, T. K., Schiminovich, D., et al. 2007, ApJS, 173, 342. doi:10.1086/516639
- Masters et al. (2010) Masters, K. L., Mosleh, M., Romer, A. K., et al. 2010, MNRAS, 405, 783. doi:10.1111/j.1365-2966.2010.16503.x
- McDonough et al. (2023) McDonough, B., Curtis, O., & Brainerd, T. 2023, arXiv:2309.16800. doi:10.48550/arXiv.2309.16800
- McKee & Ostriker (2007) McKee, C. F. & Ostriker, E. C. 2007, ARA&A, 45, 565. doi:10.1146/annurev.astro.45.051806.110602
- Medling et al. (2018) Medling, A. M., Cortese, L., Croom, S. M., et al. 2018, MNRAS, 475, 5194. doi:10.1093/mnras/sty127
- Méndez-Abreu et al. (2019) Méndez-Abreu, J., Sánchez, S. F., & de Lorenzo-Cáceres, A. 2019, MNRAS, 488, L80. doi:10.1093/mnrasl/slz103
- Moreno et al. (2021) Moreno, J., Torrey, P., Ellison, S. L., et al. 2021, MNRAS, 503, 3113. doi:10.1093/mnras/staa2952
- Muraoka et al. (2019) Muraoka, K., Sorai, K., Miyamoto, Y., et al. 2019, PASJ, 71, S15. doi:10.1093/pasj/psz015
- Murray et al. (2005) Murray, N., Quataert, E., & Thompson, T. A. 2005, ApJ, 618, 569. doi:10.1086/426067
- Nelson et al. (2021) Nelson, E. J., Tacchella, S., Diemer, B., et al. 2021, MNRAS, 508, 219. doi:10.1093/mnras/stab2131
- Noeske et al. (2007) Noeske, K. G., Weiner, B. J., Faber, S. M., et al. 2007, ApJ, 660, L43. doi:10.1086/517926
- Orr et al. (2017) Orr, M. E., Hayward, C. C., Nelson, E. J., et al. 2017, ApJ, 849, L2. doi:10.3847/2041-8213/aa8f93
- Owers et al. (2019) Owers, M. S., Hudson, M. J., Oman, K. A., et al. 2019, ApJ, 873, 52. doi:10.3847/1538-4357/ab0201
- Pan et al. (2016) Pan, Z., Zheng, X., Lin, W., et al. 2016, ApJ, 819, 91. doi:10.3847/0004-637X/819/2/91
- Pan et al. (2018a) Pan, H.-A., Lin, L., Hsieh, B.-C., et al. 2018a, ApJ, 854, 159. doi:10.3847/1538-4357/aaa9bc
- Pan et al. (2018) Pan, H.-A., Lin, L., Hsieh, B.-C., et al. 2018b, ApJ, 868, 132. doi:10.3847/1538-4357/aaeb92
- Pan et al. (2022) Pan, H.-A., Schinnerer, E., Hughes, A., et al. 2022, ApJ, 927, 9. doi:10.3847/1538-4357/ac474f
- Piotrowska et al. (2020) Piotrowska, J. M., Bluck, A. F. L., Maiolino, R., et al. 2020, MNRAS, 492, L6. doi:10.1093/mnrasl/slz172
- Piotrowska et al. (2022) Piotrowska, J. M., Bluck, A. F. L., Maiolino, R., et al. 2022, MNRAS, 512, 1052. doi:10.1093/mnras/stab3673
- Quai et al. (2023) Quai, S., Byrne-Mamahit, S., Ellison, S. L., et al. 2023, MNRAS, 519, 2119. doi:10.1093/mnras/stac3713
- Reynaud & Downes (1998) Reynaud, D. & Downes, D. 1998, A&A, 337, 671
- Rodríguez Montero et al. (2019) Rodríguez Montero, F., Davé, R., Wild, V., et al. 2019, MNRAS, 490, 2139. doi:10.1093/mnras/stz2580
- Saintonge et al. (2016) Saintonge, A., Catinella, B., Cortese, L., et al. 2016, MNRAS, 462, 1749. doi:10.1093/mnras/stw1715
- Saintonge et al. (2017) Saintonge, A., Catinella, B., Tacconi, L. J., et al. 2017, ApJS, 233, 22. doi:10.3847/1538-4365/aa97e0
- Salim (2014) Salim, S. 2014, Serbian Astronomical Journal, 189, 1. doi:10.2298/SAJ1489001S
- Salpeter (1955) Salpeter, E. E. 1955, ApJ, 121, 161. doi:10.1086/145971
- Sánchez et al. (2018) Sánchez, S. F., Avila-Reese, V., Hernandez-Toledo, H., et al. 2018, Rev. Mexicana Astron. Astrofis., 54, 217
- Sánchez et al. (2019) Sánchez, S. F., Avila-Reese, V., Rodríguez-Puebla, A., et al. 2019, MNRAS, 482, 1557. doi:10.1093/mnras/sty2730
- Sánchez (2020) Sánchez, S. F. 2020, ARA&A, 58, 99. doi:10.1146/annurev-astro-012120-013326
- Sánchez et al. (2021) Sánchez, S. F., Walcher, C. J., Lopez-Cobá, C., et al. 2021, Rev. Mexicana Astron. Astrofis., 57, 3. doi:10.22201/ia.01851101p.2021.57.01.01
- Sandstrom et al. (2013) Sandstrom, K. M., Leroy, A. K., Walter, F., et al. 2013, ApJ, 777, 5. doi:10.1088/0004-637X/777/1/5
- Sargent et al. (2014) Sargent, M. T., Daddi, E., Béthermin, M., et al. 2014, ApJ, 793, 19. doi:10.1088/0004-637X/793/1/19
- Schawinski et al. (2009) Schawinski, K., Virani, S., Simmons, B., et al. 2009, ApJ, 692, L19. doi:10.1088/0004-637X/692/1/L19
- Schawinski et al. (2014) Schawinski, K., Urry, C. M., Simmons, B. D., et al. 2014, MNRAS, 440, 889. doi:10.1093/mnras/stu327
- Schaye et al. (2015) Schaye, J., Crain, R. A., Bower, R. G., et al. 2015, MNRAS, 446, 521. doi:10.1093/mnras/stu2058
- Scoville et al. (2016) Scoville, N., Sheth, K., Aussel, H., et al. 2016, ApJ, 820, 83. doi:10.3847/0004-637X/820/2/83
- Sijacki et al. (2007) Sijacki, D., Springel, V., Di Matteo, T., et al. 2007, MNRAS, 380, 877. doi:10.1111/j.1365-2966.2007.12153.x
- Simpson et al. (2018) Simpson, C. M., Grand, R. J. J., Gómez, F. A., et al. 2018, MNRAS, 478, 548. doi:10.1093/mnras/sty774
- Spindler et al. (2018) Spindler, A., Wake, D., Belfiore, F., et al. 2018, MNRAS, 476, 580. doi:10.1093/mnras/sty247
- Spinoso et al. (2017) Spinoso, D., Bonoli, S., Dotti, M., et al. 2017, MNRAS, 465, 3729. doi:10.1093/mnras/stw2934
- Starkenburg et al. (2019) Starkenburg, T. K., Tonnesen, S., & Kopenhafer, C. 2019, ApJ, 874, L17. doi:10.3847/2041-8213/ab0f34
- Strateva et al. (2001) Strateva, I., Ivezić, Ž., Knapp, G. R., et al. 2001, AJ, 122, 1861. doi:10.1086/323301
- Stuber et al. (2023) Stuber, S. K., Schinnerer, E., Williams, T. G., et al. 2023, arXiv:2305.17172. doi:10.48550/arXiv.2305.17172
- Sun et al. (2023) Sun, J., Leroy, A. K., Ostriker, E. C., et al. 2023, ApJ, 945, L19. doi:10.3847/2041-8213/acbd9c
- Tabatabaei et al. (2018) Tabatabaei, F. S., Minguez, P., Prieto, M. A., et al. 2018, Nature Astronomy, 2, 83. doi:10.1038/s41550-017-0298-7
- Tacconi et al. (2018) Tacconi, L. J., Genzel, R., Saintonge, A., et al. 2018, ApJ, 853, 179. doi:10.3847/1538-4357/aaa4b4
- Thorp et al. (2022) Thorp, M. D., Ellison, S. L., Pan, H.-A., et al. 2022, MNRAS, 516, 1462. doi:10.1093/mnras/stac2288
- Verley et al. (2007) Verley, S., Combes, F., Verdes-Montenegro, L., et al. 2007, A&A, 474, 43. doi:10.1051/0004-6361:20077650
- Villanueva et al. (2023) Villanueva, V., Bolatto, A. D., Vogel, S. N., et al. 2023, arXiv:2312.03995. doi:10.48550/arXiv.2312.03995
- Walmsley et al. (2022) Walmsley, M., Lintott, C., Géron, T., et al. 2022, MNRAS, 509, 3966. doi:10.1093/mnras/stab2093
- Wang & Wei (2008) Wang, J. & Wei, J. Y. 2008, ApJ, 679, 86. doi:10.1086/587048
- Wang et al. (2017) Wang, W., Faber, S. M., Liu, F. S., et al. 2017, MNRAS, 469, 4063. doi:10.1093/mnras/stx1148
- Wang et al. (2018) Wang, E., Li, C., Xiao, T., et al. 2018, ApJ, 856, 137. doi:10.3847/1538-4357/aab263
- Wang et al. (2019) Wang, E., Lilly, S. J., Pezzulli, G., et al. 2019, ApJ, 877, 132. doi:10.3847/1538-4357/ab1c5b
- Wang et al. (2022) Wang, D., Croom, S. M., Bryant, J. J., et al. 2022, MNRAS, 516, 3411. doi:10.1093/mnras/stac2428
- Watson et al. (2016) Watson, L. C., Martini, P., Lisenfeld, U., et al. 2016, MNRAS, 455, 1807. doi:10.1093/mnras/stv2412
- Weigel et al. (2017) Weigel, A. K., Schawinski, K., Caplar, N., et al. 2017, ApJ, 845, 145. doi:10.3847/1538-4357/aa8097
- Weinberger et al. (2018) Weinberger, R., Springel, V., Pakmor, R., et al. 2018, MNRAS, 479, 4056. doi:10.1093/mnras/sty1733
- Wright et al. (2019) Wright, R. J., Lagos, C. del P., Davies, L. J. M., et al. 2019, MNRAS, 487, 3740. doi:10.1093/mnras/stz1410
- Wyder et al. (2007) Wyder, T. K., Martin, D. C., Schiminovich, D., et al. 2007, ApJS, 173, 293. doi:10.1086/521402
- Wylezalek et al. (2022) Wylezalek, D., Cicone, C., Belfiore, F., et al. 2022, MNRAS, 510, 3119. doi:10.1093/mnras/stab3356
- Yan & Blanton (2012) Yan, R. & Blanton, M. R. 2012, ApJ, 747, 61. doi:10.1088/0004-637X/747/1/61
- Zhou et al. (2015) Zhou, Z.-M., Cao, C., & Wu, H. 2015, AJ, 149, 1. doi:10.1088/0004-6256/149/1/1