Testing for publication bias in meta-analysis under Copas selection model
Abstract
In meta-analyses, publication bias is a well-known, important and challenging issue because the validity of the results from a meta-analysis is threatened if the sample of studies retrieved for review is biased. One popular method to deal with publication bias is the Copas selection model, which provides a flexible sensitivity analysis for correcting the estimates with considerable insight into the data suppression mechanism. However, rigorous testing procedures under the Copas selection model to detect bias are lacking. To fill this gap, we develop a score-based test for detecting publication bias under the Copas selection model. We reveal that the behavior of the standard score test statistic is irregular because the parameters of the Copas selection model disappear under the null hypothesis, leading to an identifiability problem. We propose a novel test statistic and derive its limiting distribution. A bootstrap procedure is provided to obtain the p-value of the test for practical applications. We conduct extensive Monte Carlo simulations to evaluate the performance of the proposed test and apply the method to several existing meta-analyses.
KEY WORDS: meta-analysis, non-standard problem, selection model, small-study effects
1 Introduction
The rapid growth of evidence-based medicine has led to substantially increased attention towards meta-analysis, which combines statistical evidence from multiple studies to improve power and precision (Cohn and Becker, 2003; Jackson et al., 2011). A common and challenging issue in the use of meta-analysis is small-study effects (SSE), which undermines the validity of results from a standard meta-analysis (Egger et al., 1997; Sterne et al., 2000; Yin and Shi, 2019). SSE refer to the phenomenon that smaller studies show different, often larger, treatment effects than larger studies. Common reasons for SSE include publication bias, choice of outcome measure (eg. odds ratios or probabilities) and clinical heterogeneity. While other sources of SSE can be accounted for through subgroup analysis (in the case of clinical heterogeneity) and variance-stabilizing transformation of the outcome, publication bias is particularly concerning as it involves drawing conclusions on an incomplete, selective body of evidence. It is defined as the publication of studies depending on the direction and statistical significance of results, as well as other potential information such as language (selective inclusion of studies published in English) and availability (selective inclusion of studies easily accessible to the researcher) (Dickersin, 2005). Thus combining only the identified published studies may lead to incorrect, commonly optimistic conclusions. In the last two decades, several studies have shown that trials with significant or “positive” findings are more likely to be published than trials with non-significant results (Hopewell et al., 2009; Johnson et al., 2017). While a great deal of effort has been devoted to developing statistical methods to detect and correct for SSE, less work has been done on a testing approach specifically for publication bias.
The current testing methods for SSE are graph-based and rely on the principle of asymmetry, which is considered as a proxy for SSE. When treatment effects from individual studies are mapped against their corresponding precisions, as in the widely used funnel plot, the presence of asymmetry can suggest SSE (Egger et al., 1997; Sterne et al., 2000, 2001). Thus regression tests (Begg and Mazumdar, 1994; Egger et al., 1997; Macaskill et al., 2001; Sterne et al., 2001; Moreno et al., 2009) and rank-based tests (Duval and Tweedie, 2000) have been developed to more formally detect scatter plot asymmetry. However, asymmetry alone does not distinguish between publication bias and other causes of SSE, incluing induced correlation between the effect size and standard error due to clinical or methodological differences between studies, or the choice of outcome measure used (Sterne et al., 2011). Furthermore, when asymmetry is the result of publication bias, the tests have limited power when the sample size is small or only a moderate amount of bias is present (Sterne et al., 2000).
As an alternative to graph-based approaches, researchers have proposed several selection models that impose parametric distributions to explicitly characterize the underlying mechanism for publication (Hedges, 1984, 1992; Iyengar and Greenhouse, 2009). Most notably, a selection model was suggested in a series of papers by Copas and his colleagues (Copas and Li, 1997; Copas, 1999; Copas and Shi, 2000, 2001) which assumes that the selection probability depends on both the effect size estimate and its standard error. Unlike the graph-based methods, the Copas selection model has an advantage of explicitly relating the pattern of observed study estimates and precisions to a publication mechanism, unrelated to other possible forms of correlation between the estimates and standard errors. However, as acknowledged by copas2001sensitivity, the data often contain little information on the parameters that characterize the publication mechanism. Direct inference on the complete set of parameters is challenging since the likelihood function approaches a plateau around a wide range of parameter values (carpenter2009copas). Alternatively, statistical inference on the Copas selection model is primarily conducted through sensitivity analysis which considers a range of possible values for some parameters (copas2001sensitivity; carpenter2009copas).
In copas2000meta, the authors proposed a simple testing approach based on a parametric modelling of the linear relationship of the effect sizes and the standard errors, which does not fully utilize the features of the Copas selection model. There is limited work on a hypothesis testing approach that is directly based on Copas’ model. A primary reason might be that the standard testing procedures (e.g., Wald test, score test or likelihood ratio test) cannot be applied directly due to some non-regularity issues. Specifically, it will be shown later in this paper that under the null hypothesis where there is no selection bias, some of the parameters in Copas selection model are not identifiable and the corresponding Fisher information matrix is singular. The non-identifiability problem has been considered by many theoretical statisticians and is sometimes referred to as the Davies problem (davies1977hypothesis; davies1987hypothesis). The singular information matrix problem has been considered by rotnitzky2000likelihood and is often encountered in mixture model settings (qin2011hypothesis; ning2014class; HongJASA2017). In general, hypothesis testing procedures with the above problems are non-standard and have to be considered with special attention.
In this paper, we propose a novel score test to circumvent the above two non-regularity problems. We observe that although the information matrix is singular under the null, a submatrix of the information matrix is still positive definite. By fixing the non-identifiable parameters at pre-specified values, a score test can still be constructed. To avoid the dependence of the inference on the choice of pre-specified values, we propose a score test by taking the maximum of score test statistics over a grid of possible pre-specified values. We also investigate how the range of the grid and number of grid points impact the performance of the test. The proposed score test is shown to converge weakly to the supreme of a Gaussian process. To enable the hypothesis testing procedure, we also propose a parametric bootstrap procedure, which can be easily implemented in practice.
The remainder of this paper is organized as follows. Section introduces the Copas selection model and describes the proposed score test, its asymptotic distribution and a parametric bootstrap procedure. In Section we present results from simulation studies to investigate the finite sample performance of the proposed test, its sensitivity to the choice of grids, and compare it with the existing tests. In Section , we apply the proposed test and existing tests to two case studies of systematic reviews. A discussion is provided in Section .
2 Method
2.1 Copas selection model
In this subsection we restate the Copas selection model proposed by copas1997inference, and describe a slight modification. Let denote the reported effect size in the -th study. We assume follows a normal distribution with mean and variance , where is the true study variance which is often not observed, and we observe only an estimator of the true variance. Suppose the underlying effect size of the study is and it is assumed to follow a normal distribution with mean , the population averaged effect size, and variance . The parameter describes the between study heterogeneity, while denotes the within-study sampling variance.
We model the observed outcome of study using the usual random effects model as
| (2.1) |
Model (2.1) can also be written as
According to the Copas selection model, the study is published if and only if a postulated latent variable , where this can be written as
| (2.2) |
with and being unknown parameters which control the marginal probability of observing a study and is a random variable following a standard normal distribution. The parameter controls the overall proportion of selection and controls how the selection depends on the size of the study. The sign of is expected to be positive, since larger studies are more likely to be accepted for publication. Publication bias is modeled by assuming a correlation between and , such that
| (2.3) |
The correlation controls how the probability of observing a study is influenced by the effect size of a study. From equation (2.2), we can calculate the marginal probability of the -th study with a standard error being published as
where is the cumulative distribution function of the standard normal distribution.
To make inference on the population averaged effect size , we can construct the log-likelihood of the observed studies,
| (2.4) |
where
In the above likelihood, the unknown parameters can be approximated using the observed variables to reduce the number of unknown parameters. In copas2000meta, a function of the reported sampling variance is used to approximate , based on the derivation from the conditional probability. However, we propose to directly use the reported sampling variance to approximate the unknown within-study variance . In the publication process, the study is first conducted and then selected. Regardless of whether the study is suppressed or observed, the value of is obtained before the publication process, which should provide a fairly good estimation of the true variance . By replacing with , the unknown parameters in the likelihood function are reduced to and .
2.2 Testing for publication bias
When the correlation parameter , it indicates that and are uncorrelated. In this case, the quantity in the likelihood function (2.4) reduces to the marginal probability . The likelihood then reduces to the likelihood of the univariate random-effects model. Therefore, the univariate random-effects meta-analysis leads to correct inference for the overall effect and between-study variance when the correlation is zero. On the other hand, when , the standard meta-analysis leads to biased estimation of the parameters and . Thus, under the model specified by equations (2.1) and (2.2), testing for publication bias is equivalent to testing for .
However, the standard results for asymptotic tests may not apply because of the following challenges:
(N1) Parameters and are not identifiable under the null hypothesis;
(N2) The Fisher information matrix is singular under the null hypothesis.
The asymptotic distribution of the likelihood ratio test under the above conditions is often not a distribution. Hypothesis testing procedures are non-standard, and have to be considered on a case-by-case basis (davies1977hypothesis; davies1987hypothesis; rotnitzky2000likelihood). For example, the test of homogeneity in mixture models or mixture regression models, genetic admixture models, case-control studies with contaminated controls and testing for partial differential gene expression in microarray studies (qin2011hypothesis; ning2014class; HongJASA2017). Naive tests ignoring the above non-regularity conditions can produce misleading results. For example, the Wald test based on is invalid because the negative Hessian matrix of the log-likelihood is singular under the null hypothesis.
Motivated by the method in Rathouz1999Biometrika, when and are fixed at some known numbers, the submatrix of the Fisher information matrix is non-singular, and consequently the non-regular conditions (N1) and (N2) are avoided. To account for these facts, we propose a score test constructed as:
| (2.5) |
where is the constrained MLE of under for a given pair of values for ,
| (2.6) |
and is the estimated partial information matrix where its explicit form is defined in the Supplementary Material.
This test statistic is to calculate the score test statistic for a given pair of values for and , and then construct by taking the supreme value of over a grid of and . The range of and could be decided similarly to the sensitivity analysis in the Copas model. Usually, the range for could be , and the range for depends on the range of to make sure that the probability of the largest study being published is greater than a certain probability threshold (e.g. 0.9) and the probability of the smallest study being published is less than a certain probability threshold (e.g. 0.1). Additional discussion regarding how to choose the grid can be found in Appendix C of the Supplementary Materials. Deriving the asymptotic distribution of can be challenging and it may not be of a simple form for practical use. In such a case, a bootstrap procedure can be used if the asymptotic distribution is well behaved.
2.3 Asymptotic results and a simple parametric bootstrap procedure
In this subsection, we provide the asymptotic distribution of the proposed test, followed by a parametric bootstrap procedure for practical application.
Theorem 1.
Assume that the regularity conditions in Appendix A of the Supplementary Materials hold. Under the null hypothesis that , the test statistic converges weakly to , where is a Gaussian process with variance 1 and the autocorrelation
where is the conditional information defined in the Appendix B of the Supplementary Material.
Theorem 1 provides the limiting distribution of the proposed test statistic , and also provides the theoretical foundation for the following parametric bootstrap procedure which offers a simpler way to obtain a p-value for the test.
-
1.
For observed studies of a meta-analysis, calculate the test statistic in equation (2.5), denoted by .
-
2.
Estimate , which is the MLE of under the null hypothesis of .
-
3.
Generate independent bootstrap samples (e.g. =200), each consisting of observations. Specifically, for we generate independently, and are drawn from the within-study standard errors of the original data with replacement. Then the bootstrap sample is constructed by sampling , and
-
4.
Evaluate the score test statistic for each bootstrap sample. Denote .
-
5.
The p-value is computed by .
In meta-analysis, the number of studies is often small or moderate. Therefore the computation time for the above parametric bootstrap is reasonable.
3 Simulation studies
We conducted simulation studies to examine the performance of our score test statistic. In our simulation, we generated the observed within-study variance from the fold normal distribution , and generate from . The between study variance was set to and the overall effect size was 0.4. The variables and were generated together from a bivariate normal distribution with correlation and variance . The selection parameters were set to be . If , the study was suppressed. We generated and as above until there were observations. We used grid partition on the square region of [-2,2] [0,2] by 2,500 grid points with row unit of 0.08 and column unit of 0.04. In order to reduce the computational task, we did not use all the points in the grid region. Instead, we randomly chose points from the grid to calculate the test statistic. We used the parametric bootstrap described in Section 2.3 to obtain the p-value of the proposed test.
3.1 Investigating the influence of number of points from grids on the statistical power of the proposed test

We first studied the influence of number of grid points on the performance of the test in terms of both type I error and power. Figure 1 presented the empirical rejection rates (i.e., type I error and power) under various numbers of grid points and sample size settings. In order to evaluate the loss of power due to the lack of knowledge on the parameters that characterize the publication process, we included a test statistic calculated from equation (2.6) with fixed at the true value. This test, although not practical in real application due to the unknown truth of , can serve as a gold standard that informs the best possible statistical power under the Copas model.
Figure 1 revealed the following interesting findings. First, under the null hypothesis of no publication bias, i.e. , for all scenarios with different numbers of grid points, the empirical type I errors were close to the nominal level. This suggested that the parametric bootstrap described in Section 2.3 performed well. Secondly, by selecting more grid points, the statistical power of the proposed test increased. For example, when the sample size and , the power increased from 85.1% with to 93.6% with . For most cases, the increase of power was rather limited when changed from to . Thirdly, by comparing the empirical power of the proposed test with the power of the test with fixed at the true value (i.e., the last column), we found that the proposed test only suffered a minimal loss of power due to the unknown . These findings suggested that in practice, the proposed test can be performed by taking several random points from the grid (e.g. ), and it can still ensure a close statistical power to the ideal test with known and .
3.2 Comparing the proposed test with existing methods under the Copas model
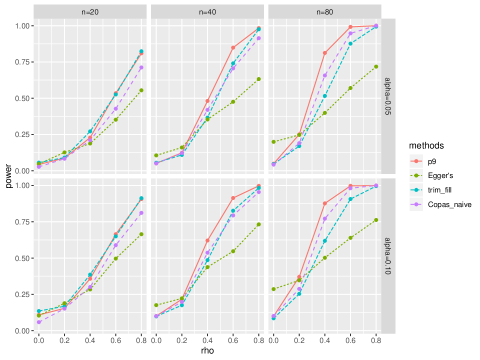
We compared the proposed test with the Trim and Fill test, Egger’s test, and the test proposed in copas2000meta. From the results presented in Table 1, it was reasonable to consider the proposed test with only a few grid points. Thus we considered the proposed test with 9 points selected from the grid.

Figure 2 showed the comparison of type I error and power. For all scenarios, the type I errors were well controlled for the proposed test, but were slightly inflated for Egger’s test. For the power comparison, the proposed test had the highest power among all scenarios. The Trim and Fill method outperformed the Egger’s test and Copas naive test when sample size was small, while the Copas naive test outperformed the Trim and Fill method and Egger’s test for larger sample sizes.
3.3 Power analysis when Copas model is not the true model
In the Copas model, Equation (2.1) is the random-effects assumption commonly used in the area of meta-analysis, which captures both the normality of estimates from each study, and the heterogeneity across studies. Equation (2.2) is a working model describing the publication process, which captures several main features. First, there is stronger suppression on smaller studies compared to larger studies. They therefore set the latent variable to be positively correlated to the precision of the estimate, i.e., , which can be considered as a proxy of the size of the study. Second, if there is publication bias, studies with larger effect sizes () has higher chance to be published given the precision (). In the Copas model, this is captured by the correlation , where a larger leads to stronger correlation between and .
It is interesting to investigate the sensitivity of the proposed method, which is based on the Copas model, when the Copas model is not the correct model. To come up with some alternatives of the Copas selection model, we retain the random-effects model in Equation (2.1), and alter the latent variable . We also maintain the two features where stronger suppression on smaller studies compared to larger studies, and studies with larger effect sizes () have higher chances to be published given the precision () in the existence of publication bias. We considered the following two alternative models.
The first model modifies the functional relationship between and the term , by changing equation (2) to
| (3.1) |
so that is a linear function of , instead of . This is possible since the variance is roughly proportional to sample size of study , and could be a better proxy of the size of the study.
Secondly, we change the way of characterizing publication bias. Instead of assuming a correlation , we let to be directly related to in the existence of publication bias, by assuming
| (3.2) |
where is some positive scaling constant. This model links with the -score , as the selection process could be depending on the -score directly. Under Equation (3.2), it still holds that means no publication bias and studies with larger effect sizes () have higher chances to be published given the precision () in the existence of publication bias. In our simulation, we let vary from to to match the previous setting (in fact, in this alternative model does not need to be within and ), and set to obtain a proper range for the power curve.
To investigate the power and type I error of the proposed test under misspecified models, we simulated data from (3.1) and (3.2), and compared the performance of our method with existing methods. The results are presented in Figure 3. Under these two settings where the Copas model is the misspecified model, the power of the proposed test with points from the grid had similar power as the Trim and Fill method when sample size was small, and outperformed other methods with the increase of sample size. The type I error of the proposed method was still well-controlled around the nominal levels.

In summary, our simulation studies demonstrated that the proposed score test under Copas selection model behaves well with controlled Type I error and competitive statistical power relative to the existing tests. Furthermore, the implementation of the proposed test requires a small number of grid points and is computationally straightforward using parametric bootstrap.
4 Data Analysis
4.1 A meta-analysis of antidepressants comparing published studies with FDA reviews
Antidepressants are among the world’s most widely prescribed drugs, where many meta-analyses were conducted to synthesize evidence from existing trials to obtain a more reliable and generalizable results regarding treatment efficacy and safety (barbui2011efficacy; cipriani2018comparative). By comparing trials of antidepressants that were published in the literature and unpublished trials obtained from the Food and Drug Administration (FDA), Turner et al. turner2008selective identified strong evidence for selective bias due to publication towards results favoring active interventions.
Although collecting information for unpublished trials is normally not feasible for meta-analyses, this unique dataset from turner2008selective provide an opportunity to validate our method in an ideal situation, where the unpublished studies were actually observed. Among the 74 FDA-registered studies, 31% were not published. Figure 4 shows the contour enhanced funnel plots for all the published trials and all the registered trials.

By comparing the two funnel plots, we observed clear evidence that several non-significant results were suppressed for publication. Applied on all the published studies, our test yielded a p-value less than , showing strong evidence of publication bias. Egger’s test also captured the evidence for bias with a p-value less than . The Trim and Fill method, however, has a p-value of , possibly driven by the left most trial with relatively large precision and small effect, which suggests its lack of power in the existence of outlying studies.
A more interesting investigation is to apply the above methods on all the FDA-registered trials. By including all the unpublished studies, our test had a p-value of which suggested insufficient evidence for publication bias. Egger’s test, however, had a p-value of , still showing marginal evidence for SSE which was likely not caused by publication bias. Trim and Fill test maintained a non-significant p-value of , as the symmetry of the funnel plot is improved by adding all the unpublished results.
This case study demonstrated the capability our method for testing publication bias, which on the other than also showed the different focus of our test compared to existing methods. Based on the Copas model, our test is to detect the evidence for publication bias, where majority of the current methods, including Egger’s test and the Trim and Fill method, is for testing SSE. Combing our test with existing methods, we are able to provide a more comprehensive understanding of the potential sources of bias.
4.2 A meta-analysis on the effect of chewing gum after surgery to help recovery of the digestive system
When patients have surgery on their abdomen, they are at risk to develop ileus, which is the inability of the intestine (bowel) to contract normally and move waste out of the body. Chewing gum could be one possible way to prevent ileus, since it tricks the body into thinking it is eating, and may help the digestive system to start working again. To investigate the effect of gum-chewing, Short et al. short2015chewing did a systematic review, which included relevant trials focussed on people having bowel surgery, caesarean section, or other abdominal surgery types. Using time to first flatus (TFF) as the primary outcome, slight improvement was identified comparing the gum-chewing groups to the control groups with an overall decrease of TFF ranging from 7.92 to 12.64 hours across different subgroups of surgery types.

To invesigate the potential risk for publication bias, we applied our method to the subgroup of trials for abdominal surgery types other than colorectal surgery and Caesarean, which was referred to the“Other Surgery” subgroup in short2015chewing. This subgroup included in total 43 studies and 4224 participants. Figure 5 presented the funnel plot of the mean different of TFF comparing the control group to the gum-chewing group. From Figure 5, we observed a possible trend of selection by sign, where more studies with positive mean differences were observed. Many larger studies had mean difference near , but only one study among the 43 studies had negative mean difference.
Applying our method with a -point grid, we obtained a p-value of , suggesting significance evidence for publication bias. The Trim and Fill method had a p-value of and the Egger’s test had a p-value of . The non-significant p-values from the Trim-and-Fill method and the Egger’s test were likely due to the lack of funnel shape of the studies, where larger study were not observed to be more centered compared to the smaller studies, and the fact that the funnel plot was relatively symmetric.
In this study, our test was able to capture the evidence for potential publication bias, which was consistent with our observation from the funnel plot. We then conducted the Copas sensitivity analysis and obtained the adjusted overall mean difference to be , which was smaller compared to the overall mean difference obtained by short2015chewing. Although both results suggested chewing gum has significant effect in terms of decreasing the TFF, our testing approach revealed the risk for publication bias, where sensitivity analyses are recommended in order to explore the possible overall mean difference after adjusting for publication bias. We believe that our method can be used as an complement of the existing methods for evaluating the risk of publication bias, which is crucial in assessing the reliability of conclusions from meta-analysis.
5 Discussion
Publication bias is a major threat to the validity of meta-analysis. In this paper, we proposed a testing procedure to detect publication bias under the Copas selection model, as an alternative to current graph and symmetry based methods. The standard score test under the Copas selection model is irregular since some model parameters disappear and the Fisher information matrix is singular under the null hypothesis. To circumvent these challenges, we constructed the test statistic by calculating the score test statistic for some fixed and on a grid, and taking the maximum value of score test statistics with different and over a grid. The asymptotic distribution of the test statistic was derived, and a parametric bootstrap procedure was developed to obtain p-values. We studied the empirical performance of our test statistic in terms of type I error and power under several scenarios in the simulation studies. Interestingly, we found that when increasing the number of grid points of and , the statistical power increased and then became stable after some threshold. On the other hand, even when randomly choosing only a few points on the grid, the statistical power of our test was good relative to the best scenario in which the parameters in the Copas selection model were known. This empirical finding suggested some degree of optimality of the proposed test under the Copas selection model.
There are several remarks on our proposed test. First, this proposed test is purely based on the Copas selection model, which is a parametric model of the publication mechanism. However, the real publication mechanism may be more complex and it is difficult to specify the true selection model based on the observed data (copas2004bound). Models such as gleser1996models and rucker2010treatment provide alternative ways for modeling selection bias. On the other hand, copas2001sensitivity argued that despite the complexity of the true selection model, it is important to have a reasonably plausible model that can help to understand the publication mechanism. Empirical evaluation on a large number of meta-analyses has shown that the Copas model is capable of capturing the evidence of selection bias, as well as providing relatively clear interpretation (carpenter2009empirical). Our work filled an important research gap by proposing a hypothesis testing procedure for publication bias based on the well-accepted Copas selection model, and can be routinely applied to quantify the evidence of publication bias before conducting any sensitivity analysis using Copas model.
We suggest the readers to use the proposed test as a way of evaluating the quality of the evidence from meta-analysis. Similar to how was designed for quantifying the heterogeneity for meta-analyses, our test statistic and the corresponding value can serve as a quantification of the potential risk of publication bias, based on the Copas selection model. Larger p-values correspond to lower risk of selective publishing. If an extremely small p-value is observed, it alerts the investigators to a potential risk for bias. Ideally, this should prompt investigators to carefully search for unpublished and ongoing studies in international trial registers and drug approval agency websites, to obtain a more complete body of evidence for meta-analysis. However, if there are constraints on time and resources, or it is expected that many trials are unregistered (as with older studies), methods for bias reduction may also be used to account for publication bias. These include a Copas-based sensitivity analysis, the EM algorithm proposed by ning2017maximum, and the non-parametric Trim and Fill method. However, as all post-hoc bias correction methods rely on untestable assumptions, we recommend treating them as sensitivity analysis rather than the main results of the meta-analysis.
A second remark on our work is that we have focused on the case of univariate meta-analysis. In some applications, multiple outcomes are reported. For example, in diagnostic accuracy studies, both sensitivity and specificity of a diagnostic test are reported. In clinical trials comparing two treatments, outcomes related to treatment efficacy and safety are often reported. Models are developed for multivariate meta-analysis in order to jointly model the observed outcomes of interest. It is of interest to consider the publication bias problem when multiple outcomes are considered. Moreover, in multivariate meta-analyses, some studies only report part of the outcomes. This missing-data problem often causes bias in estimation if the missingness is related to the magnitude of the unobserved outcomes, which is known as outcome reporting bias (kirkham2012multivariate). By extending the Copas selection model into multivariate selection models, we can develop tests for detecting publication bias and outcome reporting bias in multivariate meta-analysis. In this case, building a flexible but parsimonious model for good model robustness and statistical power can be the key challenge in the modeling and construction of a testing procedure. This extension is currently under investigation and will be reported in the future.
References
- Barbui et al. (2011) Barbui, C., A. Cipriani, V. Patel, J. L. Ayuso-Mateos, and M. van Ommeren (2011). Efficacy of antidepressants and benzodiazepines in minor depression: systematic review and meta-analysis. The British Journal of Psychiatry 198(1), 11–16.
- Begg and Mazumdar (1994) Begg, C. B. and M. Mazumdar (1994). Operating characteristics of a rank correlation test for publication bias. Biometrics, 1088–1101.
- Carpenter et al. (2009) Carpenter, J., G. Rücker, and G. Schwarzer (2009). copas: An r package for fitting the copas selection model. The R Journal 2, 31–6.
- Carpenter et al. (2009) Carpenter, J. R., G. Schwarzer, G. Rücker, and R. Künstler (2009). Empirical evaluation showed that the copas selection model provided a useful summary in 80% of meta-analyses. Journal of clinical epidemiology 62(6), 624–631.
- Cipriani et al. (2018) Cipriani, A., T. A. Furukawa, G. Salanti, A. Chaimani, L. Z. Atkinson, Y. Ogawa, S. Leucht, H. G. Ruhe, E. H. Turner, J. P. Higgins, et al. (2018). Comparative efficacy and acceptability of 21 antidepressant drugs for the acute treatment of adults with major depressive disorder: a systematic review and network meta-analysis. Focus 16(4), 420–429.
- Cohn and Becker (2003) Cohn, L. D. and B. J. Becker (2003). How meta-analysis increases statistical power. Psychological methods 8(3), 243.
- Copas (1999) Copas, J. (1999). What works?: selectivity models and meta-analysis. Journal of the Royal Statistical Society: Series A (Statistics in Society) 162(1), 95–109.
- Copas and Jackson (2004) Copas, J. and D. Jackson (2004). A bound for publication bias based on the fraction of unpublished studies. Biometrics 60(1), 146–153.
- Copas and Shi (2001) Copas, J. and J. Shi (2001). A sensitivity analysis for publication bias in systematic reviews. Statistical Methods in Medical Research 10(4), 251–265.
- Copas and Shi (2000) Copas, J. and J. Q. Shi (2000). Meta-analysis, funnel plots and sensitivity analysis. Biostatistics 1(3), 247–262.
- Copas and Li (1997) Copas, J. B. and H. Li (1997). Inference for non-random samples. Journal of the Royal Statistical Society: Series B (Statistical Methodology) 59(1), 55–95.
- Davies (1977) Davies, R. B. (1977). Hypothesis testing when a nuisance parameter is present only under the alternative. Biometrika 64(2), 247–254.
- Davies (1987) Davies, R. B. (1987). Hypothesis testing when a nuisance parameter is present only under the alternative. Biometrika 74(1), 33–43.
- Dickersin (2005) Dickersin, K. (2005). Publication bias: Recognizing the problem, understanding its origins and scope, and preventing harm. Publication Bias in Meta-Analysis, 9–33.
- Duval and Tweedie (2000) Duval, S. and R. Tweedie (2000). A nonparametric trim and fill method of accounting for publication bias in meta-analysis. Journal of the American Statistical Association 95(449), 89–98.
- Egger et al. (1997) Egger, M., G. D. Smith, M. Schneider, and C. Minder (1997). Bias in meta-analysis detected by a simple, graphical test. BMJ 315(7109), 629–634.
- Gleser and Olkin (1996) Gleser, L. J. and I. Olkin (1996). Models for estimating the number of unpublished studies. Statistics in medicine 15(23), 2493–2507.
- Hedges (1984) Hedges, L. V. (1984). Estimation of effect size under nonrandom sampling: The effects of censoring studies yielding statistically insignificant mean differences. Journal of Educational and Behavioral Statistics 9(1), 61–85.
- Hedges (1992) Hedges, L. V. (1992). Modeling publication selection effects in meta-analysis. Statistical Science, 246–255.
- Hong et al. (2017) Hong, C., Y. Chen, Y. Ning, S. Wang, H. Wu, and R. Carroll (2017). Plemt: A novel pseudolikelihood based EM test for homogeneity in generalized exponential tilt mixture models. Journal of the American Statistical Association.
- Hopewell et al. (2009) Hopewell, S., K. Loudon, M. J. Clarke, A. D. Oxman, and K. Dickersin (2009). Publication bias in clinical trials due to statistical significance or direction of trial results. The Cochrane Library.
- Iyengar and Greenhouse (2009) Iyengar, S. and J. B. Greenhouse (2009). Sensitivity analysis and diagnostics. The handbook of research synthesis and meta-analysis, 417.
- Jackson et al. (2011) Jackson, D., R. Riley, and I. White (2011). Multivariate meta-analysis: Potential and promise. Statistics in Medicine 30(20), 2481–2498.
- Johnson et al. (2017) Johnson, V. E., R. D. Payne, T. Wang, A. Asher, and S. Mandal (2017). On the reproducibility of psychological science. Journal of the American Statistical Association 112(517), 1–10.
- Kirkham et al. (2012) Kirkham, J., R. Riley, and P. Williamson (2012). A multivariate meta-analysis approach for reducing the impact of outcome reporting bias in systematic reviews. Statistics in Medicine 31(20), 2179–2195.
- Macaskill et al. (2001) Macaskill, P., S. D. Walter, and L. Irwig (2001). A comparison of methods to detect publication bias in meta-analysis. Statistics in medicine 20(4), 641–654.
- Moreno et al. (2009) Moreno, S., A. Sutton, A. Ades, T. D. Stanley, J. Peters, and N. J. Cooper (2009). Glutathione s-transferase (gst) m1, t1, p1, n-acetyltransferase (nat) 1 and 2 genetic polymorphisms and susceptibility to colorectal cancer. BMC medical research methodology 9(1), 1.
- Ning et al. (2017) Ning, J., Y. Chen, and J. Piao (2017). Maximum likelihood estimation and em algorithm of copas-like selection model for publication bias correction. Biostatistics 18(3), 495–504.
- Ning and Chen (2014) Ning, Y. and Y. Chen (2014). A class of pseudolikelihood ratio tests for homogeneity in exponential tilt mixture models. Scandinavian Journal of Statistics.
- Qin and Liang (2011) Qin, J. and K.-Y. Liang (2011). Hypothesis testing in a mixture case–control model. Biometrics 67(1), 182–193.
- Rathouz and Liang (1999) Rathouz, P. and K.-Y. Liang (1999). Reducing sensitivity to nuisance parameters in semiparametric models: a quasi-score method. Biometrika 86(4), 857–869.
- Rotnitzky et al. (2000) Rotnitzky, A., D. R. Cox, M. Bottai, and J. Robins (2000). Likelihood-based inference with singular information matrix. Bernoulli 6(2), 243–284.
- Rücker et al. (2010) Rücker, G., G. Schwarzer, J. R. Carpenter, H. Binder, and M. Schumacher (2010). Treatment-effect estimates adjusted for small-study effects via a limit meta-analysis. Biostatistics 12(1), 122–142.
- Short et al. (2015) Short, V., G. Herbert, R. Perry, C. Atkinson, A. R. Ness, C. Penfold, S. Thomas, H. K. Andersen, and S. J. Lewis (2015). Chewing gum for postoperative recovery of gastrointestinal function. Cochrane Database of Systematic Reviews (2).
- Sterne et al. (2001) Sterne, J. A., M. Egger, and G. D. Smith (2001). Systematic reviews in health care: Investigating and dealing with publication and other biases in meta-analysis. BMJ 323(7304), 101.
- Sterne et al. (2000) Sterne, J. A., D. Gavaghan, and M. Egger (2000). Publication and related bias in meta-analysis: power of statistical tests and prevalence in the literature. Journal of Clinical Epidemiology 53(11), 1119–1129.
- Sterne et al. (2011) Sterne, J. A., A. J. Sutton, J. P. Ioannidis, N. Terrin, D. R. Jones, J. Lau, J. Carpenter, G. Rücker, R. M. Harbord, C. H. Schmid, et al. (2011). Recommendations for examining and interpreting funnel plot asymmetry in meta-analyses of randomised controlled trials. BMJ 343, d4002.
- Turner et al. (2008) Turner, E. H., A. M. Matthews, E. Linardatos, R. A. Tell, and R. Rosenthal (2008). Selective publication of antidepressant trials and its influence on apparent efficacy. New England Journal of Medicine 358(3), 252–260.
- Yin and Shi (2019) Yin, P. and J. Q. Shi (2019). Simulation-based sensitivity analysis for non-ignorably missing data. Statistical methods in medical research 28(1), 289–308.