Terrain Analysis in StarCraft 1 and 2 as Combinatorial Optimization
Abstract
Terrain analysis in Real-Time Strategy games is a necessary step to allow spacial reasoning. The goal of terrain analysis is to gather and process data about the map topology and properties to have a qualitative spatial representation. On StarCraft games, all previous works on terrain analysis propose a crisp analysis based on connected component detection, Voronoi diagram computation and pruning, and region merging. Those methods have been implemented as game-specific libraries, and they can only offer the same kind of analysis for all maps and all users. In this paper, we propose a way to consider terrain analysis as a combinatorial optimization problem. Our method allows different kinds of analysis by changing constraints or the objective function in the problem model. We also present a library, Taunt, implementing our method and able to handle both StarCraft 1 and StarCraft 2 maps. This makes our library a universal tool for StarCraft bots with different spatial representation needs. We believe our library unlocks the possibility to have real adaptive AIs playing StarCraft, and can be the starting point of a new wave of bots.
Index Terms:
Terrain Analysis, Real-Time Strategy Game, StarCraft, Combinatorial Optimization, Constraint ProgrammingI Introduction
From the top-left corner of the map, 2 minutes 38 seconds after the beginning of the game, the blue player sends two stalkers, a basic fast-moving unit of the Protoss faction, towards the red player’s base. Red has the same number of stalkers to defend himself, but Blue’s micromanagement is so efficient that the battle is completely at Blue’s advantage.
Red is defending well, and he managed to produce immortals, a strong unit known to be a hard counter against an army composed of stalkers. However, Blue is continuously, tirelessly sending waves of stalkers against Red’s army, and combined with an excellent unit control, has overwhelmed the opponent that has no other choice than to resign.
Despite the headlong, stubborn strategy of Blue, who did not scout the opponent and was then rolling this strategy out blindly, and despite the good strategical decisions from Red, Blue’s domination was indisputable. This was the third game between the professional player MaNa, in red, versus Alphastar, in blue, on December 19, 2018. In fact, this describes most of the games played by Alphastar that day and some months later on the StarCraft 2 ladder: Alphastar starts and finishes a game with the same strategy rolled out at the perfection, without any significant adaptations regarding its opponent’s strategy.
But Alphastar is not an exception in StarCraft AI: the large majority of StarCraft 1 and StarCraft 2 bots have scripted or unadaptive behaviors[1]. Despite being potentially very effective, those bots are somehow getting around the difficulty, and thus the interest, of RTS games used as AI benchmarks, by exploiting those benchmarks’ flaws and imperfections.
Several directions are possible for making StarCraft bots with some real capacities of adaptability. One way is to design a non-scripted bot, able to play the three races on StarCraft 1 and StarCraft 2 with the same high-level decision-making mechanisms.
However, to enable homogeneous spatial reasoning over both StarCraft 1 and StarCraft 2, bots need a terrain analysis tool working the same way on these two games. Ideally, such a tool should be flexible enough to fit different needs in terms of terrain analysis, to be exploited at the best by different bots applying different methods.
This is the starting point of this work. In this paper, we propose a flexible method to tackle terrain analysis in both StarCraft games as a combinatorial optimization problem, that can be expressed by different models supporting different analyses. After presenting our method and our combinatorial optimization problem models, we show experimental results of the C++ library we developed, tested upon diverse StarCraft 1 and StarCraft 2 maps.
II Background
II-A RTS games and StarCraft
A Real-Time Strategy game, or RTS game, is a genre of video game where players must gather resources to develop an army, and must destroy the army or the buildings of other players to win. Unlike classic strategic board games such as Chess, players are not making moves alternatively, by simultaneously in real-time. The most popular way to play this kind of games involves two players in a 1 vs 1 game.
This study tackles terrain analysis on the two widely popular RTS games of the StarCraft series: the first one “StarCraft” together with its extension “StarCraft: Brood War”, denoted in this paper as StarCraft 1, and the second one “StarCraft II” under its last version named “Legacy of the Void”, denoted here as StarCraft 2. To explain something concerning both games, we will simply write StarCraft. Both games have a similar gameplay with some different features, such as unit characteristics and some map properties.
In StarCraft, players must gather two types of resources (minerals and gas) in order to construct buildings. Those buildings are required to produce units, to improve some unit characteristics or even to add new ones. All of these have a given cost to be paid in resources.
Games are played on a rectangular map, discretized into tiles called buildable tiles, upon which buildings can be constructed, and smaller tiles called walkable tiles, which are discrete in StarCraft 1 but continuous values in StarCraft 2 (so not tiles per se), on which units can walk. Indeed, some pixels on a map can be walkable without being buildable. This mostly happens at the edge of some natural borders such as cliffs or water.
Like most RTS games, the map is covered by a “fog of war” preventing players seeing enemy units that are not next to their own units. However, since each game on a given map will always start with the same initial properties (except the starting position of players), it is considered that the map topology and properties, such as the position and quantity of each resource, are known.
II-B Terrain Analysis
A bot playing StarCraft must know the terrain topology and the map properties to be able to do some spacial reasoning. Spacial reasoning is necessary to make good decisions such as where to expend for colonizing an unclaimed part of the map, where to attack the opponent in priority, and where defense must be reinforced.
Terrain analysis is gathering and processing data about the map topology and properties to have a qualitative spatial representation, required to make spatial reasoning. In StarCraft, map topology is characterized among other things by the terrain height (low, high and very high, to take StarCraft 1 terminology, and a rare fourth level in StarCraft 2) and the nature of each tile paving the map (walkable and/or buildable). Map properties include the height and width of the map, the position and the quantity of resources, the possible starting position of players, the presence, position and hit points of destructible obstacles, etc.
One of the main jobs done by a terrain analysis is splitting the map into regions, and spotting choke points that are easy to defend and make evident region delimiters.
III Related work
There are only a few relevant papers dealing with terrain analysis in RTS games, and more specifically about StarCraft. We can cite Perkins’ article in 2010 to be the first significant work about terrain analysis for StarCraft 1 [2], describing the Brood War Terrain Analysis library, or BWTA. In 2016, Uriarte and Ontañón have improved Perkings’ work and propose BWTA2 [3].
Some other terrain analysis tools have been developed for StarCraft 1, such as BWEM111github.com/N00byEdge/BWEM-community, and its clone Overseer222gitlab.com/OverStarcraft/Overseer for StarCraft 2. However, none of them have led to a publication, to the best of our knowledge, and they do not propose the computation of polygons surrounding regions, a useful feature available in both BWTA and BWTA2 to get the list of points composing borders of each region.
Since our work propose the same features as BWTA and BWTA2, and share with the latter the same first steps, we briefly describe these tools in the following.
Uriarte and Ontañón’s library BWTA2 [3] follows BWTA’s main steps, with some differences in the algorithm and the implementation. Algorithmic differences are written in Alg. 2.
For detecting connected components of obstacles (Step 2), BWTA2 uses a contour tracing algorithm proposed by Chang et al [4] instead of a flood-fill algorithm. This brings two advantages: 1. It allows detecting at the same time the inner and outer contours of each component. 2. Each inner tile is labeled, allowing us to know in constant time to which component a tile belongs to.
Step 4 did not exist in BWTA. Obstacle contours are simplified using the boost::geometry library and its algorithm simplify, which is an implementation of the Ramer-Douglas-Peucker algorithm [5].
The major differences between BWTA and BWTA2 implementations are:
-
•
Voronoi diagram are computed using the boost library in BWTA2, when BWTA is using the CGAL library. Compare to the latter, the boost implementation build Voronoi diagrams containing more information, like the coordinates of the centers of the inscribed circles tangent to three points of the obstacle contour, which gives us a centroid of each region for free.
-
•
Pruning the Voronoi diagram takes advantages of the R-Tree data structure [6] in BWTA2, on which the boost::geometry library lies on. Indeed, R-Tree are data structures used for spatial searching. Combine with packing algorithms [7, 8] implemented in boost::geometry to make bulk loading, it allows answering very quickly to many different queries about the overlapping, crossing, etc, of geometrical elements.
-
•
Building region polygons also takes advantage of R-Trees in BWTA2, since it boils down to a query computing the difference between an obstacle contour with the polygon of each choke point.
IV Terrain Analysis as Combinatorial Optimization
In this paper, we present a new terrain analysis working with both StarCraft 1 and StarCraft 2, named Taunt 333The source code, experimental setup and results can be found at github.com/richoux/Taunt/releases/tag/0.1.
IV-A Features
Taunt offers the same features BWTA and BWTA2 provide: split the map into regions, mark choke points and base placements, compute contour polygons of regions and choke points, etc.
The new features compare to BWTA/BWTA2 are listed below. To the best of our knowledge, the two first ones have not been implemented by any other terrain analysis tools for StarCraft.
-
•
Proposing a unique terrain analysis library working with StarCraft 1 and StarCraft 2 maps, with the same library interface.
-
•
Offering different options of terrain analysis, to better fit different needs.
-
•
Allowing dynamic terrain analysis, such as recomputing regions after some dynamic event like the suppression of destructible obstacles (also implemented in by the StarCraft 1 terrain analysis library BWEM).
Taunt stands for “Terrain Analysis: UNiversal Tool”. Our goal is to propose a terrain analysis library which is universal because it can be used for both StarCraft games, but also universal because it is able to analyze the same map differently, aiming to provide an adapted analysis to various StarCraft bots.
IV-B Process
Taunt roughly follows the same steps as BWTA2 until its fifth step, with a significant difference at Step 2. It also uses the boost::geometry library, then exploiting the R-Tree data structure for diverse queries. Its process is given in Alg. 3.
One problem with all existing terrain analysis libraries for StarCraft 1 or StarCraft 2 is that they tend to cut the map into numerous regions. Some of these regions do not contain any relevant strategic properties and would be probably not considered as an independent region by human players. This is due to the fact that all existing libraries are building regions by considering each slight narrowing of the ground, even large ones, as a choke point.
We wanted to counter-balance this with Taunt, and to propose a different way (actually, different ways) to cut the map. To be sure all regions have some strategical interest, we ensure that all of them must contain exactly one resource cluster, i.e., a pack of mineral patches, with or without gas geyser around, with some exceptions like islands, areas surrounded by walkable but unbuildable lands, and areas surrounded by areas of different heights but without any resource clusters (which is very rare in practice).

At Step 1, Taunt gathers information about the map via the right API, i.e., BWAPI444github.com/bwapi/bwapi for StarCraft 1 maps and CPP-SC2555github.com/cpp-sc2/cpp-sc2 for StarCraft 2 maps. Step 2 uses the same contour tracing algorithm from Chang et al [4], but to compute connected components of walkable lands rather than obstacles like in BWTA2. Although this algorithm is from 2004, a recent survey from He et al [10] indicates that it is still state-of-the-art for computing connected components together with contours.
After Step 3 and 4, we obtain labeled connected components and their contour. The result gives what we can observe in Fig. 2, where green parts are connected components (only one in this map) together with their contour in black.

Step 5 consists in splitting each component of walkable land into separated areas regarding their height and if they are unbuildable or not. In StarCraft 2, unbuildable parts are usually slopes, bridges and woods, and are therefore natural choke points. In StarCraft 1, in addition to slopes and bridges, we can also have large chunks of unbuildable areas, usually located in the central part of the map (see for instance Fig 7(g)). Step 6 computes the contour polygons of these unbuildable areas.
The result of Steps 5 and 6 can be seen in Fig. 3. Blue parts are unbuildable areas. Low, high and very high areas are respectively in yellow, khaki and green.

Since we aim to have exactly one resource cluster per region (with some exceptions listed at the beginning of this section), we need to locate and count clusters on each walkable area. This is done with Step 7, and areas with more than one resource cluster will be handled by Step 8. Only buildable areas are concerned by these steps: since, by definition, players cannot build bases upon unbuildable tiles, there are never resource clusters on unbuildable areas.
In Fig. 4, we can see resource clusters in blue or red boxes. Red dots are the centroid of a cluster, and orange lines connect this centroid to all tiles upon which there is a resource of the cluster.

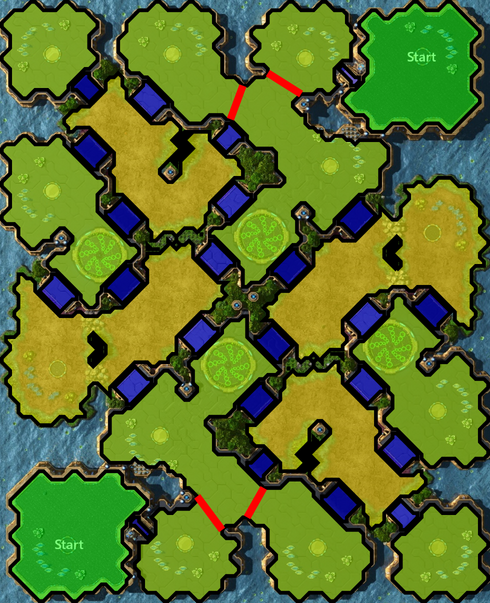
If there is only one cluster in an area, it is framed by a blue box on the figure. Otherwise, if they are two or more clusters, they are framed by a red box. In that case, if resource clusters exist on the same area, we need to find separations to make regions containing exactly one cluster each. To do this, we solve a combinatorial optimization problem (Step 8) to find separations satisfying some mandatory constraints and optimizing a giving objective function. We show separations found by solving two combinatorial optimization problems while trying to minimize the total length of separations (Fig. 5), corresponding to choke points, and while trying to minimize the least squares difference of region surfaces (Fig. 6). Separations are represented by red lines.


Once regions have been computed, it is trivial to merge two separated regions by an obstacle if the latter is destroyed, and to run Step 8 on this merged region if making a new separation is required. The way Taunt decides separations area by area, allows us to reanalyze a map locally, without the need to reconsider it as a whole.
IV-C Intuition behind our combinatorial optimization models
We modeled the problem of placing separations in an area containing resource clusters to make regions with exactly one resource cluster each, with , in a Constraint Programming formalism called Error Function Optimization Problem, or EFOP [11].
An EFOP model is actually an Error Function Satisfaction Problem model, or EFSP, together with an objective function we aim to maximize or minimize. An EFSP model is defined by a set of variables, a set of domains, i.e., the possible values each variable can take, and a set of constraints determining which combinations of variable values are possible or forbidden. Our EFSP model is defined as follows:
-
Variables: All possible separations, i.e., all possible pairs of points on the contour polygon of an area,
Domains: Each variable has the domain , indicating if its corresponding separation is selected or not,
Constraints:-
1.
NoCrossings: No separations crossing each other,
-
2.
MaxOneClusterPerRegion: Separations must split the terrain into regions such that each region exactly contains one resource cluster.
-
1.
In EFSP and EFOP models, constraints are represented as error functions. For the two constraints in our model, their error function is expressed as follows:
-
•
NoCrossings: Number of separations crossing each other.
-
•
MaxOneClusterPerRegion: The highest number of resource clusters on the same region minus 1, added to the number of regions without any clusters.
Having models as small as possible, i.e., with few variables, small domains and few constraints, is important to solve them faster. We have the following tricks to reduce the model size:
-
•
Ill-formed separations, i.e., crossing resources or unwalkable/unbuildable tiles, are filtered out from the set of variables before running the constraint solver.
-
•
Since we know how many separations we must have to get regions, we randomly select initial separations and ask the solver to handle the problem as a permutation problem. This allows us not to consider a constraint checking the correct number of selected separations.
In order to allow better separations, we enrich the set of variables by adding some points in the contour polygon to break long lines (typically, when the contour contains an edge of the map). Although this increases the model size by adding variables, it may allow nicer separations improving the objective function.
After these variable reduction tricks and this enrichment, we obtain models from some hundreds to 2,000 variables, regarding the map and their areas. The mean numbers of variables among areas within the same maps are given in Table I.
We use this EFSP model for the experiments in this paper. When Taunt will be released, we plan to propose other models with other constraints to offer more diverse analysis possibilities to StarCraft bot authors. For instance, we could add a constraint to force regions to have a minimal surface, or to get perfectly symmetric separations on symmetrical maps.
We get an EFOP model upon this EFSP model by adding an objective function. We have tested two different ones:
-
Objective functions:
-
1.
MinSeparationLength: Minimize the sum of separation length.
-
2.
LeastSquaresAreas: Least squares area difference, i.e., minimize the difference of region areas.
-
1.
IV-D Our formal combinatorial optimization models
The EFOP model above is informal and is here to give the intuition. We show below the formal EFOP model:
-
Variables: , with a possible separation
Domains:
Constraints:
with , and the error functions representing constraints NoCrossing and MaxOneClusterPerRegion, respectively, the predicate returning true iff and are crossing each other, and the number of resource clusters in the -th region.
Thus, our objectives functions are:
-
Objective functions:
with the length of the -th separation , the surface of the -th region and the mean surface of considered regions.
These models have been implemented using the framework GHOST [9], which contains a local search solver to find a solution of the problem within a given timeout. For our experiments presented in Section V, we set a timeout of ms to find separations in each area containing resource clusters, with . Taunt contains a mechanism that double timeouts and relaunch this solving step if no solutions have been found in its previous run.
V Experimental results
We tested our library over the 10 StarCraft 1 maps from the annual AIIDE StarCraft AI competition666www.cs.mun.ca/ dchurchill/starcraftaicomp and the 7 StarCraft 2 maps from the pre-season 11 of the SC2AI Arena competition777aiarena.net. Map names as well as the mean number of variables of their EFOP models are listed in Table I, and visual results considering the MinSeparationLength objective function are given in Fig. 7, except Oxide LE since it is our running example in Section IV-B.
Tables II and III give Taunt runtimes considering the EFOP model with the MinSeparationLength objective function, but the LeastSquaresAreas objective function leads to equivalent runtimes. Unless the chosen objective function is computation-heavy, Taunt runtimes generally depend on the satisfaction part of the combinatorial problem model.
| StarCraft 1 maps | StarCraft 2 maps | ||
| Name | Mean #vars | Name | Mean #vars |
| Benzene | 308 | Deathaura LE | 732 |
| Destination | 0 | Jagannatha LE | 1434 |
| Heartbreak Ridge | 673 | Lightshade LE | 1103 |
| Aztec | 292 | Oxide LE | 1285 |
| Tau Cross | 2052 | Pillar Of Gold LE | 1001 |
| Andromeda | 164 | Romanticide LE | 1188 |
| Circuit Breakers | 339 | Submarine LE | 454 |
| Empire of the Sun | 508 | ||
| Fortress | 495 | (LE: Ladder Edition) | |
| Python | 1063 | ||


V-A Comparaison BWTA2
Tests have been conducted using a bot under development able to play both at StarCraft 1 and StarCraft 2, on a machine equipped with a Core i9 9900 CPU and 32 GB of RAM, running on Windows 10. Taunt is written in C++ and has been compiled with the Visual Studio 2022 compiler with the /02 optimization option.
The terrain analysis results, namely the region-making and the computation of their contour polygon, are good on all tested maps: Taunt shows its ability to split a map into regions with the desired properties. In order to have a point of comparison with existing libraries and an objective metric for the evaluation of Taunt’s performance, we compare runtimes of BWTA2 and Taunt on StarCraft 1 maps. We choose BWTA2 rather than a more modern library like BWEM, since the latter does not propose features like the computation of contours. BWTA2 is actually the more modern terrain analysis library for StarCraft 1 offering equivalent features as Taunt.
| StarCraft 1 Map | BWTA2 | Taunt |
|---|---|---|
| Benzene | 906 | 344 |
| Heartbreak Ridge | 794 | 821 |
| Aztec | 1112 | 751 |
| Tau Cross | 1046 | 1839 |
| Andromeda | 1114 | 626 |
| Circuit Breakers | 1187 | 654 |
| Empire of the Sun | 1132 | 842 |
| Fortress | 1074 | 491 |
| Python | 1089 | 1203 |
| Median runtime | 1089 | 751 |
| Mean runtime | 1050.44 | 841.22 |
| Pop. standard deviation | 116.34 | 419.82 |
Runtime comparisons are shown in Table II. BWTA2 and Taunt have been run on the same machine through the same bot, under the same conditions. The full run of BWTA2 and Taunt algorithms is measured in milliseconds, including fetching data from APIs and preparing data structures. The reader can observe that the map Destination is not on this table. We have taken out this map from comparisons because it would be completely at the advantage of Taunt, being an unfair comparison with BWTA2. Indeed, Destination is a map such that all walkable areas contain one resource cluster only, so there is nothing to compute for Taunt at Step 8 in Alg. 3, which is the more complex and computation heavy step. This is why we have 0 variables in Table I, and why there are no red separation lines in Fig 7(b). As a result, Destination is processed in 15ms by Taunt, against 843ms by BWTA2.
Results from Table II allow us to conclude that Taunt runs faster over most maps than BWTA2, and has a significant lower median and mean runtime. The standard deviation is almost 4 times higher, though: this is due to the runtime of Step 8 in Alg. 3 that depends on the number of areas to handle and the number of separations to found.
| StarCraft 2 maps | Taunt |
|---|---|
| Deathaura LE | 1283 |
| Jagannatha LE | 431 |
| Lightshade LE | 755 |
| Oxide LE | 377 |
| Pillar Of Gold LE | 824 |
| Romanticide LE | 3475 |
| Submarine LE | 242 |
| Median runtime | 755 |
| Mean runtime | 1055.28 |
| Pop. standard deviation | 1039.35 |
Since there are no terrain analysis library for StarCraft 2 with equivalent features as Taunt, we could not make any runtime comparison on StarCraft 2 maps. Thus, Table III shows runtimes for Taunt only. Like for Table II, runtimes take into account the full run of Taunt’s algorithm, including building inputs and initializing data structures. Looking at medians in Tables II and III, we can conclude that runtimes over StarCraft 1 and StarCraft 2 maps are equivalent. The StarCraft 2 map Romanticide is an exception: it contains 2 areas with 2 separations required for each, and 1 area requiring 5 separations, which is significantly more than the average map. This is the only map where Taunt needed to use its inner mechanism that doubles the timeout and relaunch the solver, since no satisfying separations have been found during the first run of the solver. This explains the difference of runtimes between Romanticide and other StarCraft 2 maps.
VI Conclusion and perspectives
In this paper, we propose a library, Taunt, handling terrain analysis in StarCraft games as a combinatorial optimization problem. This is the first terrain analysis work for StarCraft to tackle the problem as a combinatorial optimization problem, and the first to use Constraint Programming to model and solve it. We give the problem model in the Error Function Optimization Problem formalism, and we test our library on 10 StarCraft 1 maps and 7 StarCraft 2 maps from StarCraft AI competitions.
The main features of our library are: 1. The possibility for StarCraft 1 and StarCraft 2 bots to use it with the same interface, 2. The split of maps into regions in a human-like fashion, avoiding creating too many regions without significant strategical values, 3. The computing of region contours, 4. The ability to dynamically reanalyze the terrain (for instance after the destruction of an obstacle), 5. The possibility to make different kind of terrain analysis of the same map. At the moment this article is written, no other terrain analysis libraries for StarCraft games propose all these features.
Concerning this last feature, we show in this paper two ways to split a map into regions, according to the model objective function. A future work to enhance the library can consist in implementing more diverse combinatorial optimization problem models to fit different needs in terms of terrain analysis. For instance, we could have models with a constraint to give a maximal or minimal bound of region surfaces, to force symmetrical regions (if the map is itself symmetrical), or to allow large, central buildable regions without any resource clusters.
We strongly believe that having a universal tool to get qualitative spatial representations, able to handle both StarCraft games homogeneously and offering the possibility of making different analyses of the same map, is a necessary step toward bots with true adaptability, able to make non-scripted decisions according to the environment and the current situation in a game. We hope to see a new wave of bots emerges thanks to Taunt.
References
- [1] M. Certicky, D. Churchill, K.-J. Kim, M. Certicky, and R. Kelly, “Starcraft ai competitions, bots, and tournament manager software,” IEEE Transactions on Games, vol. 11, no. 3, pp. 227–237, 2019.
- [2] L. Perkins, “Terrain analysis in real-time strategy games: An integrated approach to choke point detection and region decomposition,” in Proceedings of the Sixth AAAI Conference on Artificial Intelligence and Interactive Digital Entertainment (AIIDE). AAAI Press, 2010, pp. 168–173.
- [3] A. Uriarte and S. Ontañón, “Improving terrain analysis and applications to rts game ai,” in Proceedings of the Twelveth AAAI Conference on Artificial Intelligence and Interactive Digital Entertainment (AIIDE). AAAI Press, 2016, pp. 15–20.
- [4] F. Chang, C.-J. Chen, and C.-J. Lu, “A linear-time component-labeling algorithm using contour tracing technique,” Computer Vision and Image Understanding, vol. 93, no. 2, pp. 206–220, 2004.
- [5] D. H. Douglas and T. K. Peucker, “Algorithms for the reduction of the number of points required to represent a digitized line or its caricature,” Cartographica: The International Journal for Geographic Information and Geovisualization, vol. 10, pp. 112–122, 1973.
- [6] A. Guttman, “R-trees: A dynamic index structure for spatial searching,” in Proceedings of the 1984 ACM SIGMOD International Conference on Management of Data. Association for Computing Machinery, 1984, pp. 47–57.
- [7] S. Leutenegger, M. López, and J. Edgington, “Str: a simple and efficient algorithm for r-tree packing,” in Proceedings 13th International Conference on Data Engineering, 1997, pp. 497–506.
- [8] Y. J. García R, M. A. López, and S. T. Leutenegger, “A greedy algorithm for bulk loading r-trees,” in Proceedings of the 6th ACM International Symposium on Advances in Geographic Information Systems. Association for Computing Machinery, 1998, pp. 163–164.
- [9] F. Richoux, A. Uriarte, and J.-F. Baffier, “Ghost: A combinatorial optimization framework for real-time problems,” IEEE Transactions on Computational Intelligence and AI in Games, vol. 8, no. 4, pp. 377–388, 2016.
- [10] L. He, X. Ren, Q. Gao, X. Zhao, B. Yao, and Y. Chao, “The connected-component labeling problem: A review of state-of-the-art algorithms,” Pattern Recognition, vol. 70, pp. 25–43, 2017.
- [11] F. Richoux and J.-F. Baffier, “Learning interpretable error functions for combinatorial optimization problem modeling,” in Data Science Meets Optimisation IJCAI workshop (DSO), 2021, pp. 1–7.