TACO: Trash Annotations in Context for Litter Detection
Abstract
TACO is an open image dataset for litter detection and segmentation, which is growing through crowdsourcing. Firstly, this paper describes this dataset and the tools developed to support it. Secondly, we report instance segmentation performance using Mask R-CNN on the current version of TACO. Despite its small size (1500 images and 4784 annotations), our results are promising on this challenging problem. However, to achieve satisfactory trash detection in the wild for deployment, TACO still needs much more manual annotations. These can be contributed using: http://tacodataset.org/
I Introduction
Litter111Any manufactured solid material that is incorrectly disposed either intentionally or accidentally. has been accumulating around us as most local governments and international organizations fail to tackle this crisis, which is having a catastrophic impact on biodiversity and marine animals [1, 2]. While littering is widely considered illegal, effective means to control it are currently lacking, both technological and regulatory.
Fortunately, there has been an increasing number of initiatives [3] to implement litter monitoring systems from remote sensing to in situ observations. We believe these systems need a high degree of autonomy enabled by deep learning. For that, we need annotated photos of litter in context, as in [4], to train an evaluate litter detectors – rather than clean images of trash with white background [5]. Despite the current availability of large general image datasets, trash is poorly represented.
Detecting trash in the wild can be a very challenging problem – more than trash in recycling facilities, e.g., conveyor belt, bins. Not only do we have to take into account that trash can be deformable, transparent, aged, fragmented, occluded and camouflaged, we also need models to be aware of the vast diverse features that make our natural world. With this in mind, this work introduces TACO, an effort to build a comprehensive dataset of photos taken from diverse environments around the word (e.g. beaches, cities) with litter segmented and annotated using a hierarchical taxonomy. The next section describes its main features, current stats and supplementary tools. Then, Section III presents our litter detection experiments and discusses results on two different tasks with this new dataset.
 |
 |
 |
 |
 |
 |
 |
 |
 |
II TACO dataset
TACO contains high resolution images, as shown in Fig. 2, taken mostly by mobile phones. These are managed and stored by Flickr, whereas our server manages the annotations and runs periodically a crawler to collect more potential images of litter. Additionally, we also selected some images from [6]. All images are under free copyright licences and are annotated and segmented by users using our online tool: http://tacodataset.org/annotate.
Specifically, images are labeled with the scene tags, shown in Fig. 4, to describe their background – these are not mutually exclusive – and litter instances are segmented and labeled using a hierarchical taxonomy with 60 categories of litter which belong to 28 super (top) categories, shown in Fig. 3, including a special category: Unlabeled litter for objects that are either ambiguous or not covered by the other categories. This is fundamentally different from other datasets (e.g. COCO) where distinction between classes is key. Here, all objects can be in fact classified as one class: litter222In this work we assume all annotated objects to be litter, even though there are a small number of objects that are handheld, not disposed yet or their location context is ambiguous. . Furthermore, it may be impossible to distinguish visually between two classes, e.g., plastic bottle and glass bottle. Given this ambiguity and the class imbalance shown in Fig. 3, classes can be rearranged to suit a particular task. For our experiments, in Section III, we targeted 9 super categories based on the number of instances and merged the rest under the class name Other Litter. We call this TACO-10 and Fig. 5 shows the size variability of annotations per category for this new taxonomy. We can see that most of the cigarettes, the third largest class, have an area less than pixels. We will see in our results how this can be problematic.


II-A Litter transplants
Transplantation can be an effective way of augmenting the dataset by adding more under-represented backgrounds if the mask segmentations are precise enough. This is especially relevant if we are going to operate on closed-set conditions (i.e. specific environment). Suppose we want to run litter detection on a river with crocodiles and make sure those crocodiles do not give rise to false positives, but this river does not have a lot of litter to take pictures add to our dataset, and we sure do not want to interfere with their habitat! What one could do is simply copy paste TACO segmentations onto images with crocodiles as shown in image 6, but this will create artifacts around the edges because the masks are not perfect. Thus, as illustrated in Fig. 6, we propose to pixelwise mix the transplanted object and the target image by using a truncated distance transform of the binary mask, that is a smooth mask that effectively smooths the silhouette.
 |
 |
 |
 |

This function is embedded in our proposed GUI, shown in Fig. 7, along with other features to make transplantation easy and seamless. It’s worth noting this does not work well with transparent objects (e.g. plastic films) and although this can make transplantation look natural, it neglects many lighting and camera aspects to make it realistic.
III Experiments
To assess the performance of litter detection and segmentation using TACO, we evaluated Mask R-CNN on two separate tasks (i.e. taxonomies): (i) TACO-1, classless litter detection where the goal is to only detect and segment litter items; and (ii) TACO-10, detection and classification to distinguish these 10 classes of litter.
Due to the small size of this dataset. All quantitative results are reported for a 4-fold cross validation. For each fold, the dataset is split randomly into 80% for training set, 10 % for validation set and 10 % for test set. As an evaluation metric, we rely on the established Average Precision (AP) [7] averaged over Intersection-over-Union (IoU) thresholds using the instance masks, and tested different scores to rank predictions as described in Section III-B. The next subsection describes our Mask R-CNN implementation and training details.
III-A Implementation
We adopted the Mask R-CNN implementation by [8]. Our adapted implementation and trained model weights used in this work are publicly available at: https://github.com/pedropro/TACO. We used simply the default Resnet-50 in a Feature Pyramid Network as a backbone with an input layer size of 10241024 px by resizing and padding images accordingly. Models were trained on TACO-10 with SGD for 100 Epochs with a batch size of 2 images and a learning rate of 0.001. Weights were started using Mask R-CNN weights trained on COCO dataset [9]. Longer training continues to reduce the training error but does not seem to reduce the validation error. For data augmentation, during training, we added Gaussian blur and AWG noise, changed image exposure and contrast, rotated images between and cropped images around the annotated bounding boxes, such that there is always a visible litter object. To further augment the training set, we also transplanted 320 instances from the training set to images crawled from Flickr using tags based on the the scene tags shown in Fig. 4.
III-B Prediction Scoring
As demonstrated in [10], AP depends significantly on the score used to rank the predictions, and the established maximum class confidence may not the best choice. Therefore, to suit our two tasks, we tested using 3 different scores from the output of the Mask R-CNN classification head. Let the class probabilities, given by this head, be where is the number of classes and is the probability of being background, then we compared using the following scores:
| (1) |
While class_score is the established score, ratio_score expresses both the confidence on a class and the confidence on being litter, where is just a small scalar to avoid NaN. That is, ratio_score allows us to say "This model is ratio_score times more confident that given object is class X than not being litter."
| Dataset | Class score | Litter score | Ratio score |
|---|---|---|---|
| TACO_1 | 15.9 1.0 | 26.2 1.0 | 26.1 1.0 |
| TACO_10 | 17.6 1.6 | 18.4 1.5 | 19.4 1.5 |
 |
 |
 |
 |

III-C Results
Table I reports the AP for our proposed two tasks using different scores to rank the predictions. As expected, the typically used class_score is not suitable to rank classless litter detections on TACO-1 compared to using the . More interestingly, class_score is not more reliable than litter_score on the TACO-10 problem, whereas using ratio_score actually improves the AP on TACO-10 and does not decrease the AP on TACO-1. By expressing this relation; How confident I am that this object is this class of litter and not background? we suit simultaneously both tasks. As we can see in Fig 8. this score correlates well with the Intersection-over-Union (IoU) of the predictions.
Fig. 9 shows the respective confusion matrices for TACO-10. We can conclude that our low performance in Table I is mostly due to poor cigarette detection which exhibits high false positives and negatives. We believe this is due to their small size, as shown in Fig. 5, since most images had to be resized to less than one third (10241024 px). In fact, we can clearly see, in Fig. 10, that a large number of ground truth objects with less than 2020 px that are missed.
On the other hand, we also see in Fig. 9 that the detection performance is better with Cans and Bottles although a significant number of bottles are detected as cans. It is also worth noting that there is some confusion between Plastic bag and Other, which is not surprising if we consider Other includes objects with similar materials.
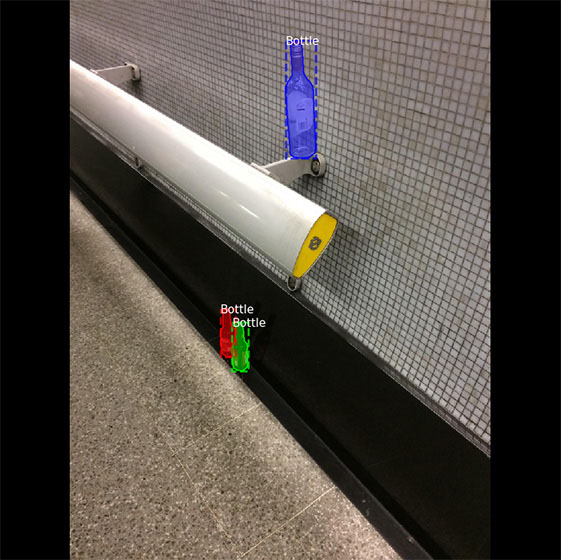
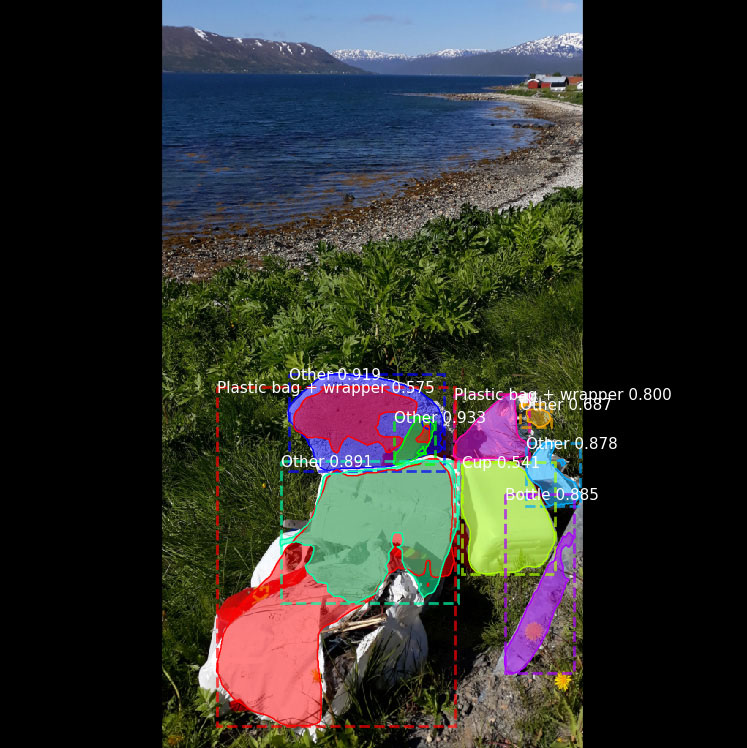
Several examples of detections on the test-sets are shown in Fig. 11 and Fig. 12. The first image of Fig. 12 shows that we are able to deal with transparent objects. However we see on the image below that seashells are picked as litter, namely other and lid. Overall, the performance is promising but the trained models are still prone to errors when faced with new or rare background, e.g., ocean waves, as shown by the third column and third row of Fig. 12.
IV Conclusions and Future Work
We showed how TACO dataset and tools can be used towards litter detection. We have received good feedback from many researchers, mostly undergrads and entrepreneurs who started working on this problem but struggled so far to find decent datasets that represent the problem. Although TACO is a good starting point, clearly, our dataset needs significantly more annotated images, thus we invite the reader to contribute annotations to TACO using our tools.
Moreover, detection results on tiny objects (e.g. cigarettes) using our network configuration is poor and affects significantly the overall AP, future work should devise better models and methods to fully exploit the high resolution of TACO images. One could simply augment the input resolution but this increases significantly the memory footprint. Alternatively, one could run Mask R-CNN on a sliding window fashion and then fuse predictions, however this would sacrifice context from the surrounding windows. Thus, a more efficient and lossless method is required.
| Predicted | Groundtruth | Predicted | Groundtruth |
|---|---|---|---|
 |
 |
 |
 |
| Predicted | Groundtruth | Predicted | Groundtruth |
|---|---|---|---|
 |
 |
 |
 |
 |
 |
 |
 |
 |
 |
 |
 |
 |
 |
 |
 |
 |
 |
 |
 |
References
- [1] J. G. Derraik, “The pollution of the marine environment by plastic debris: a review,” Marine pollution bulletin, vol. 44, no. 9, pp. 842–852, 2002.
- [2] S. C. Gall and R. C. Thompson, “The impact of debris on marine life,” Marine pollution bulletin, vol. 92, no. 1-2, pp. 170–179, 2015.
- [3] N. Maximenko, P. Corradi, K. L. Law, E. Van Sebille, S. P. Garaba, R. S. Lampitt, F. Galgani, V. Martinez-Vicente, L. Goddijn-Murphy, J. M. Veiga, et al., “Towards the integrated marine debris observing system,” Frontiers in marine science, vol. 6, p. 447, 2019.
- [4] S. Chiba, H. Saito, R. Fletcher, T. Yogi, M. Kayo, S. Miyagi, M. Ogido, and K. Fujikura, “Human footprint in the abyss: 30 year records of deep-sea plastic debris,” Marine Policy, vol. 96, pp. 204–212, 2018.
- [5] O. Awe, R. Mengistu, and V. Sreedhar, “Smart trash net: Waste localization and classification,” 2017.
- [6] “Openlittermap.” https://openlittermap.com/.
- [7] M. Everingham, L. Van Gool, C. K. Williams, J. Winn, and A. Zisserman, “The pascal visual object classes (voc) challenge,” International journal of computer vision, vol. 88, no. 2, pp. 303–338, 2010.
- [8] W. Abdulla, “Mask r-cnn for object detection and instance segmentation on keras and tensorflow.” https://github.com/matterport/Mask_RCNN, 2017.
- [9] T.-Y. Lin, M. Maire, S. Belongie, J. Hays, P. Perona, D. Ramanan, P. Dollár, and C. L. Zitnick, “Microsoft coco: Common objects in context,” in European conference on computer vision, pp. 740–755, Springer, 2014.
- [10] Z. Huang, L. Huang, Y. Gong, C. Huang, and X. Wang, “Mask scoring r-cnn,” in Proceedings of the IEEE Conference on Computer Vision and Pattern Recognition, pp. 6409–6418, 2019.