reception date \Acceptedacception date \Publishedpublication date
ISM: abundances 1 — ISM: clouds2 —SM: individual (Saggitarius B2)3 — ISM: molecules4 — radio lines: ISM5
Sulphur isotopes toward Sagittarius B2 extended envelope in the Galactic Center
Abstract
The isotopic ratios are good tools for probing the stellar nucleosynthesis and chemical evolution. We performed high-sensitivity mapping observations of the J=7-6 rotational transitions of OCS, OC34S, O13CS, and OC33S toward the Galactic Center giant molecular cloud, Sagittarius B2 (Sgr B2) with IRAM 30m telescope. Positions with optically thin and uncontaminated lines are chosen to determine the sulfur isotope ratios. A ratio of 17.10.9 was derived with OCS and OC34S lines, while ratio of 6.81.9 was derived directly from integrated intensity ratio of OC34S and OC33S. With independent and accurate measurements of ratio, our results confirm the termination of the decreasing trend of ratios toward the Galactic Center, suggesting a drop in the production of massive stars at the Galactic centre.
1 Introduction
The isotopic ratios are good tools for probing the stellar nucleosynthesis and chemical evolution of the Universe. The isotopic abundance ratios of C, N and O could help understand the stellar evolution and nucleosynthesis process (Wilson and Rood, 1994; Maiolino and Mannucci, 2019; Romano, 2022; Ou et al., 2023). As the main supplementary tool of C, N, and O isotopic abundance ratios, sulphur isotopes could provide information on the late evolutionary stages of massive stars and supernovae (SNe) of Type Ib/c and II, such as oxygen-burning, neon-burning, and s-process nucleosynthesis (Wilson and Rood, 1994; Chin et al., 1996; Humire et al., 2020). There are four stable isotopes of S, 32S, 34S, 33S and 36S. 32S and 34S are synthesized by oxygen-burning, while 33S is synthesized in explosive oxygen- and neon-burning, which is also related to massive stars (Chin et al., 1996; Yan et al., 2023).
Among sulphur-bearing molecules, the abundant CS and its isotopologues are widely used to measure sulfur isotope ratios as it is strong and widespread in space (Chin et al., 1996; Humire et al., 2020; Yu et al., 2020; Yan et al., 2023). A relation between 32S/34S and their galactocentric distance () of 32S/34S=()(/kpc) + () was found by using a linear least-squares fit to the unweighted data of CS and its isotopologues, while no correlation was obtained between 33S/34S ratios and (Chin et al., 1996; Yu et al., 2020). Recently, Yan et al. (2023) confirmed 32S/34S gradients as a function of galactocentric distance with rare isotopologues of CS.
Such ratios in the Galactic Center regions are specially important, since they can trace star formation history there. Inconsistent results were reported in the literature (Humire et al., 2020; Yu et al., 2020; Yan et al., 2023). Humire et al. (2020) measured the carbon and sulphur abundances toward the +50 km s-1 Cloud and several line-of-sight (here after l.o.s) clouds towards Sgr B2(N) with CS isotopologues. They obtained 32S/34S ratio of 16.3 for the +50 km s-1 Cloud and 17.95.0 for Sgr B2(N), which indicates a termination of the decreasing tendency at least at a galactocentric distance of 130 pc. However, Yu et al. (2020) reported a 32S/34S ratio of 7.1 4.1 with CS isotopologues toward Sgr B2(N), while Yan et al. (2023) obtained three independent values for three different velocity components of CS isotopologues toward Sgr B2(N), with 32S/34S ratios ranging from 10 to 26.
As a common sulfur-bearing molecule in dense clouds, carbonyl sulfide (OCS) and its isotopologues can be an independent probe to measure sulfur isotope ratios. Goldsmith and Linke (1981) once reported a 32S/34S ratio of 16 for Sgr B2(N) from the OCS/OC34S ratio, while Armijos-Abendaño et al. (2015) reported 32S/34S ratios of 22 and 8.71.3 in l.o.s clouds towards Sgr A and G+0.693 with OCS/OC34S ratio. Such results showed significant difference to each other and to that measured by CS and its isotopologues (Humire et al., 2020; Yu et al., 2020; Yan et al., 2023). On the other hand, no measurement of 33S/34S ratio with OCS lines was reported in the literature.
Sgr B2 is a giant molecular cloud located in the Galactic Center. It contains two main sites of star-formation, Sgr B2(N) and Sgr B2(M) (Belloche et al., 2013). There are abundant hot cores, HII regions as well as cold extended envelope in Sgr B2(N) and Sgr B2(M) (Bonfand et al., 2017). It is noted that previous measurements of sulphur isotope ratios all pointed toward Sgr B2(N) (Humire et al., 2020; Yu et al., 2020; Yan et al., 2023). However, the strong continuum emission and optical depth of molecular lines make it hard to accurately determine the isotopic ratios. As such, observations with accurate measurement are required to better obtain value of 32S/34S ratio in the Galactic Center region than that in the literature, which is important to constrain models of stellar interiors and models of the chemical evolution of the Galaxy (Kobayashi et al, 2011). In this paper, we present mapping observations J=7-6 transitions of OCS, OC34S, O13CS, and OC33S toward Sgr B2 extended envelope. We choose positions in which OCS 7-6 transitions were optically thin to obtain the isotropic ratios of sulphur atoms. The outline of this article is presented as followed. In Section 2, we describe the observations and data reduction. In Section 3, we give the mapping results of OCS, O13CS, OC33S, OC34S, and measured isotopic ratios from OCS species. Scientific discussions are presented in Section 4, while the conclusion of this paper is given in Section 5.
2 OBSERVATIONS AND DATA REDUCTION
We performed point-by-point spectroscopic mapping observations towards Sgr B2 in 2019 May with the IRAM 30m telescope on Pica Veleta, Spain (project 170-18, PI: Feng Gao). The observations was performed at 3-mm band. Position-switching mode was used. The broad-band Eight MIxer Receiver and the FFTSs in FTS200 mode were adopted for the observation. The covered frequency range is 82.3-90 GHz. The channel spacing is 0.195 MHz, corresponding to a velocity resolution of 0.641 km s-1 at 84 GHz. The velocity resolution was smoothed to 1.4 km s-1 to improve the signal-to-noise ratio for most spectra, while it was smoothed to 2.8 km s-1 for O13CS toward (60, -30). The telescope pointing was checked every 2 hours on 1757-240. The telescope focus was optimized on 1757-240 at the beginning of the observation. The integration times range from 24 minutes to 98 minutes for different positions, with typical system temperatures of 110K, leading to 1 rms in T of 4-8 mK derived with the line free channels.
The observing center is Sgr B2(N) (,), with a sampling interval of 30\arcsec. The off position was (, )=(-752\arcsec, 342\arcsec) away from Sgr B2(N) (Belloche et al., 2013). 63 positions was observed in total. The observed transitions are listed in Table 1, including J=7-6 transitions of OCS, O13CS, OC34S, and OC33S. The spectroscopic parameters of molecules are taken from CDMS catalog (Müller et al., 2005). The data processing was conducted using GILDAS software package111http://www.iram.fr/IRAMFR/GILDAS., including CLASS and GREG. The linear baseline subtractions were used for all the spectra. The line parameters are obtained by Gaussian fitting. The data are presented in the unit of antenna temperature (T).
3 RESULTS
3.1 Target Selection for deriving 32S/34S ratio
The rest frequencies for OCS and its isotopologues have been listed in Table 1. The FWHM of lines toward most positions are around 20 km s-1. According to 3 mm line survey results of Sgr B2 (Belloche et al., 2013), OCS and OC33S line are clean, with nearby transitions more than 20 km s-1 away. For O13CS lines, there is a CH3COCH3 20(10,10)-20(9,11)AE line (84737.075 MHz) 5.5 km s-1 away. However, the El of CH3COCH3 is 165 K. Thus it only affects lines toward hot cores, including Sgr B2(N) and Sgr B2(M). We also found that a NH2D 8(3, 6)0s- 8(2, 6)0a line at 83060.244 MHz, which is only 2.3 MHz (8.3 km s-1) away from OC34S, could contaminate OC34S lines.
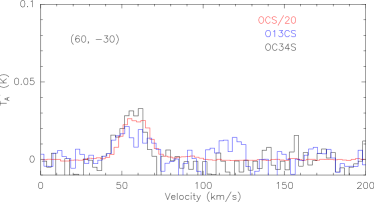
Figure 1 presents the integrated intensity map of OCS 7-6 around Sgr B2. The mapping result is similar to that in Jones et al (2008). We could see from Figure 1 that the OCS 7-6 emission peaks in Sgr B2(N). OCS is usually optically thick in massive star-forming regions (Li et al., 2015). The determination of sulfur isotope ratios with OCS and its isotopes may be affected by optical depth of OCS lines. By comparing with O13CS lines, it is found that OCS lines are optically thick toward some positions. As mentioned above, NH2D emission at 83060.244 MHz could affect the determination of integrated intensity of OC34S. Figure 2 shows positions in which OC34S 7-6 blend with NH2D in the blue-shifted side. The possible contaminant lines are in the blue-shifted side of OC34S 7-6, as is shown by the inconsistency between the OC34S and other two transitions in the blue-shifted side. For example, the spectra toward (60, 60) and (0, -180) pointings have secondary peaks at lower velocities from their respective primary peaks. As the NH2D transition has a higher frequency than OC34S 7-6, it should affect the blue-shifted side of the spectra. Such contamination is negligible in Figure 3. The judgement of the presence/absence of the contamination is done by eye-inspection of the emission excess or the secondary peak in the blue-shifted side. To solve the above problems related to the optically thickness and the spectral contamination, we first inspected the spectra of OC34S 7-6 and OCS 7-6 carefully, and selected positions where the line profiles OC34S 7-6 were consistent with those of OCS 7-6. These positions were regarded to be unaffected by NH2D. The optical depth of OCS toward these positions were then calculated by comparing with O13CS. Only positions with optically thin OCS lines will be used to determine the 32S/34S ratio.
We estimated the optical depth of OCS J=7-6 line from:
| (1) |
in which is the peak main brightness temperature. We adopt the ratio of 31, which is derived from NH2CHO and NHCHO (Zheng et al., submitted.). It is found that is larger than 31 toward some pointings, in which was unmeasurable. OCS emission was regarded to be optically thin for these positions.
At last, four positions with optically thin OCS lines, where OC34S 7-6 lines are not affected by NH2D emission at 83060.244 MHz either, were selected to determine the sulfur isotope ratios in Sg B2. The green triangles denote these positions in Figure 1. All of these positions are far away from the central region of Sgr B2 complex. Table 2 lists the selected positions, and the physical parameters of lines toward these positions. Figure 3 presents the lines of OCS, O13CS, and OC34S 7-6 emission toward these positions.
3.2 32S/34S ratio derived directly from OCS and OC34S
Figure 4, 5, 6 present the gaussian fitting results of OCS, O13CS and OC34S toward selected positions. For a given transition the frequencies, upper level energies and Einstein coefficients for the three isotopologues are comparable; therefore, the abundance ratio can be directly derived from the line ratios. Table 2 presents the Gaussian fitting results of OCS and OC34S toward four positions and the velocity-corrected averaged spectra of these four positions. The line parameters, including the antenna temperature, centroid velocity, FWHM, and integrated intensities are obtained by gaussian fitting. The 32S/34S ratios derived from the integrated intensity ratios of OCS and OC34S:
| (2) |
which requires that OCS and OC34S are optically thin. The calculated values range from 15.1 to 20.3, which are consistent within the uncertainties with each other.
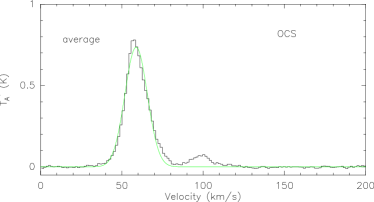
We also averaged spectral lines toward selected positions in Table 2. Figure 7 shows the velocity-corrected averaged spectra of OCS, O13CS, OC33S, and OC34S. The system velocities toward each positions are different to each other, with velocity difference up to 13 km s-1. We used the velocity information of each positions (See Table 2) based on detected strong lines to do the alignment. Then these spectra were averaged by setting “set align frequency”, which means that spectra were averaged along the frequency axis. The 34S/32S isotopic ratio is calculated to be 17.10.9, which is well consistent with those derived from the CS and its isotoplogues toward the +50 km s-1 Cloud and envelope of Sgr B2(N) presented by Humire et al. (2020), but is larger than those obtained in Yu et al. (2020) and Armijos-Abendaño et al. (2015).
3.3 34S/33S ratio derived directly from OC34S and OC33S
OC33S 7-6 was relatively weak. It was detected above 3 levels toward only a few positions. To improve the signal to noise ratio, we only used the averaged spectra of selected positions in Table 2 to derive the 34S/33S ratio. The averaged spectra were shown in Figure 7. The 34S/33S isotope ratio could be directly obtained from
| (3) |
which requires that OC34S and OC33S are optically thin.
Table 3 presents the Gaussian fitting results of OC33S. We can see from table 3 that the ratio of 34S/33S is 6.81.9. This value is slightly larger than those derived from the CS and its isotoplogues toward the +50 km s-1 Cloud and Sgr B2(N), which are 4.30.2 (Humire et al., 2020) and 4.60.2 (Yu et al., 2020), respectively. It is larger than that measured toward Sgr B2(N) by Yan et al. (2023), which is 2.
4 DISCUSSION
In this paper, we present measurements of 32S/34S and 34S/33S ratios toward the extended region of Sgr B2 for the first time. Observations toward Sgr B2 may suffer from optical depth of emission lines, the line forest toward Sgr B2(N), as well as the blend of absorption and emission caused by strong continuum emission, which will bring uncertainties for the measurements of sulphur isotopic ratios. The physical and chemical conditions of the extended regions is relatively simple, as they are far away from star-forming regions. We took into account the contamination of OC34S by NH2D, and then selected positions that is not contaminated by NH2D emission. The optical depth of OCS are calculated by comparing with O13CS. Four positions with optically thin OCS lines were selected for further studies. At last, a 32S/34S ratio of 17.10.9 and 34S/33S ratio of 6.81.9 were obtained. Our results are consistent with those obtained by Humire et al. (2020). They measured the carbon and sulphur abundances toward the +50 km s-1 Cloud and several line-of-sight clouds towards Sgr B2(N), and obtained an average 32S/34S ratio of 17.95.0 toward Sgr B2(N). Thus our result confirms the termination of the decreasing tendency while approaching the Galactic centre.
Goldsmith and Linke (1981) once reported a 32S/34S ratio of 16 for Sgr B2 from the OCS/OC34S ratio. This value is consistent within errors with results present here. With OCS/OC34S, Armijos-Abendaño et al. (2015) reported 32S/34S ratios of 8.71.3 in l.o.s clouds towards G+0.693. However, their observations were affected by the optical thickness of OCS, as well as band pass ripples.
Humire et al. (2020) obtained an average 32S/34S ratio of 17.95.0 in the envelope of Sgr B2(N) with ALMA observations of absorption lines of CS isotopologues, which is consistent with results present here. Yu et al. (2020) reported a 32S/34S ratio of 7.14.1 measured with IRAM 30m observations of CS isotopologues. Yan et al. (2023) obtained three different isotopic ratios from IRAM 30m observations of CS isotopologues toward Sgr B2(N), with isotopic ratios ranging from 10 to 26. Those results may be caused by the complex physical and kinematic environments in Sgr B2(N), in which several hot cores and UC HII regions have been detected. Abundant molecules have been detected toward Sgr B2(N) (Belloche et al., 2013). According to line survey of Sgr B2(N) with the IRAM 30m telescope, there are several lines near to 13CS (92494.308 MHz) and 13C34S (90926.026 MHz), such as CH2OHCHO (90922.214 MHz), CH3CH3CO (90929.321 MHz), CH3CN, v8=2 (92491.668 MHz), and 13CH2CHCN (92500.874 MHz). Both Yu et al. (2020) and Yan et al. (2023) did not take into account the line blending from nearby lines. Yan et al. (2023) performed independent spectral fittings for the three velocity components of Sgr B2(N). We could see from Table.A.3 in Yan et al. (2023) that the FWHM width of 13CS is 11.230.63 km s-1 for the 53 km s-1 component, while the FWHM of 13C34S is 16.770.81 km s-1 for the same velocity component. The FWHM of 13CS is 16.20.63 km s-1 for the 82 km s-1 component, while the FWHM of 13C34S is 10.431.85 km s-1 for the same velocity component. The significant difference in FWHM indicates that these velocity components are affected by line blending from nearby lines, thus we think that the measurements toward Sgr B2(N) are unreliable because of the serious line blending toward Sgr B2(N). Measurements toward the extended envelope away from Sgr B2(N) and Sgr B2(M) should be more reliable.
With the velocity-corrected averaging spectra, we obtained a ratio of 6.8 1.9. This value is a factor of 3 higher isotopic ratio than that present in Yan et al. (2023). We could see from Belloche et al. (2013) that there are two lines near to C33S 2-1 (97172.064 MHz), including HCCC15N, v=0 (97165.829 MHz) and C2H3CN, v15=2 (97183.100 MHz). The HCCC15N, v=0 is only 6 MHz away from C33S 2-1. The frequency separation is smaller than the expected FWHM width of 30 km s-1, corresponding to a frequency range of about 10 MHz. In addition, the C33S 2-1 line consists of eight hyperfine components distributed over about 9 MHz. The contamination from nearby lines and the hyperfine components of C33S make it hard to determine the ratio with single dish observation of CS lines toward Sgr B2(N). Our OC33S measurement is less affected by such contamination, and hence is likely to represent more accurate 33S abundance.
The metallicity, i.e. the content of metals relative to hydrogen, could give a measure of the integrated star formation in galaxies. According to the cutting-edge model calculations (Kobayashi et al, 2011), the sulphur isotopic ratios are related with metallicity [Fe/H]. Based on the relationship obtained in Kobayashi et al (2011); Humire et al. (2020), 32S/34 of 17.51.3 gives [Fe/H] of 0.30.1. Ryde et al. (2016) obtained metallicities of for the central 2 degrees ( 300 pc) by observing 2 spectra of M-giants with the Very Large Telescope at high spectral resolution. Thus our result is consistent with iron abundance measurement.
5 CONCLUSIONS
We carried out mapping observations of OCS, O13CS, OC34S, and OC33S 7-6 transitions toward Sgr B2 cloud complex with the IRAM 30m radio telescope. We carefully chose positions with optically thin OCS and uncontaminated OC34S lines, and then used their intensity ratios of the averaged spectra to derive the sulfur isotopic ratios. 34S/33S ratio was derived using integrated intensity ratio of OC34S and OC33S 7-6. We obtained a 32S/34S ratio of 17.10.9. This result confirms a termination of the decreasing trend of the 32S/34S isotopic ratios when approaching the Galactic Centre. We also obtained a 34S/33S ratio of 6.81.9 toward extended envelope of Sgr B2, which is consistent with that measured with CS isotopologues toward the Galactic disc (Chin et al., 1996).
ACKNOWLEDGEMENTS
The authors thank the staff at IRAM for their excellent support of these observations. This work made use of the CDMS Database. This work has been supported by the National Key R&D Program of China (No. 2022YFA1603101). The single dish data are available in the IRAM archive at https://www.iram-institute.org/EN/content-page-386-7-386-0-0-0.html. This research has made use of NASA’s Astrophysics Data System.
| (1) Molecule | (2) Transition | (3) Rest Freq. | (4) | (5) HPBW |
|---|---|---|---|---|
| (MHz) | (K) | (\arcsec) | ||
| OC34S | 7-6 | 83057.971(0.001) | 11.96 | 29.6 |
| O13CS | 7-6 | 84865.166(0.015) | 12.22 | 29.0 |
| OCS | 7-6 | 85139.103(0.001) | 12.26 | 28.9 |
| OC33S | 7-6 | 84067.082(0.001) | 12.10 | 29.3 |
Notes.-: Lines used for mapping. Col. (1): chemical formula; Col. (2): transition quantum numbers, Col. (3): rest frequency and its uncertainty; Col.(4): lower state energy level (K); Col. (5): Half-power beam width, which was calculated following Eq. (1) in https://www.iram.es/IRAMES/telescope/telescopeSummary/telescope_summary.html.
| OCS | 7-6 | O13CS | 7-6 | OC34S | 7-6 | |||||||||
| offset | (OCS) | (OCS) | (OCS) | (O13CS) | (O13CS) | (OC34S) | (OC34S) | R(32/34) | ||||||
| \arcsec | mK | km s-1 | km s-1 | K km s-1 | mK | km s-1 | km s-1 | K km s-1 | mK | km s-1 | km s-1 | K km s-1 | ||
| 60,-30 | 56016 | 58.60.1 | 19.10.2 | 11.360.12 | -a | 177 | 55.72.1 | 21.53.8 | 0.400.07 | 3710 | 55.90.9 | 19.22.2 | 0.750.07 | 15.11.6 |
| 60,-90 | 102012 | 61.10.1 | 16.90.1 | 18.300.09 | - | 329 | 59.71.0 | 16.9 2.0 | 0.580.06 | 5112 | 59.30.8 | 18.92.4 | 1.030.10 | 17.81.8 |
| -90,-30 | 76054 | 62.60.3 | 18.90.7 | 15.270.47 | 0.12 | 268 | 62.11.0 | 15.0 2.0 | 0.410.05 | 3610 | 62.91.1 | 21.52.8 | 0.840.09 | 18.22.5 |
| 30,-180 | 77322 | 49.70.1 | 10.60.2 | 8.75.13 | 0.09 | 2610 | 48.21.1 | 10.82.3 | 0.300.06 | 4310 | 49.10.6 | 9.31.4 | 0.430.07 | 20.33.6 |
| aver. spec. | 73620 | 58.80.1 | 16.30.2 | 12.80.14 | - | 234 | 57.60.8 | 17.41.7 | 0.430.04 | 395 | 57.4 0.5 | 18.11.3 | 0.750.04 | 17.10.9 |
Note. Col(1): the equatorial offsets with respect to Sgr B2(N); Col(2): the peak intensity of OCS 7-6; Col(3): of OCS 7-6; Col(4): the FWHM of OCS 7-6; Col(5): the integrated intensity of OCS 7-6; Col(6): peak opacity of OCS 7-6; Col(7): the peak intensity of O13CS 7-6; Col(8): of O13CS 7-6; Col(9): the FWHM of O13CS 7-6; Col(10): the integrated intensity of O13CS 7-6; Col(11): the peak intensity of OC34S 7-6; Col(12): the of OC34S 7-6; Col(13): the FWHM of OC34S 7-6; Col(14): the integrated intensity of OC34S 7-6; Col(15): the isotopic ratio of 32S to 34S. a: For positions where was unmeasurable, OCS emission was regarded to be optically thin.
| OC33S | 7-6 | ||||
|---|---|---|---|---|---|
| R(34/33) | |||||
| mK | km s-1 | km s-1 | K km s-1 | ||
| 6.45.6 | 58.8 | 16.3 | 0.110.03 | 6.81.9 |
Note. Col(1): the peak intensity of OC33S 7-6; Col(2): of OC33S 7-6; Col(3): the FWHM of OC33S 7-6; Col(4): the integrated intensity of OC33S; Col(5): the isotopic ratio 34S to 33S.


References
- Armijos-Abendaño et al. (2015) Armijos-Abendaño, J., Martín-Pintado, J., Requena-Torres, M. A., Martín, S., Rodríguez-Franco, A. 2015, MNRAS, 446, 3842-3862.
- Belloche et al. (2013) Belloche, A., Müller, H. S. P., Menten, K. M., et al. 2013, A&A, 559, A47. doi:10.1051/0004-6361/201321096
- Bonfand et al. (2017) Bonfand, M., Belloche, A., Menten, K. M., et al. 2017, A&A, 604, A60. doi:10.1051/0004-6361/201730648
- Chin et al. (1996) Chin, Y.-N., Henkel, C., Whiteoak, J. B., Langer, N., Churchwell, E. B. 1996, A&A, 305, 960.
- Goldsmith and Linke (1981) Goldsmith, P. F., Linke, R. A. 1981, ApJ, 245, 482-494.
- Humire et al. (2020) Humire, P. K., Thiel, V., Henkel, C., Belloche, A., Loison, J.-C., Pillai, T., Riquelme, D., Wakelam, V., Langer, N., Hernández-Gómez, A., Mauersberger, R., Menten, K. M. 2020, A&A, 642, A222.
- Jones et al (2008) Jones, P.A., Burton, M.G., Cunningham, M.R. et al. 2008, MNRAS, 386, 117
- Kobayashi et al (2011) Kobayashi, C., Tominaga, N., Nomoto, K. 2011, ApJ, 730, L14.
- Li et al. (2015) Li, J., Wang, J., Zhu, Q., Zhang, J., Li, D. 2015, ApJ, 802, 40.
- Maiolino and Mannucci (2019) Maiolino, R., Mannucci, F. 2019, A&A Rev., 27, 3.
- Müller et al. (2005) Müller, H. S. P., Schlöder, F., Stutzki, J., Winnewisser, G. 2005, Journal of Molecular Structure, 742, 215-227.
- Ou et al. (2023) Ou, C., Wang, J., Zheng, S., Li, J., Romano, D., Zhang, Z.-Y. 2023, MNRAS, 522, 559-571.
- Romano (2022) Romano, D. 2022, A&A Rev., 30, 7.
- Ryde et al. (2016) Ryde, N., Schultheis, M., Brieco, V., Matteucci, F., Rich, R.M., Uttenthaler, S. 2016, AJ, 151, 1
- Wilson and Rood (1994) Wilson, T. L., Rood, R. 1994, ARA&A, 32, 191-226.
- Yan et al. (2023) Yan, Y. T., Henkel, C., Kobayashi, C., Menten, K. M., Gong, Y., Zhang, J. S., Yu, H. Z., Yang, K., Xie, J. J., Wang, Y. X. 2023, A&A, 670, A98.
- Yu et al. (2020) Yu, H. Z., Zhang, J. S., Henkel, C., Yan, Y. T., Liu, W., Tang, X. D., Langer, N., Luan, T. C., Chen, J. L., Wang, Y. X., Deng, G. G., Zou, Y. P. 2020, ApJ, 899, 145.