Study of Reactively Sputtered Nickel Nitride Thin Films
Abstract
Nickel nitride (Ni-N) thin film samples were deposited using reactive magnetron sputtering process utilizing different partial flow of N2 (). They were characterized using x-ray reflectivity (XRR), x-ray diffraction (XRD) and x-ray absorption near edge spectroscopy (XANES) taken at N -edge and Ni -edges. From XRR measurements, we find that the deposition rate and the density of Ni-N films decrease due to successively progression in , signifying that Ni-N alloys and compounds are forming both at Ni target surface and also within the thin film samples. The crystal structure obtained from XRD measurements suggest an evolution of different Ni-N compounds given by: Ni, Ni(N), Ni4N, Ni3N, and Ni2N with a gradual rise in . XANES measurements further confirm these phases, in agreement with XRD results. Polarized neutron reflectivity measurements were performed to probe the magnetization, and it was found Ni-N thin films become non-magnetic even when N incorporation increases beyond few %. Overall growth behavior of Ni-N samples has been compared with that of rather well-known Fe-N and Co-N systems, yielding similarities and differences among them.
I Introduction
The family of transition metal nitride (TMN) exhibits interesting electronic, optical, thermal and magnetic properties. In particular, the combination of various properties of 3 TMNs such as wear and corrosion resistant, exceptional hardness with excellent magnetic properties have attracted considerable attention Sun et al. (2019); Khazaei et al. (2013); Zhong et al. (2016); Oyama (1996); Williams (1997); Coey and Smith (1999). However among those, early 3 TMNs (e.g. ScN, TiN, VN, and CrN) are well established and relatively more explored than late 3 TMNs (e.g. Mn-N, Fe-N, Co-N, and Ni-N).
For the early 3 TMNs, mostly the MN (M = metal) stoichiometry is prevalent but some reports of M2N phase has also observed e.g. Cr2N and Nb2N Zhong et al. (2016); Ningthoujam and Gajbhiye (2015); Gupta (2020). On the other hand, a significant change in stoichiometry is observed as M3N and M4N, etc. for late 3 TMNs. The increased M/N ratio for the late TMNs signifies the rejection of N by the metal atoms which reflected in their poor stability and challenging formation Zhong et al. (2016); Oyama (1996); Ningthoujam and Gajbhiye (2015). Nevertheless, the late 3 TMNs are largely investigated for their excellent electronic and magnetic properties Coey and Smith (1999); Yang et al. (2018); Bhattacharyya (2015); Hui et al. (2018); Blancá et al. (2009); Meinert (2016); Imai et al. (2010, 2014).
Unlike early, the late 3 TMNs have been known to possess several multi-nitride phases. For instance, in Fe-N, different crystallographic phases have been obtained: Fe16N2 Metzger et al. (1994), Fe8N Matar (1992), Blancá et al. (2009), Fe3N Leineweber et al. (1999), Fe2N Rechenbach and Jacobs (1996), FeN Zhao et al. (2015), FeN2, FeN4, FeN8 Niwa et al. (2017); Bykov et al. (2018); Wu et al. (2018). Similarly, in Co-N system, Pandey et al. (2019a, 2018, 2017, b), Co3N Asahara et al. (2001), Co2N Fang et al. (2004); Zhou et al. (2017); Guo et al. (2019), CoN Suzuki et al. (1995); Shi et al. (2008) and CoN2 Niwa et al. (2017) phases have been synthesized. On the other hand, the nickel nitrides (Ni-N) is scariest among the late 3 TMNs as only a handful of reports are available. However, Ni-N are potentially important metallic compound Xie et al. (2018); Yu et al. (2015) as they have been reported to serve as negative electrodes in lithium batteries and energy storage devices Li et al. (2019); Gillot et al. (2011); Yu et al. (2015); Balogun et al. (2015); Jia et al. (2019), dye or quantum dot solar cells Kang et al. (2015); Keraudy et al. (2019). Ni-N compounds have been also found to exhibit superior (electro)catalytic activities in the reduction reactions and also demonstrated many other advantages over pure metals Xie et al. (2018); Gage et al. (2016). Non-conventional insulating-metal transition properties have also been demonstrated by Ni-N Kim et al. (2012); Yun et al. (2014); Ju Yun et al. (2013); Kim et al. (2014). With a good quality of interface, Ni-N demonstrates a high work function, low leakage current and therefore implemented as an electrode in GaN-based Schottky barrier diodes Li et al. (2019).
Notwithstanding the active experimental research work, relatively less information about the intrinsic properties of Ni-N is available. Even the phase-diagram information of Ni-N is ambiguous or scarce Guillermet and Frisk (1991); Neklyudov and Morozov (2004). Few phases in Ni-N system as; (fcc) Terao (1959); Dorman and Sikkens (1983); Hemzalová et al. (2013); Fang et al. (2014); Leineweber and Maisel (2019), Ni3N(hcp) Vempaire et al. (2009a, b), Ni2N Nishihara et al. (2014); Houari et al. (2018); Ma et al. (2018) have been reported to synthesized by chemical vapor deposition, sputtering and highly reactive azides or hydrazine. While some other phases Ni3N2 and NiN6, have also been reported to crystallize by chemical route methods Guillermet and Frisk (1991). On the other hand, the stoichiometric NiN has not been achieved yet. Recently, nickel pernitride (NiN2) phase is also synthesized at very high pressure of about 40 GPa Niwa et al. (2019). Additionally, an ambiguity about the magnetic characteristic of Ni-N phases can also be seen from the available literature. Gajbhiye reported a ferromagnetic state in the Ni3N phase with Curie temperature of about 634 K Gajbhiye et al. (2002). On the other hand, the Ni3N phase (or mixed with Ni2N phase) was found to exhibit paramagnetic behavior, in some other reports Vempaire et al. (2009a, b); Popović et al. (2009). Furthermore, the detailed information on the structural and the magnetic behavior of Ni-N thin films is still lacking. The dearth of such information about the Ni-N system is due to their metastability which is related to their high enthalpy of formation () and makes it rather difficult to synthesize Guillermet and Frisk (1991). This indicates that a relatively narrow window exists for the synthesis of various Ni-N phases.
In view of this, we synthesized the entire spectrum of Ni-N films with the successive increase of the partial flow of nitrogen (in the window 0 to 100) by reactive magnetron sputtering and investigated their structural and magnetic properties.
II Experimental Procedure
A set of Ni-N thin films were prepared on amorphous quartz (SiO2) substrates using direct current magnetron sputtering system (Orion-8, AJA Int. Inc.) at room temperature. High purity Ni target (99.993 pure) 1 inch was sputtered in the presence of different partial gas flow of nitrogen ( = p/(pAr+p), where pAr and p are gas flow of Ar and N2 gases, respectively). was varied at 0, 5, 10, 15, 20, 50, 75, and 100. A base pressure of 110-7 Torr was achieved before deposition and the working pressure was maintained at 3 mTorr during deposition. No intentional substrate heating was provided during and after deposition.
The density and deposition rates were measured using x-ray reflectivity (XRR) measurements using Cu K- x-ray source. Samples were characterized for their crystal structure and phase formation by x-ray diffraction (XRD) using a standard x-ray diffractometer (Bruker D8 Advance) using Cu K- x-ray source. X-ray absorption near edge spectroscopy (XANES) measurements were performed in the total electron yield (TEY) mode at BL-01 at the Indus-2 synchrotron radiation source at RRCAT, Indore Phase et al. (2014). Polarized neutron reflectivity (PNR) measurements were performed at AMOR, SINQ, PSI Switzerland in time of flight mode using Selene optics Stahn and Glavic (2016, 2017). During PNR measurements, to saturate the sample magnetically, a magnetic field of 0.5 T was applied parallel to the sample surface.
III Results and Discussion
III.1 Phase formation and electronic structure
XRR patterns of Ni-N thin films deposited at different are shown in the fig. 1. The thickness, roughness and density of these films have been extracted from the fitting of the XRR patterns using Parratt32 software Braun (7 99). We can see from the XRR patterns that with an increase in , the critical edges shift towards the lower value (shown by dashed line) which indicates a gradual drop in scattering length density (Xsld) due to the increased incorporation of nitrogen in Ni films as shown in the inset (a) of fig. 1. From the table. 1, a significant reduction in Xsld (compared to the pure Ni film) can also be clearly seen. Similar behavior of Xsld with has also been previously obtained for Co-N films (not shown here) Gupta et al. (2015). However, roughness remain nearly constant at about 5 Å. Apart from this, the deposition rates () have been measured using the thickness and the deposition time and shown in the inset (b) of fig. 1. For comparison, the normalized obtained from the Fe-N and Co-N films are also included.
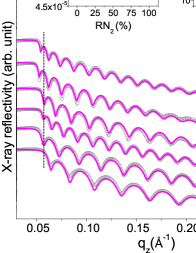
A reduction in with an increase in can be seen in Ni-N films similar to that in Fe-N and Co-N obtained using the same sputtering system with similar 1- inch Fe and Co targets. Such behavior clearly indicates that some nitride formation is also taking place at target itself. Such compound formation in a reactive sputtering process is generally referred as ‘target poisoning’. However, it is contrary to a previous report which ruled out the possibility of target poisoning during the formation of Ni-N thin films Kawamura et al. (2000). Here, both Ni-N and Fe-N systems seem to follow a similar variation in with , whereas the Co-N system shows a rather different behavior. The reduces about 16 to 42 respectively, at = 25 to 100 compared to the of pure metallic state (i.e. = 0; = 41 Å/min) whereas, it drops at about 42 to 72 for Co-N. In addition, the poisoned state achieve at relatively higher in Ni-N and Fe-N system compared to Co-N. On comparing the behavior of DR in Ni-N, Fe-N system with the Co-N, it is interesting to note that the Co target is more prone to nitride formation at the target.
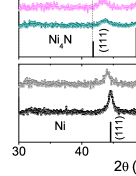
Using obtained from XRR measurements, a separate set of samples with a thickness of about 100 nm was prepared. The XRD patterns of these samples are shown in fig. 2. Pure Ni films formed with = 0 exhibit peaks at 44.58 and 51.85∘ correponding to fcc Ni (JCPDS No. 040850. On increasing the to 5 and 12, (111) and (200) peaks gradually shift to lower 2 values and also becomes slightly border, signifying an interstitial incorporation of N atom into fcc Ni lattice and can be assigned as Ni(N). Such behavior is usually achieved in the initial nitride formation of films as previously also seen in the Fe-N, Co-N and Cr-N systems. The incorporation of N into Ni lattice is also evident from the noticeable reduction in the (inset (a) of fig. 1) and Xsld (table. 1). On further increasing the to 15, the structure changes into phase with preferential orientation of (200) plane. However, the phase formation remains constant up to = 20 but with a shift towards lower angles in both (111) and (200) peaks, indicates a further expansion in phase with lattice parameter (LP) about 3.692 0.005 Å. However, the obtained LP is still approximately 1 less than the theoretical value (3.732 Å) Meinert (2016). In addition, it may also be noted here that an asymmetry appears on the onset of (200) peak (shown by an arrow in fig. 2) which may be related to deformation in the cubic structure. On further increasing the to 25, the phase is accompanied by the Ni3N phase. Whereas it completely get transforms into N rich phase, identified as hcp Ni3N for = 50. Here, a strong reflection at about 44.25∘ indicates a preferential orientation with the (111) direction normal to the surface. However, a reactively sputtered Ni3N film has previously been obtained with preferred orientation along (002) direction. Such differences in the preferred orientation directions can be due to high substrate temperature (475 K) and higher deposition rate ( 2.9 Å/sec) than the present work Dorman and Sikkens (1983). However, when is increased to 75 and 100, the (111) peak of the hcp Ni3N phase gets slightly shifted to lower values along with an additional peak at about 45.5∘. The shift in (111) peak indicates a further expansion in Ni3N structure while the additional diffraction peak corresponds to the Ni2N phase Nishihara et al. (2014); Ma et al. (2017). Such transformation from the single phased Ni3N to the mixed phase of Ni2N and Ni3N is also evident from the obtained density of the films. In table. 1, a substantial drop in Xsld can be seen when is increased from 50 to 75, indicating more nitrogen incorporation in the film and thus confirms the formation of N richer Ni2N phase.
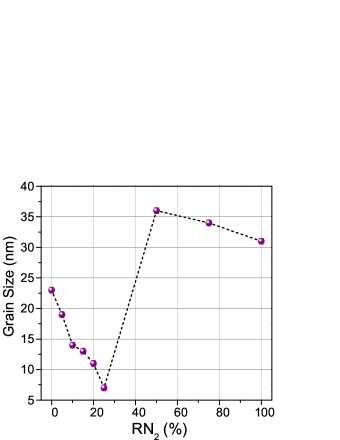
The grain size calculated from the XRD peak width using Scherrer formula is plotted as a function of , is shown in fig. 3. For the Ni film deposited to = 0, the grain size obtained is about 23 nm. On slightly increasing the to 5, the grain size decreases to about 19 nm. The grain size decreases further on increasing and found to be the smallest for = 25. Such variation in grain sizes with signifies the formation of nanocrystalline grains due to the formation of the phase with the smaller grains. However, the grain size increases rapidly on further increasing the at 50 which indicates the well-crystalline single phase Ni3N formation in the films and the grain size increases. However, a further increase in would cause the degradation of crystalline quality and enhance the formation of the Ni2N phase which is mixed with the Ni3N therefore, the grain size decreased slightly again. A similar variation in grain sizes as a function of has also been previously obtained in a recent report Li et al. (2019).
XANES measurements were performed at N and Ni edges of Ni-N samples, shown in fig. 4. For = 5, a prominent peak around 398 eV along with some other features can be seen in the N edge spectra indicating the presence of incorporated nitrogen in Ni-N sample, can be seen in fig. 4 (A). However, the features get more pronounced at = 20 due to the enhanced incorporation of nitrogen in sample. Here, the four feature structures around the main peak at energies of 397 eV, 398.5 eV, 400 eV, and 401.2 eV can clearly be seen in the derivative of N edge spectra, assigned as , , and respectively, shown in the inset of fig. 4 (A). Similar behavior has previously also been probed in the N edge spectra for thin films Ito et al. (2015). By calculating the partial densities of states in , the origin of different features present in N edge spectra has been well explained in term of hybridization between Fe 3 and N 2 orbitals Ito et al. (2015). By comparing the N edge spectra obtained for Ni-N sample deposited at = 20 with those obtained for thin film in a work by Ito Ito et al. (2015), the formation of phase can also be confirmed which is evident from the XRD results as well. The origin of feature can be explained in terms of anti-bonding, and features , and are explained by anti-bonding states arises due to dipole transition from the N 1 core-level to the hybridized states of Ni 3 and N 2. For 50, a noticeable change in N edge XANES spectra appears which may be due to the phase transformation from phase to other Ni-N phases. At = 50, 75 and 100, now the features , may be attributed to the anti-bonding formed by hybridization between Ni 3, 3, 3, and N 2 orbitals, and the anti-bonding due to Ni 3d and N 2 hybridization, respectively. While the feature and above may attributed to transition from N 1 to hybridized states of N 2 and Ni 4 states.
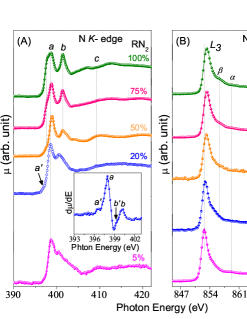
The Ni edge spectra shows two main peaks at about 852.5 and 870 eV correspond to and edges arises due to well-known spin-orbit interaction, shown in fig. 4 (B). A weak satellite feature around 858.5 eV assigned as can also be seen which corresponds to hybridization between valence and unoccupied states. A gradual shift in the peak position of edge centroid to higher energy side can be seen with increasing compared to 5 spectra. Such behavior again signifies the increased oxidation state of Ni in different Ni-N phases. In addition, a small feature appears at about 2 eV above the edge assigned as in fig. 4 (B) which is prominently present in 75. This feature has previously been obtained for Ni +2 state species and arises due to strong interactions between core holes and 3 orbitals of Ni Kauffman et al. (2016). In the present study also, we have seen that at 75, a mixed phase of Ni2N and Ni3N is present in the sample and the oxidation state of Ni is 1.5 in Ni2N phase Ma et al. (2017). Therefore, the presence of this feature and upshift of the edge centroid directly reflects nearly +2 chemical valency of Ni in 75 and supports the formation of Ni2N phase as well.
Hence, from XANES results also, it is clear that with the successive increment in the , different Ni-N phases get formed which is well-consistent with our XRD results.
| Roughness | Phase(s) identified | Xsld | Xsld | Nsld | Nsld | ||
|---|---|---|---|---|---|---|---|
| XRR | XRD | Exp. | Theo. | Exp. | Theo. | Exp. | |
| () | Å | Å-2 | Å-2 | Å-2 | Å-2 | /Ni | |
| 0 | 4 | Ni | 6.310-5 | 6.4410-5 | 9.110-6 | 9.4110-6 | 0.45 |
| 5 | 5 | Ni(N) | - | - | 9.010-6 | - | 0.18 |
| 12 | 5 | Ni4+xN1-x | 5.910-5 | - | 8.910-6 | - | 0 |
| 20 | - | - | 5.7710-5 | 8.8610-6 | 9.6610-6 | 0 | |
| 25 | 5 | +Ni3N | 5.810-5 | - | 9.110-6 | - | 0 |
| 50 | 6 | Ni3N | 5.610-5 | 5.710-5 | 9.210-6 | 1.0210-5 | 0 |
| 75 | 8 | Ni3N+Ni2N | 4.810-5 | - | 9.510-6 | - | 0 |
| 100 | 7 | Ni3N+Ni2N | 5.210-5 | 5.5210-5⋆ | 7.610-6 | 1.0310-5⋆ | 0 |
III.2 Magnetization Measurements
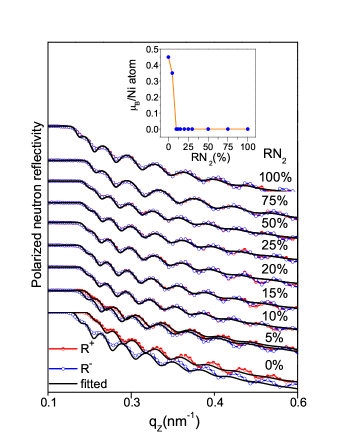
We performed magnetization measurements along out-of-plane direction in the Ni-N samples using SQUID-VSM and magneto-optical Kerr effect (not shown here) measurements. We found the absence of out-of-plane magnetization component in the samples. Therefore, to probe the in-plane magnetization in the Ni-N samples, PNR measurements were carried out as PNR is ideally favorable to determine the nuclear and the averaged in-plane magnetization depth profile of the film. The PNR patterns of Ni-N films are shown in fig. 5. We can see that the splitting between spin-up (R+) and down (R-) reflectivities in PNR patterns are only visible for = 0 and 5 while disappears afterwards. Since, it is known that the splitting between R+ and R- reflectivity in the PNR pattern clearly indicates the ferromagnetic state of the sample Blundell and Bland . Therefore, such behavior in PNR patterns directly signifies the ferromagnetic ordering for = 0 and 5 while a non-magnetic state for 5 in Ni-N samples. The pure Ni sample ( =0) is fitted (using SimulReflec programme Ott (2011)) considering the magnetic moment () of 0.45 /Ni while it reduces to 0.18 /Ni for = 5. From the PNR data, we can say that ferromagnetism retains only up to = 5, and disappears afterward as shown in the inset of fig. 5. However, the Ni3N and Ni2N phases have previously been reported to show paramagnetic behavior Vempaire et al. (2009a, b); Popović et al. (2009). Therefore, the non-magnetic behavior of Ni-N films deposited at = 25 to 100 is expected. On the other hand, it has been theoretically reported that the phase posses a small magnetic moment 0.32 /Ni with Curie temperature of 121 K Meinert (2016). In the present study, we found no ferromagnetism in films deposited at 20% at room temperature, as confirmed by our PNR measurements. Contrary to the present observation, other experimental works claimed a ferromagnetic behavior with Curie temperature 500 K in the films. Although, it is to be noted here that those Ni-N films were prepared at high of about 455-625 K Linnik et al. (2013); Shalayev et al. (2014). Therefore, the film may contain a dominant Ni phase that may be responsible for the presence of ferromagnetism at room temperature Linnik et al. (2013); Shalayev et al. (2014).
IV Conclusion
We have successfully synthesized the different phases of the Ni-N system by reactive magnetron sputtering process. The deposition rates and densities of Ni-N films decreases with increasing , indicates the target poisoning behavior and gradual incorporation of N in Ni-N thin films, respectively. Evolution of different Ni-N phases; Ni(N) Ni3NNi2N phases obtained with successively increasing , confirmed by XRD results. The transformation into different Ni-N phases is also reflected in their corresponding grain sizes. The formation of different Ni-N phases with varying is also further supported by XANES results. PNR measurements reveal the presence of ferromagnetism only in pure Ni ( = 0) and in Ni-N sample deposited at a very smaller value of = 5, while the Ni-N samples become non-magnetic for 5.
Acknowledgments
On of the author (NP) is thankful to Council of Scientific Industrial Research (CSIR) for senior research fellowship (SRF). Authors thank the Department of Science and Technology, India (SR/NM/Z-07/2015) for the financial support and Jawaharlal Nehru Centre for Advanced Scientific Research (JNCASR) for managing the project. A part of this work was performed at AMOR, Swiss Spallation Neutron Source, Paul Scherrer Institute, Villigen, Switzerland. D. M. Phase is acknowledged for the BL-01 measurements. We acknowledge V. R. Reddy and A. Gome for XRR measurements and Layanta Behera for the help provided in various experiments.
References
- Sun et al. (2019) W. Sun, C. J. Bartel, E. Arca, S. R. Bauers, B. Matthews, B. Orvañanos, B.-R. Chen, M. F. Toney, L. T. Schelhas, W. Tumas, et al., Nature materials , 1 (2019).
- Khazaei et al. (2013) M. Khazaei, M. Arai, T. Sasaki, C.-Y. Chung, N. S. Venkataramanan, M. Estili, Y. Sakka, and Y. Kawazoe, Advanced Functional Materials 23, 2185 (2013).
- Zhong et al. (2016) Y. Zhong, X. Xia, F. Shi, J. Zhan, J. Tu, and H. J. Fan, Advanced science 3, 1500286 (2016).
- Oyama (1996) S. T. Oyama, Introduction to the chemistry of transition metal carbides and nitrides (Springer, Dordrecht, 1996) pp. 1–27.
- Williams (1997) W. S. Williams, Jom 49, 38 (1997).
- Coey and Smith (1999) J. Coey and P. Smith, Journal of magnetism and magnetic materials 200, 405 (1999).
- Ningthoujam and Gajbhiye (2015) R. Ningthoujam and N. Gajbhiye, Progress in Materials Science 70, 50 (2015).
- Gupta (2020) M. Gupta, Synthesis, Stability and Self-Diffusion in Iron Nitride Thin Films: A Review (to be published in Springer, 2020).
- Yang et al. (2018) B. Yang, L. Tao, L. Jiang, W. Chen, P. Tang, Y. Yan, and X. Han, Physical Review Applied 9, 054019 (2018).
- Bhattacharyya (2015) S. Bhattacharyya, The Journal of Physical Chemistry C 119, 1601 (2015).
- Hui et al. (2018) L. Hui, Z. Xie, C. Li, and Z.-Q. Chen, Journal of Magnetism and Magnetic Materials 451, 761 (2018).
- Blancá et al. (2009) E. L. P. y. Blancá, J. Desimoni, N. E. Christensen, H. Emmerich, and S. Cottenier, physica status solidi (b) 246, 909 (2009).
- Meinert (2016) M. Meinert, Journal of Physics: Condensed Matter 28, 056006 (2016).
- Imai et al. (2010) Y. Imai, Y. Takahashi, and T. Kumagai, Journal of Magnetism and Magnetic Materials 322, 2665 (2010).
- Imai et al. (2014) Y. Imai, M. Sohma, and T. Suemasu, Journal of Alloys and Compounds 611, 440 (2014).
- Metzger et al. (1994) R. M. Metzger, X. Bao, and M. Carbucicchio, Journal of Applied Physics 76, 6626 (1994).
- Matar (1992) S. Matar, Zeitschrift für Physik B Condensed Matter 87, 91 (1992).
- Leineweber et al. (1999) A. Leineweber, H. Jacobs, F. Hüning, H. Lueken, H. Schilder, and W. Kockelmann, Journal of Alloys and Compounds 288, 79 (1999).
- Rechenbach and Jacobs (1996) D. Rechenbach and H. Jacobs, Journal of Alloys and Compounds 235, 15 (1996).
- Zhao et al. (2015) Z. Zhao, K. Bao, D. Duan, F. Tian, B. Liu, and T. Cui, Rsc Advances 5, 31270 (2015).
- Niwa et al. (2017) K. Niwa, T. Terabe, D. Kato, S. Takayama, M. Kato, K. Soda, and M. Hasegawa, Inorganic chemistry 56, 6410 (2017).
- Bykov et al. (2018) M. Bykov, E. Bykova, G. Aprilis, K. Glazyrin, E. Koemets, I. Chuvashova, I. Kupenko, C. McCammon, M. Mezouar, V. Prakapenka, et al., Nature communications 9, 2756 (2018).
- Wu et al. (2018) L. Wu, R. Tian, B. Wan, H. Liu, N. Gong, P. Chen, T. Shen, Y. Yao, H. Gou, and F. Gao, Chemistry of Materials 30, 8476 (2018).
- Pandey et al. (2019a) N. Pandey, M. Gupta, R. Gupta, S. Amir, and J. Stahn, Applied Physics A 125, 539 (2019a).
- Pandey et al. (2018) N. Pandey, M. Gupta, R. Gupta, P. Rajput, and J. Stahn, Journal of Magnetism and Magnetic Materials 448, 274 (2018).
- Pandey et al. (2017) N. Pandey, M. Gupta, R. Gupta, S. Chakravarty, N. Shukla, and A. Devishvili, Journal of Alloys and Compounds 694, 1209 (2017).
- Pandey et al. (2019b) N. Pandey, M. Gupta, R. Gupta, Z. Hussain, V. Reddy, D. Phase, and J. Stahn, Physical Review B 99, 214109 (2019b).
- Asahara et al. (2001) H. Asahara, T. Migita, T. Tanaka, and K. Kawabata, Vacuum 62, 293 (2001).
- Fang et al. (2004) J.-S. Fang, L.-C. Yang, C.-S. Hsu, G.-S. Chen, Y.-W. Lin, and G.-S. Chen, Journal of Vacuum Science & Technology A: Vacuum, Surfaces, and Films 22, 698 (2004).
- Zhou et al. (2017) D. Zhou, X. Cao, Z. Wang, S. Hao, X. Hou, F. Qu, G. Du, A. M. Asiri, C. Zheng, and X. Sun, Chemistry–A European Journal 23, 5214 (2017).
- Guo et al. (2019) D. Guo, Z. Tian, J. Wang, X. Ke, and Y. Zhu, Applied Surface Science 473, 555 (2019).
- Suzuki et al. (1995) K. Suzuki, T. Kaneko, H. Yoshida, H. Morita, and H. Fujimori, Journal of Alloys and Compounds 224, 232 (1995).
- Shi et al. (2008) Y. Shi, Y. Wan, R. Zhang, and D. Zhao, Advanced Functional Materials 18, 2436 (2008).
- Xie et al. (2018) F. Xie, T. Liu, L. Xie, X. Sun, and Y. Luo, Sensors and Actuators B: Chemical 255, 2794 (2018).
- Yu et al. (2015) Y. Yu, W. Gao, Z. Shen, Q. Zheng, H. Wu, X. Wang, W. Song, and K. Ding, Journal of Materials Chemistry A 3, 16633 (2015).
- Li et al. (2019) X. Li, T. Pu, H. Taiki, T. Zhang, T. Xie, S. J. L. Fujiwara, H. Kitahata, L. Li, S. Kobayashi, M. Ito, et al., Vacuum 162, 72 (2019).
- Gillot et al. (2011) F. Gillot, J. Oró-Solé, and M. R. Palacín, J. Mater. Chem. 21, 9997 (2011).
- Balogun et al. (2015) M.-S. Balogun, W. Qiu, W. Wang, P. Fang, X. Lu, and Y. Tong, Journal of materials chemistry A 3, 1364 (2015).
- Jia et al. (2019) Y. Jia, Z. Ma, Z. Li, Z. He, J. Shao, and H. Zhang, Frontiers of Materials Science , 1 (2019).
- Kang et al. (2015) J. S. Kang, M.-A. Park, J.-Y. Kim, S. H. Park, D. Y. Chung, S.-H. Yu, J. Kim, J. Park, J.-W. Choi, K. J. Lee, et al., Scientific reports 5, 10450 (2015).
- Keraudy et al. (2019) J. Keraudy, L. Athouel, J. Hamon, B. Girault, D. Gloaguen, M. Richard-Plouet, and P.-Y. Jouan, Thin Solid Films 669, 659 (2019).
- Gage et al. (2016) S. H. Gage, B. Trewyn, C. Ciobanu, S. Pylypenko, and R. Richards, Catalysis Science & Technology 6, 4059 (2016).
- Kim et al. (2012) H.-D. Kim, H.-M. An, and T. G. Kim, IEEE Transactions on Electron Devices 59, 2302 (2012).
- Yun et al. (2014) M. J. Yun, H.-D. Kim, S. Man Hong, J. Hyun Park, D. Su Jeon, and T. Geun Kim, Journal of Applied Physics 115, 094305 (2014).
- Ju Yun et al. (2013) M. Ju Yun, H.-D. Kim, and T. Geun Kim, Journal of Vacuum Science & Technology B, Nanotechnology and Microelectronics: Materials, Processing, Measurement, and Phenomena 31, 060601 (2013).
- Kim et al. (2014) H.-D. Kim, M. J. Yun, S. M. Hong, and T. G. Kim, Journal of nanoscience and nanotechnology 14, 9088 (2014).
- Guillermet and Frisk (1991) A. F. Guillermet and K. Frisk, International journal of thermophysics 12, 417 (1991).
- Neklyudov and Morozov (2004) I. Neklyudov and A. Morozov, Physica B: Condensed Matter 350, 325 (2004).
- Terao (1959) N. Terao, Naturwissenschaften 46, 204 (1959).
- Dorman and Sikkens (1983) G. Dorman and M. Sikkens, Thin Solid Films 105, 251 (1983).
- Hemzalová et al. (2013) P. Hemzalová, M. Friák, M. Šob, D. Ma, A. Udyansky, D. Raabe, and J. Neugebauer, Physical Review B 88, 174103 (2013).
- Fang et al. (2014) C.-M. Fang, R. S. Koster, W.-F. Li, and M. A. van Huis, RSC Advances 4, 7885 (2014).
- Leineweber and Maisel (2019) A. Leineweber and S. Maisel, Computational Materials Science 161, 209 (2019).
- Vempaire et al. (2009a) D. Vempaire, S. Miraglia, J. Pelletier, D. Fruchart, E. Hlil, L. Ortega, A. Sulpice, and F. Fettar, Journal of Alloys and Compounds 480, 225 (2009a).
- Vempaire et al. (2009b) D. Vempaire, F. Fettar, L. Ortega, F. Pierre, S. Miraglia, A. Sulpice, J. Pelletier, E.-K. Hlil, and D. Fruchart, Journal of Applied Physics 106, 073911 (2009b).
- Nishihara et al. (2014) H. Nishihara, K. Suzuki, R. Umetsu, T. Kanomata, T. Kaneko, M. Zhou, M. Tsujikawa, M. Shirai, T. Sakon, T. Wada, et al., Physica B: Condensed Matter 449, 85 (2014).
- Houari et al. (2018) A. Houari, S. F. Matar, and V. Eyert, Electronic Structure 1, 015002 (2018).
- Ma et al. (2018) Z. Ma, Z. Li, S. Li, P. Li, and H. Zhang, Materials Letters 229, 148 (2018).
- Niwa et al. (2019) K. Niwa, R. Fukui, T. Terabe, T. Kawada, D. Kato, T. Sasaki, K. Soda, and M. Hasegawa, European Journal of Inorganic Chemistry (2019).
- Gajbhiye et al. (2002) N. Gajbhiye, R. Ningthoujam, and J. Weissmüller, physica status solidi (a) 189, 691 (2002).
- Popović et al. (2009) N. Popović, Ž. Bogdanov, B. Goncić, S. Štrbac, and Z. Rakočević, Applied Surface Science 255, 4027 (2009).
- Phase et al. (2014) D. M. Phase, M. Gupta, S. Potdar, L. Behera, R. Sah, and A. Gupta, AIP Conference Proceedings 1591, 685 (2014).
- Stahn and Glavic (2016) J. Stahn and A. Glavic, Nuclear Instruments and Methods in Physics Research Section A: Accelerators, Spectrometers, Detectors and Associated Equipment 821, 44 (2016).
- Stahn and Glavic (2017) J. Stahn and A. Glavic, in Journal of Physics: Conference Series, Vol. 862 (IOP Publishing, 2017) p. 012007.
- Braun (7 99) C. Braun, Parratt32- The Reflectivity Tool (HMI Berlin, 1997-99).
- Gupta et al. (2015) R. Gupta, N. Pandey, A. Tayal, and M. Gupta, AIP Advances 5, 097131 (2015).
- Kawamura et al. (2000) M. Kawamura, Y. Abe, and K. Sasaki, Vacuum 59, 721 (2000).
- Ma et al. (2017) Z.-y. Ma, H. Zhang, X. Sun, J. Guo, and Z.-c. Li, Applied Surface Science 420, 196 (2017).
- Ito et al. (2015) K. Ito, K. Toko, Y. Takeda, Y. Saitoh, T. Oguchi, T. Suemasu, and A. Kimura, Journal of Applied Physics 117, 193906 (2015), http://dx.doi.org/10.1063/1.4921431.
- Kauffman et al. (2016) D. R. Kauffman, D. Alfonso, D. N. Tafen, J. Lekse, C. Wang, X. Deng, J. Lee, H. Jang, J.-s. Lee, S. Kumar, et al., ACS Catalysis 6, 1225 (2016).
- (71) S. Blundell and J. Bland, Physical Review B 46.
- Ott (2011) F. Ott, SIMULREFLEC (V1.7 2011).
- Linnik et al. (2013) A. Linnik, A. Prudnikov, R. Shalaev, T. Linnik, V. Varyukhin, S. Kostyrya, and V. Burkhovetskii, Technical Physics Letters 39, 143 (2013).
- Shalayev et al. (2014) R. Shalayev, A. Prudnikov, S. Kutrovskaya, V. Varyukhin, A. Linnik, and S. Arakelian, Functional Materials (2014).