Structural Controllability to Unveil Hidden Regulation Mechanisms in Unfolded Protein Response: the Role of Network Models
Abstract
The Unfolded Protein Response is the cell mechanism for maintaining the balance of properly folded proteins in the endoplasmic reticulum , the specialized cellular compartment. Although it is largely studied from a biological point of view, much of the literature lacks a quantitative analysis of such a central signaling pathway. In this work, we aim to fill this gap by applying structural controllability analysis of complex networks to several Unfolded Protein Response networks to identify crucial nodes in the signaling flow. In particular, we first build different network models of the Unfolded Protein Response mechanism, relying on data contained in various protein-protein interaction databases. Then, we identify the driver nodes, essential for overall network control, i.e., the key proteins on which external stimulation may be optimally delivered to control network behavior. Our structural controllability analysis results show that the driver nodes commonly identified across databases match with known endoplasmic reticulum stress sensors. This potentially confirms that the theoretically identified drivers correspond to the biological key proteins associated with fundamental cellular activities and diseases. In conclusion, we prove that structural controllability is a reliable quantitative tool to investigate biological signaling pathways, and it can be potentially applied to networks more complex and less explored than Unfolded Protein Response.
keywords:
minimum driver nodes , protein-protein interactions , complex networks , endoplasmic reticulum stress , biological networks[inst1]organization=Engineering Department, Campus Bio-Medico University, addressline=Via Álvaro del Portillo, 21, city=Rome, postcode=00128, country=Italy
[inst2]organization=Center for Life Nano- & Neuro-Science, Istituto Italiano di Tecnologia, addressline=Viale Regina Elena, 291, city=Rome, postcode=00161, country=Italy
[inst3]organization=Jane and John Justin Institute for Mind Health Neurosciences Center, Cook Children Health Care System, addressline=1500 Cooper St., city=Fort Worth, postcode=76104, state=Texas, country=USA
[inst4]organization=Department of Bioengineering, The University of Texas at Arlington, addressline=701 Nedderman Drive St., city=Arlington, postcode=76019, state=Texas, country=USA
[inst5]organization=National Institute of Optics, National Research Council, addressline=Largo Enrico Fermi, 6, city=Florence, postcode=50125, country=Italy
[inst6]organization=International Center for Relativistic Astrophysics Network, addressline=Piazza della Repubblica, 10, city=Pescara, postcode=65122, country=Italy
1 Introduction
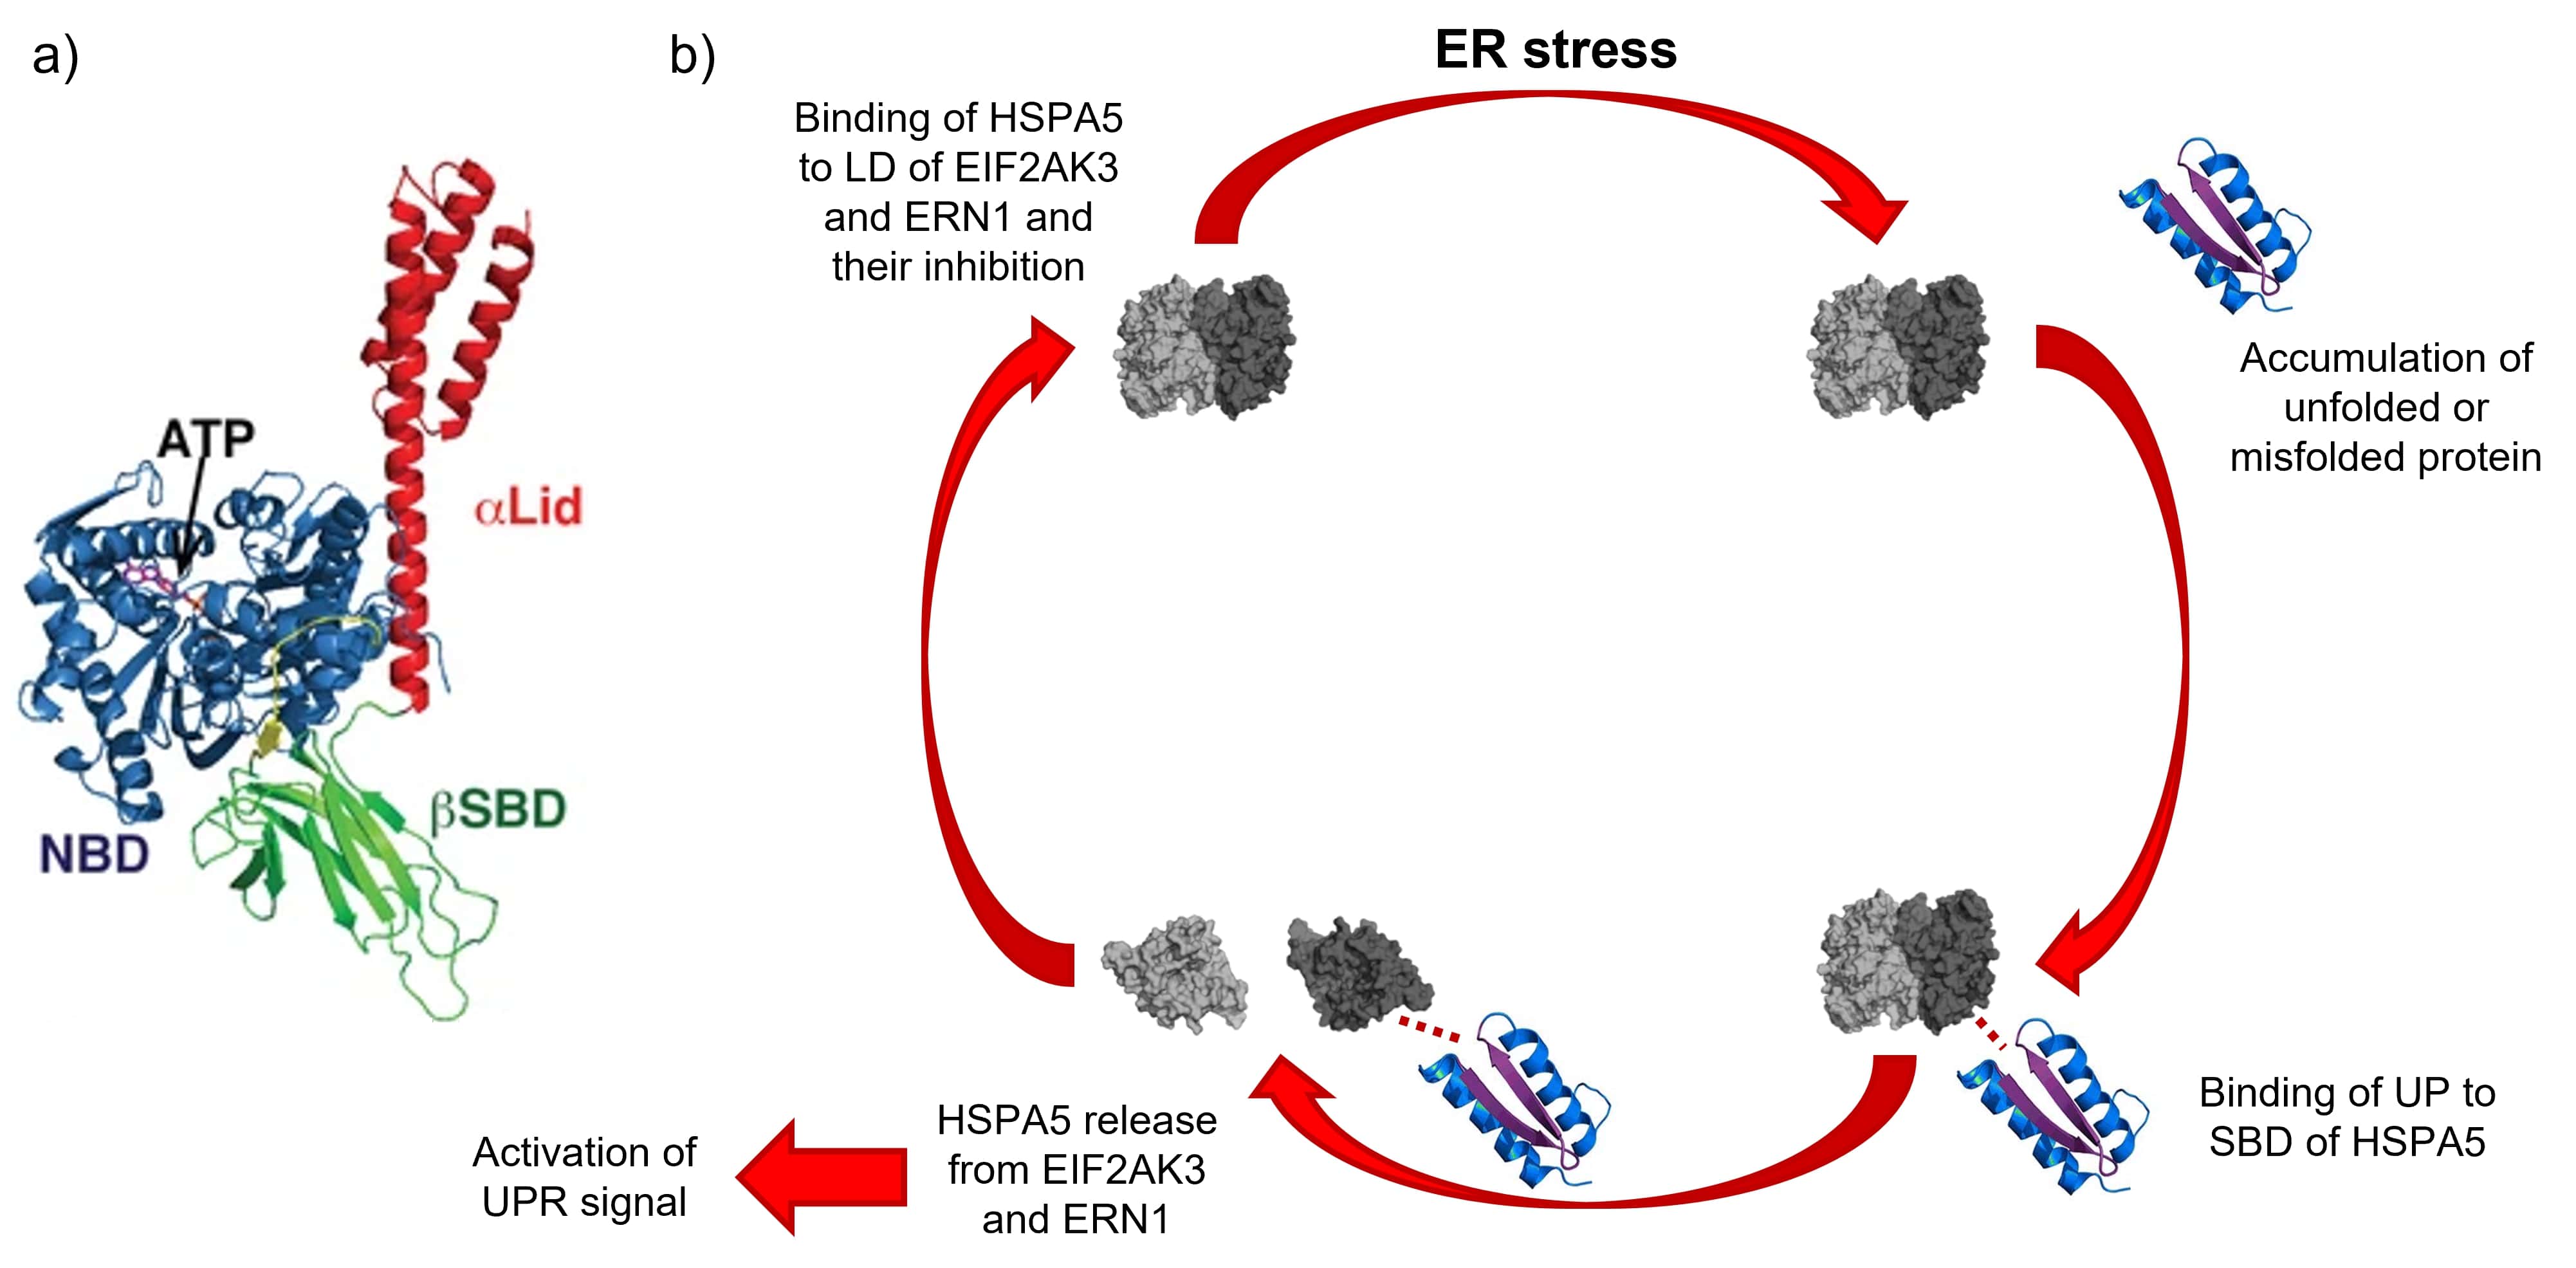
The Unfolded Protein Response (UPR) is a dynamic network of signaling processes in eukaryotic cells that adapts to various input signals. Activation of the UPR under endoplasmic reticulum (ER) stress conditions results in an adaptive response that prevents the increase of unfolded proteins via numerous pro-survival mechanisms, whose alterations may result in the formation of unfolded or misfolded proteins. This condition triggers the UPR, the adaptive process able to restore and maintain the cell’s functions [1, 2, 3, 4, 5, 6, 7].
Binding immunoglobulin protein (BiP), also known as heat shock 70 kDa protein 5 (HSPA5), a molecular chaperone located in the ER lumen, is forced to dissociate from the luminal domain (LD) of the three ER stress transducers after the accumulation of unfolded or misfolded proteins. Therefore, HSPA5 triggers the dimerization of the ER stress sensors, and hence the activation of the cascading signaling pathways. As a result, the stress response begins with HSPA5 conveying the presence of unfolded proteins to the ER stress sensors; hence, HSPA5 can be regarded as the primary sensor that acts in the activation of UPR [8, 9, 10].
If the UPR adaptive response to ER stress fails to restore cell’s homeostasis due to a persistent accumulation of unfolded proteins, the signaling program continues, and the ER stress sensors EIF2AK3 and ERN1 both drive multiple signaling outputs leading to apoptosis [13, 14, 15, 16, 17, 18, 19]; this signaling pathway is known as “terminal UPR”, and caspase enzymes play a central role in the transduction of ER apoptotic signals [20, 21].
The activation and malfunctioning of UPR actors appears to be directly involved in protein misfolding diseases, according to experimental findings. Indeed, ER stress mediators have been considered in the description of a variety of neurodegenerative disorders, including Alzheimer’s, Parkinson’s, and Huntington’s diseases, as well as prion and amyotrophic lateral sclerosis [22, 23, 24, 25].
Since it is possible to describe the UPR mechanism as a network, in which the proteins that take part in the stress response and consequent apoptosis are identified by the nodes, and the protein-protein interactions are identified as the edges that connect proteins in pairs, in this work we try to apply the control theory of complex network proposed by Liu et al. [26, 27], and based on Kalman’s criterion of controllability [28] for linear time-invariant systems (LTI). The state of a deterministic system, which is identified by the set of values of all the state variables (in the case of LTI systems, they are the state matrix and the control matrix or vector), completely describes the system at any time.
The basic assumption behind the controllability is that a dynamical system may be steered from its initial state to any desired final state in a limited amount of time with the proper combination of input signals. In the last decades, the controllability of directed and weighted networks has been widely employed for a wide range of complex networks, including biological networks related to some interesting mechanisms involving protein-protein interactions (PPI) [29, 30, 31, 32, 33, 34]. Lin [35] pioneered the concept of structural characteristics, which was later expanded by Shields and Pearson [36] and alternatively derived by Glover and Silverman [37].
In this framework, system parameters are either independent free variables or fixed zeros. This is consistent for physical systems’ models since parameter values related to nodes’ interactions are never known exactly, except for zero values indicating the absence of interactions. In the case of PPI dynamical systems, experimental parameter values can be stored in particular databases, which can then be referenced to reconstruct the interaction matrix to be regulated.
Here, we propose a controllability analysis of several Unfolded Protein Response network models based on existing literature. We investigate multiple UPR models because it is at present impossible to uniquely identify a complete model for the mechanism. Using biological information from various protein-protein interaction databases, we test the network models and evaluated node ranking scores. Depending on the investigated database, the stored information may be vastly diverse and insufficient. Therefore, we demonstrate that the identification of driver nodes is, to some extent, dependent on both the network and the used database.
2 Materials and Methods
Below we report the network models applied in this study, followed by the structural controllability and the minimum driver nodes methods, the network topological characterization, and lastly the statistical tools used to characterize the network analysis results.
2.1 Network Models
Based on existing literature regarding UPR interactomes, we build different human Unfolded Protein Response networks, including both UPR [38, 1, 39, 40, 41, 42, 43, 44, 45, 46, 5, 47, 4, 48, 16, 49, 50, 51, 52, 53, 54, 55, 56, 57, 58, 59, 60] and apoptosis [61, 62, 63, 64, 65, 66, 67, 68, 69, 70, 71, 72, 73, 74, 75, 76, 77, 78, 79, 80, 81, 82, 83, 84, 85, 56] pathways. We use text mining to reconstruct reliable networks with directional connections, because the protein-protein interactions involved in the in the URP and apoptosis pathways are not fully understood. We investigate the following networks: (i) 10 nodes (N10); (ii) 15 nodes (N15); (iii) network from Kalathur et al. [86] (N26); and (iv) UPR + apoptosis network (N34). The N34 contains N15 which includes N10, while N26 shares 13 nodes with N34.
We select and compare the following 4 protein-protein interaction databases to build and analyze the network models [87, 88], including direction and weight of each connection: (i) GPS-Prot (GPS; http://gpsprot.org) [89]; (ii) Mentha (Men; https://mentha.uniroma2.it/index.php) [90]; (iii) Signor 3.0 (Sig; https://signor.uniroma2.it/) [91]; and (iv) String (Str; https://string-db.org/) [92, 93]. We use the BioGRID database (https://thebiogrid.org/) [94] to add information on the direction of interactions which is occasionally unavailable from some of the selected databases. Moreover, we build refined networks models by recovering directly information from literature. These models are referred here as reference models (abbreviated in mrf). Hence, here we investigate a total of 19 network models. Each model is uniquely identified with a name containing the number of nodes and the interaction source (e.g. N10GPS, N15mrf).
UPR 10 Nodes Network - N10
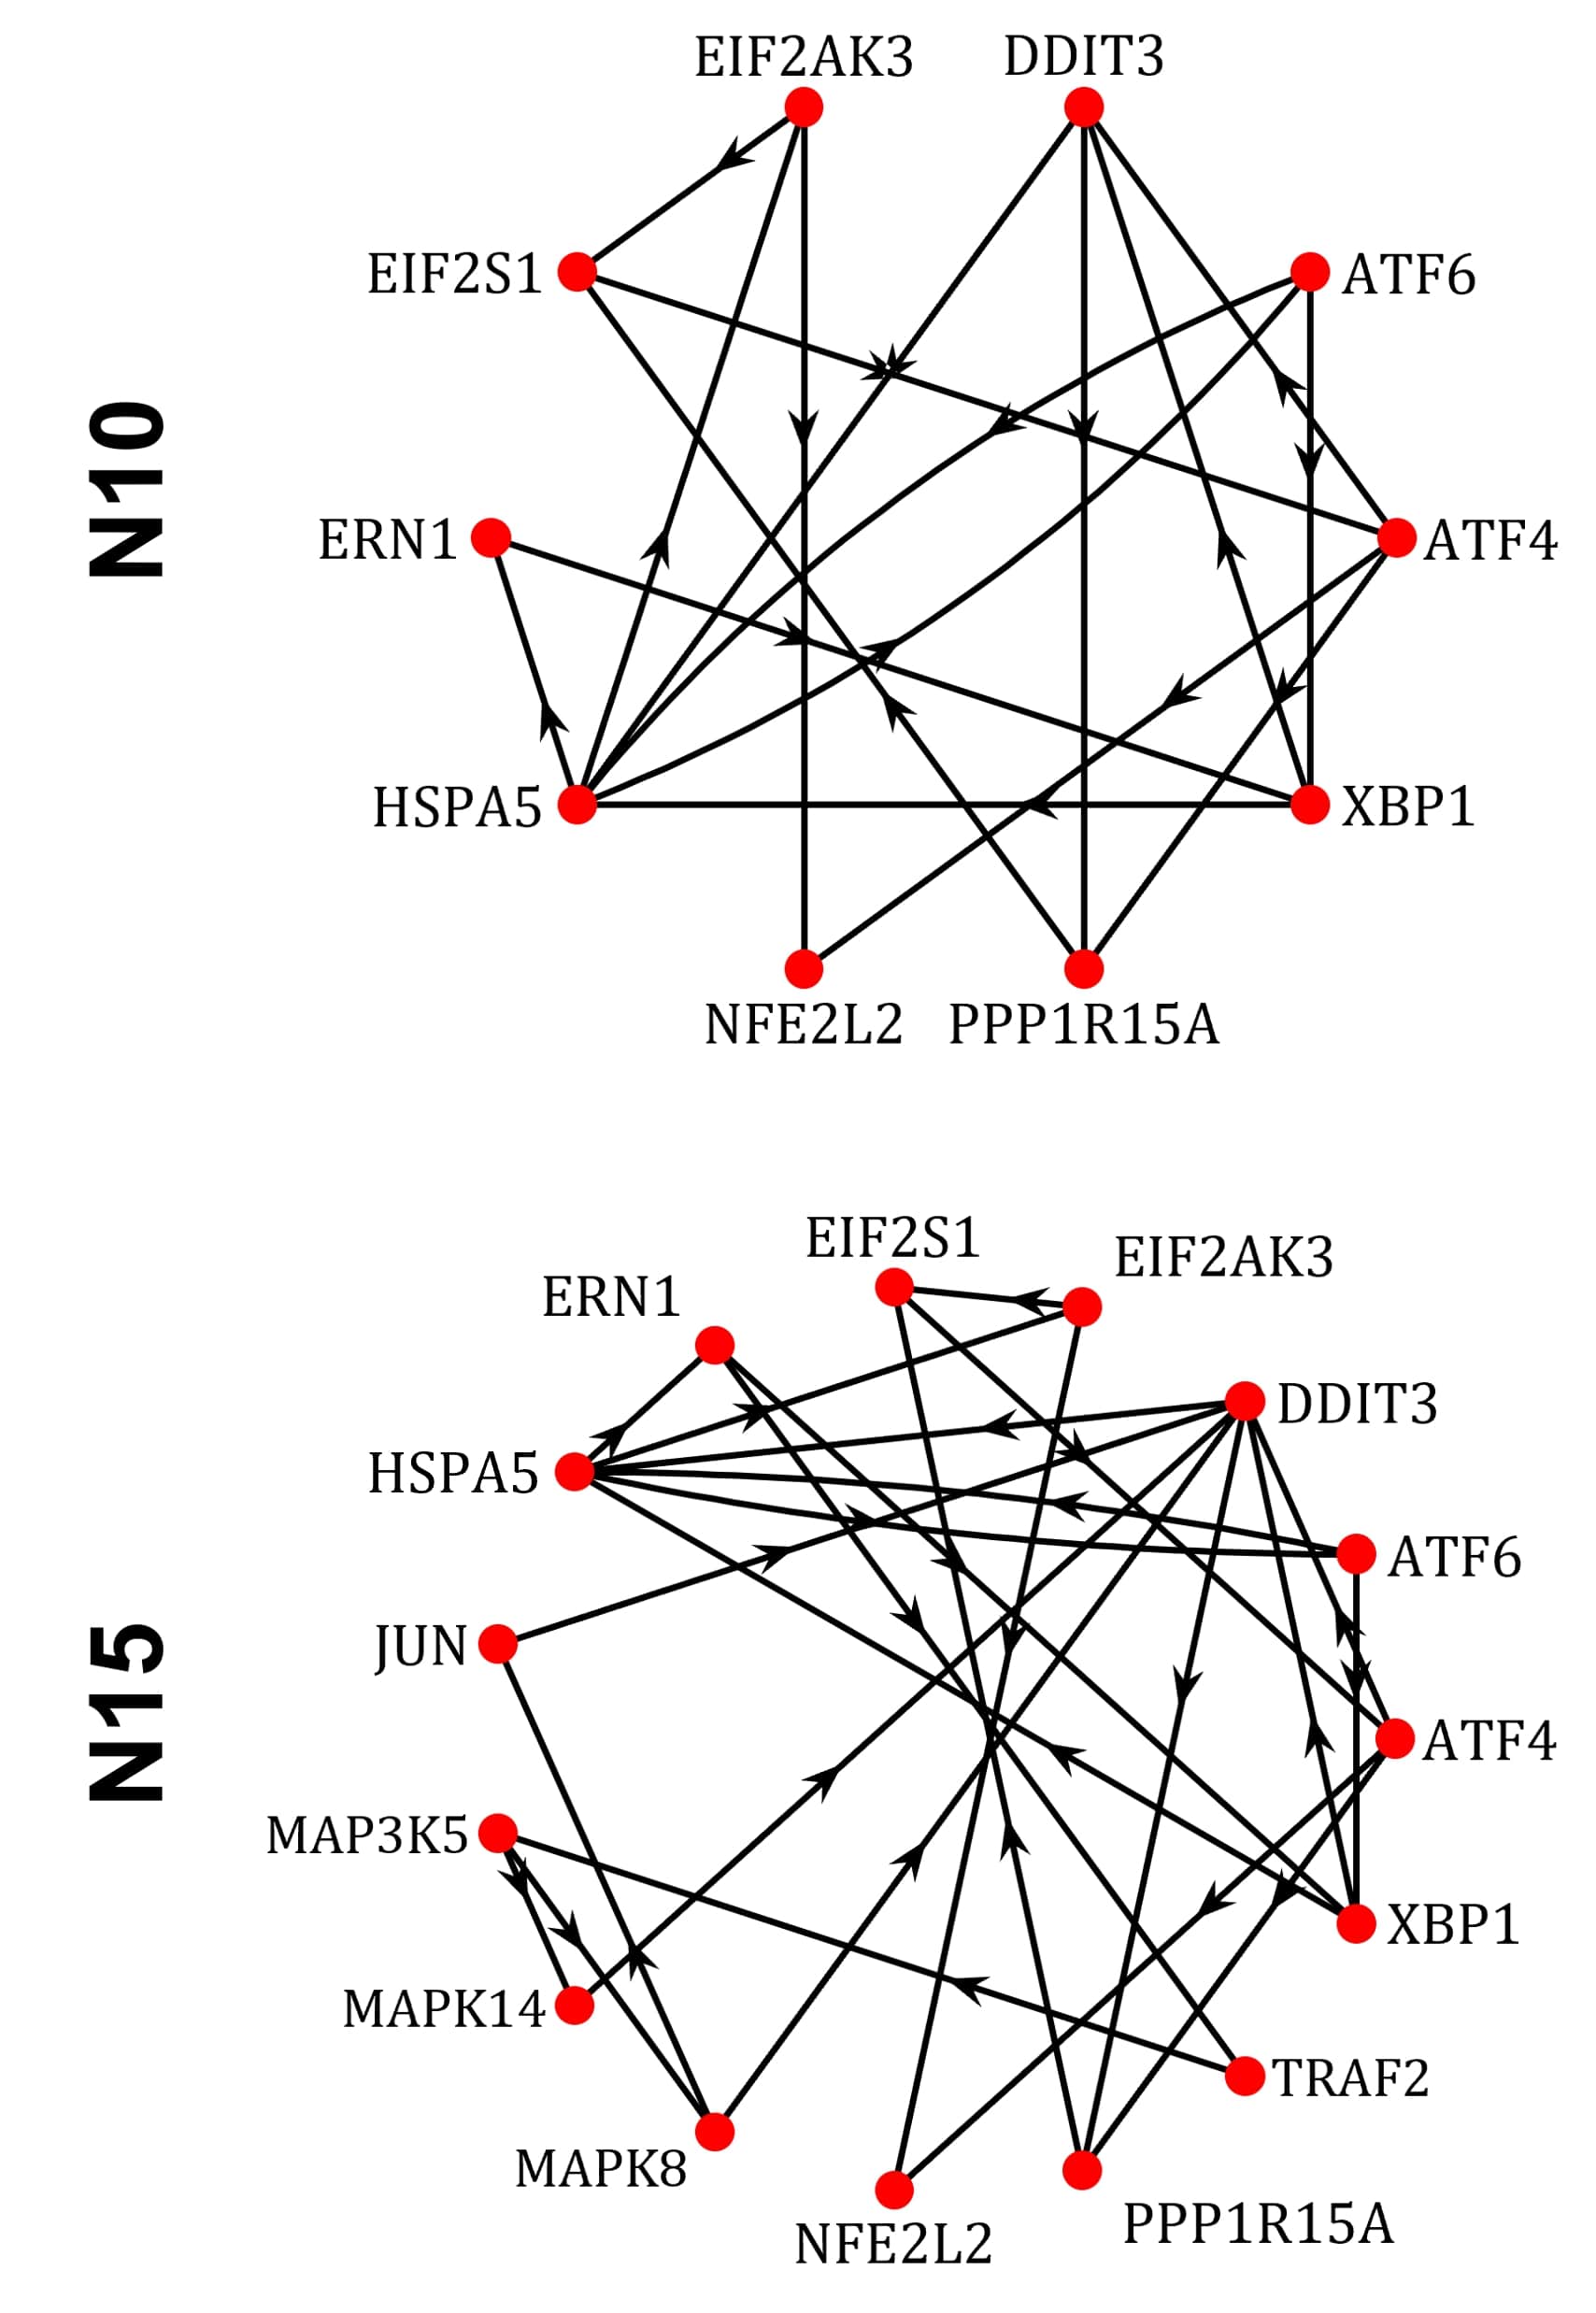
The first explored network is the simplest one capable of describing the UPR, and it is formed by integrating the three primary pathways involved in the ER’s stress response. The proteins included as network nodes are: eukaryotic translation initiation factor 2-alpha kinase 3 (EIF2AK3), activating transcription factor 6 (ATF6), inositol-requiring enzyme 1 (ERN1), heat shock 70 kDa protein 5 (HSPA5), eukaryotic translation initiation factor 2 subunit 1 (EIF2S1), activating transcription factor 4 (ATF4), nuclear factor erythroid-derived 2-like 2 (NFE2L2), x-box binding protein 1 (XBP1), DNA damage-inducible transcript 3 (DDIT3), and protein phosphatase 1 regulatory subunit 15A (PPP1R15A). We report in Fig. 2 the N10mrf network model in graph representation, where the nodes are identified by red circles, and edges by directed black lines.
UPR 15 Nodes Network - N15
N15 has five more proteins than N10 that are involved in the three main pathways of the stress response, namely: TNF receptor-associated factor 2 (TRAF2), mitogen-activated protein kinase 5 (MAP3K5), mitogen-activated protein kinase 8 (MAPK8), mitogen-activated protein kinase 14 (MAPK14), and transcription factor Jun (JUN). We report in Fig. 2 the N15mrf network model in graph representation, as in the previous case.
Kalathur’s Network - N26
The N26 network is built based on the UPR model proposed by Kalathur and colleagues (2012). The full list of nodes includes (see Tab. 1 and Fig. 5 of Ref. [86]): ATF4, ATF6, ATF6B, BAK1, BCL6, COPS5, CREB3L3, DDIT3, DNAJC3, EIF2AK3, EIF2S1, ERN1, GTF2I, GTPBP2, HSP90AA1, HSP90B1, HSPA5, MAP3K5, NFE2L2, NFYC, PPP1R15A, PSEN1, SRF, TAOK3, XBP1, and YY1. The interactome for EIF2AK3, ATF6, ERN1, and ATF4 is built using the Unified Human Interactome (UniHI) database (www.unihi.org) [96].
UPR + Apoptosis Network Model - N34
For a reliable complete model of UPR coupled to the apoptosis pathway, we build a network including information references [38, 1, 39, 40, 41, 42, 43, 44, 45, 46, 5, 47, 4, 48, 16, 49, 50, 51, 52, 53, 54, 55, 56, 57, 58, 59, 60, 61, 62, 63, 64, 65, 66, 67, 68, 69, 70, 71, 72, 73, 74, 75, 76, 77, 78, 79, 80, 81, 82, 83, 84, 85, 56]. Starting from N15, the N34 network has 19 more proteins, i.e. ATF6B, BAG5, BAK1, BAX, BBC3, BCL2, BCL2L11, BID, CASP1, CASP2, CASP8, IL1B, MAP2K7, MCL1, PMAIP1, TNFRSF10A, TNFRSF10B, TP53 and TXNIP.
Ranking Scores Selection
For each network, we perform all the analyses discarding the self-loop interactions included in GPS-Prot, Signor, and Mentha databases. We choose this approach because the inclusion of self-loop interactions could affected the nodes’ ranking scores. However, String DB assigns different weights to different categories [i.e., text-mining, co-expression (CE), experimentally determined interactions (EXP), theoretical interactions (DB), homology (HOMOL), and so on]; thus, we reconstruct the total interaction weights using a weighted combination of CE, EXP, DB and HOMOL, with the following formula:
| (1) |
2.2 Methodological Approach
Structural Controllability
Using the four separate PPI databases for each of the four investigated networks, we employ the structural controllability theory to assess the nodes’ ranking using the Kalman’s rank condition for continuous linear time-invariant systems. Here, we provide a brief summary of the applied theory and redirect the reader to the original references for the complete theory. Generally, a linear differential equation can be used to describe the time-evolution of a network system consisting of N nodes, with M (M N) input signals acting on different nodes:
| (2) |
where x = { , , …, } is the state vector, u = { , , …, } is the input/control vector, A is a NN matrix representing the state matrix, and B is a NM matrix representing the input/control matrix. In A, each element identifies the interaction between two nodes,
| (3) |
Elements of A can be either 0 or 1, otherwise 0 or k . In the first case, the matrix is called adjacency matrix, and 1 identifies the presence of an interaction; in the second case, the matrix contains the biological information, extracted from databases, with a specific weight assigned for each interaction.
In B, each element is the input signal acting on that node, and its form is
| (4) |
where {} are the vectors of the canonical base. The dimensionality of B (i.e., M) depends on the number of input signals acting on the network.
Given A and B, it is possible to assemble the controllability matrix, identified by C:
| (5) |
If the controllability matrix has a full rank, i.e., rank N, the network is fully controllable.
Minimum Driver Nodes Identification
The Minimum Driver Nodes (MDN) algorithm proposed by Liu et al. [26], based on the minimal set of input signals required to fully control the network, and the MDN selection algorithm used by Zhang et al. [97], can be used to rank the nodes and then identify the driver nodes — the nodes on which an input signal must be injected to obtain full control of the network. For each of the N nodes composing the network, the controllability matrix Ci is evaluated as
| (6) |
where Bi = ei, i = 1, …, N. The nodes ranking scores are calculated as the rank of the controllability matrices Ci. The minimum set of driver nodes (i.e., the number of input signals) is assessed by diagonalizing the state matrix, and by solving the formula
| (7) |
where is the eigenvalues of A, is the eigenvalue of A with the highest geometric multiplicity, which also identifies the minimum number of driver nodes, and is the NN identity matrix.
For small networks, it is possible to precisely identify the set of MDN using an iterative process [97]. Starting from the node with the highest ranking’s score value and updating the input matrix B, the goal is to iteratively calculate the difference between the ranks of the controllability matrix including the input signal on an ith node and the controllability matrix without the input signal:
| (8) |
If Ri is bigger than 0, the node is a driver node. The calculation continues until the number of MDN is reached, and at each iteration Bnew = [Bold, enewDN]. In this specific application, the degree of the various networks, i.e. the number of involved nodes, is quite small; thus, the computational time is reasonable and, for example, the estimation time for the identification of DN for a set of about 10 nodes is few minutes.
Analysis of Topological Differences between Network Models
Recently, Ruan and colleagues [98] proposed a methodology for detecting interaction patterns in two-network comparisons. The algorithm relies on the Generalised Hamming Distance (GHD), which can be used for assigning the degree of topological difference between networks, and evaluating its statistical significance. Also, Mall et al. [99] showed that the GHD statistic is more robust than other common topological measures, such as the Mean Absolute Difference (MAD) or the Quadratic Assignment Procedure (QAD). The GHD is thus a way to estimate the distance between two graphs and the lower the distance value, the lower the degree of topological difference between networks.
If we consider two different networks, labeled U and V, with the same number of nodes (N), we can calculate the distance dGHD between the two networks as follows:
| (9) |
where and are mean centered edge-weights defined respectively as
| (10) |
The edge weights and depend on the topology of the network and provide a measure of connectivity between every pair of ith and jth nodes in U and V, respectively.
To assess whether the biological data stored in the reviewed PPI databases differ from each other, we apply the GHD theory to each of our network models. Because the databases scores are assigned differently from database to database, it is only significant to compare the presence of pair interactions or not. As a quantitative test of information stored in databases, we evaluate the topological distance between our three reference models and each model obtained with the examined databases. In our case, lower values for the distance represent a greater consistency in the information between the literature and the databases.
Statistical Analysis of Network Models
The implementation of structural controllability, the MDN finder and the GHD algorithm are performed using Pyhton 3.9 [100]. The statistical and graph analysis are performed using MATLAB R2022a (The MathWorks, Inc.) [101]. The one-sample Kolmogorov-Smirnov test is used to determine the normality of the ranking score distributions for each UPR model. We apply non-parametric tests because our variables are not normally distributed. For paired comparisons between two given ranking scores across different databases considering one specific network, we use the Wilcoxon signed-rank test, and for non-paired comparisons between ranking score vectors across different networks considering one specific database, we use the Wilcoxon rank-sum test. If , the results are regarded statistically significant. The Kruskal-Wallis test is used to evaluate multiple ranking score data vectors. If , the results are regarded statistically significant. Finally, we report each ranking score distribution as a median and an IQR (between 25% and 75% percentile).
3 Results
3.1 Structural controllability and topological analysis
N10 UPR Network Models
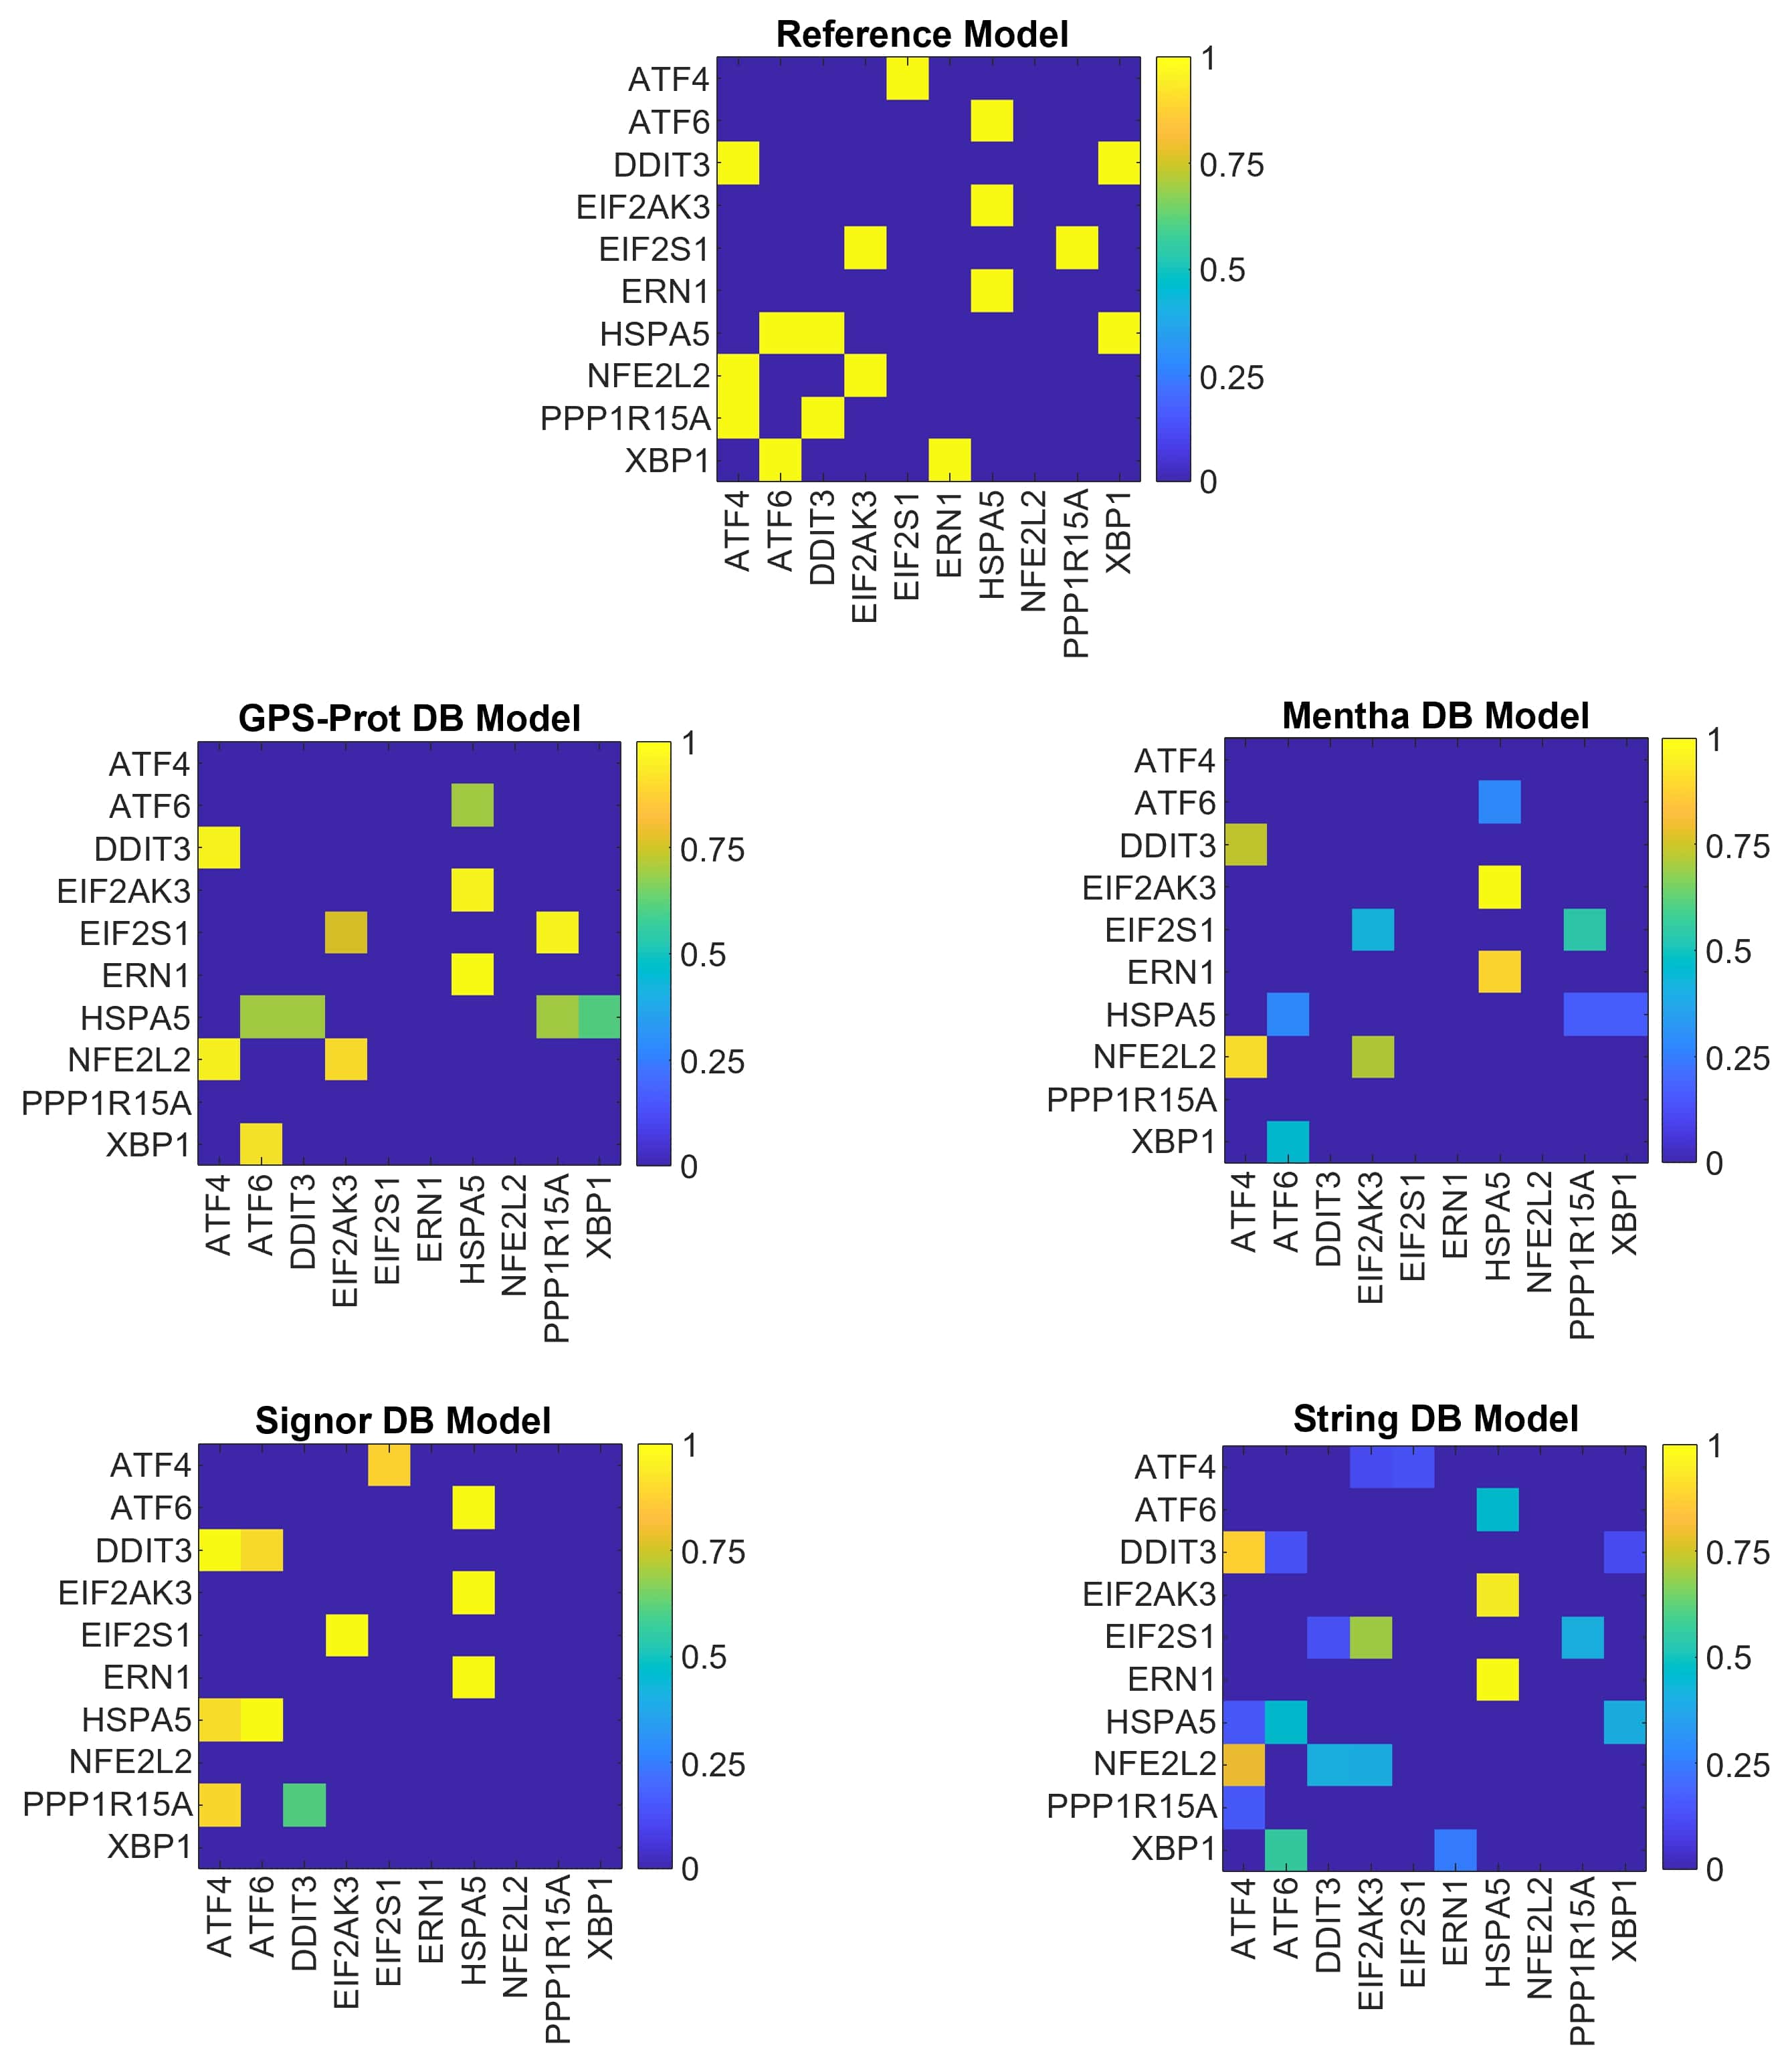
We show the graphical representations of the N10 networks in Fig. 3, the nodes ranking scores and the number of MDN obtained for each model in Tab. 1. In Tab. 2, we report the MDN set for the five models of N10. Both weighted interactions and adjacency networks are used, to estimate the effect of biological information contained in the weighted interactions to properly describe the overall network behaviour.
Adjacency matrix (weighted matrix)
Node
Reference
GPS-Prot
Mentha
Signor
String
ATF4
7 (-)
5 (5)
2 (2)
4 (5)
6 (6)
ATF6
9 (-)
5 (5)
5 (5)
6 (7)
8 (9)
DDIT3
8 (-)
4 (4)
1 (1)
2 (2)
8 (8)
EIF2AK3
9 (-)
2 (2)
2 (2)
6 (7)
8 (8)
EIF2S1
7 (-)
1 (1)
1 (1)
5 (6)
6 (7)
ERN1
9 (-)
1 (1)
1 (1)
1 (1)
8 (9)
HSPA5
8 (-)
3 (3)
3 (3)
6 (6)
8 (8)
NFE2L2
1 (-)
1 (1)
1 (1)
1 (1)
1 (1)
PPP1R15A
8 (-)
5 (5)
5 (5)
1 (1)
7 (8)
XBP1
8 (-)
4 (4)
4 (4)
1 (1)
7 (8)
Eigenvalue
Reference
GPS-Prot
Mentha
Signor
String
0
2 (-)
4 (4)
4 (4)
5 (4)
3 (2)
| Model | MDN set (adj.) | MDN set (weight.) |
|---|---|---|
| N10mrf | 2: ATF6, EIF2AK3 | - |
| N10GPS | 4: ATF4, ATF6, EIF2AK3, PPP1R15A | 4: ATF4, ATF6, EIF2AK3, PPP1R15A |
| N10Men | 4: ATF4, ATF6, EIF2AK3, PPP1R15A | 4: ATF4, ATF6, EIF2AK3, PPP1R15A |
| N10Sig | 5: ATF4, ATF6, EIF2AK3, NFE2L2, XBP1 | 4: ATF6, EIF2AK3, NFE2L2, XBP1 |
| N10Str | 3: ATF6, EIF2AK3, ERN1 | 2: ATF6, ERN1 |
For GPS-Prot and Mentha DB models we find the same number of driver nodes for both adjacency and weighted networks (Tab. 1). This result may be interpreted as the number of active interactions of a high-ranked node being essential in predicting whether it can be a driving node or not. Two of the ER stress sensors, ATF6 and EIF2AK3, are identified as driver nodes in all databases. These findings are in agreement with the MDN set obtained using the reference model, for which we find two of the ER stress sensors as driver nodes. Still, we can expect that the number of driver nodes would be different because some of the information in N10mrf are not present in databases, while other interactions, absent in the literature, are found. For Signor DB, there is no stored information on possible NFE2L2 and XBP1 interactions during the UPR mechanism (Fig. 3 - blue rows and columns - and the ranking scores equal to 1 in Tab. 1.
In Tab. 3, we report the dGHD for the topological comparison of all the possible networks pair. The MDN sets results are confirmed by the topological distance results, since the two closest models are the ones derived from the GPS-Prot and Mentha DBs. Thus, the information stored in these two databases is comparable and generated the same set of driver nodes. Finally, when we sort the distances of all the models from the reference (Tab. 3 2nd column), we confirm that GPS-Prot stores more information than the others databases for defining the N10 (i.e. it had the minimum dGHD), whereas Signor is less informative (i.e. it shows the maximum dGHD).
dGHD (adjacency matrix)
Model
N10mrf
N10GPS
N10Men
N10Sig
N10Str
N10mrf
-
0.065
0.075
0.107
0.077
N10GPS
0.065
-
0.011
0.133
0.117
N10Men
0.075
0.011
-
0.122
0.104
N10Sig
0.107
0.133
0.122
-
0.113
N10Str
0.077
0.117
0.104
0.113
-
N15 UPR Network Models
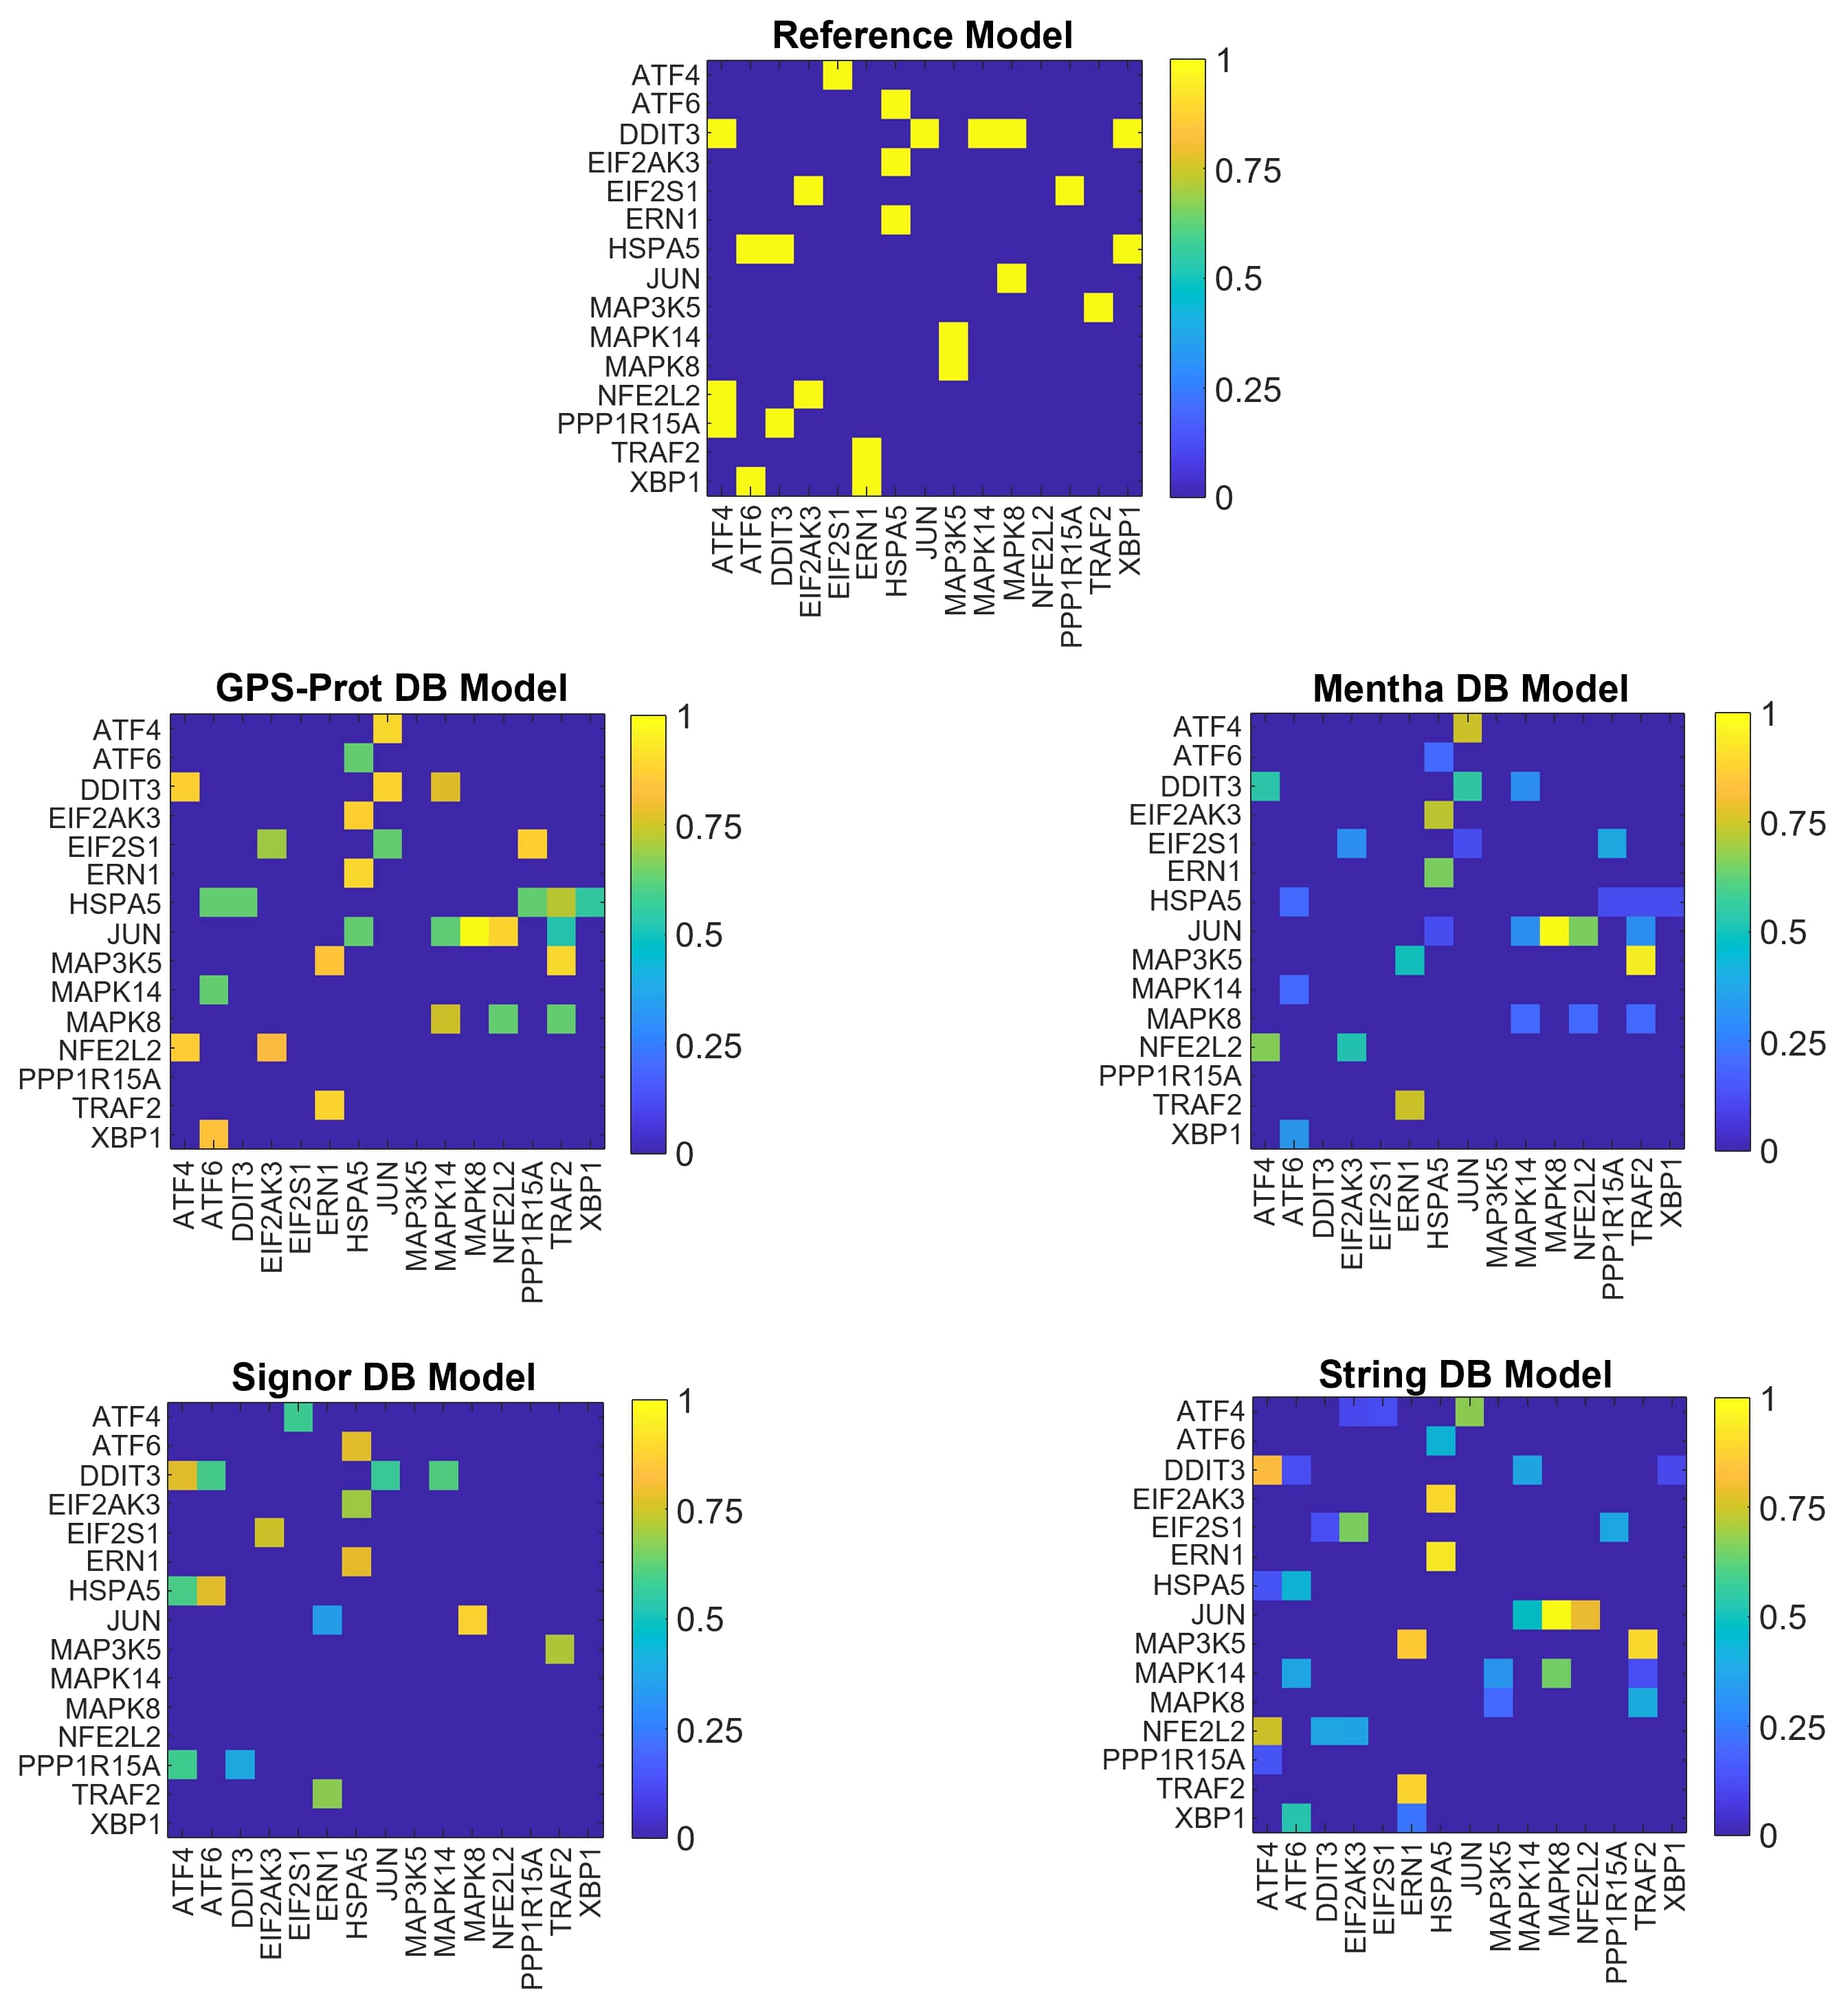
As for the N10 network models, we show the graphical representations of the N15 networks in Fig. 4, the nodes ranking scores and the MDN sets obtained for each model in Tabs. 4 and 5. In this case, we exclude String model from the analysis because the eigenvalue with the highest geometric multiplicity is not an integer value (see Tab. 5).
The N15 models are different from the N10 ones mostly due to the additional nodes and thus the introduction of new interactions also for the nodes already present in N10. The nodes’ ranking (Tab. 4) identifies more driver nodes candidates than in N10 and in this case GPS-Prot, Mentha and Signor give similar results for the adjacency and weighted matrices.
The N15 MDN sets (Tab. 5) also differ from the N10 ones (Tab. 2). All the possible explanations of obtained results are discussed in Sec. 4.
In Tab. 6, we report the dGHD. The model closest to N15mrf is N15Sig. We find that the closest pair is N15GPS - N15Men that, as for N10 network, are the most distant models to the reference.
Adjacency matrix (weighted matrix)
Node
Reference
GPS-Prot
Mentha
Signor
String
ATF4
10 (-)
9 (9)
5 (5)
6 (6)
10 (10)
ATF6
13 (-)
11 (11)
10 (10)
6 (6)
13 (13)
DDIT3
10 (-)
9 (5)
1 (1)
2 (2)
10 (10)
EIF2AK3
12 (-)
10 (10)
6 (6)
8 (8)
11 (12)
EIF2S1
10 (-)
1 (1)
1 (1)
7 (7)
11 (11)
ERN1
13 (-)
11 (11)
10 (10)
4 (4)
13 (13)
HSPA5
11 (-)
8 (8)
8 (8)
6 (6)
12 (12)
JUN
10 (-)
8 (8)
4 (4)
3 (3)
10 (10)
MAP3K5
11 (-)
1 (1)
1 (1)
1 (1)
11 (11)
MAPK14
11 (-)
10 (10)
6 (6)
3 (3)
10 (10)
MAPK8
11 (-)
8 (8)
4 (4)
4 (4)
10 (10)
NFE2L2
1 (-)
9 (9)
5 (5)
1 (1)
11 (11)
PPP1R15A
11 (-)
10 (10)
9 (9)
1 (1)
12 (12)
TRAF2
12 (-)
10 (10)
9 (9)
2 (2)
12 (12)
XBP1
12 (-)
9 (9)
9 (9)
1 (1)
11 (11)
Eigenvalue
Reference
GPS-Prot
Mentha
Signor
String
0
3 (-)
4 (4)
4 (4)
6 (4)
- (-)
j, 0
- (-)
- (-)
- (-)
- (-)
3 (3)
| Model | MDN set (adj.) | MDN set (weight.) |
|---|---|---|
| N15mrf | 3: ATF6, ERN1, MAPK14 | - |
| N15GPS | 4: ATF6, ERN1, MAPK14, PPP1R15A | 4: ATF6, ERN1, MAPK14, PPP1R15A |
| N15Men | 4: ATF6, ERN1, MAPK14, PPP1R15A | 4: ATF6, ERN1, MAPK14, PPP1R15A |
| N15Sig | 6: ATF6, EIF2AK3, MAPK14, MAPK8, NFE2L2, XBP1 | 6: ATF6, EIF2AK3, MAPK14, MAPK8, NFE2L2, XBP1 |
dGHD (adjacency matrix)
Model
N15mrf
N15GPS
N15Men
N15Sig
N15Str
N15mrf
-
0.099
0.104
0.065
0.084
N15GPS
0.099
-
0.005
0.115
0.109
N15Men
0.104
0.005
-
0.111
0.104
N15Sig
0.065
0.115
0.111
-
0.099
N15Str
0.084
0.109
0.104
0.099
-
N26 UPR Network Models
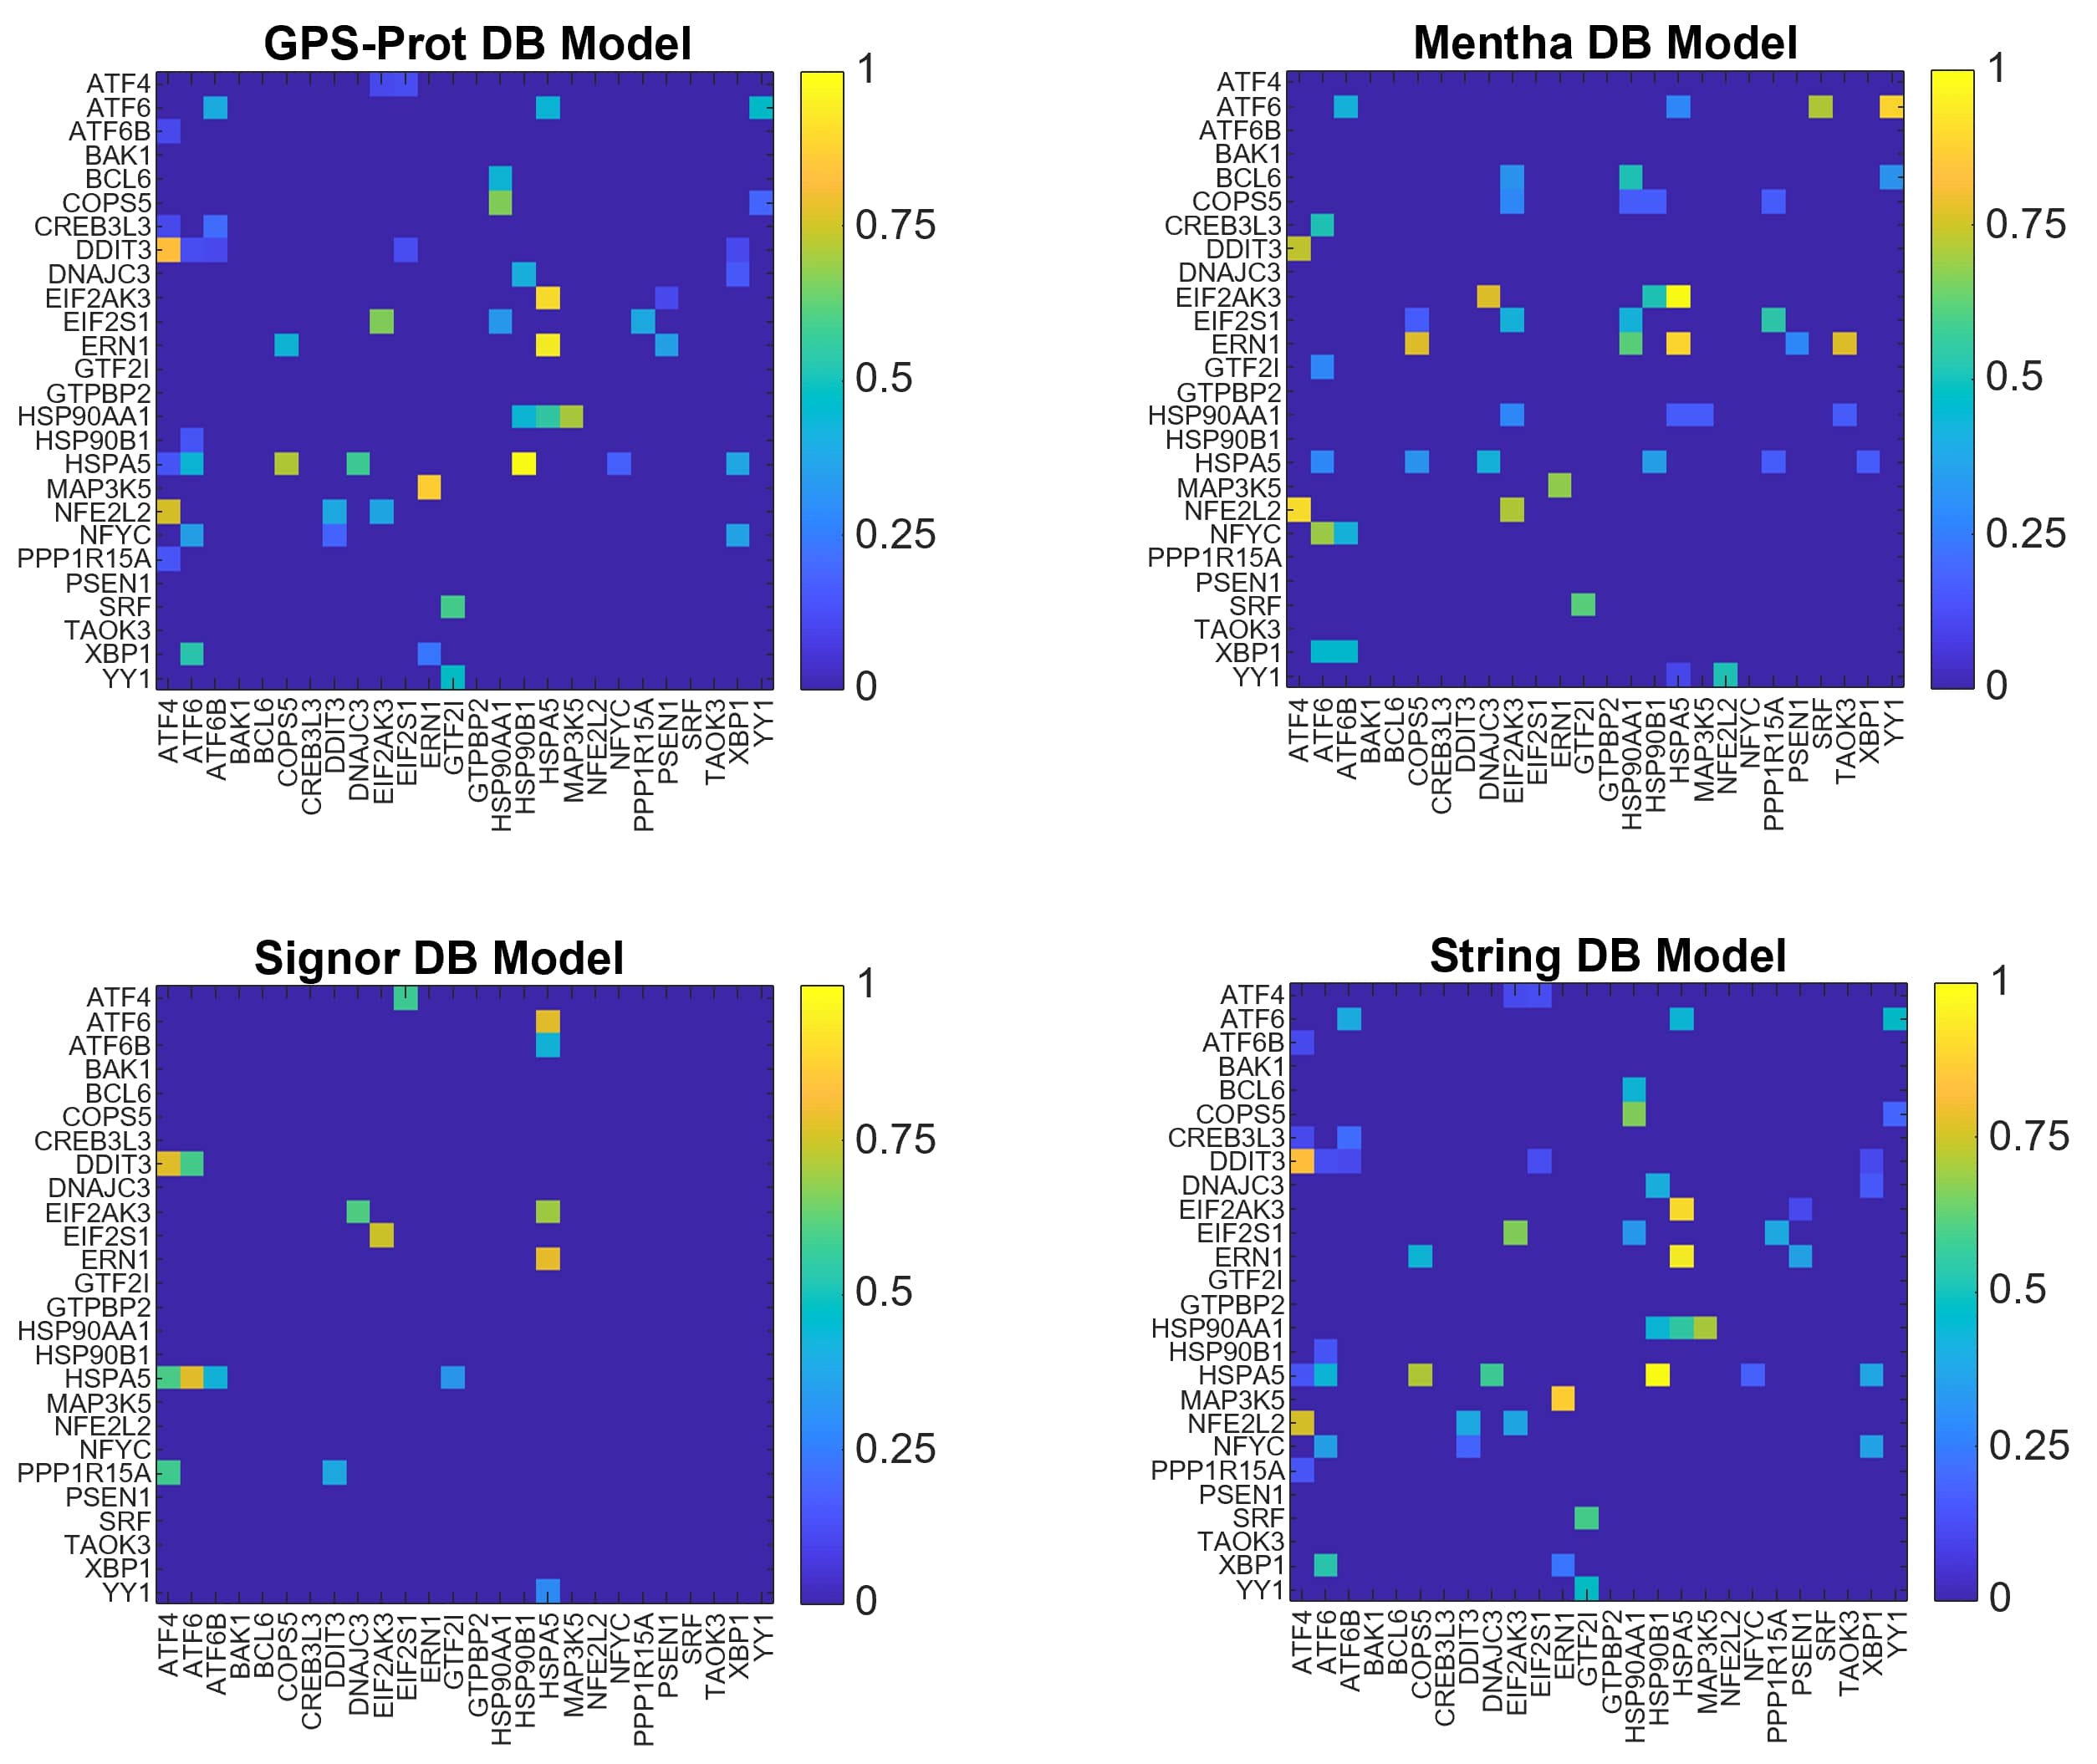
For N26, we show the graphical representations of the multiple network models in Fig. 5, the nodes ranking scores and the MDN sets obtained for each model in Tab. 7. Interestingly, the MDN sets for these networks are composed by an high number of proteins, compared to the previous cases (lower panel of Tab. 7). This finding may be explained considering that, for most of the nodes composing the N26 network, the biological information is lacking in the considered databases. With this respect, the representation of the adjacency network within Signor DB is quite explanatory, suggesting that Signor DB contains the lower quantity of information for this particular network.
Adjacency matrix (weighted matrix)
Node
GPS-Prot
Mentha
Signor
String
ATF4
13 (13)
13 (13)
5 (5)
14 (14)
ATF6
11 (11)
11 (11)
6 (7)
14 (14)
ATF6B
13 (13)
14 (14)
7 (7)
15 (15)
BAK1
12 (12)
1 (1)
1 (1)
1 (1)
BCL6
1 (1)
1 (1)
1 (1)
1 (1)
CPPS5
10 (10)
12 (12)
1 (1)
14 (14)
CREB3L3
1 (1)
1 (1)
1 (1)
1 (1)
DDIT3
12 (12)
1 (1)
2 (2)
14 (14)
DNAJC3
13 (13)
13 (13)
8 (8)
13 (14)
EIF2AK3
12 (12)
12 (12)
7 (7)
14 (14)
EIF2S1
11 (11)
1 (1)
6 (6)
14 (14)
ERN1
11 (11)
12 (12)
1 (1)
13 (13)
GTF2I
12 (12)
13 (13)
7 (7)
16 (16)
GTPBP2
1 (1)
1 (1)
1 (1)
1 (1)
HSP90AA1
10 (10)
10 (10)
1 (1)
14 (14)
HSP90B1
13 (13)
13 (13)
1 (1)
15 (15)
HSPA5
11 (11)
12 (12)
6 (6)
12 (13)
MAP3K5
10 (10)
11 (11)
1 (1)
15 (15)
NFE2L2
1 (1)
12 (12)
1 (1)
1 (1)
NFYC
1 (1)
1 (1)
1 (1)
13 (14)
PPP1R15A
12 (12)
13 (13)
1 (1)
15 (15)
PSEN1
12 (12)
13 (13)
1 (1)
15 (15)
SRF
12 (12)
12 (12)
1 (1)
1 (1)
TAOK3
12 (12)
13 (13)
1 (1)
1 (1)
XBP1
12 (12)
13 (13)
1 (1)
15 (15)
YY1
12 (12)
11 (11)
1 (1)
15 (15)
Eigenvalue
GPS-Prot
Mentha
Signor
String
0
11 (11)
11 (11)
19 (19)
8 (8)
Another possible explanation for the poor results obtained for N26 is related to the database [96] used by the authors to build the PPI network, that has not been updated since 2009 and is also, at present, inaccessible. Due to the high number of MDN, we do not identify the driver nodes because they may not be very significant. As it is not possible to reconstruct all the interactions as defined by the authors [86], we apply the theory for topological significance only on the models built on the four selected databases.
In Tab. 8, we report the pairwise dGHD for N26 newtork models.
As expected, the smallest value of the distance is obtained with GPS-Prot and Mentha DBs. Indeed, the ranking scores obtained with N26GPS and N26Men models (first two columns of Tab. 7) are quite similar, and the number of MDN (lower panel of Tab. 7) was the same. It is interesting to note the fact that all the other evaluated distances have more comparable values than what is obtained for the other models. This may be because the ratio of stored information is similar for each pair of DBs regarding the network built by Kalathur and colleagues.
dGHD (adjacency matrix)
Model
N26GPS
N26Men
N26Sig
N26Str
N15GPS
-
0.009
0.072
0.062
N15Men
0.009
-
0.069
0.066
N15Sig
0.072
0.069
-
0.067
N15Str
0.062
0.066
0.067
-
N34 UPR+Apoptosis Network Models
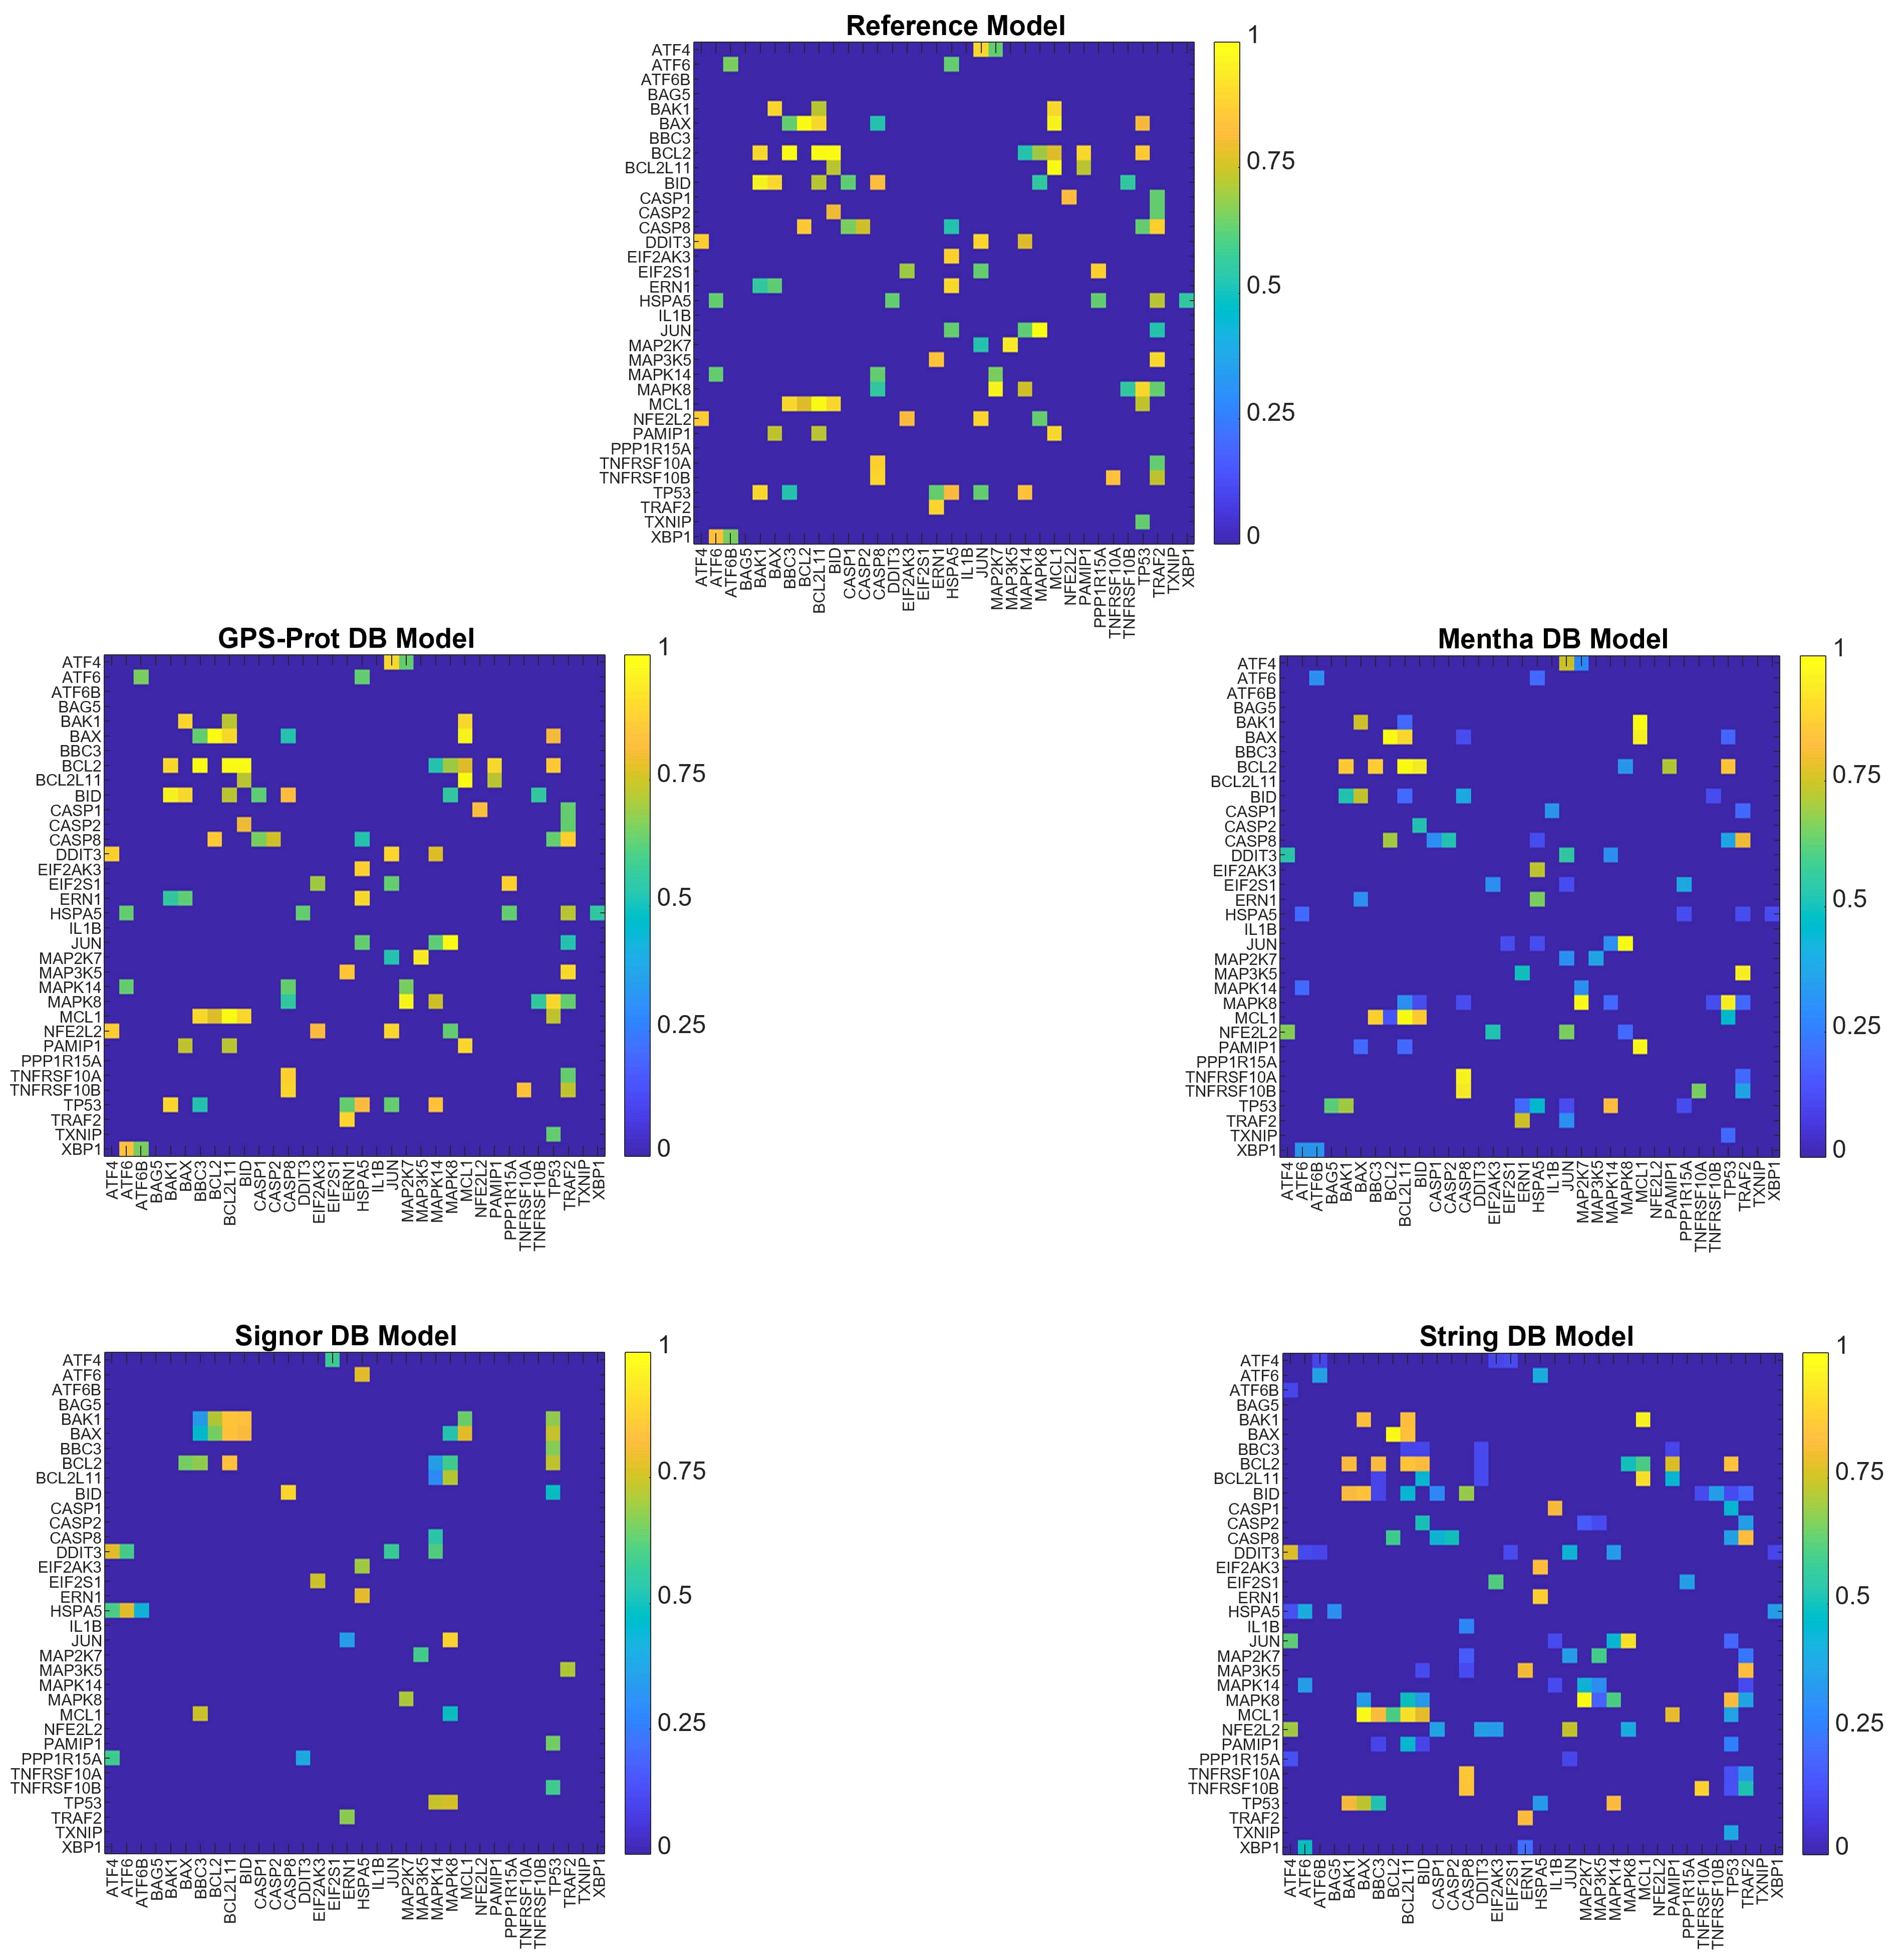
In Fig. 6, the graphical representations of N34 network models are shown. In Tabs. 9 and 10, the nodes ranking scores and the number of MDN obtained for each database are reported, to be compared with results obtained for N34mrf model.
As we can notice from Tab. 10, the dimension of MDN sets is very different across models, as already observed for N26 network models. Analogously, the lack of biological information affects the number of MDN for this network, in particular for N26Sig (see Tab. 8).
The number of MDN found with GPS-Prot, Mentha, and String DBs is instead small enough to apply the algorithm for the identification of driver nodes, obtaining meaningful results (Tab. 10).
These results are qualitatively quite different from what obtained for N10 and N15 networks, due to the new nodes and interactions.
At variance with the other investigate networks, the MDN sets obtained from adjacency and weighted networks differ, for the same model. This is because of the heterogeneity of connections’ weights respect to the total edges for a single node. In particular, with String DB we obtain two completely different MDN sets for the adjacency and weighted matrices, respectively, indicating the importance of the interaction scores in terms of biological information (see Tab. 10).
In Tab. 11, the pairwise dGHD for N34 network models are reported. As already observed for the other networks, the smallest value of the distance is obtained with (GPS-Prot, Mentha) DB models. Due to the increasing size of the analyzed networks, the distance values also increase (see Tab. 11). Indeed, increasing the number of nodes can entail the inclusion of interactions not present in N34rmf model. The same consideration holds for every pair of models.
Adjacency matrix (weighted matrix)
Node
Reference
GPS-Prot
Mentha
Signor
String
ATF4
4 (-)
6 (8)
12 (13)
2 (2)
4 (21)
ATF6
4 (-)
6 (6)
12 (13)
7 (22)
4 (21)
ATF6B
3 (-)
6 (8)
12 (13)
7 (23)
4 22
BAG5
3 (-)
1 (1)
1 (1)
6 (20)
5 (21)
BAK1
3 (-)
6 (1)
1 (1)
6 (20)
4 (16)
BAX
3 (-)
6 (3)
3 (3)
6 (19)
4 (16)
BBC3
3 (-)
6 (5)
4 (5)
6 (21)
4 (17)
BCL2
3 (-)
6 (2)
2 (2)
6 (19)
4 (16)
BCL2L11
3 (-)
6 (4)
2 (4)
6 (19)
4 (16)
BID
3 (-)
6 (4)
3 (4)
6 (19)
4 (16)
CASP1
3 (-)
6 (6)
1 (1)
6 (21)
4 (18)
CASP2
3 (-)
6 (6)
1 (1)
6 (21)
4 (18)
CASP8
3 (-)
6 (6)
4 (5)
6 (19)
4 (17)
DDIT3
3 (-)
6 (7)
2 (2)
1 (1)
4 (18)
EIF2AK3
7 (-)
7 (8)
14 (15)
8 (22)
4 22
EIF2S1
5 (-)
1 (1)
13 (14)
6 (20)
4 (20)
ERN1
3 (-)
6 (6)
10 (11)
6 (20)
5 (20)
HSPA5
4 (-)
6 (6)
11 (12)
6 (20)
4 (20)
IL1B
1 (-)
1 (1)
1 (1)
9 (22)
4 (19)
JUN
3 (-)
6 (6)
3 (3)
6 (19)
4 (18)
MAP2K7
4 (-)
6 (6)
7 (8)
6 (20)
4 (19)
MAP3K5
3 (-)
6 (8)
8 (9)
7 (21)
4 (19)
MAPK14
4 (-)
6 (6)
5 (7)
6 (20)
4 (18)
MAPK8
3 (-)
6 (6)
6 (7)
6 (20)
4 (18)
MCL1
3 (-)
6 (6)
3 (4)
6 (20)
4 (16)
NFE2L2
1 (-)
6 (8)
1 (1)
1 (1)
1 (1)
PMAIP1
3 (-)
6 (6)
1 (1)
6 (20)
4 (17)
PPP1R15A
7 (-)
6 (7)
1 (1)
6 (21)
5 (22)
TNFRSF10A
3 (-)
6 (7)
1 (1)
8 (20)
4 (19)
TNFRSF10B
3 (-)
6 (6)
1 (1)
6 (19)
4 (18)
TP53
3 (-)
6 (5)
4 (6)
6 (19)
4 (17)
TRAF2
3 (-)
6 (6)
9 (10)
6 (19)
4 (19)
TXNIP
4 (-)
1 (1)
1 (1)
1 (1)
1 (1)
XBP1
3 (-)
6 (7)
1 (1)
7 (21)
4 (21)
Eigenvalue
Reference
GPS-Prot
Mentha
Signor
String
0
6 (-)
6 (5)
7 (6)
17 (16)
3 (3)
| Model | MDN set (adj.) | MDN set (weight.) |
|---|---|---|
| N34rmf | 6: ATF6B, EIF2AK3, BBC3, MAP2K7, TNFRSF10, TXNIP | - |
| N34GPS | 6: ATF6B, BAG5, BAK1, BBC3, IL1B, PPP1R15A | 5: ATF6B, BAG5, BBC3, IL1B, PPP1R15A |
| N34Men | 7: ATF6B, BAG5, BAK1, BBC3, BCL2L11, IL1B, PPP1R15A | 6: ATF6B, ATF6, BAG5, BBC3, IL1B, PPP1R15A |
| N34Str | 3: BAG5, ERN1, PPP1R15A | 3: ATF6B, BAG5, EIF2AK3 |
dGHD (adjacency matrix)
Model
N34mrf
N34GPS
N34Men
N34Sig
N34Str
N34mrf
-
0.093
0.093
0.082
0.106
N34GPS
0.093
-
0.020
0.084
0.071
N34Men
0.093
0.020
-
0.081
0.070
N34Sig
0.082
0.084
0.081
-
0.099
N34Str
0.106
0.071
0.070
0.099
-
3.2 Statistical Analysis
We analyse the rank distributions for the reference model (first columns of Tabs. 1, 4 and 9), and the models obtained from each DB (other columns of Tabs. 1, 4, 7 and 9) to highlights statistically significant differences and analogies.
We calculate the median and the percentile range for all the scores distributions of each built model. Results are reported in Tab. 12. Obtained values show non-normal distributions of the ranking scores, a result that is statistically confirmed by the One-sample Kolmogorov-Smirnov test.
The values for the median and percentile range (Tab. 12) calculated for String DB model are similar to those obtained for the reference model, and larger than values for the other three DB models. This is observed for the two smallest networks, N10 and N15. N26Sig model produces a distribution of ranking scores very different from the other N26 UPR models. The high number of obtained nodes with ranking score of 1 can be related to the fact the biological information regarding possible paired interactions involving these nodes is lacking in the database. For N34, models from Signor and String DBs seem to be very sensitive to the inclusion of weighted interactions; the values of median and percentile range drastically increase by considering the weighted matrix. This is an interesting result, highlighting the importance, at increasing network size, of a detailed biological information for a proper ranking score distribution description. Results remain almost unchanged when inserting the weighted information for the other two DB models (N34GPS and N34Men), probably because the weights are higher for these databases.
Median and percentile range for adjacency matrix (weighted matrix)
N10mrf
N10GPS
N10Men
N10Sig
N10Str
8.0, [7, 9]
3.5, [1, 5]
2.0, [1, 4]
3.0, [1, 6]
8.0, [7, 8]
-
(3.5, [1, 5])
(2.0, [1, 4])
(3.0, [1, 6])
(7.5, [6, 8])
N15mrf
N15GPS
N15Men
N15Sig
N15Str
11.0, [10, 12]
9.0, [8, 10]
6.0, [4, 9]
3.0, [1.25, 6]
11.0, [10, 12]
-
(9.0, [8, 10])
(6.0, [4, 9])
(3.0, [1.25, 6])
(11.0, [10, 12])
-
N26GPS
N26Men
N26Sig
N26Str
-
12.0, [10, 12]
12.0, [1, 13]
1.0, [1, 6]
14.0, [1, 15]
-
(12.0, [10, 12])
(12.0, [1, 13])
(1.0, [1, 6])
(14.0, [1, 15])
N34mrf
N34GPS
N34Men
N34Sig
N34Str
3.0, [3, 4]
6.0, [6, 6]
3.0, [1, 8]
6.0, [6, 6]
4.0, [4, 4]
-
(6.0, [6, 7])
(4.0, [1, 9])
(30.0, [19, 21])
(18.0, [17, 20])
We perform the Kruskal-Wallis test to search for at least one ranking scores’ vector that is stochastically different from the others of the same network.
In Tab. 13, we report results obtained from the Kruskal-Wallis test for paired DB models, and for the matrix containing all the distributions. The test gives: (i) no difference in terms of paired models, (ii) a significant difference when all the distributions are evaluated together.
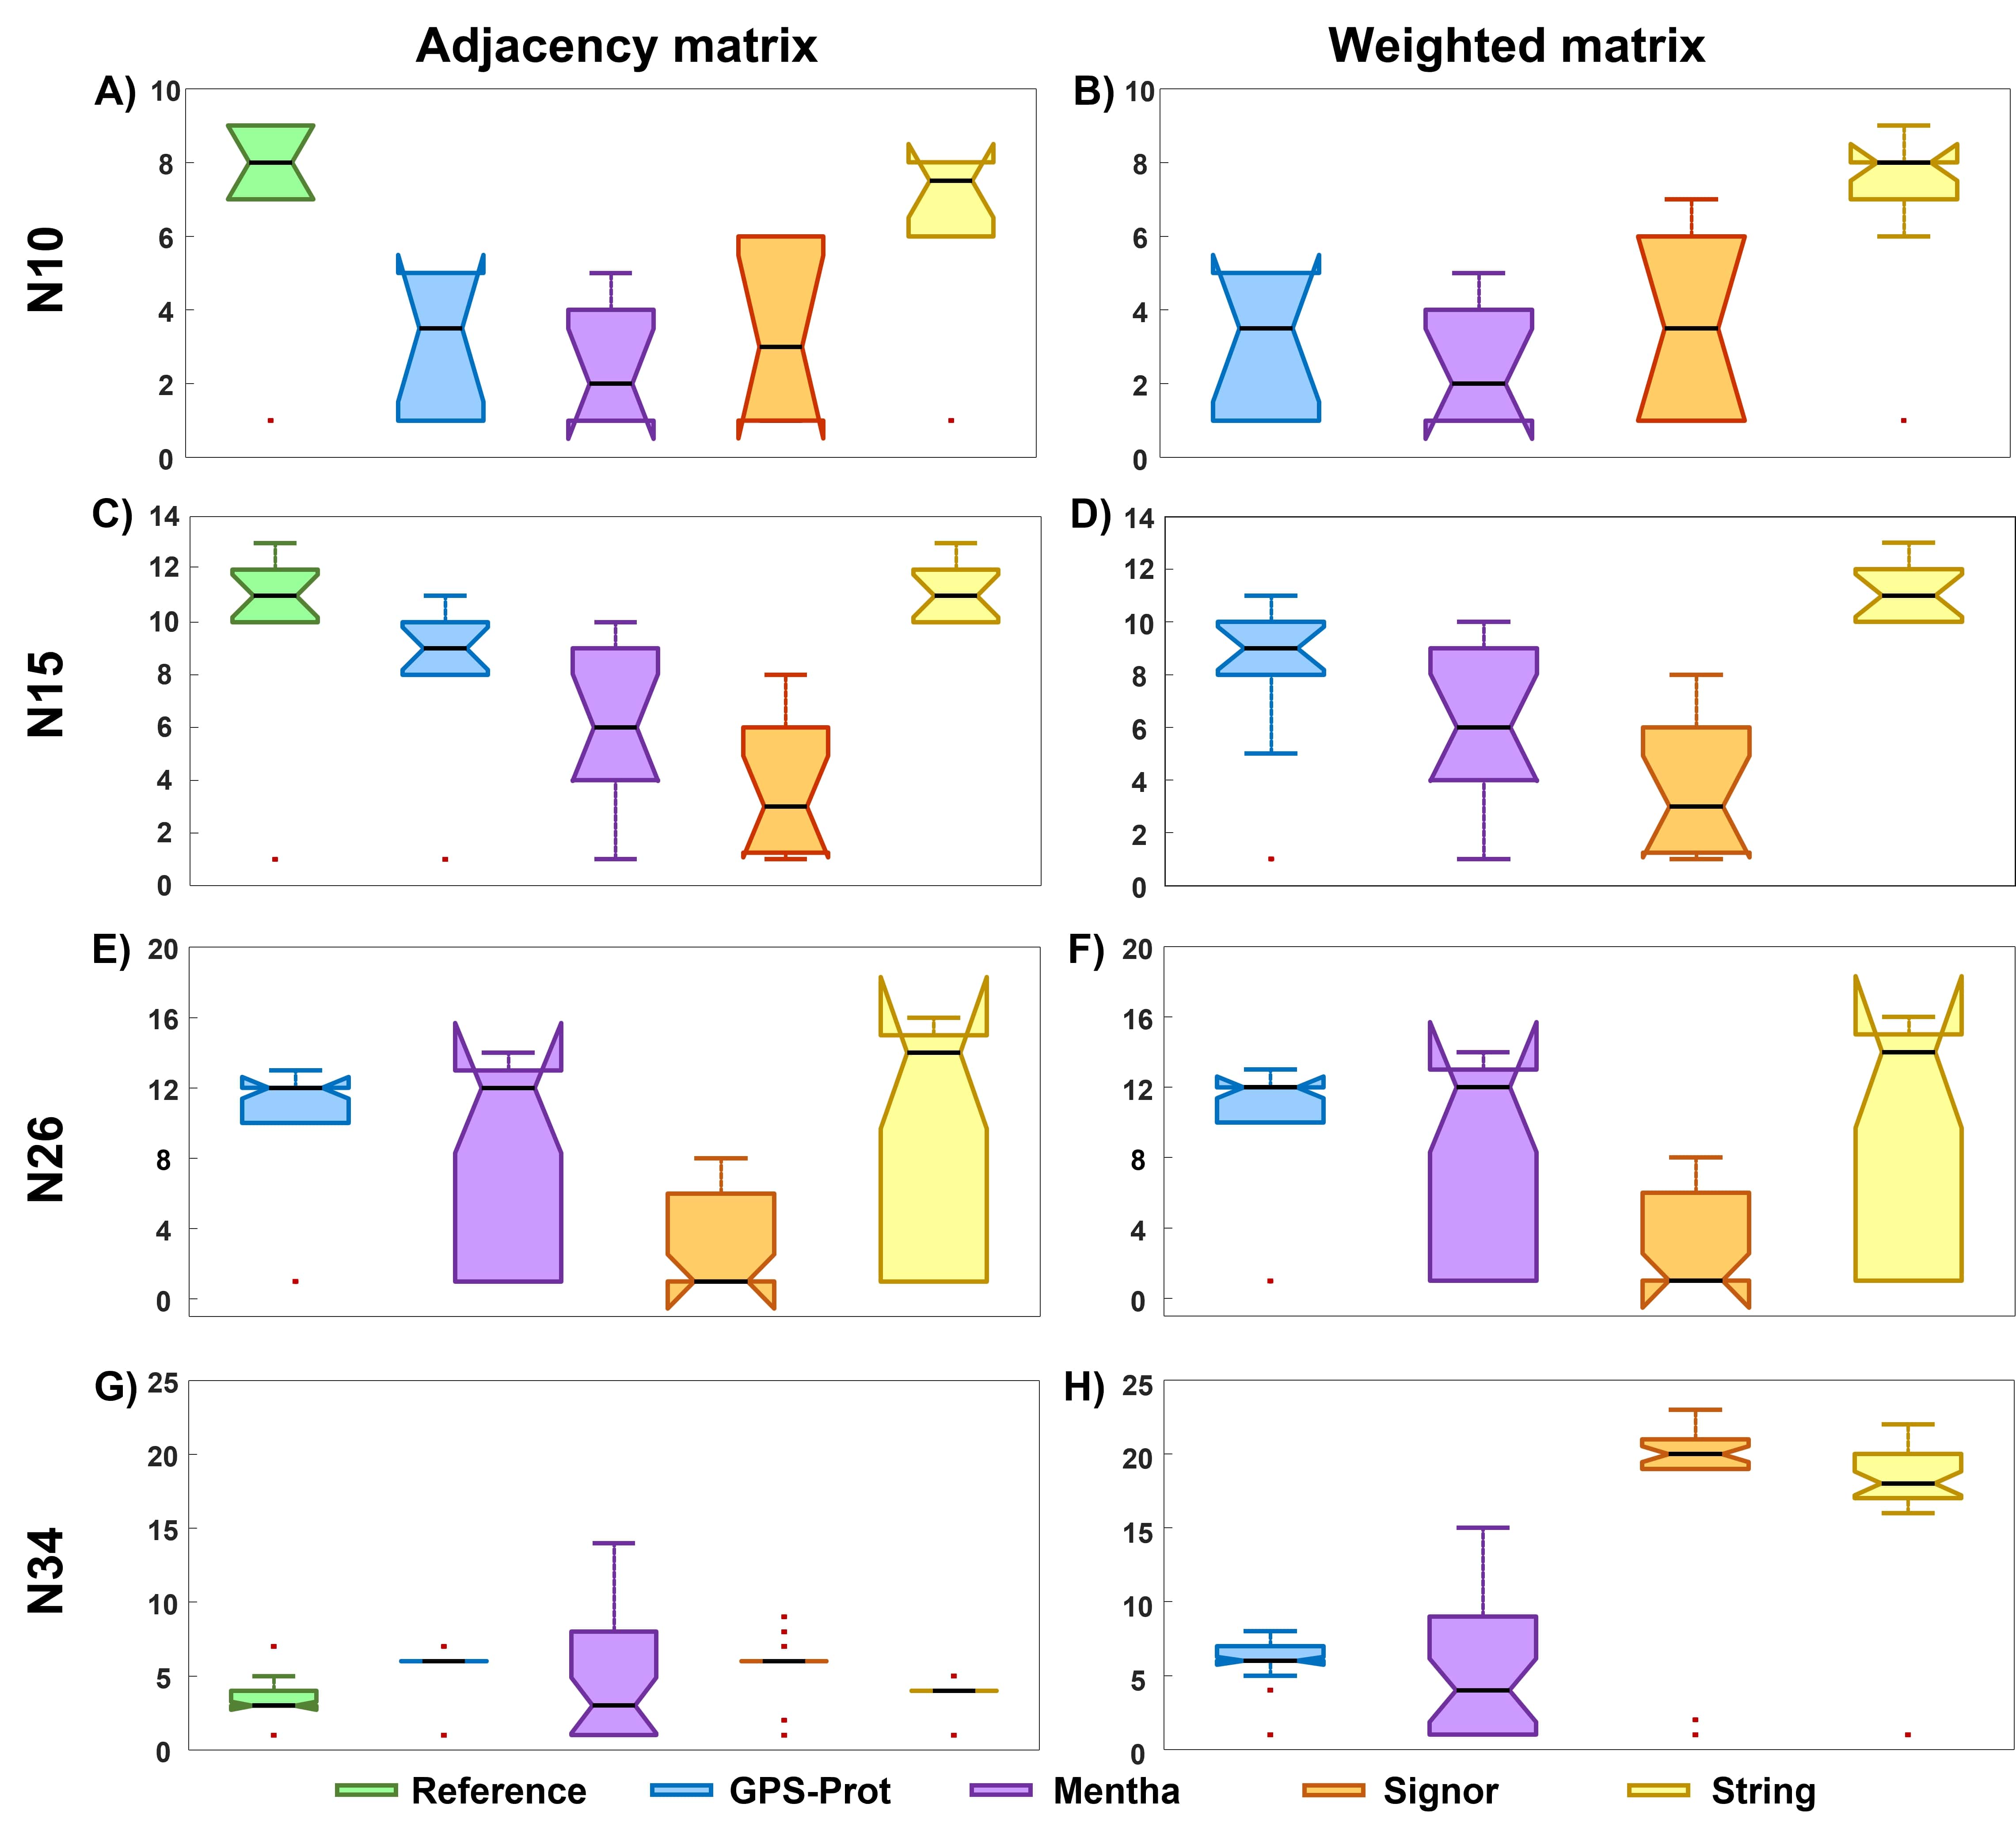
In Fig. 7 we plot the results of the Kruskal-Wallis test for all considered networks. Outlier points are individuated by red dots. In details, the outlier points individuated with the reference and N10Str models distributions (Fig. 7 A-B) are related to the NFE2L2 node, which has 1 as the ranking score value for both adjacency and weighted models (upper panel of Tab. 1). The outlier points individuated by the test for the reference and N15GPS model (Fig. 7 C-D) are related to NFE2L2, for the first model, and EIF2S1 and MAP3K5, for the latter one. The ranking scores change with respect to the N10 network models, since, for example, NFE2L2 is individuated as an outlier with a different DB model respect to what obtained with the previous networks; in this case, with String DB, the node possesses a score higher than 1, since NFE2L2 is outwardly connected to another node. The outlier points in Fig. 7 E-F individuated by the test for N26GPS model are related to a small number of nodes (see Tab. 7), including once again NFE2L2 protein. For the case of N34 (Fig. 7 G-H), there are many outlier points, associated (see Tab. 9) to nodes with ranking score values quite different from the median (see Tab. 12).
p-value for adjacency matrix (weighted matrix)
Model
N10GPS
N10Men
N10Sig
N10Str
N10GPS
-
0.21 (0.21)
0.52 (0.58)
0.46 (0.34)
N10Men
0.21 (0.21)
-
0.51 (0.71)
0.25 (0.58)
N10Sig
0.52 (0.58)
0.51 (0.71)
-
0.20 (0.80)
N10Str
0.46 (0.34)
0.25 (0.58)
0.20 (0.80)
-
N15GPS
N15Men
N15Sig
N15Str
N15GPS
-
0.06 (0.04)
0.74 (0.97)
0.11 (0.048)
N15Men
0.06 (0.04)
-
0.78 (1)
0.03 (0.03)
N15Sig
0.74 (0.97)
0.78 (1.00)
-
0.75 (0.40)
N15Str
0.11 (0.048)
0.03 (0.03)
0.75 (0.40)
-
N26GPS
N26Men
N26Sig
N26Str
N26GPS
-
0.02 (0.02)
0.11 (0.18)
0.36 (0.23)
N26Men
0.016 (0.02)
-
0.16 (0.71)
0.17 (0.10)
N26Sig
0.11 (0.18)
0.16 (0.71)
-
0.06 (0.04)
N26Str
0.36 (0.23)
0.17 (0.10)
0.06 (0.04)
-
N34GPS
N34Men
N34Sig
N34Str
N34GPS
-
0.21 (0.36)
0.04 (0.11)
0.12 (0.21)
N34Men
0.22 (0.36)
-
0.20 (0.15)
0.18 (0.17)
N34Sig
0.04 (0.11)
0.20 (0.15)
-
0.02 (0.045)
N34Str
0.12 (0.21)
0.18 (0.17)
0.02 (0.045)
-
p-value for adjacency matrix (weighted matrix)
N10
N15
N26
N34
0.001
0.001
0.001
0.001
(0.001)
( 0.001)
( 0.001)
( 0.001)
In Tab. 15, we report results obtained from the signed-rank test for paired ranking score distributions of different combinations of models (same analysis done with the Generalized Hamming Distance), for all studied networks. The Wilcoxon signed rank test is also performed to compare the ranking score distributions obtained using databases with the distribution of the reference model, in the case of N10, N15, and N34 networks.
For the N10 network, all the models built on the four DBs are different from the reference model ( 0.05). Also, the String DB model is statistically different from the models built with the other three DBs. The test provides that there is no difference between the three GPS-Prot, Mentha, and Signor models, pair by pair ( 0.50 for N10GPS-N10Men, 0.86 (0.59) for N10GPS-N10Sig, 0.42 (0.30) for N10Men-N10Sig).
For the N15 network, the signed rank test gives a bare difference for the distributions of Mentha and Signor DB ( 0.05 (0.06) for both pairs). The two-sided test provides that there is no difference between the reference model and N15Str model ( 1), as we can expect looking at ranking score distributions reported in Tab. 4
For the N26 network, the two-sided test gives no difference in the distributions of GPS-Prot and Mentha DBs models ( 0.41). Since we do not built the reference model for the N26 network, it is not possible to perform the signed-rank test to compare it with the DB models. Much less we can perform the Wilcoxon rank sum test when switching from one network to another by changing the number of involved nodes.
For the N34 network, the two-sided test gives no difference regarding GPS-Prot and Mentha DB models 0.41), as for N26, according to what is shown in Tab. 9.
p-value for adjacency matrix (weighted matrix)
Model
N10mrf
N10GPS
N10Men
N10Sig
N10Str
N10mrf
-
0.004 (-)
0.004 (-)
0.004 (-)
0.02 (-)
N10GPS
0.004 (-)
-
0.50 (0.50)
0.86 (0.59)
0.004 (0.004)
N10Men
0.004 (-)
0.50 (0.50)
-
0.42 (0.30, 0)
0.004 (0.004)
N10Sig
0.004 (-)
0.86 (0.59)
0.42 (0.30)
-
0.004 (0.004)
N10Str
0.016 (-)
0.004 (0.004)
0.004 (0.004)
0.004 (0.004)
-
N15mrf
N15GPS
N15Men
N15Sig
N15Str
N15mrf
-
0.005 (-)
0.001 (-)
0.001 (-)
1.00 (-)
N15GPS
0.005 (-)
-
0.001 ( 0.001)
0.002 (0.003)
0.001 ( 0.001)
N15Men
0.001 (-)
0.001 ( 0.001)
-
0.05 (0.06)
0.001 ( 0.001)
N15Sig
0.001 (-)
0.002 (0.003)
0.05 (0.06)
-
0.001 ( 0.001)
N15Str
1.00 (-)
0.001 ( 0.001)
0.001, 1 ( 0.001)
0.001 ( 0.001)
-
Model
-
N26GPS
N26Men
N26Sig
N26Str
N26GPS
-
-
0.41 (0.41)
0.001 (0.003)
0.04 ( 0.001)
N26Men
-
0.41 (0.41)
-
0.001 ( 0.001)
0.03 (0.02)
N26Sig
-
0.001 (0.003)
0.001 ( 0.001)
-
0.001 ( 0.001)
N26Str
-
0.041 ( 0.001)
0.03 (0.02)
0.001 ( 0.001)
-
N34mrf
N34GPS
N34Men
N34Sig
N34Str
N34mrf
-
0.001 (-)
0.001 (-)
0.001 (-)
0.006 (-)
N34GPS
0.001 (-)
-
0.41 (0.41)
0.001 (0.003)
0.04 ( 0.001)
N34Men
0.001 (-)
0.41 (0.41)
-
0.001 ( 0.001)
0.03 (0.02)
N34Sig
0.001 (-)
0.001 (0.003)
0.001 ( 0.001)
-
0.001 ( 0.001)
N34Str
0.006 (-)
0.04 ( 0.001)
0.03 (0.02)
0.001 ( 0.001)
-
Finally, we perform the Wilcoxon rank sum test, by comparing the score distributions of N10, N15 and N34 UPR models, also including the reference models, to evaluate the importance of adding new nodes to the networks. We do not include N26 in this analysis because we do not have the reference model for N26. Results are reported in Tab. 16.
p-value for adjacency matrix (weighted matrix)
N15mrf
N15GPS
N15Men
N15Sig
N15Str
0.001
0.001
0.01
0.65
0.001
(-)
(0.002)
(0.01)
(0.84)
( 0.001)
Comparison with N10 UPR models
N34mrf
N34GPS
N34Men
N34Sig
N34Str
0.001
0.001
0.30
0.001
0.001
(-)
( 0.001)
(0.50)
( 0.001)
( 0.001)
Comparison with N15 UPR models
N34mrf
N34GPS
N34Men
N34Sig
N34Str
0.001
0.001
0.86
0.005
0.001
(-)
( 0.001)
(0.57)
( 0.001)
( 0.001)
As we can note from Tab. 16., the test provides that there is no difference ( (0.84)) between the distributions regarding Signor DB model, passing from the N10 to the N15 network. So we can assert that the model produced by Signor DB is not affected by changes in the dimensionality of the network. In particular, the test gives a significant difference regarding String DB model (). For N34, the test shows that there is no difference between the distributions of ranking scores regarding Mentha DB model, by comparing N34Men model with N10Men ( (0.50)) and N15Men models ( (0.57)). We can assert that, in this case, the N34 model produced by Mentha DB is not affected by changes in the dimensionality of the network. Also for N34 network, the test gives a significant difference regarding GPS-Prot and String DB models ().
4 Discussion on the Biological Significance of Structural Controllability Results
Referring to ranking scores distributions and MDN sets results reported in Tabs. 1 and 2, respectively, we find that, for all N10 DB models, ATF6 and EIF2AK3 are identified as driver nodes. This is an interesting finding because the ER stress sensors can be considered among the most important proteins involved in the UPR mechanism, since the adaptive response starts from them. Furthermore, in the case of the adjacency N10Str model, the driver nodes coincide exactly with the three ER sensors. Despite the interesting results for the N10 models, the dimension of the network is probably still too small to obtain very significant biological information about the mechanism.
Going to the N15 network models, in most cases, two of the ER stress sensors, i.e., ATF6 and ERN1, are identified as driver nodes, confirming the results obtained with the N10 network (see Tabs. 2 and 5). The same considerations done for the N10 network hold also for the N15 network, with the control theory results emphasizing the importance of the ER stress sensors in the UPR mechanism (Tab. 5). In particular, the ERN1-TRAF2-ASK1 complex is included in the N15 network, which is of fundamental importance for the UPR and apoptosis mechanisms, especially in neuronal cells [102, 103]. Other nodes included in the N15 MDN sets, for all models, are MAPK proteins. In particular, MAPK14 is a very important protein because it also constitutes the main p38 MAPK activity in the heart, and it is responsible for the promotion of myocyte apoptosis via downstream targets DDIT3 and TP53 [104, 105, 106, 107].
Regarding the N34, the MDN sets results (Tab. 10) obtained for the DB models are very different from the set of the N34mrf model,
except for activating transcription factor 6 ATF6B, which results as DN in all sets. It has a survival role in the ER stress response in pancreatic -cells, and ATF/CREB is involved in diabetes [108, 109, 110, 111], as a master regulator for hepatic gluconeogenesis [112].
It is not straightforward to attribute a biological meaning to the set of driver nodes we obtain, and to directly relate them to DNs for smaller networks. The inclusion of a complete new mechanism (the apoptosis) in N34, and thus the increase in network dimension with respect to N15 (number of nodes more than doubled, number of edges almost increased fivefold) may be responsible for the discrepancies in obtained DN sets. By increasing the number of nodes and edges, there could be the possibility of losing biological information in the models because the amount of missing information stored in the databases increases.
Nevertheless, PPP1R15A is a driver node for N10, N15 and N34. It is a gene involved in facilitating recovery of cells from stress [113, 114].
We are not able to extract biological information from structural controllability results for N26 network models because they are not very significant; in fact, about the 50% or more nodes result as drivers. For this reason, we do not carried out a more thorough analysis as we do for the other examined networks.
5 Conclusions
The Unfolded Protein Response is one of the most important biological mechanism in living systems which take place in the endoplasmic reticulum, whose functionality is to restore the physiological homeostatic state of cells [1, 2, 3, 4, 5, 6, 7]. A failure in the efficiency of the ER stress adaptive response causes a more or less severe accumulation of unfolded or misfolded proteins, which are known to create aggregates that can damage cells and tissues. This condition is the main reason for the development of amyloidosis and neurodegenerative diseases [22, 23, 24, 25].
The structural controllability analysis, based on Kalman’s rank condition [28], provides a very useful tool to understand the behaviour of complex systems, which can be described as networks characterized by nodes and edges. The Minimum Drive Nodes approach to studying a complex network can provide important biological information on the proteins involved in a certain mechanism. By applying this theory to the investigated network models, it is possible to identify which are the fundamental nodes that control all the network [26, 97].
Nevertheless, our study, based on experimentally built networks, can be used for a reliable prediction of the development of dysfunction in biological processes by varying nodes and edges in the related networks, for which it is necessary to know a significant piece of biological information. For this purpose, we try to apply the structural controllability analysis to the UPR mechanism by studying four different networks, based on the biological information from different protein-protein interaction databases. We point out that for this method to be effective, sufficient information must be stored in PPI experimental databases.
Our results nicely confirm the hypothesis that the ER stress sensors are among the most important participants in the UPR adaptive response, even when a part of the biological information is missing in the network model. This can mean that a dysfunction in the ER stress sensors pathways, in particular in the induction of chaperones and ER-associated degradation, could be disastrous for the living systems [59, 115, 116, 117]. Further, our study also has the potential to uncover novel regulators of UPR and other key mechanisms, potentially associated with multiple dysfunctions and diseases [102, 103, 104, 105, 106, 107, 108, 109, 110, 111, 112, 113, 114].
Author contributions
Conceptualization, N.L., A.L., L.C., S.F.; methodology, N.L., A.L., M.A.G.M., L.C.; investigation, N.L.; formal analysis, N.L.; writing–original draft preparation, N.L. and L.C.; writing–review and editing, all authors; visualization, N.L., M.A.G.M, L.C.; supervision, A.L., L.C, S.F . All authors have read and agreed to the published version of the manuscript.
Acknowledgments
A.L., L.C. and S.F. acknowledge the support of the International Center for Relativistic Astrophysics Network (ICRANet). All the authors acknowledge the support of the Italian National Group for Mathematical Physics (GNFM-INdAM). All the authors acknowledge the support from HORIZON-CL4-2021-DIGITAL-EMERGING-01 –“Muquabis” project and the EBRAINS research infrastructure. We thank Dr. Alberto Luini for useful scientific discussions.
Abbreviations
The following abbreviations are used in the manuscript:
| UPR | unfolded protein response |
| ER | endoplasmic reticulum |
| PPI | protein-protein interaction/s |
| MDN | minimum driver nodes |
| GHD | Generalized Hamming Distance |
| DB / DBs | database / databases |
References
- [1] C. Hetz, The unfolded protein response: controlling cell fate decisions under er stress and beyond, Nat Rev Mol Cell Biol 13 (2012) 89–102.
- [2] J. Shen, X. Chen, L. Hendershot, R. Prywes, Er stress regulation of atf6 localization by dissociation of bip/grp78 binding and unmasking of golgi localization signals, Developmental cell 3 (1) (2002) 99–111.
- [3] J. Shen, E. L. Snapp, J. Lippincott-Schwartz, R. Prywes, Stable binding of atf6 to bip in the endoplasmic reticulum stress response, Molecular and cellular biology 25 (3) (2005) 921–932.
- [4] A. Almanza, A. Carlesso, C. Chintha, S. Creedican, D. Doultsinos, et al., Endoplasmic reticulum stress signalling – from basic mechanisms to clinical applications, The FEBS Journal 286 (2) (2019) 241–278.
- [5] P. Walter, D. Ron, The unfolded protein response: From stress pathway to homeostatic regulation, Science 334 (6059) (2011) 1081–1086.
- [6] C. Hetz, F. R. Papa, The unfolded protein response and cell fate control, Molecular cell 69 (2) (2018) 169–181.
- [7] D. K. Gessner, G. Schlegel, R. Ringseis, et al., Up-regulation of endoplasmic reticulum stress induced genes of the unfolded protein response in the liver of periparturient dairy cows, BMC Vet Res 10 (46) (2014).
- [8] M. Ni, H. Zhou, S. Wey, P. Baumeister, A. S. Lee, Regulation of perk signaling and leukemic cell survival by a novel cytosolic isoform of the upr regulator grp78/bip, PLOS ONE 4 (8) (2009) 1–15.
- [9] T. Sommer, E. Jarosch, Bip binding keeps atf6 at bay, Developmental Cell 3 (1) (2002) 1–2.
- [10] M. C. Kopp, N. Larburu, V. Durairaj, et al., Upr proteins ire1 and perk switch bip from chaperone to er stress sensor, Nat Struct Mol Biol 26 (2019) 1053–1062.
- [11] L. Wieteska, S. Shahidi, A. Zhuravleva, Allosteric fine-tuning of the conformational equilibrium poises the chaperone bip for post-translational regulation, eLife 6 (2017) e29430.
- [12] M. Carrara, F. Prischi, P. R. Nowak, M. C. Kopp, M. M. Ali, Noncanonical binding of bip atpase domain to ire1 and perk is dissociated by unfolded protein cH1 to initiate er stress signaling, eLife 4 (2015) e03522.
- [13] G. C. Shore, F. R. Papa, S. A. Oakes, Signaling cell death from the endoplasmic reticulum stress response, Current Opinion in Cell Biology 23 (2) (2011) 143–149.
- [14] T. G. Anthony, R. C. Wek, Txnip switches tracks toward a terminal upr, Cell Metabolism 16 (2) (2012) 135–137.
- [15] A. Kishino, K. Hayashi, M. Maeda, et al., Caspase-8 regulates endoplasmic reticulum stress-induced necroptosis independent of the apoptosis pathway in auditory cells, International Journal of Molecular Sciences 20 (23) (2019) 5896.
- [16] C. Hetz, F. R. Papa, The unfolded protein response and cell fate control, Molecular Cell 69 (2) (2018) 169–181.
- [17] A. Fribley, K. Zhang, R. J. Kaufman, Regulation of apoptosis by the unfolded protein response, Methods in molecular biology 559 (2009) 191–204.
- [18] S. Bartoszewska, J. F. Collawn, Unfolded protein response (upr) integrated signaling networks determine cell fate during hypoxia, Cell Mol Biol Lett 25 (18) (2020).
- [19] R. Kim, M. Emi, K. Tanabe, S. Murakami, Role of the unfolded protein response in cell death, Apoptosis: an international journal on programmed cell death 11 (1) (2006) 5–13.
- [20] J. Li, J. Yuan, Caspases in apoptosis and beyond, Oncogene 27 (2008) 6194–6206.
- [21] D. R. McIlwain, T. Berger, T. W. Mak, Caspase functions in cell death and disease, Cold Spring Harbor perspectives in biology 5 (4) (2013) a008656.
- [22] W. Scheper, J. J. M. Hoozemans, The unfolded protein response in neurodegenerative diseases: a neuropathological perspective, Acta Neuropathol 130 (2015) 315–331.
- [23] R. L. Vidal, C. Hetz, Crosstalk between the upr and autophagy pathway contributes to handling cellular stress in neurodegenerative disease, Autophagy 8 (6) (2012) 970–972.
- [24] R. Ghemrawi, M. Khair, Endoplasmic reticulum stress and unfolded protein response in neurodegenerative diseases, International Journal of Molecular Sciences 21 (17) (2020).
- [25] A. M. van Ziel, W. Scheper, The upr in neurodegenerative disease: Not just an inside job, Biomolecules 10 (8) (2020).
- [26] Y.-Y. Liu, J.-J. Slotine, A.-L. Barabási, Controllability of complex networks, Nature 473 (2011) 167–173.
- [27] Y.-Y. Liu, A.-L. Barabasi, Control principles of complex systems, Rev. Mod. Phys. 88 (58) (2016) 035006.
- [28] R. E. Kalman, Mathematical description of linear dynamical systems, Journal of the Society for Industrial and Applied Mathematics Series A Control 1 (2) (1963) 152–192.
- [29] M. Uhart, G. Flores, D. Bustos, Controllability of protein-protein interaction phosphorylation-based networks: Participation of the hub 14-3-3 protein family, Sci Rep 6 (2016) 26234.
- [30] A. Vinayagam, T. E. Gibson, H.-J. Lee, B. Yilmazel, et al., Controllability analysis of the directed human protein interaction network identifies disease genes and drug targets, Proceedings of the National Academy of Sciences 113 (18) (2016) 4976–4981.
- [31] C. T. Abdallah, Mathematical controllability of genomic networks, Proceedings of the National Academy of Sciences 108 (42) (2011) 17243–17244.
- [32] E. Ackerman, J. Alcorn, T. Hase, et al., A dual controllability analysis of influenza virus-host protein-protein interaction networks for antiviral drug target discovery, BMC Bioinformatics 20 (297) (2019).
- [33] K. Kanhaiya, E. Czeizler, C. Gratie, et al., Controlling directed protein interaction networks in cancer, Sci Rep 7 (2017) 10327.
- [34] S. Liu, Q. Xu, A. Chen, P. Wang, Structural controllability of dynamic transcriptional regulatory networks for saccharomyces cerevisiae, Physica A: Statistical Mechanics and its Applications 537 (2020) 122772.
- [35] C.-T. Lin, Structural controllability, IEEE Transactions on Automatic Control 19 (3) (1974) 201–208.
- [36] R. Shields, J. Pearson, Structural controllability of multiinput linear systems, IEEE Transactions on Automatic Control 21 (2) (1976) 203–212.
- [37] K. Glover, L. Silverman, Characterization of structural controllability, IEEE Transactions on Automatic Control 21 (4) (1976) 534–537.
- [38] S. Sengupta, V. C. Jordan, R. Clarke, Role of Protein Translation in Unfolded Protein Response, Springer International Publishing, 2019, pp. 109–120.
- [39] J. Huang, H. Pan, J. Wang, et al., Unfolded protein response in colorectal cancer, Cell Biosci 11 (26) (2021).
- [40] K. Erguler, M. Pieri, C. Deltas, A mathematical model of the unfolded protein stress response reveals the decision mechanism for recovery, adaptation and apoptosis, BMC systems biology 7 (16) (2013).
- [41] J. Grootjans, A. Kaser, R. J. Kaufman, R. S. Blumberg, The unfolded protein response in immunity and inflammation, Nature reviews. Immunology 16 (8) (2016) 469–484.
- [42] C. J. Adams, M. C. Kopp, N. Larburu, P. R. Nowak, M. Ali, Structure and molecular mechanism of er stress signaling by the unfolded protein response signal activator ire1, Frontiers in molecular biosciences 6 (11) (2019).
- [43] M. Peng, F. Chen, Z. Wu, J. Shen, Endoplasmic reticulum stress, a target for drug design and drug resistance in parasitosis, Frontiers in microbiology 12 (670874) (2021).
- [44] M. Schröder, R. J. Kaufman, The mammalian unfolded protein response, Annual Review of Biochemistry 74 (1) (2005) 739–789.
- [45] M. Halliday, G. R. Mallucci, Targeting the unfolded protein response in neurodegeneration: A new approach to therapy, Neuropharmacology 76 (2014) 169–174.
- [46] D. Scheuner, R. J. Kaufman, The unfolded protein response: A pathway that links insulin demand with -cell failure and diabetes, Endocrine Reviews 29 (3) (2008) 317–333.
- [47] E. Madden, S. E. Logue, S. J. Healy, S. Manie, A. Samali, The role of the unfolded protein response in cancer progression: From oncogenesis to chemoresistance, Biology of the Cell 111 (1) (2019) 1–17.
- [48] C. Lebeaupin, D. Vallée, Y. Hazari, C. Hetz, E. Chevet, B. Bailly-Maitre, Endoplasmic reticulum stress signalling and the pathogenesis of non-alcoholic fatty liver disease, Journal of Hepatology 69 (4) (2018) 927–947.
- [49] H. Yang, M. Niemeijer, B. van de Water, J. B. Beltman, Atf6 is a critical determinant of chop dynamics during the unfolded protein response, iScience 23 (2) (2020) 100860.
- [50] M. Read, M. Schröder, The unfolded protein response: An overview, Biology 10 (384) (2021).
- [51] Y. Chen, Y. Mi, X. Zhang, et al., Dihydroartemisinin-induced unfolded protein response feedback attenuates ferroptosis via perk/atf4/hspa5 pathway in glioma cells, J Exp Clin Cancer Res 38 (402) (2019).
- [52] G. Clavarino, N. Cláudio, A. Dalet, S. Terawaki, et al., Protein phosphatase 1 subunit ppp1r15a/gadd34 regulates cytokine production in polyinosinic:polycytidylic acid-stimulated dendritic cells, Proceedings of the National Academy of Sciences of the United States of America 109 (8) (2012) 3006–3011.
- [53] L. Chen, J. He, J. Zhou, Z. Xiao, N. Ding, Y. Duan, W. Li, L. Q. Sun, Eif2a promotes cell survival during paclitaxel treatment in vitro and in vivo, Journal of cellular and molecular medicine 23 (9) (2019) 6060–6071.
- [54] F. Lisbona, D. Rojas-Rivera, P. Thielen, S. Zamorano, D. Todd, et al., Bax inhibitor-1 is a negative regulator of the er stress sensor ire1, Molecular cell 33 (6) (2009) 679–691.
- [55] M. Carrara, A. Sigurdardottir, A. Bertolotti, Decoding the selectivity of eif2 holophosphatases and ppp1r15a inhibitors, Nat Struct Mol Biol 24 (2017) 708–716.
- [56] I. Kim, W. Xu, J. Reed, Cell death and endoplasmic reticulum stress: disease relevance and therapeutic opportunities, Nat Rev Drug Discov 7 (2008) 1013–1030.
- [57] L. Deldicque, Endoplasmic reticulum stress in human skeletal muscle: any contribution to sarcopenia?, Frontiers in Physiology 4 (2013).
- [58] S. Basseri, R. C. Austin, Endoplasmic reticulum stress and lipid metabolism: Mechanisms and therapeutic potential, Frontiers in Physiology 2012 (2012).
- [59] R. P. Junjappa, P. Patil, K. R. Bhattarai, H.-R. Kim, H.-J. Chae, Ire1 implications in endoplasmic reticulum stress-mediated development and pathogenesis of autoimmune diseases, Frontiers in Immunology 9 (2018).
- [60] Y. H. Li, G. Tardif, D. Hum, et al., The unfolded protein response genes in human osteoarthritic chondrocytes: Perk emerges as a potential therapeutic target, Arthritis Res Ther 18 (172) (2016).
- [61] R. Höcker, A. Walker, I. Schmitz, Inhibition of autophagy through mapk14-mediated phosphorylation of atg5, Autophagy 9 (3) (2013) 426–428.
- [62] K. A. Sarosiek, X. Chi, J. A. Bachman, J. J. Sims, et al., Bid preferentially activates bak while bim preferentially activates bax, affecting chemotherapy response, Molecular cell 51 (6) (2013) 751–765.
- [63] S. Chong, S. Marchi, G. Petroni, G. Kroemer, L. Galluzzi, S. Pervaiz, Noncanonical cell fate regulation by bcl-2 proteins, Trends in Cell Biology 30 (7) (2020) 537–555.
- [64] S. Luo, D. C. Rubinsztein, Bcl2l11/bim: a novel molecular link between autophagy and apoptosis, Autophagy 9 (1) (2013) 104–105.
- [65] Y. Wei, Y. Cao, R. Sun, L. Cheng, et al., Targeting bcl-2 proteins in acute myeloid leukemia, Frontiers in Oncology 10 (2020).
- [66] C. M. Adams, S. Clark-Garvey, P. Porcu, C. M. Eischen, Targeting the bcl-2 family in b cell lymphoma, Frontiers in Oncology 8 (2019).
- [67] S. Garrison, D. Phillips, J. Jeffers, et al., Genetically defining the mechanism of puma- and bim-induced apoptosis, Cell Death Differ 19 (2012) 642–649.
- [68] D. Ren, H. C. Tu, H. Kim, G. X. Wang, et al., Bid, bim, and puma are essential for activation of the bax- and bak-dependent cell death program, Science (New York, N.Y.) 330 (6009) (2010) 1390–1393.
- [69] M. K. Gupta, F. G. Tahrir, T. Knezevic, et al., Grp78 interacting partner bag5 responds to er stress and protects cardiomyocytes from er stress-induced apoptosis, Journal of Cellular Biochemistry 117 (8) (2016) 1813–1821.
- [70] A. P. Ghosh, B. J. Klocke, M. E. Ballestas, K. A. Roth, Chop potentially co-operates with foxo3a in neuronal cells to regulate puma and bim expression in response to er stress, PLOS ONE 7 (6) (2012) 1–11.
- [71] J. Han, L. A. Goldstein, W. Hou, H. Rabinowich, Functional linkage between noxa and bim in mitochondrial apoptotic events, Journal of Biological Chemistry 282 (22) (2007) 16223–16231.
- [72] K. A. Sarosiek, X. Chi, J. A. Bachman, J. J. Sims, et al., Chop and ap-1 cooperatively mediate puma expression during lipoapoptosis, American journal of physiology. Gastrointestinal and liver physiology 299 (1) (2010) G236–G243.
- [73] M. Erlacher, V. Labi, C. Manzl, G. Böck, et al., Puma cooperates with bim, the rate-limiting bh3-only protein in cell death during lymphocyte development, in apoptosis induction, The Journal of experimental medicine 203 (13) (2006) 2939–2951.
- [74] F. Rückert, G. Dawelbait, C. Winter, A. Hartmann, et al., Examination of apoptosis signaling in pancreatic cancer by computational signal transduction analysis, PloS one 5 (8) (2010).
- [75] G. Song, G. G. Chen, J. P. Yun, P. B. Lai, Association of p53 with bid induces cell death in response to etoposide treatment in hepatocellular carcinoma, Current cancer drug targets 9 (7) (2009) 871–880.
- [76] D. Siegmund, J. Wagner, H. Wajant, Tnf receptor associated factor 2 (traf2) signaling in cancer, Cancers 14 (16) (2022).
- [77] J. Liu, H. Uematsu, N. Tsuchida, M. A. Ikeda, Essential role of caspase-8 in p53/p73-dependent apoptosis induced by etoposide in head and neck carcinoma cells, Molecular cancer 10 (95) (2011).
- [78] M. M. Madkour, H. S. Anbar, M. I. El-Gamal, Current status and future prospects of p38/mapk14 kinase and its inhibitors, European Journal of Medicinal Chemistry 213 (2021) 113216.
- [79] T. Hatai, A. Matsuzawa, S. Inoshita, Y. Mochida, et al., Execution of apoptosis signal-regulating kinase 1 (ask1)-induced apoptosis by the mitochondria-dependent caspase activation, Journal of Biological Chemistry 275 (34) (2000) 26576–26581.
- [80] N. Xu, Z. Xiao, T. Zou, Z. Huang, Induction of gadd34 regulates the neurotoxicity of amyloid , American Journal of Alzheimer’s Disease & Other Dementias 30 (3) (2015) 313–319.
- [81] X. Liu, P. Yue, F. R. Khuri, S. Y. Sun, p53 upregulates death receptor 4 expression through an intronic p53 binding site, Cancer research 64 (15) (2004) 5078–5083.
- [82] J. Wang, H. Thomas, Z. Li, et al., Puma, noxa, p53, and p63 differentially mediate stress pathway induced apoptosis, Cell Death Dis 12 (659) (2021).
- [83] T. Shibue, K. Takeda, E. Oda, H. Tanaka, et al., Integral role of noxa in p53-mediated apoptotic response, Genes & development 17 (18) (2003) 2233–2238.
- [84] M. Mesquida, F. Drawnel, S. Fauser, The role of inflammation in diabetic eye disease, Semin Immunopathol 41 (2019) 427–445.
- [85] M. Haneda, E. Kojima, A. Nishikimi, T. Hasegawa, I. Nakashima, K.-i. Isobe, Protein phosphatase 1, but not protein phosphatase 2a, dephosphorylates DNA-damaging stress-induced phospho-serine 15 of p53, FEBS Letters 567 (2-3) (2004) 171–174.
- [86] R. Kalathur, K. Ayasolla, M. Futschik, The unfolded protein response and its potential role in Huntington’s disease, Nature Precedings (2012).
- [87] B. Lehne, T. Schlitt, Protein-protein interaction databases: keeping up with growing interactomes, Human genomics 3 (3) (2009) 291–297.
- [88] A. K. Bajpai, S. Davuluri, K. Tiwary, S. Narayanan, et al., Systematic comparison of the protein-protein interaction databases from a user’s perspective, Journal of Biomedical Informatics 103 (2020) 103380.
- [89] M. E. Fahey, M. J. Bennett, C. Mahon, et al., Gps-prot: A web-based visualization platform for integrating host-pathogen interaction data, BMC Bioinformatics 12 (298) (2011).
- [90] A. Calderone, L. Castagnoli, G. Cesareni, mentha: a resource for browsing integrated protein-interaction networks, Nat Methods 10 (2013) 690–691.
- [91] L. Licata, et al., Signor 2.0, the signaling network open resource 2.0: 2019 update, Nucleic Acids Res 8 (48) (2020) D504–D510.
- [92] C. von Mering, M. Huynen, D. Jaeggi, S. Schmidt, P. Bork, B. Snel, String: a database of predicted functional associations between proteins, Nucleic acids research 31 (1) (2003) 258–261.
- [93] D. Szklarczyk, A. Franceschini, S. Wyder, K. Forslund, et al., String v10: protein-protein interaction networks, integrated over the tree of life, Nucleic acids research 43 (2015) D447–D452.
- [94] C. Stark, B. J. Breitkreutz, T. Reguly, L. Boucher, A. Breitkreutz, M. Tyers, Biogrid: a general repository for interaction datasets, Nucleic acids research 34 (2006) D535–D539.
- [95] R. Oughtred, J. Rust, C. Chang, et al., The biogrid database: A comprehensive biomedical resource of curated protein, genetic, and chemical interactions, Protein Science 30 (1) (2021) 187–200.
- [96] G. Chaurasia, Y. Iqbal, C. Hänig, H. Herzel, E. E. Wanker, M. E. Futschik, Unihi: an entry gate to the human protein interactome, Nucleic acids research 35 (2007) D590–D594.
- [97] P. Zhang, Z. Ji, Z. Li, Minimum driver nodes selection in complex networks, in: 2017 36th Chinese Control Conference (CCC), 2017, pp. 8461–8466.
- [98] D. Ruan, A. Young, G. Montana, Differential analysis of biological networks, BMC Bioinformatics 16 (372) (2015).
- [99] R. Mall, L. Cerulo, H. Bensmail, A. Iavarone, M. Ceccarelli, Detection of statistically significant network changes in complex biological networks, BMC systems biology 11 (32) (2017).
- [100] G. Van Rossum, F. L. Drake, Python 3 Reference Manual, CreateSpace, 2009.
- [101] MATLAB, version R2022a, The MathWorks Inc., Natick, Massachusetts, 2022.
- [102] T. Zeng, L. Peng, H. Chao, et al., Ire1-traf2-ask1 complex-mediated endoplasmic reticulum stress and mitochondrial dysfunction contribute to cxc195-induced apoptosis in human bladder carcinoma t24 cells, Biochemical and Biophysical Research Communications 460 (3) (2015) 530–536.
- [103] H. Nishitoh, A. Matsuzawa, K. Tobiume, K. Saegusa, et al., Ask1 is essential for endoplasmic reticulum stress-induced neuronal cell death triggered by expanded polyglutamine repeats, Genes & development 16 (11) (2002) 1345–1355.
- [104] V. G. Sharov, A. Todor, G. Suzuki, H. Morita, E. J. Tanhehco, H. N. Sabbah, Hypoxia, angiotensin-ii, and norepinephrine mediated apoptosis is stimulus specific in canine failed cardiomyocytes: a role for p38 mapk, fas-l and cyclin d1, European Journal of Heart Failure 5 (2) (2003) 121–129.
- [105] M. S. Marber, et al., The p38 mitogen-activated protein kinase pathway—a potential target for intervention in infarction, hypertrophy, and heart failure, Journal of Molecular and Cellular Cardiology 51 (2010) 485–490.
- [106] S. Eiras, P. Fernández, R. Piñeiro, M. J. Iglesias, J. R. González-Juanatey, F. Lago, Doxazosin induces activation of gadd153 and cleavage of focal adhesion kinase in cardiomyocytes en route to apoptosis, Cardiovascular Research 71 (1) (2006) 118–128.
- [107] F. Fiordaliso, A. Leri, D. Cesselli, F. Limana, B. Safai, B. Nadal-Ginard, P. Anversa, J. Kajstura, Hyperglycemia activates p53 and p53-regulated genes leading to myocyte cell death, Diabetes 50 (10) (2001) 2363–2375.
- [108] D. J. Thuerauf, M. Marcinko, P. J. Belmont, C. C. Glembotski, Effects of the isoform-specific characteristics of atf6 and atf6 on endoplasmic reticulum stress response gene expression and cell viability, Journal of Biological Chemistry 282 (31) (2007) 22865–22878.
- [109] T. Odisho, L. Zhang, A. Volchuk, Atf6 regulates the wfs1 gene and has a cell survival role in the er stress response in pancreatic -cells, Experimental Cell Research 330 (1) (2015) 111–122.
- [110] S. Bilekova, S. Sachs, H. Lickert, Pharmacological targeting of endoplasmic reticulum stress in pancreatic beta cells, Trends in Pharmacological Sciences 42 (2) (2021) 85–95.
- [111] D. Tchapyjnikov, Y. Li, T. Pisitkun, J. D. Hoffert, M.-J. Yu, M. A. Knepper, Proteomic profiling of nuclei from native renal inner medullary collecting duct cells using lc-ms/ms, Physiological Genomics 40 (3) (2010) 167–183.
- [112] A. Cui, D. Ding, Y. Li, Regulation of hepatic metabolism and cell growth by the atf/creb family of transcription factors, Diabetes 70 (3) (2021) 653–664.
- [113] M. S. Choy, P. Yusoff, I. C. Lee, J. C. Newton, C. W. Goh, R. Page, S. Shenolikar, W. Peti, Structural and functional analysis of the gadd34:pp1 eif2 phosphatase, Cell reports 11 (2015) 1885–1891.
- [114] C. X. Santos, A. D. Hafstad, M. Beretta, M. Zhang, et al., Targeted redox inhibition of protein phosphatase 1 by nox4 regulates eif2-mediated stress signaling, The EMBO journal 35 (2016) 319–334.
- [115] J. H. Lin, P. Walter, T. S. Yen, Endoplasmic reticulum stress in disease pathogenesis, Annual review of pathology 3 (2008) 399–425.
- [116] O. M. Amen, S. D. Sarker, R. Ghildyal, A. Arya, Endoplasmic reticulum stress activates unfolded protein response signaling and mediates inflammation, obesity, and cardiac dysfunction: Therapeutic and molecular approach, Frontiers in Pharmacology 10 (2019).
- [117] K. R. Bhattarai, M. Chaudhary, H. R. Kim, H. J. Chae, Endoplasmic reticulum (er) stress response failure in diseases, Trends in cell biology 30 (9) (2020) 672–675.