Stress-tunable abilities of glass forming and mechanical amorphization
Abstract
Mechanical amorphization, a widely observed phenomenon, has been utilized to synthesize novel phases by inducing disorder through external loading, thereby expanding the realm of glass-forming systems. Empirically, it has been plausible that mechanical amorphization ability consistently correlates with glass-forming ability. However, through a comprehensive investigation in binary, ternary, and quaternary systems combining neutron diffraction, calorimetric experimental approaches and molecular dynamics simulation, we demonstrate that this impression is only partly true and we reveal that the mechanical amorphization ability can be inversely correlated with the glass forming ability in certain cases To provide insights into these intriguing findings, we present a stress-dependent nucleation theory that offers a coherent explanation for both experimental and simulation results. Our study identifies the intensity of mechanical work, contributed by external stress, as the key control parameter for mechanical amorphization, rendering the ability to tune this process. This discovery not only unravels the underlying correlation between mechanical amorphization and glass-forming ability but also provides a pathway for the design and discovery of new amorphous phases with tailored properties.
I Introduction
Mechanical amorphization is a phenomenon frequently encountered in the context of crystalline materialsLi2022Amorphization , encompassing metallicZhao2021Amorphization ; Wang2021Deformation , ionicMeade1990static , and covalent compoundsTang2021synthesis . This process not only broadens the spectrum of attainable glassy statesMcMillan2005density , but also offers a path to the discovery of entirely new amorphous phasesRosuFinsen2023medium . Typically, mechanical amorphization is driven by external forces, including millingKoch1983PreparationO ; Suryanarayana2001 ; PhysRevB.56.R11361 , shock wavesChen2003shock ; Zhao2018ShockinducedAI , ultrasonic vibrationsLi2023ultrafast , or various forms of deformationHe2016insitu ; Zhang2018Amorphous ; Luo2019plasticity . These processes lead to the formation of intricate structures, resulting in materials that exhibit remarkable combinations of mechanical and functional properties. These properties may encompass enhanced strengthShang2021ultrahard , ductilityLuo2019plasticity ; Hu2023amorphous , and impact toughnessHuang2020natural . Consequently, comprehending and revealing the controlling factors of mechanical amorphization ability (MAA) are of paramount importance.
As an alternative amorphization method, glass forming refers specifically to that produced through fast quenching. Empirically, the MAA of a material has been observed to plausibly correlate with its glass forming ability (GFA)Sharma2007criterion ; Sharma2008EffectON , that is, the ability of the achieved critical cooling rate when quenching the melt bypassing crystallization. In systems with stronger GFA (the slower critical cooling rate required), mechanical amorphization tends to occur more readily, e.g., a large negative heating of mixing and atomic size mismatch. Consequently, glass-forming systems have often been the focus of investigations in mechanical amorphizationKoch1983PreparationO ; Zhang2018Amorphous ; Hu2023amorphous ; Hemley1988PressureinducedAO . However, it’s crucial to recognize that these two non-equilibrium processes follow distinct pathways to achieve amorphous structures. In the glass-forming process, amorphous structures are preserved from the liquid state through rapid quenching, effectively circumventing crystallization. In contrast, mechanical amorphization introduces disorder into a crystalline structure. The connection between these two processes remains enigmaticSuryanarayana2018 ; Zhao2023amorphization . Furthermore, the obtained amorphous composition ranges in these two processes are inconsistent. Notably, in the case of mechanical alloying, materials with good MAA usually tend to be at the point of equal atomic ratio due to the relatively low Gibbs free energy of amorphous phaseLund2004MolecularSO , which contrasts with the eutectic points typically associated with glass-forming systemsPhysRevLett.91.115505 . Understanding the disparity between GFA and MAA, as well as unraveling the mechanisms and control factors governing mechanical amorphization, are pivotal questions that remain unresolved.
In this study, we employed mechanical alloying methods in both experimental and simulation settings to explore a range of glass-forming systems. Our primary objective was to delve into the mechanisms that underlie MAA and its correlation with GFA. Surprisingly, our experimental results contradicted the conventional wisdom. Contrary to empirical impressions, we observed an abnormal correlation pattern between MAA and GFA across all the systems investigated herein. In the simulation phase of our research, we further probed the relationship between GFA and MAA. Intriguingly, we found that this correlation could be modulated by varying the loading conditions. Under low-stress conditions, GFA exhibited a positive correlation with MAA, aligning with the empirical impression. However, under high-stress conditions, the correlation reversed, consistent with our experimental findings. To shed light on these unexpected results, we introduced a stress-dependent nucleation theory that offers a comprehensive explanation for both experimental and simulation outcomes. Our study identified the intensity of mechanical work contributed by external stress as the pivotal control parameter governing mechanical amorphization. The newfound tunability offers opportunities to subtly tailor amorphous-crystalline nanostructures with superior performance by mechanical amorphization.
II Experimental
II.1 Materials
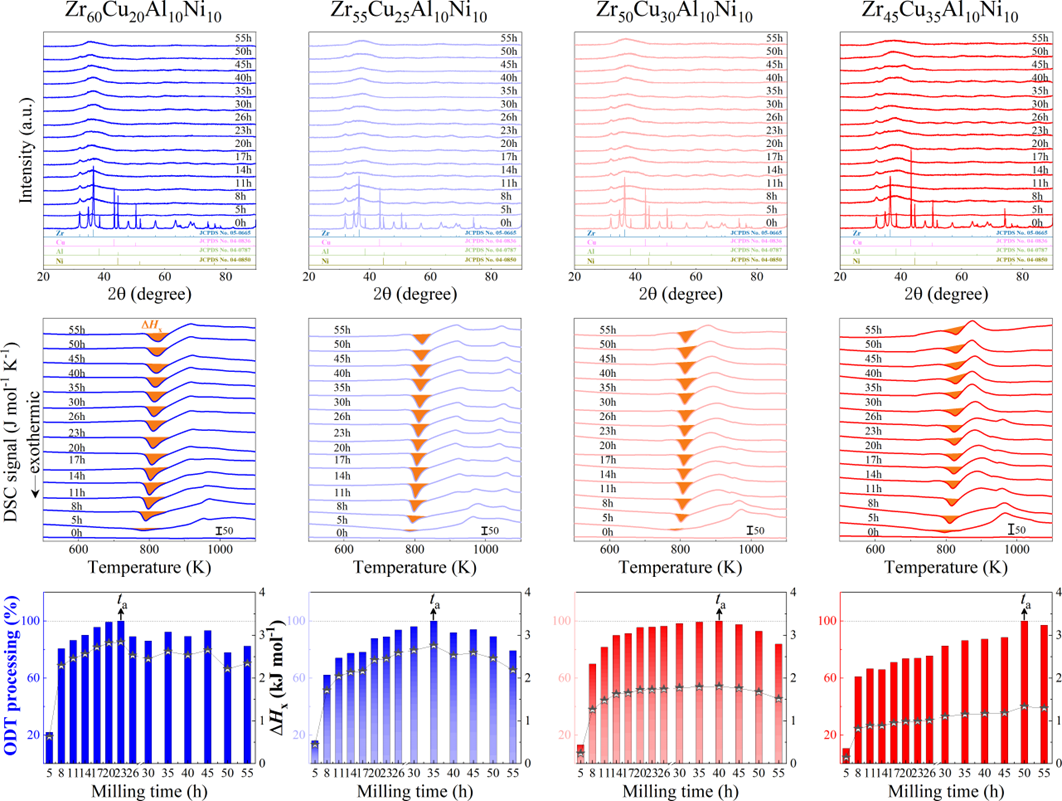
For ribbon preparation, binary CuZr (with nominal compositions of Zr50Cu50, Zr55Cu45, Zr60Cu40, Zr65Cu35), ternary CuZrAl (with nominal compositions of Zr45Cu45Al10, Zr47.5Cu42.5Al10, Zr50Cu40Al10, Zr52.5Cu37.5Al10, Zr55Cu35Al10, Zr57.5Cu32.5Al10, Zr60Cu30Al10, Zr62.5Cu27.5Al10, Zr65Cu25Al10, Zr67.5Cu22.5Al10, Zr70Cu20Al10, Zr72.5Cu17.5Al10), quaternary CuZrNiAl (with nominal compositions of Zr45Cu35Ni10Al10, Zr50Cu30Ni10Al10, Zr55Cu25Ni10Al10, Zr60Cu20Ni10Al10) alloys ingots were initially produced by arc melting mixtures of the raw metals Cu, Zr, Al, and Ni (with a purity of 99.9 wt. %) in an Ar atmosphere (with a purity of 99.9999%) purified with a Ti getter. All compositions are given in atomic percent. The ingots were flipped and remelted four times to ensure compositional homogeneity. Subsequently, glassy ribbons with a thickness of approximately 35 m were produced by melt spinning on a single Cu roller at a wheel surface speed of 35 m s-1 in a high-purity Ar atmosphere.
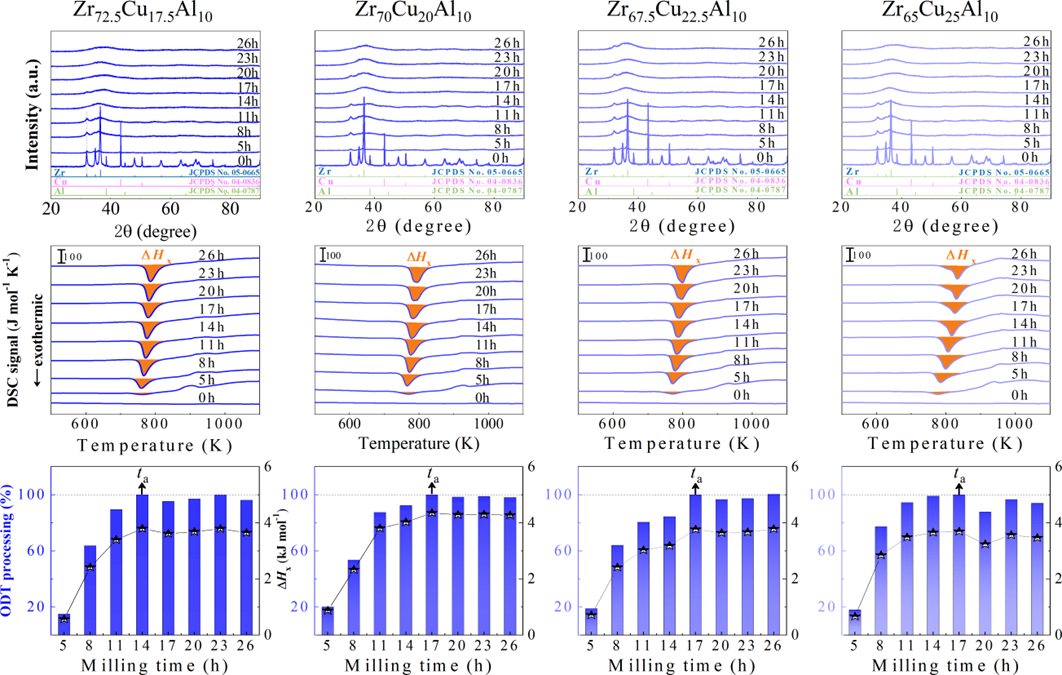
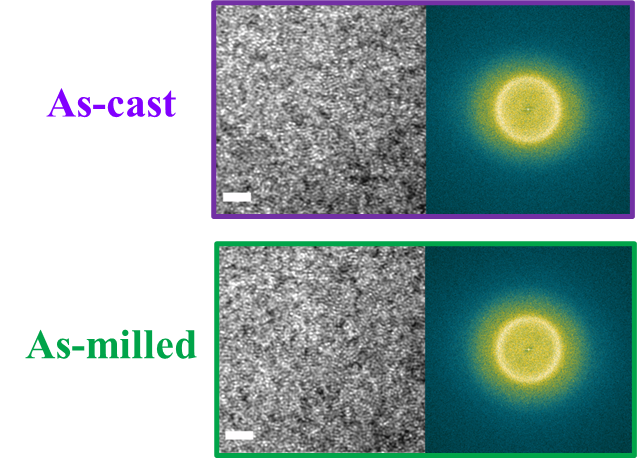
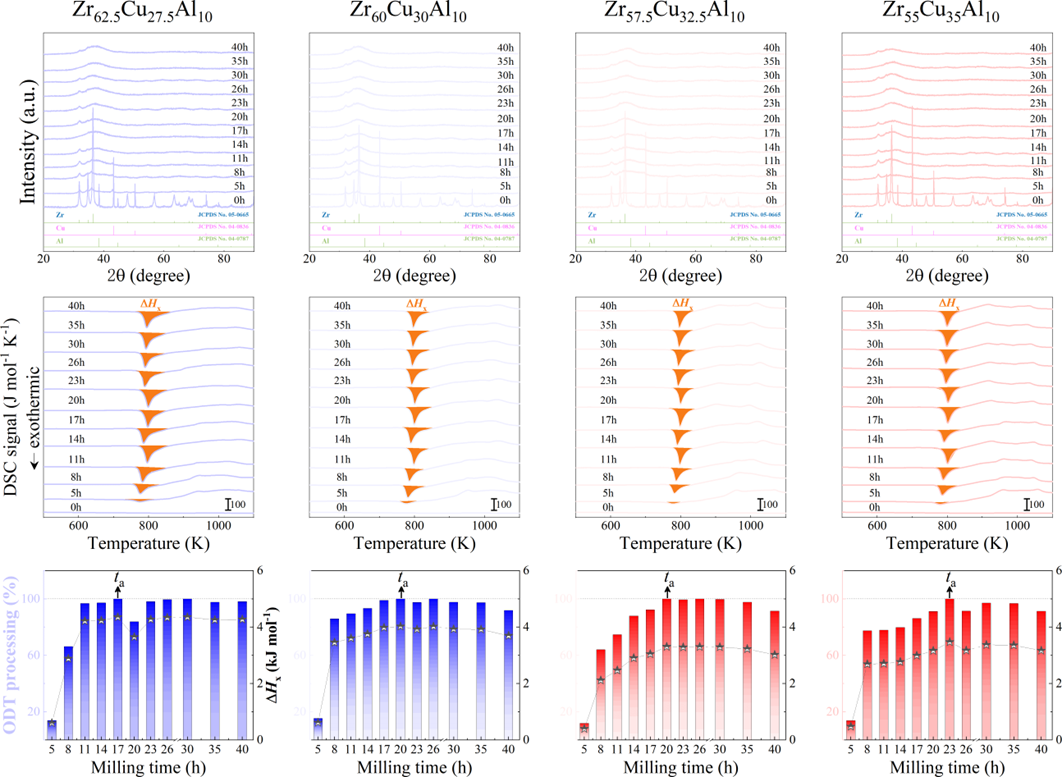
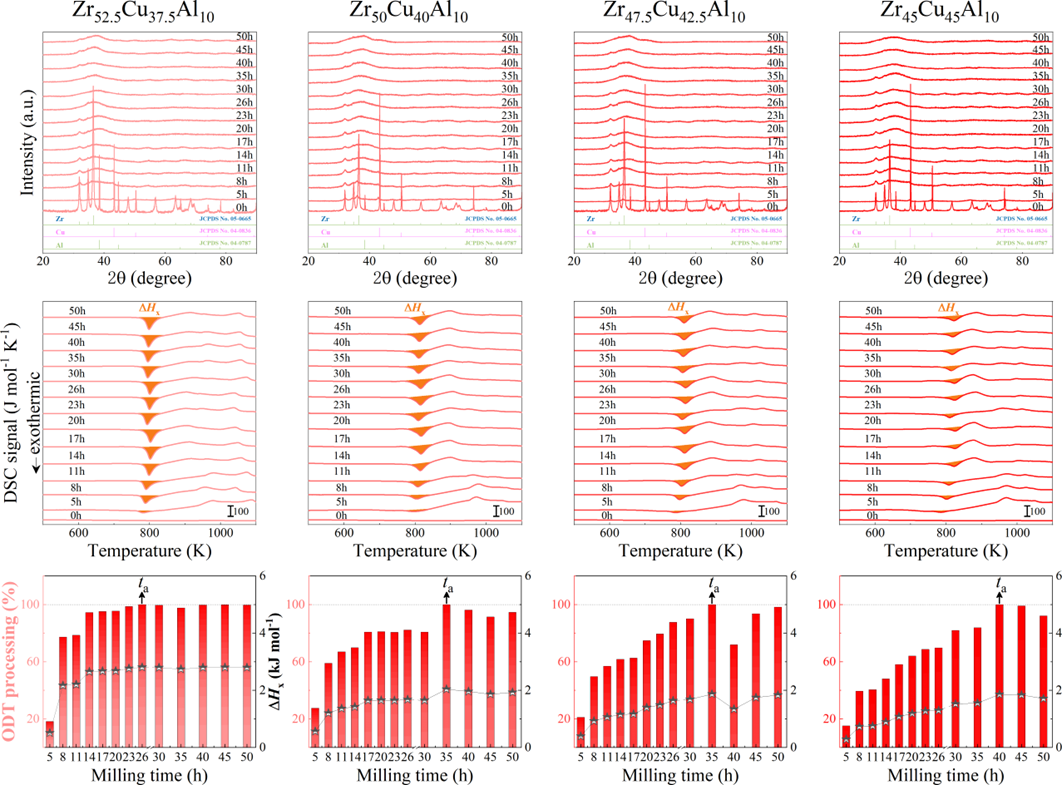
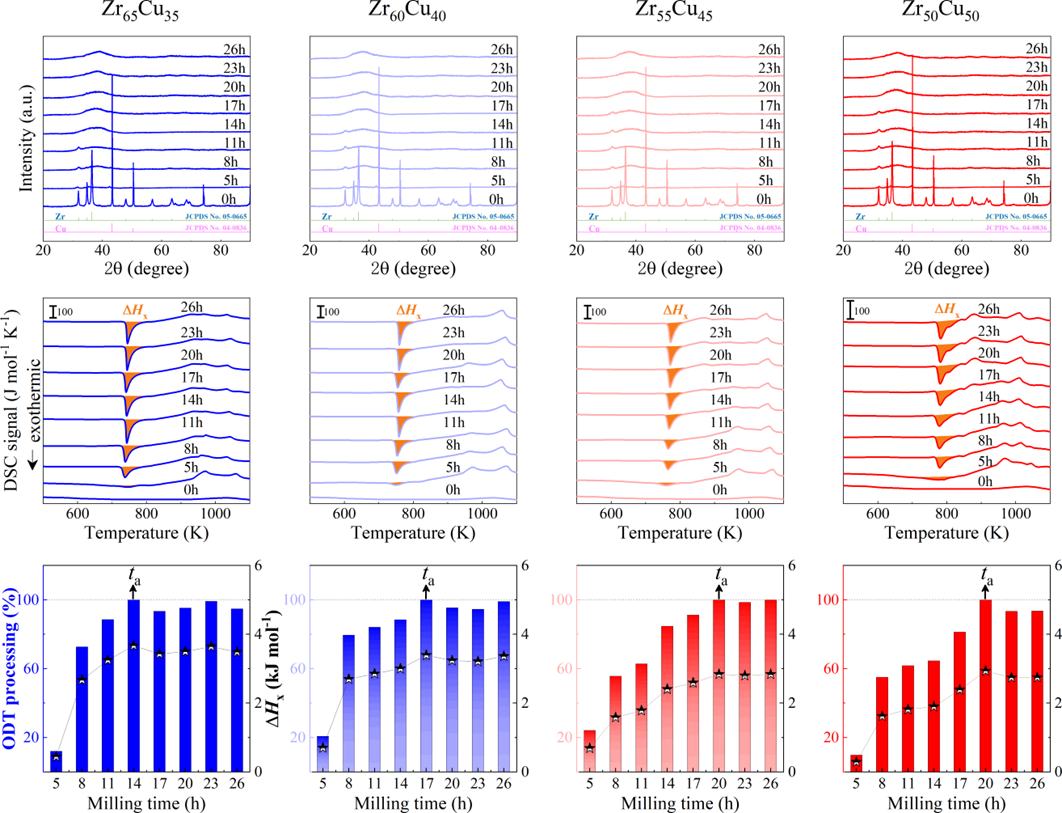
For powder preparation, the mixtures of elemental powders were mechanically alloyed. First, high purity metal powders ( 99.99 at. %) were weighted according to the corresponding nominal composition and blended in a plastic vessel at a speed of 50 rpm for 24 h under a high-purity Ar atmosphere. The blends were then mechanically alloyed in a planetary ball mill at speeds of 450 and 350 rpm (QM-2SP20; apparatus factory of Nanjing University, Nanjing, China) under a protective atmosphere of high-purity Ar atmosphere. A WC ball with a diameter of 20 mm and a ball to powder weight ratio (BPR) of 10:1 was used. As a parallel comparison, the milling experiments of speed 450 rpm and BPR 7:1 was performed. Approximately 5 g of the as-milled powders were taken out from the WC vials in intervals of 5, 8, 11, 14, 17, 20, 23, 26, 30, 35, 40, 45, 50, 55, 60, 65, 70, and 75 h for phase evolution and thermal analysis. Generally, it is accepted that only the presence of a diffraction halo indicates the full amorphization of element powders during ball milling. From a calorimetric point of view, amorphous phase exhibits an exothermic behavior at the elevated temperatures, called, crystallization (Fig. S1 middle part). Due to the accumulation of disordered structures (amorphous phase) during ball milling, the value of crystallization enthalpy increased monotonically with milling times and reached a maximum one until full amorphization (Fig.S1 lower part). Furthermore, the process of mechanical amorphization can be characterized by the reduced parameter , which is consistent with the evolution of XRD patterns (Fig.S1 upper part). Furthermore, high-resolution TEM images of as-milled amorphous phases presented the similar maze-like patterns with that of as-cast counterpart (Fig.S2). Hence, the MAA can be evaluated by amorphization time Ge2017 , corresponding to the moment that is equal to 1. The related details of the remaining alloys were seen from Figs. S3,S4,S5,S6.
II.2 Thermal analysis
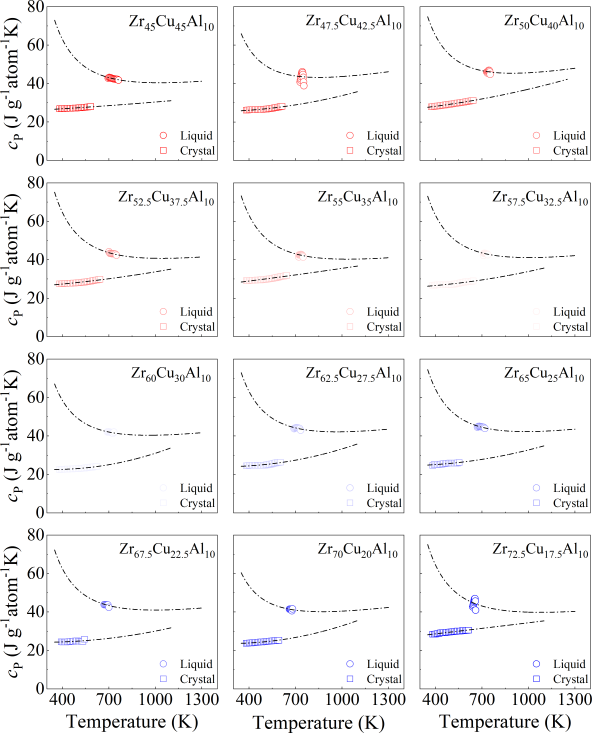
Each tested sample of approximately 25 mg was analyzed using a synchronous thermal analyzer in alumina crucibles under a high-purity of Ar atmosphere (STA-449 F3, NETZSCH, Germany). To ensure the reliability of the data, temperature and enthalpy were calibrated with an indium and a zinc standard specimen, giving an accuracy of 0.1 K and 0.01 mW, respectively. The scanning procedure was conducted at a heating rate of 20 K min-1 until complete melting, and then cooled to ambient temperature at 40 K min-1. A second run using the same procedure was used as a baseline for subtraction from the first run. The glass transition temperature (), onset of crystallization temperature (), and liquidus temperature () were determined as the intersection points of the tangents at the inflection points. The enthalpy of crystallization () was measured from the area between two curves. To investigate the kinetics of crystallization, the scanning procedure was carried out up to 823 K with various heating rates of 5, 10, 20, 50, 100, and 200 K min-1 (DSC 8000, PE, USA) to determine the dependent on heating rates. A second run using the same procedure was used as a baseline for subtraction from the first run. Heat capacity () of alloys considered here was obtained by comparing with that of a sapphire standard sample. Identical measurement procedures were performed on the empty pan as a baseline to be subtracted from the sample and the sapphire. The specific heat capacity of the sample can be determined by
| (1) |
where and are the mass and heat flow of sample, empty pan, and sapphire respectively; and represents the heat capacity of the standard sapphire.
II.3 High-resolution X-ray diffraction
Samples were placed in a borosilicate capillary with an outer diameter of 0.5 mm and a wall thickness of 0.01 mm. High-resolution X-ray diffraction (HRXRD) measurements were performed with a rotating Ag anode at a wavelength of 0.056 nm and a beam size of 8 mm 0.4 mm at a power of 9 kW (Smart Lab, Rigaku, Japan). The sample scanning speed is 1.5 per minute and the scanning range is from 20 to 90. Before amorphous samples were tested, a borosilicate capillary is firstly examined by HRXRD as a baseline.
II.4 Neutron diffraction
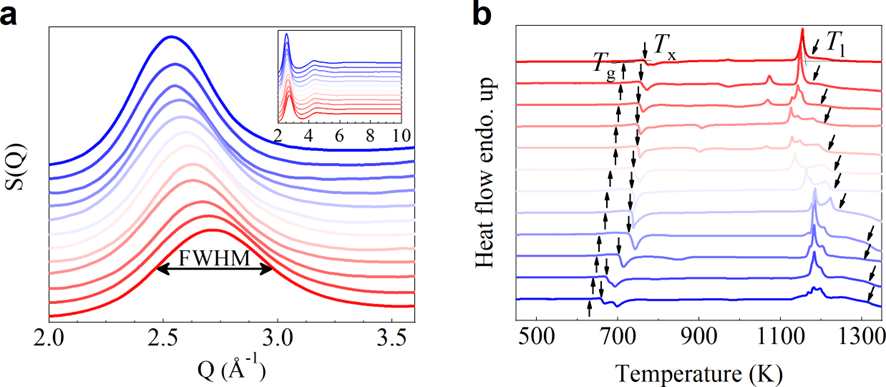
Neutron diffraction measurements were performed on the Multiple Physics Instrument (MPI) at China Spallation Neutron Source (CSNS)Xu2021multiphyiscs . Approximately 3 g of samples were placed in a vanadium can with an inner diameter of 8.9 mm and thickness of 0.25 mm. Single Diffraction pattern was measured for 6 h at ambient condition in the high-flux mode. The scattering data were analyzed using the Mantid software, which corrected, normalized and collated the information from the 7 banksArnold2014Mantiddata . To obtain a high resolution over a large distance range, the instrument resolution was initially assessed using a Si powder (SRM 640f, NIST) before amorphous samples were tested. The was expected to reach 0.39% at 1 Å. The normalized shape profiles of single pixel for the Si (422) peak show that the resolution of FWHM is 0.36%.
II.5 Electron microscopy
TEM specimens were carefully ion milled with 3 keV Ar ions for about 5 h at the liquid nitrogen temperature (PIPS II-695.c, Gatan, USA). High-resolution transmission electron microscopy (HRTEM) measurements were performed using a field emission gun TEM (JEM F200, JEOL, Japan) at 200 kV.
II.6 Molecular dynamic simulation
II.6.1 Initial sample preparation and loading process
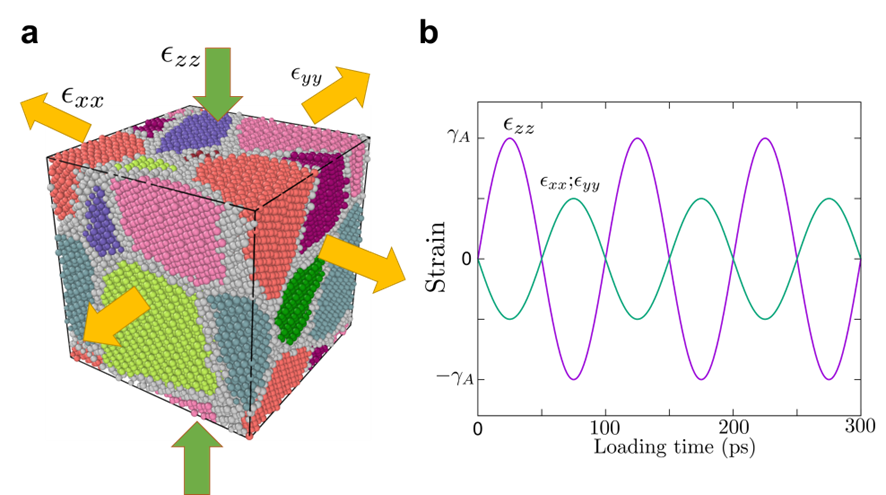
The mechanical amorphization in various glass-forming systems was investigated through molecular dynamics simulations. Initially, polycrystalline structures for the Cu-Zr system was generated using the Atomsk packageHirel2015Atomsk . The simulation box dimensions were set to 10 nm 10 nm 10 nm, and eight grains of the corresponding alloy phase were created using Voronoi tessellation. The average grain diameter was about 5 nm. For the Cu-Zr system, two different alloy phases, namely CuZr B2 phase and CuZr2 phase, were used in the polycrystal structure. The CuZr sample consisted of approximately 58000 atoms, and the CuZr2 sample contained around 52000 atoms. Interatomic interactions were modeled using semi-empirical potentials based on the embedded atom model (EAM) for the Cu-Zr systemMendelev2019development . Molecular Dynamics simulations were conducted using the open-source software LAMMPSThompson2021LAMMPSA . The simulation time step was set to 2 fs, and periodic boundary conditions were applied in all dimensions. The OVITO packageStukowski2009visualization was employed for atomic visualization. To enhance statistical significance and estimate error bars, five independent samples with random crystal orientations were used for each system. The initial sample was first minimized at 0 K to balance the grain boundary and then maintained at 300 K with the isothermal–isobaric (NPT) ensemble at ambient pressure using the Nosé-Hoover thermostat and barostatNos1984AUF ; Martyna1994ConstantPM for 200 ps. The ball milling process can be mimicked by cyclic loading processLund2004MolecularSO ; Rogachev2022MechanicalAI , in this study, we employed pure shear oscillatory deformation to investigate the mechanical amorphization phenomenon introducing by mechanical alloying. The sinusoidal loading was applied along the z-direction, and opposite loading was applied along the x and y directions. The strain along the z-direction followed the form , where represented the strain amplitude, and denoted the periodic time, which was kept constant at 100 ps (see Fig. S7). Additionally, the strain along the x and y directions followed the form . During the loading, the temperature was maintained at 300 K by Nosé-Hoover thermostatNos1984AUF ; Martyna1994ConstantPM .
II.6.2 Characteristic of the degree of disorder
In our study, we assessed the degree of disorder during the loading process by calculating the “Order”. The order bond between two neighboring atoms, denoted by and , was established using the scalar product:
| (2) |
where represents the standard bond-orientations parameterPhysRevB.28.784 , and is the corresponding complex conjugate.
To identify an order bond between neighboring atoms and , we considered . The local degree of disorder for atom was determined by a summation of all the order bonds involving atom :
| (3) |
where is the step function, and represents the number of neighbors of atom . By averaging the “disorder” over all atoms in the simulation box, we obtained the “Disorder”. In a perfect order state, , whereas in a disordered state, Disorder is high and approaches oneAuer2004numerical ; Russo2012microscopic .
II.7 Gibbs free energy difference between the liquid and crystalline states and interfacial energy
The calculated difference in the Gibbs free energy between the liquid and crystalline states is given by
| (4) |
where is the heat of fusion, is the entropy of fusion, rendering . , the temperature at which the Gibbs free energy of the liquid and the crystalline states are equal, was taken to be the temperature at which the endothermic peak is maximum during melting. The heat capacity of a crystal well above the Debye temperature can be described byGlade2000ThermodynamicsOC
| (5) |
The heat capacity of an undercooled liquid can be described byGallino2010KineticAT [41]
| (6) |
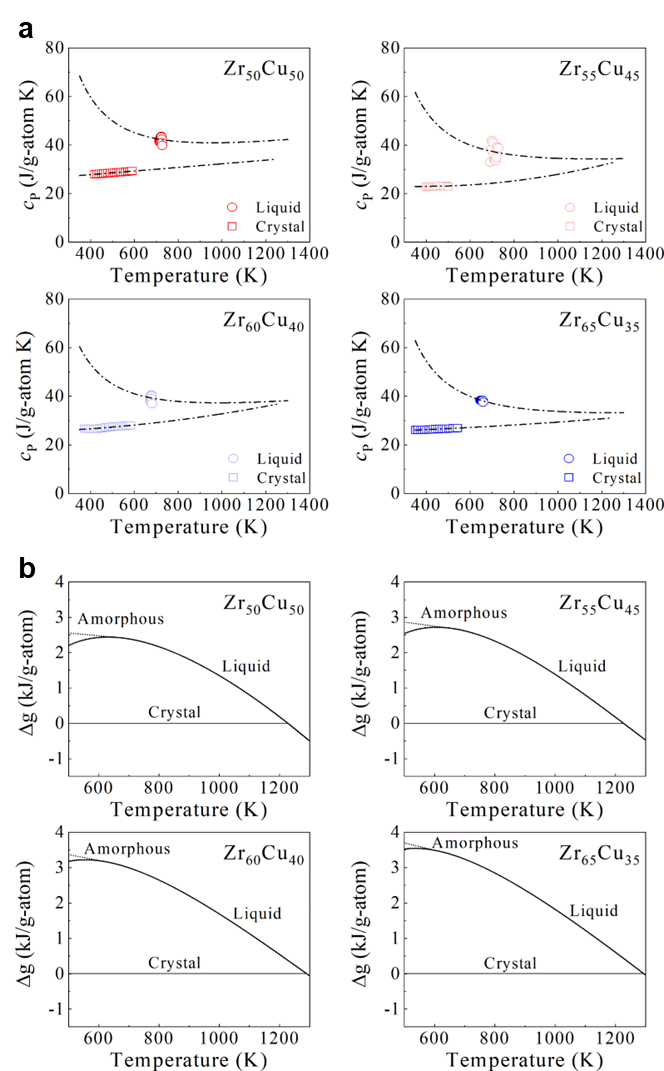
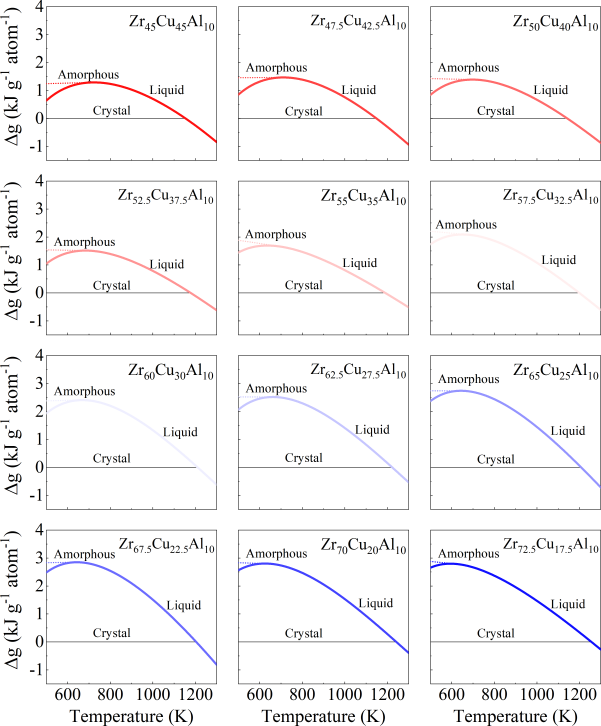
where is gas constant, rendering R= 8.3145 J g atom-1 K-1, and , , , and are fitting constants. The constants for both fits to the specific heat capacity data for each of alloy systems were summarized in Supplementary Table S2. The difference in the specific heat capacity of the liquid and the crystalline states, , was shown in Fig. S27. The counterparts for binary and quaternary were depicted in Figs. S16a and S17a. Correspondingly, Figs. S16b, S17b, and S28 show the difference in the Gibbs free energy between the liquid and crystalline states for binary, quaternary, and ternary alloy systems respectively. In general, interfacial energy is difficult to be experimentally measured. Turnbull pointed that a relation exists between the liquid-crystal interfacial energy and the heat of fusionTurnbull1950FormationOC . Such a relation can be described by
| (7) |
where is the gram-atomic volume of the crystalline phase, is the Avogadro constant, is the fitting parameter. Turnbull also found that while data for most of metals fit on a line with slope , Ge, Sb, and Bi were best fit by a line with slope 0.32Turnbull1950FormationOC . Hence, is used in this work.
II.8 Determination of total work
Regardless of shear stressHe2016insitu ; Hu2023amorphous or hydrostatic stressHemley1988PressureinducedAO ; Zhao2015pressure , each of stress state can drive amorphization. Both stress components (including the maximum shear stress or hydrostatic stress P) are determined by the generalized Hooke’s law, as detailed in Supplementary Note 1. Patel and CohenPatel1953CriterionFT were the first to quantitatively study the effect of stress states on the phase transformation under quasi-static loading by rationalizing the total work, . Here, is volume shrinkage between amorphous and crystalline phase. The atomic volume of amorphous phase is determined by the relationship proposed by Ma et al.Ma2009PowerlawSA based on experimental values of (the position of first peak in plot of versus of Q, see Figs. S8a and S9). The of crystalline phase is estimated from the equilibrium phase diagram using the lever rule. is the shear strain, rendering (G is the shear modulusWang2012TheEP ). Hence, .
III Results
III.1 GFA of binary, ternary, and quaternary glass-forming systems
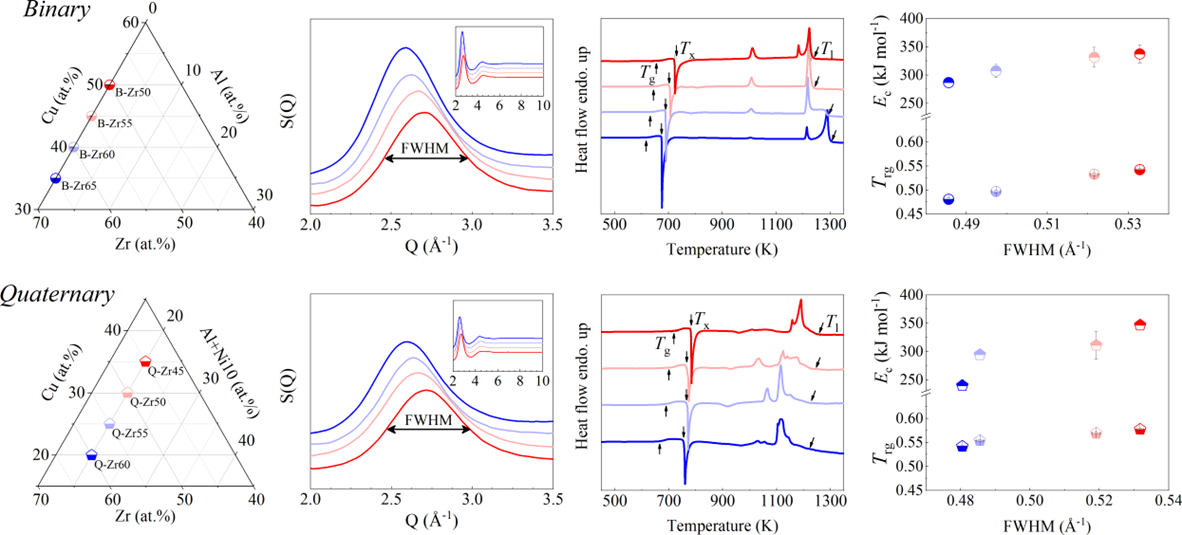
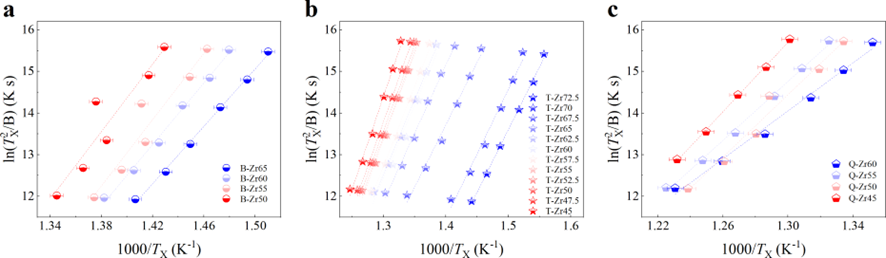
In this study, we selected a series of Zr-based alloys as representative materials. These alloys are renowned for their superior GFA and have been extensively examined in the prior studiesPhysRevLett.94.205501 ; PhysRevLett.115.165501 ; Li2008matching ; Zhu2016 ; PhysRevLett.106.125504 ; Luo2018UltrastableMG ; Yu2013ultrastable . Specifically, we considered binary ZrCu, ternary ZrCuAl, and quaternary ZrCuNiAl alloys with varying Zr content, denoted as B-Zrx, T-Zrx, and Q-Zrx ( representing the Zr atomic content), respectively. The composition variations within the binary ZrCu, ternary ZrCuAl, and quaternary ZrCuNiAl alloys are detailed in Figs. 1 a, b, and c respectively.
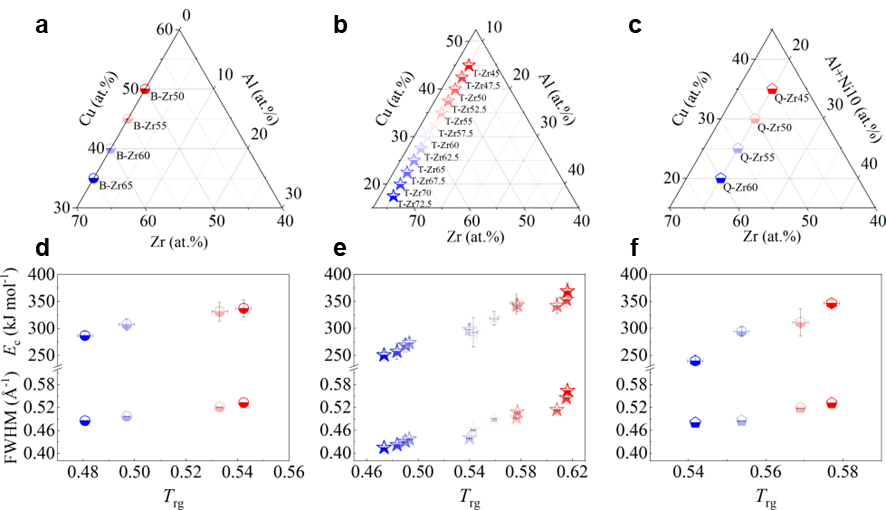
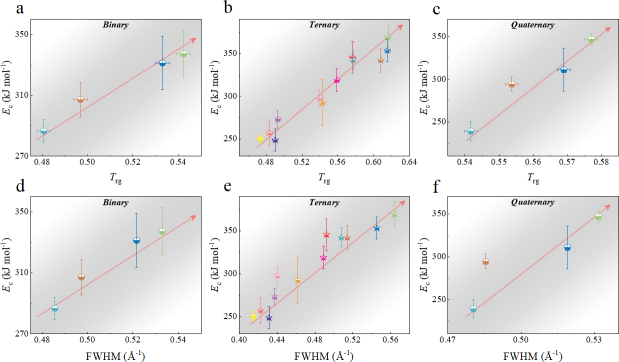
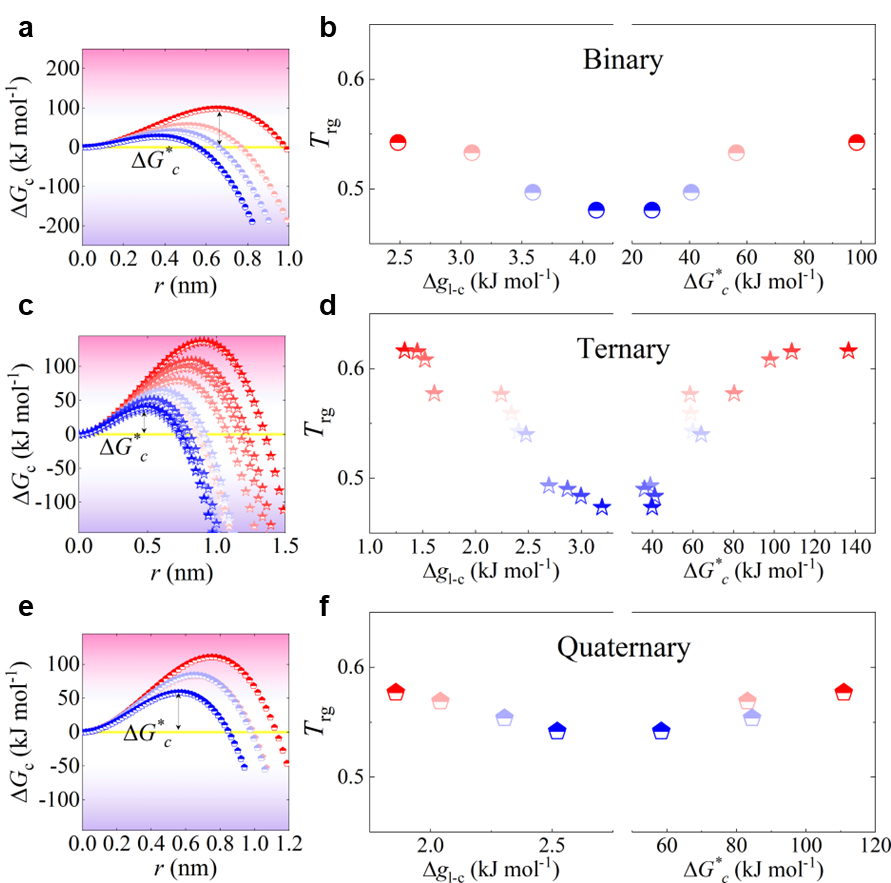
We commenced by characterizing the GFA of each composition using three well-established parameters: the calorimetric parameter reduced temperature ()Turnbull1969UnderWC , the energetic parameter crystallization activation energy Wang2012TheEP , and the structural parameter full width at half maximum (FWHM) of the first peak in Li2021datadriven . Detailed experimental procedures are outlined in the Experimental section and the Supplementary Materials (Supplementary Note 2 and Fig. S8). For alloys with stronger GFA, all , , and FWHM are expected to be larger. In our investigated systems, these parameters exhibit a consistent correlation with each other, as depicted in Figs.1 d, e, and f for binary, ternary, and quaternary alloys respectively. Specifically, the FWHM of T-Zr72.5 and T-Zr45 are a minimum and maximum value of 0.41504 and 0.56429 Å, respectively, which are among the reported range of Åfor as-deposited ZrCuAl glass libraryLi2021datadriven . Obviously, the values of Trg and for the bulk glass former T-Zr45 are 0.616 and 0.408, larger than those of the marginal glass former T-Zr72.5, respectively. From a structural and calorimetric point of view, these results indicate that GFA of ternary alloy system herein decreases with the increasing Zr content. Similarly, a relationship between GFA and Zr content of alloy materials also exists in binary and quaternary systems as shown in Figs.1 d and f respectively. The related details of binary and quaternary alloys are seen from the Fig. S9.
III.2 Reversal of MAA and tunable correlation between MAA and GFA for glass-forming systems
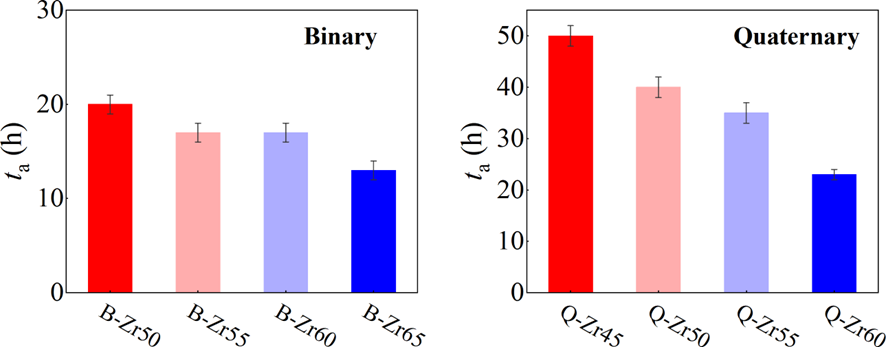
In our investigation of mechanical amorphization, we employed a technique known as mechanical alloying (MA). This process involves subjecting a mixture of powders to high-energy collisions by milling balls within a confined vessel. The continuous input of energy through mechanical milling imparts disorder to the powder materials, facilitating their transformation towards an amorphous phaseSuryanarayana2019MechanicalAA . There are several advantages to using MA for studying mechanical amorphization. Firstly, it offers a high degree of control compared to other methods such as shock waves or intense plastic deformationGe2017 . Secondly, it enables the attainment of a fully amorphous state in the materialEckert1997mechanical . Moreover, perhaps the most crucial advantage is that MA provides an effective means to characterize mechanical amorphization ability. Specifically, the time taken for milling to achieve a fully amorphous state can serve as a quantifiable measure of this ability.
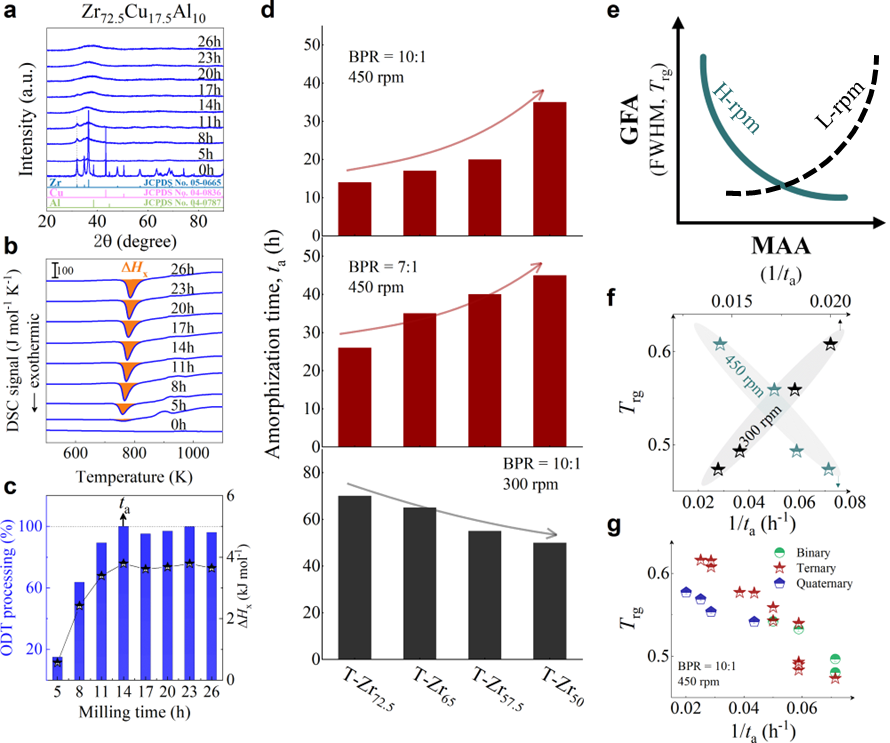
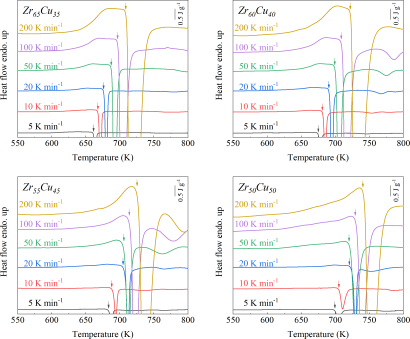
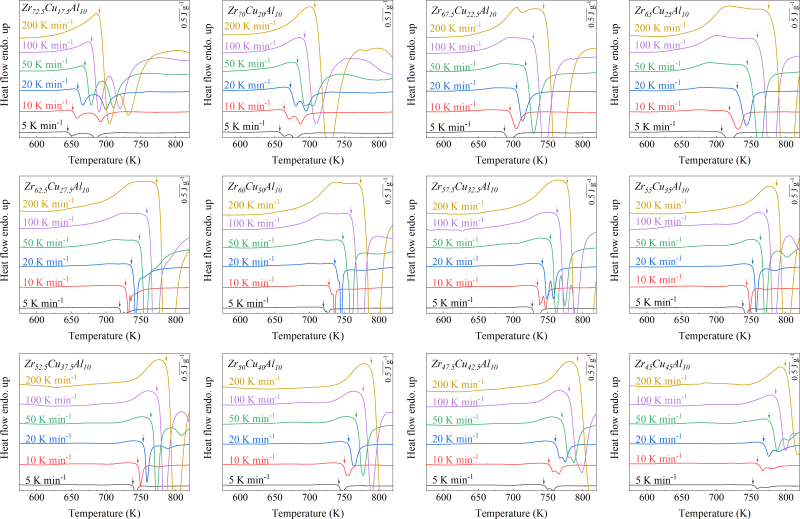
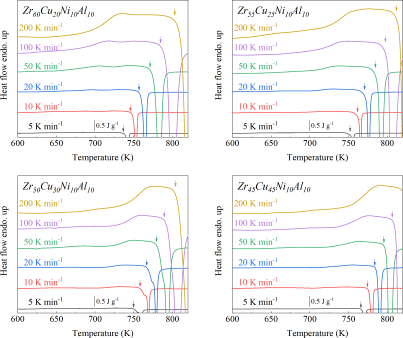
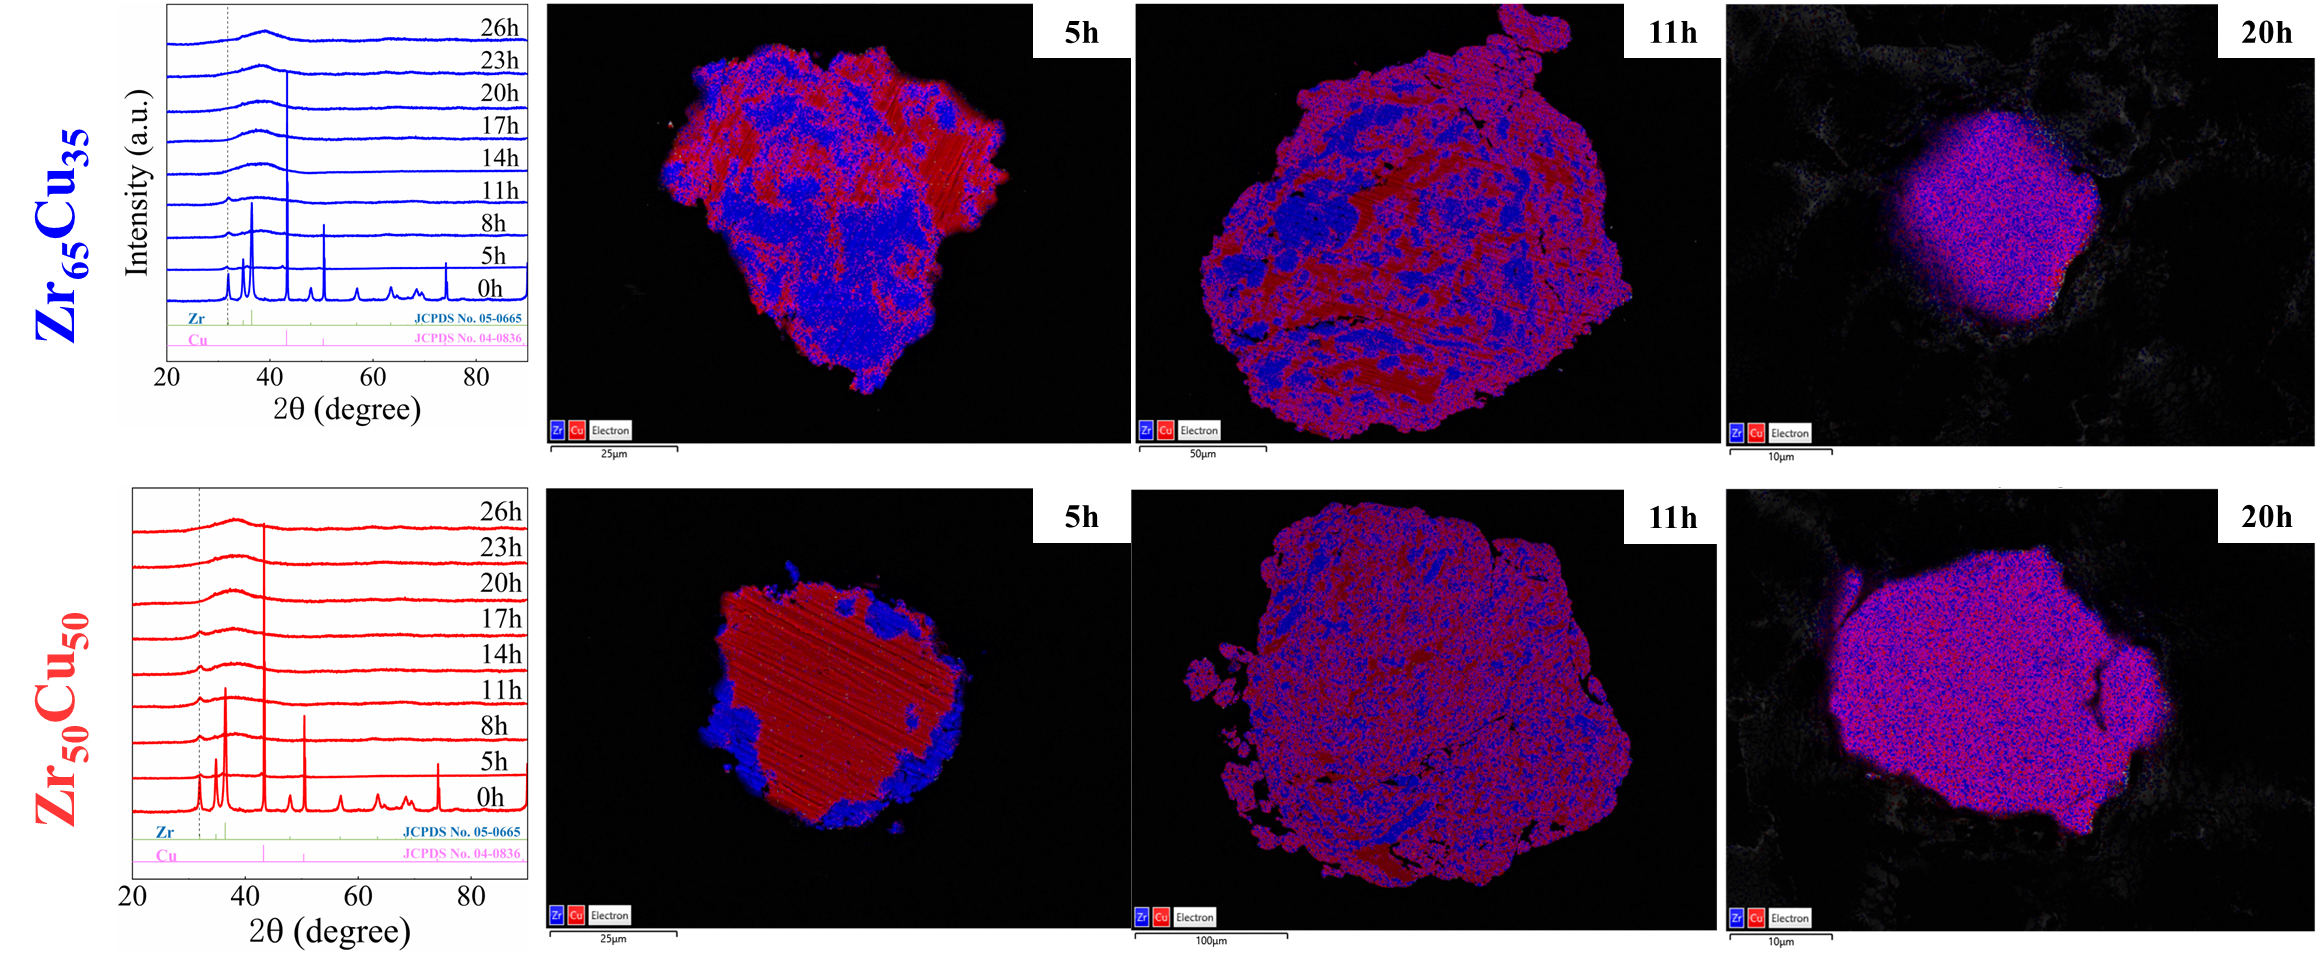
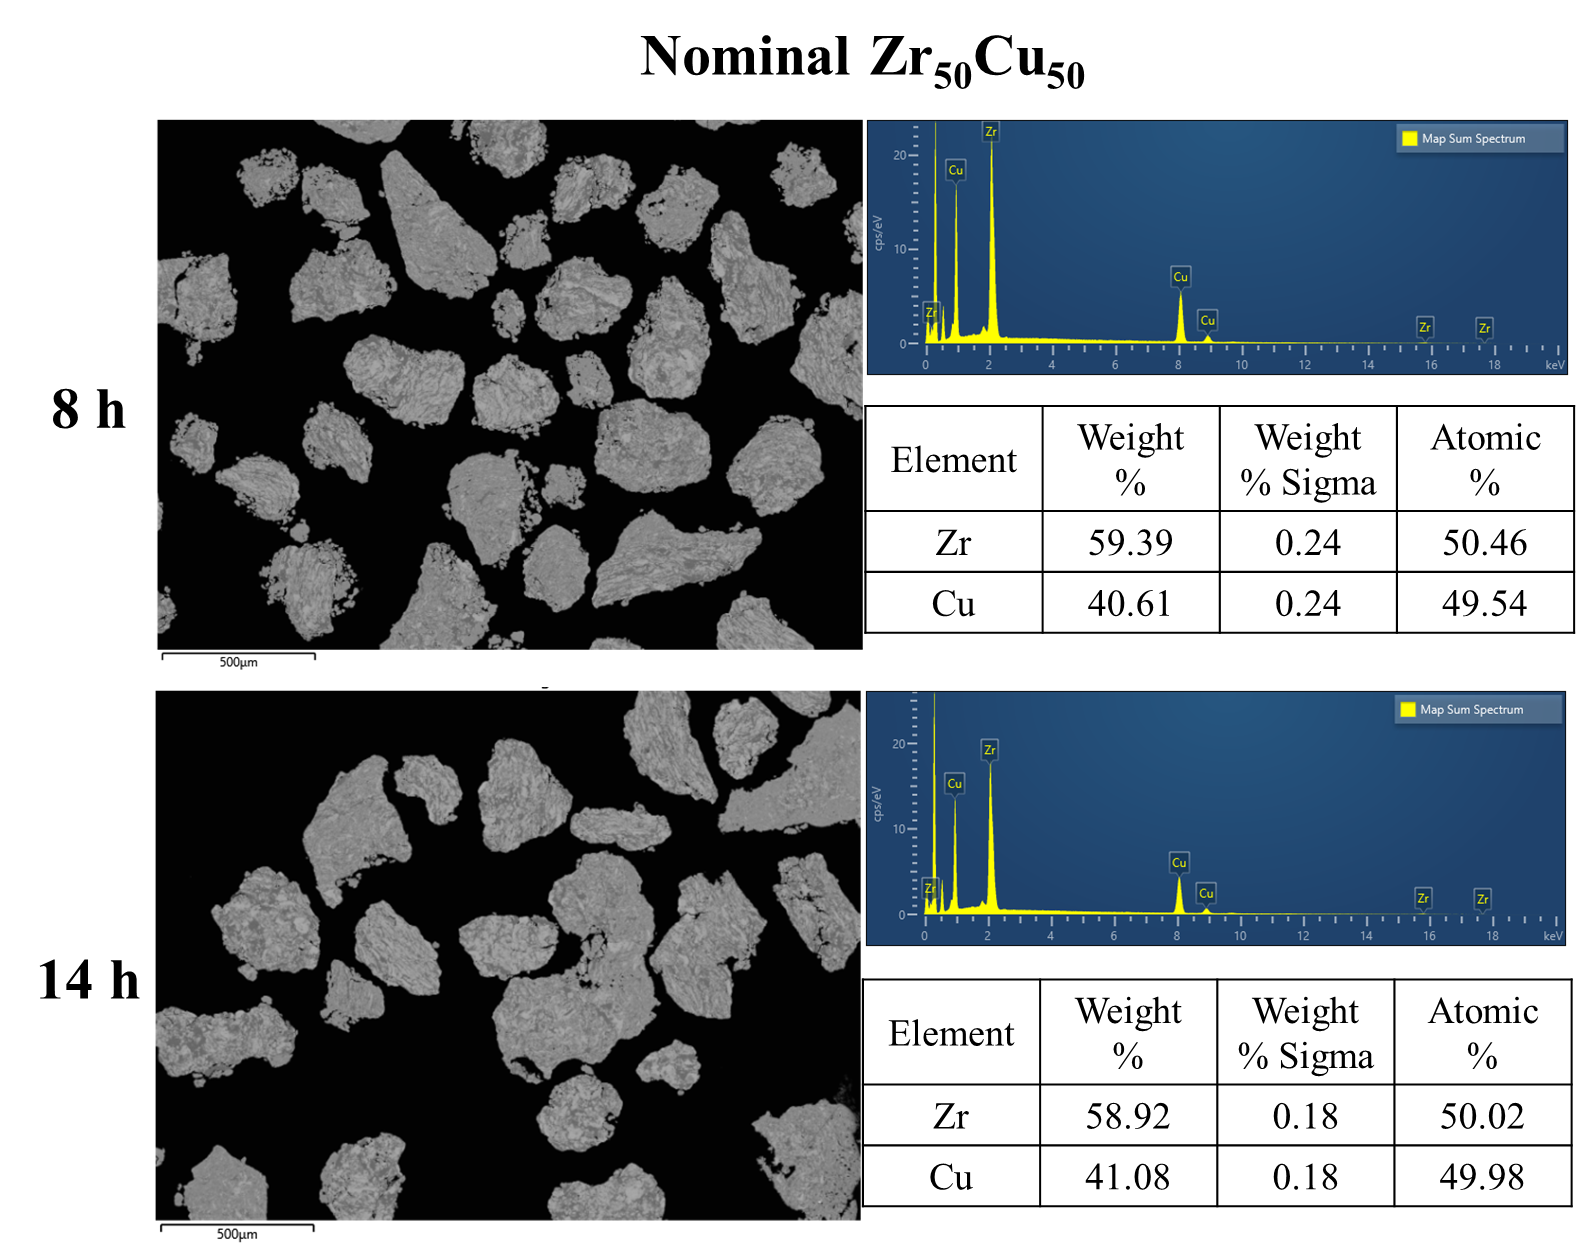
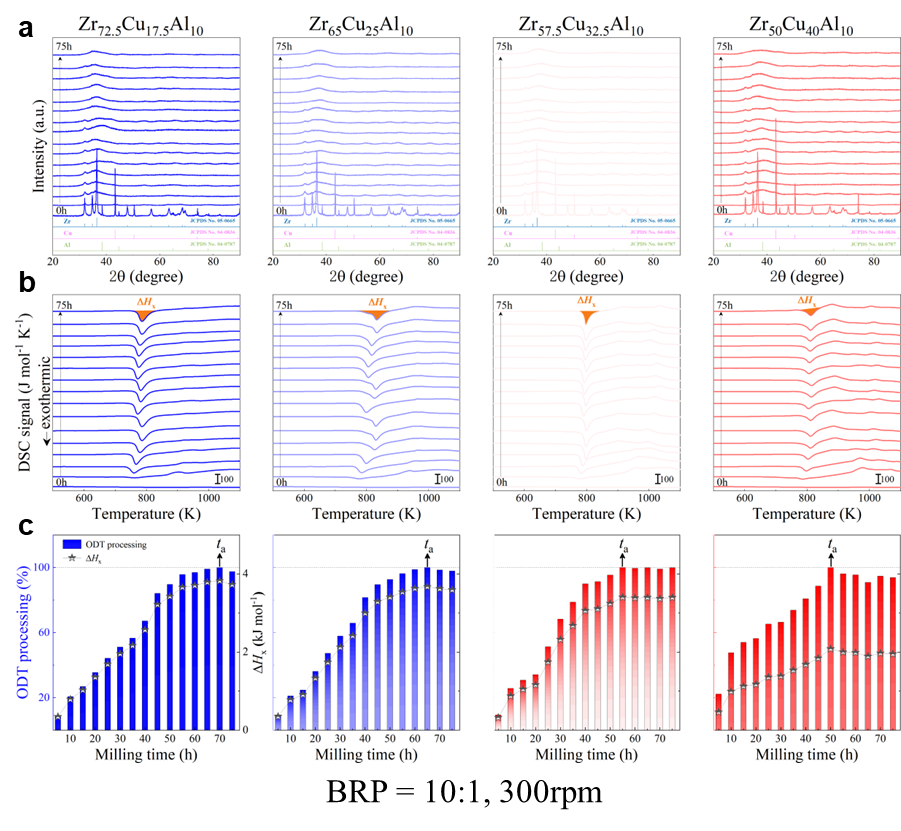
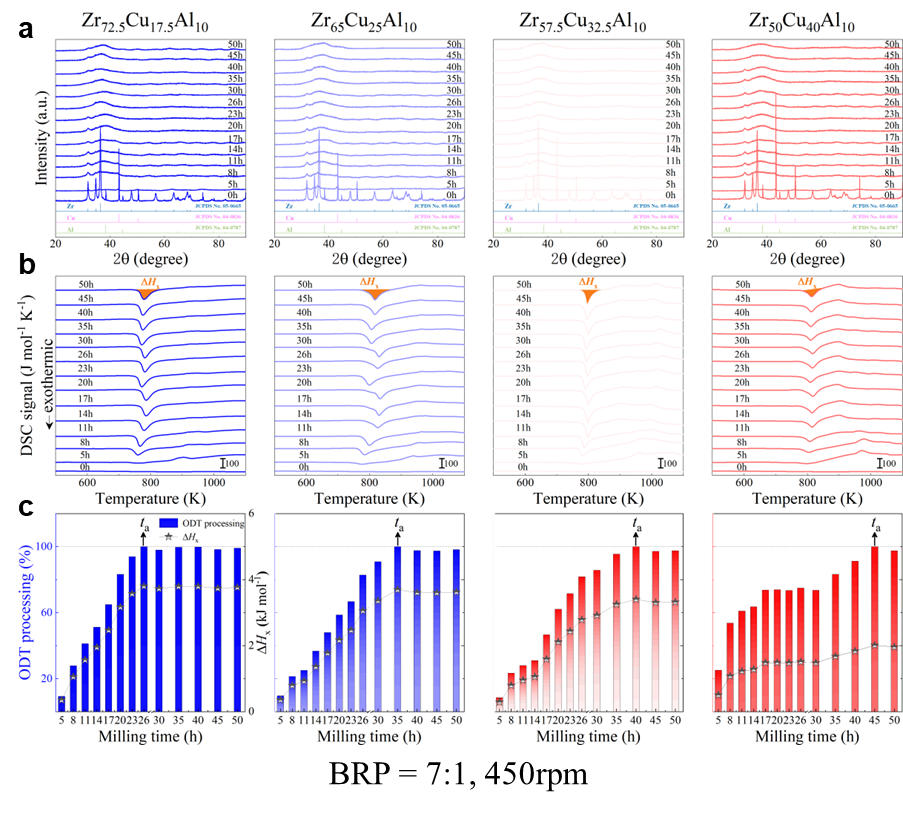
As shown in Fig. 2, XRD patterns (Fig. 2a) and heating flows (Fig. 2b) of T-Zr72.5 as a function of milling times depict the evolution of amorphization. Apparently, all the originals consist of peaks of the elementary metals Cu, Zr, and Al (Fig. 2a). With the increasing milling time, these diffraction peaks gradually attenuated and broadened, which is attributed to the introduction of disorder structures with collision-induced deformation. Such an interfacial reaction in a metastable state is promoted by continuous cold welding and fracturing of powder particles to create alternating layers with fresh interfaces, and by the generation of the abundant defects during ball millingLund2004MolecularSO ; Hellstern1986amorphization ; PhysRevLett.65.2019 . The composition varies negligibly with the advance of milling and keeps nearly with the equimolar ratio between Cu and Zr elements (see Fig. S22). In addition, no detectable contamination is found during MA. From a calorimetric point of view, due to the accumulation of disordered structures during the ball milling, this metastable phase exhibits an exothermic behavior at the elevated temperatures, called, crystallization (Fig. 2b). Furthermore, as shown in Fig. 2c, the value of crystallization enthalpy increases monotonically with milling times and reaches a maximum when the whole amorphous phase is formed. Remarkably, the amorphous microstructure obtained after ball milling may be different from that obtained by melt-spun. Mechanical amorphization via ball milling is indeed a thermodynamic-controlled stochastic process and is statistical index of the global process, similar to incubation timeTurnbull1969UnderWC during the crystal nucleation process in the undercooled liquid. Hence, this difference does not affect that , the time required to achieve amorphous phase via ball milling, is capable to discuss the composition dependence of MAA.
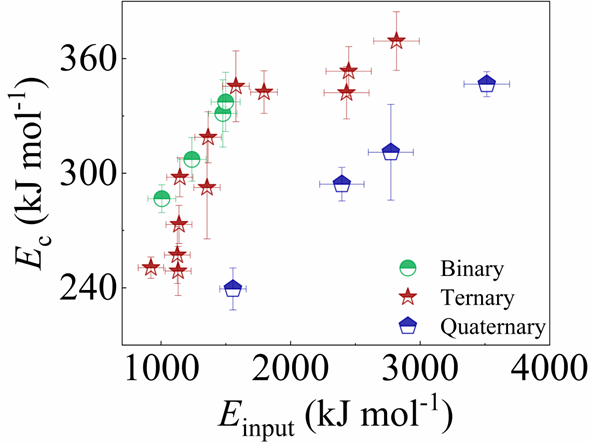
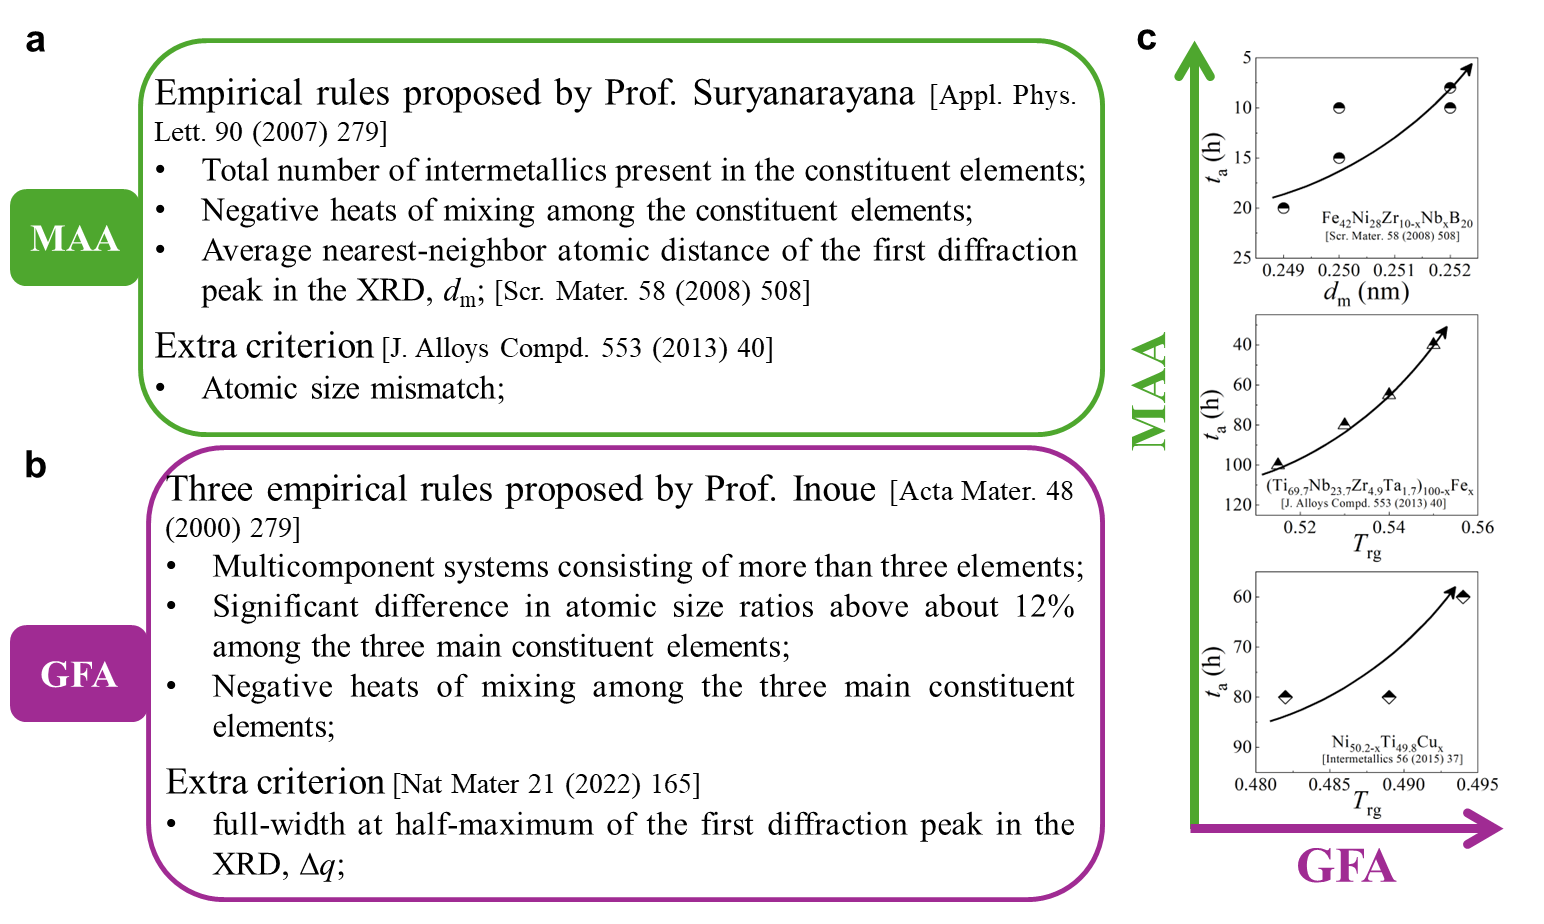
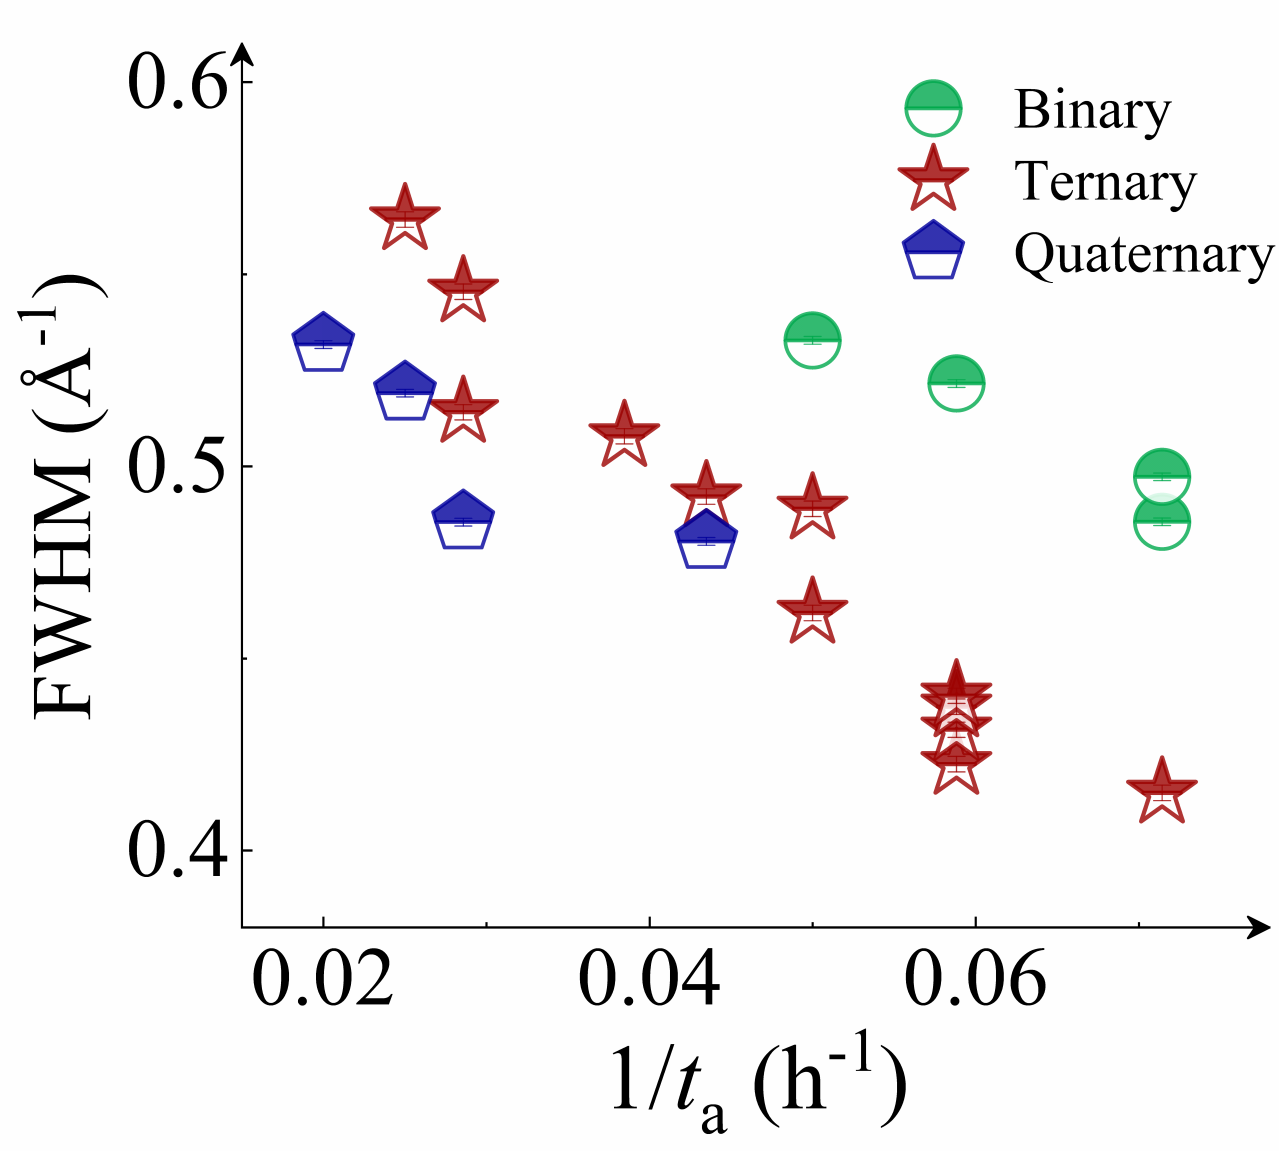
Next, we characterized the MAA using the milling time required to achieve a fully amorphous state Generally, for superior MAA, the is shorter, and vice versa. Another parameter used to characterize MAA is the input energy for achieving full amorphization during milling, which exhibits consistent results with (see Supplementary Note 3). For a specific component, the MAA, that is, the time of amorphization does change with the milling speed and BPR (Fig. 2d). Intrinsically, the variation of MAA at different milling conditions is ascribed to the underlying mechanical work. Previous studies have shown that under the same milling experimental conditions, the difference in MAA of different compositions is mainly explained by the criterion of GFASharma2008EffectON ; Sharma2007criterion ; Zou2013effect ; Yang2015effect , in other words, the system with large GFA tends to have a large MAA (Fig. S26c). Phenomenally, the empirical criteria of MAA proposed by Suryanarayana (Fig. S26a) are analogous to the Ionue’s three rules (Fig. S26b), such as atomic size difference and negative mixing enthalpy. However, Fig. 2e show that two types of correlations between MAA and GFA were both found and the positive one shifts toward the negative with the elevated milling speed (Fig. 2f), underlying the effect of mechanical work. Both the GFA indicators, (Fig. 2g) and FWHM (Fig. S29) parameters, exhibit an inverse relationship with MAA indicator, . The similar relationship exists in plots of with (Fig. S15). These suggest that, for materials with excellent GFA, the milling time tends to be longer, indicating a poorer MAA (green line of Fig. 2e). This observation challenges the prevailing empirical impression that a higher GFA in an alloy result in a faster mechanical amorphization However, our experimental findings reveal an inverse correlation between MAA and GFA.
III.3 Crossover between MAA and GFA in molecular dynamic simulation
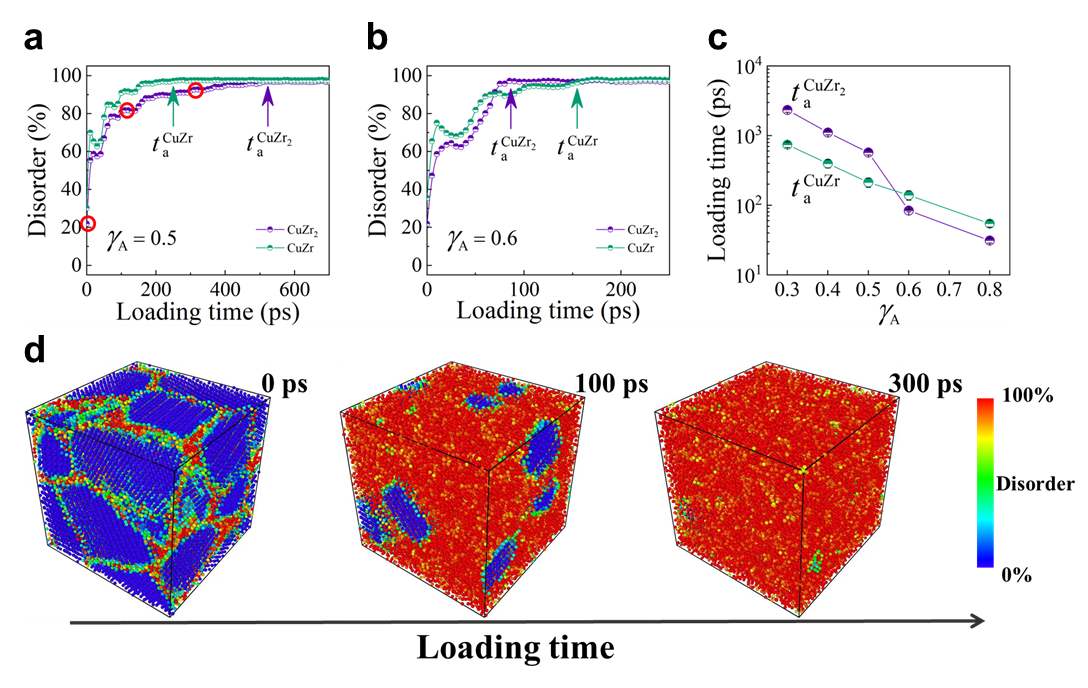
In our molecular simulations, we focused on two model alloys, equimolar CuZr and CuZr2, to investigate the phenomenon of mechanical amorphization. These two alloys are well-suited for this study due to their distinct GFA and their extensive examination in molecular dynamics (MD) simulationsHu2020physical . The polycrystalline structure comprises approximately 80% of these two phases. Notably, CuZr exhibits superior GFA compared to CuZr2. And we ensured the construction of polycrystalline structures for both model systems by employing similar grain sizes and crystalline orientations and the corresponding grain boundary energy is comparable (for a comprehensive description of the modeling procedures, please refer to the Experimental section). Fig. 3a illustrates the evolution of the Disorder degree over loading time. When the Disorder degree reaches a plateau value, we define this time as the mechanical amorphization time, denoted as . Consequently, the MAA of a system can be effectively characterized by its corresponding . In the regular cases, where is shorter, the MAA is considered better. For amplitude strain , we observed that , aligning with the conventional impression that strong glass-forming systems tend to exhibit better MAA. However, as depicted in Fig.3b, for , a different narrative unfolds. Here, the situation is reversed, with , consistent with the aforementioned experimental finding that stronger glass-forming systems paradoxically possess poorer MAA. This intriguing reversal indicates that the relationship between MAA and GFA is highly sensitive to external loading conditions. To delve deeper into this sensitivity, we conducted a series of systematic tests under various loading conditions, as elucidated in Fig.3c. These results unequivocally emphasize that the correlation between MAA and GFA is indeed contingent upon the subtle external loading conditions imposed on the system. Notably, for small stress, the MAA appears consistent with GFA, whereas for larger stress, the MAA inversely correlates with GFA. Furthermore, Fig.3d provides valuable insights into the spatial evolution of the Disorder degree throughout the mechanical amorphization process, hinting at a behavior reminiscent of melting.
IV Discussion
IV.1 The characterization of glass forming ability
The glass forming ability of an alloy system is theoretically attributed to two factors: the resistance to nucleation of crystallization and the resistance to growth of crystallization Turnbull1969UnderWC ; Johnson2016quantifying . The resistance to nucleation can be measured by the critical nucleation barrier (). Based on classical nucleation theory Becker1935KinetischeBD , the nucleation barrier can be expressed as follows:
where represents the Gibbs free energy difference between the liquid and crystalline states, and denotes the interfacial energy between the amorphous and crystalline phases. Both and can be determined experimentally (see Methods). As illustrated in Fig. 4a, c, and e, evolves with the crystal nucleus size r in binary, ternary, and quaternary systems, respectively. The highest energy barrier in Fig. 4, is referred to as the critical nucleation barrier. For our investigated systems, we found that all the GFA parameters used in the experiment are positively correlated with the critical nucleation barrier and negatively correlated with the Gibbs free energy difference . This indicates that the GFA of our investigated systems is primarily dominated by the resistance to nucleation.
IV.2 Mechanism of anomalous correlation between MAA and GFA
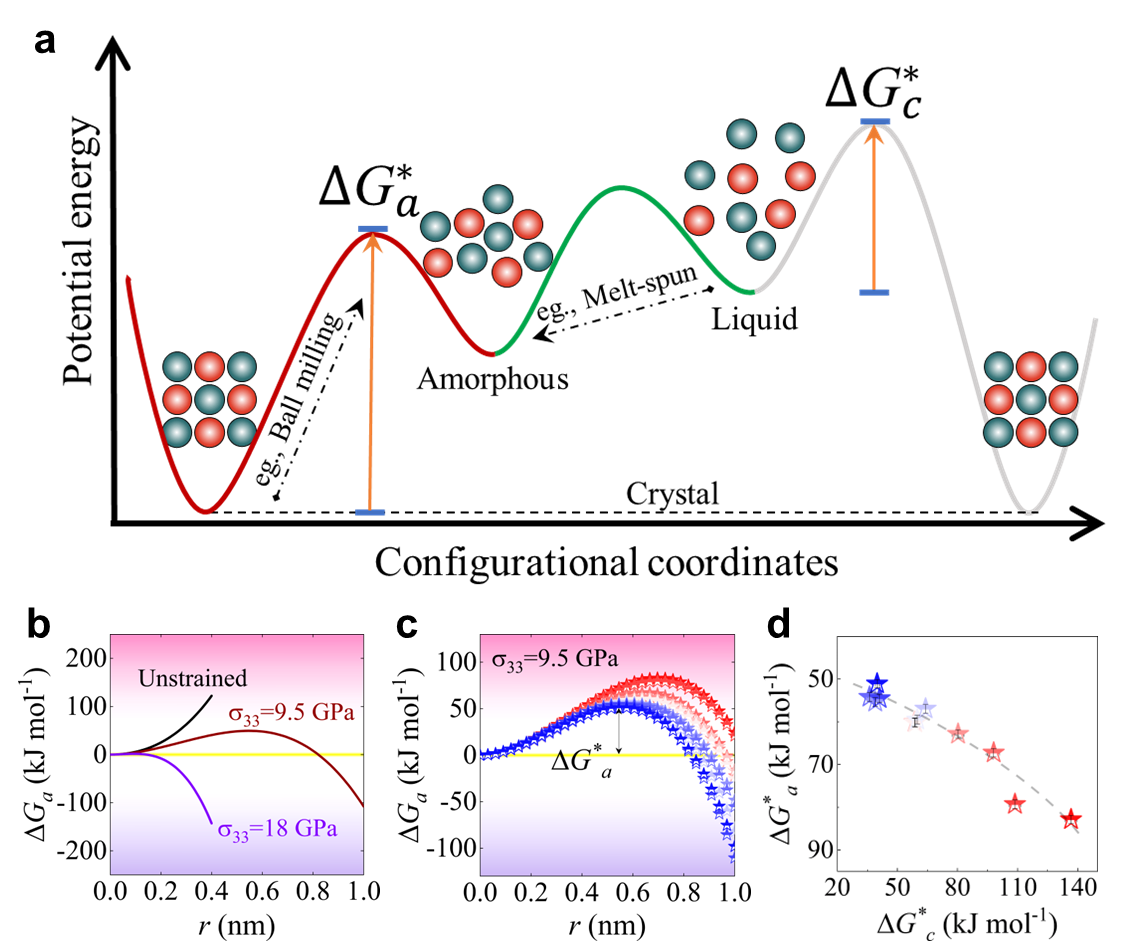
The control factors and mechanisms for modulating MAA remain enigmatic. Notably, the stress state appears to play a pivotal role in reconciling the disparities between experimental and simulation outcomes. From the perspective of the potential energy landscape (see Fig. 5 a), it becomes evident that mechanical amorphization and glass forming represent two fundamentally distinct pathways toward the formation of an amorphous phase. One pathway involves the introduction of disorder structures from a crystalline state, while the other revolves around the preservation of disorder structures and the avoidance of crystallization. Preservation of disorder structures in the liquid state can be likened, thermodynamically, to the energy barrier that resists crystallization (), In the context of mechanical amorphization, the process of crystalline structure dissolution bears a resemblance to amorphous embryo nucleation phenomena (Fig. 3d). At a temperature below melting temperature, the amorphization transformation must overcome a high energy barrier, making it impossible to occur under ambient condition. However, the high magnitude of the coupled hydrostatic pressure and associated deviatoric component dramatically lowers the energy barrier, rendering the amorphization transformation possible under shock compression. Following the Patel and Cohen methodology, the energetics of solid state amorphization of covalently bonded solids, such as siliconZhao2016AmorphizationAN ; PhysRevB.96.054118 , germaniumZhao2018ShockinducedAI , SiCZhao2021directional ; Levitas2012HighdensityAP , and B4CZhao2021directional , were analyzed by calculating of the external work varied with pressure and shear. In this regard, we introduce a modified version of the classical nucleation theory, widely employed to characterize the transition from a crystalline to an amorphous stateGlade2000ThermodynamicsOC ; Zhao2016AmorphizationAN . Within this framework, the energy barrier resisting amorphization, denoted as , can be expressed as:
| (8) |
where signifies the Gibbs free energy difference between the amorphous solid and crystalline states, while characterizes the interfacial energy between these two phases. represents the mechanical work induced by external loading. Note that, the introduction of crystal defects into metal powders during mechanical amorphization may lead to an increase in the free energy of the crystal phase, surpassing that of the hypothetical amorphous phase. Hence, the third term on the right-hand side of Eq. 8 represents the contributed energy penalty to overcome the energy barrier of amorphization, including the grain boundaries energy contributed by the exterior stress. As a result, the most significant energy barrier, denoted as, stands as a pivotal metric for the assessment of a material’s MAA. Notably, a higher implies a longer duration required to achieve amorphization, thus signifying a poorer MAA. At lower temperatures, particularly below the glass transition temperature, and exhibit insensitivity to temperature fluctuationsTurnbull1950FormationOC ; Busch1995ThermodynamicsAK . We therefore adopt the approximations and . The formula for mechanical work depends on the stress conditions. Here, we assume the material undergoes uniaxial compressive stress, denoted as . It’s important to note that different stress conditions can alter the value of , but they don’t change the qualitative conclusions. The relationship between and is detailed in the Experimental section.
Fig. 5c clearly demonstrates that various loading stresses notably influence MAA. Under a fixed loading stress condition, such as GPa, different materials exhibit varying MAA levels (see Fig. 5d), consistent with the experimental results presented in Fig. 2 d. Moreover, the correlation between and reaffirms the inverse relationship between MAA and GFA in ternary ZrCuAl alloy systems (Fig. 5e), in line with the experimental observations (Figs. 2 f and 2 g).
IV.3 Tunable ability of mechanical amorphization dependent on external stress
Therefore, using the above calculation frameworks, we can establish the relationship between MAA and GFA as follows:
| (9) |
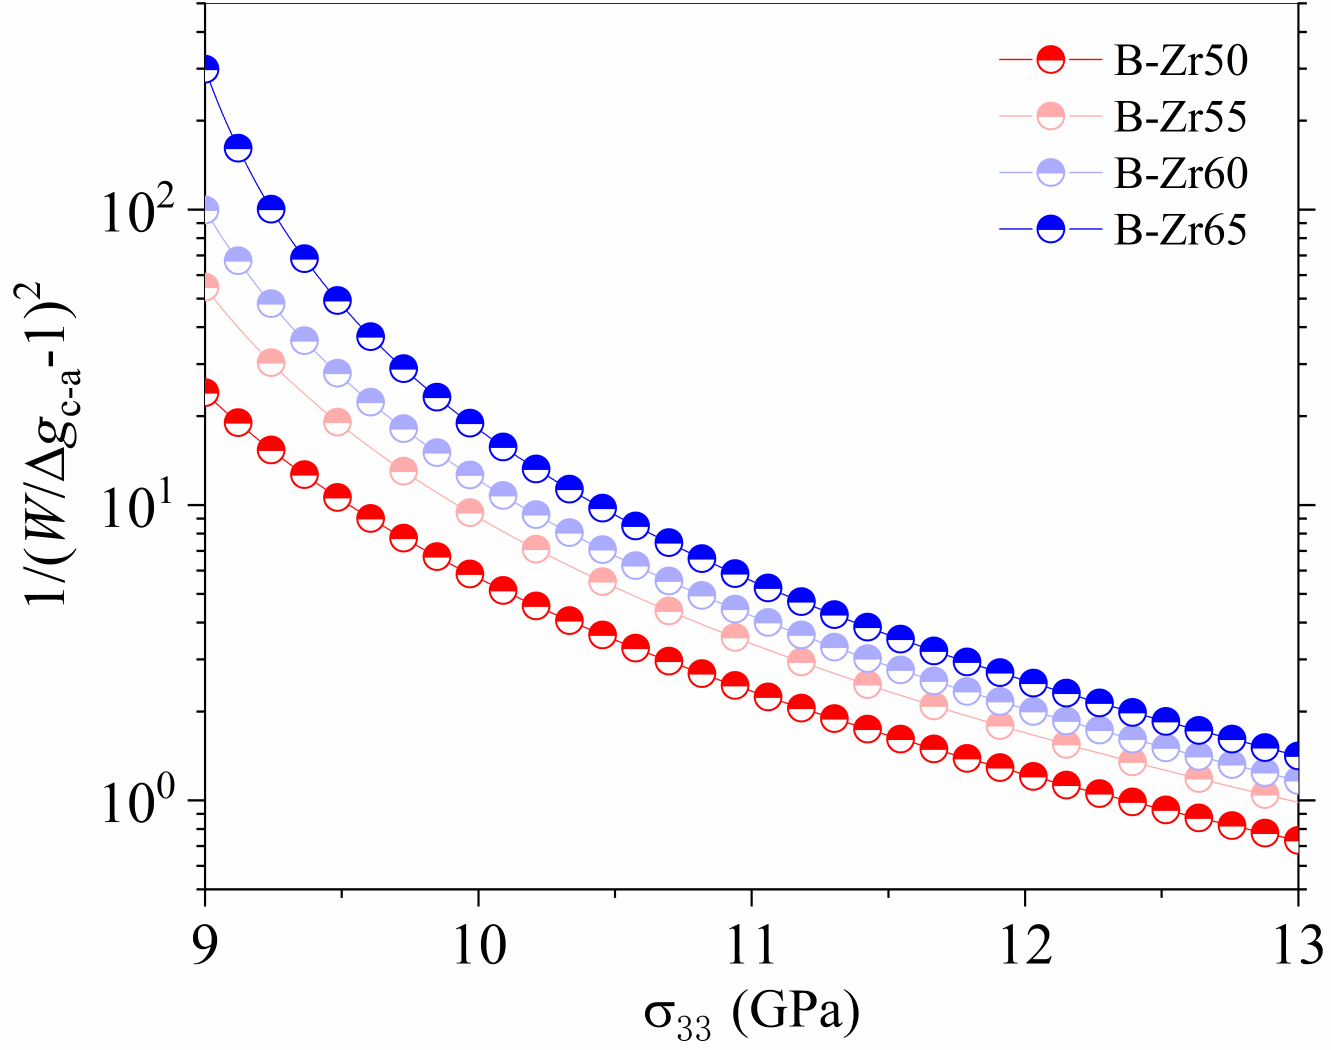
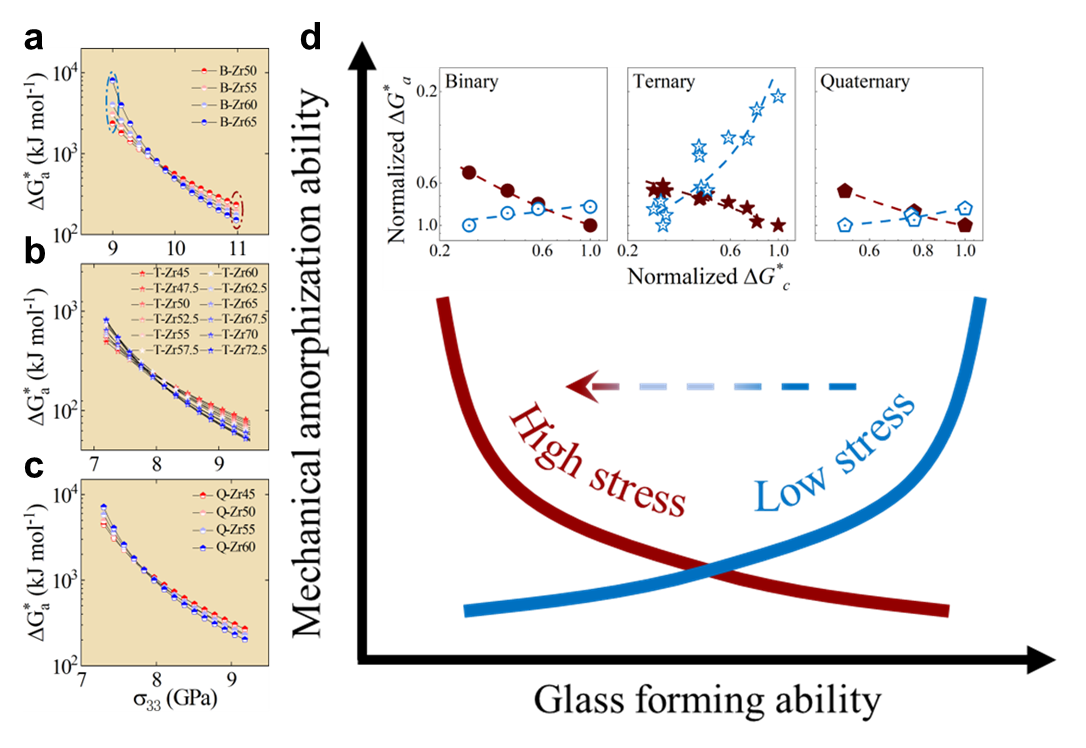
Evidently, MAA is influenced by both external mechanical work and the composition properties, specifically the energy barrier and the free energy difference . Eq. 9 can be dissected into two components concerning composition sensitivity. Firstly, characterizes the GFA of the composition which is insensitive with external loading. Secondly, the term delineates the interplay between external loading conditions. At low stress levels, the external work is comparable with the free energy difference and the term exhibits sensitive to composition, particularly a positive correlation with . For stronger glass-forming systems, this value tends to be smaller, as exemplified by the notable difference between the marginal glass-former B-Zr65 and the good glass-former B-Zr50 (about one order, see Fig. 6). In contrast, at high stress levels, where , the composition insensitivity becomes apparent, leading to significantly reduced differences between B-Zr50 and B-Zr65. In this regime, all values fall within a comparable range of (Fig. 6). Therefore, the composition sensitivity of MAA is predominantly governed by at low stress levels and shifts towards being dominated by at high stress levels.
We tested a series of loading stresses using Eq. 9, as shown in Fig. 7 a-c, all the experimental systems, including binary, ternary, and quaternary alloy systems, reveal a crossover correlation between MAA and GFA. Under low-stress conditions, MAA exhibits a positive correlation with GFA (Fig. S19), while under high-stress conditions, MAA shows an inverse correlation with GFA. This finding aligns with the simulation results (Fig. 3c) and helps reconcile the discrepancy between current experimental results and established impressionsSharma2008EffectON ; Sharma2007criterion ; Zou2013effect . Note that, the critical stress level responsible for this reversion varies with the alloy systems. At this stress level, it becomes evident that the MAA becomes entirely independent of GFA, highlighting the sensitivity of the correlation between MAA and GFA to external stress levels (Figs. 7a-c). It is intriguing to observe the inverse correlation between MAA and GFA under large stress conditions (Fig. 7d). This suggests that for materials with poor GFA, mechanical amorphization can be highly efficient, thus offering a novel avenue to expand the range of attainable glassy states PhysRevB.56.R11361 ; Eckert1997mechanical . This finding is particularly fascinating in the context of monatomic glassesZhong2014FormationOM ; ZHAO2021114018 , where mechanical amorphization, through processing techniques like shocking or various deformation loadings, could potentially offer significant advantages over rapid coolingZhao2018ShockinducedAI ; He2016insitu ; Zhao2016AmorphizationAN . Furthermore, this discovery opens up possibilities for generating new amorphous phases, especially in materials with poor GFA, such as amorphous iceRosuFinsen2023medium . Additionally, the tunable nature of mechanical amorphization provides valuable insights into controlling amorphization in material design. For instance, the creation of gradient amorphous-crystalline nanostructures with superior performance becomes feasible by mechanical amorphization techniques, such as ultrasonic vibrationFan2023rapid .
V Conclusion
In summary, we explored the MAA of materials and its relationship with GFA. Surprisingly, we found that the correlation between MAA and GFA is highly sensitive to external loading conditions, reversing under high stress. This emphasizes the role of external stress as a key control parameter for MAA. Our modified classical nucleation theory revealed that MAA depends on external mechanical work and GFA. Notably, under large stress, poor GFA materials could efficiently undergo mechanical amorphization, expanding the range of attainable glassy states and offering exciting possibilities for material design.
VI Acknowledgements
We thank neutron diffraction measurements on the Multiple Physics Instrument (MPI) at China Spallation Neutron Source (CSNS) and the milling equipment supports at Dongguan University of Technology.
VII Funding
This work was financially supported by Guangdong Major Project of Basic and Applied Basic Research, China (Grant Nos. 2019B030302010), Guangdong Basic and Applied Basic Research Foundation China (Grant Nos.2021A1515111107, 2021B1515140005, and 2022A1515011439), the National Natural Science Foundation of China (Grant Nos.52201176, 52071222, and 52130108), Pearl River Talent Recruitment Program (Grant No.2021QN02C04), Young Talent Support Project of Guangzhou Association for Science and Technology (Grant No.QT2024-041).
VIII Author contributions
X.X.L. and B.S.S. contributed equally to this work. H.B.K., H.Y.B. and W.H.W. conceived and supervised this work; X.X.L. designed and conducted all the experiments with assistance from Z.D.W.; B.S.S. designed and conducted all the simulations with assistance from X.X.L.; Y.L. assisted in the literature review and theoretical analysis. X.X.L., B.S.S., H.B.K., and H.Y.B. wrote the paper with input and comments from all authors.
References
- [1] B.Y. Li, A.C. Li, S. Zhao, and M.A. Meyers. Amorphization by mechanical deformation. Materials Science and Engineering: R: Reports, 149:100673, 2022.
- [2] Shiteng Zhao, Zezhou Li, Chaoyi Zhu, Wen Yang, Zhouran Zhang, David E. J. Armstrong, Patrick S. Grant, Robert O. Ritchie, and Marc A. Meyers. Amorphization in extreme deformation of the crmnfeconi high-entropy alloy. Science Advances, 7(5), 2021.
- [3] Hao Wang, Dengke Chen, Xianghai An, Yin Zhang, Shijie Sun, Yanzhong Tian, Zhefeng Zhang, Anguo Wang, Jinqiao Liu, Min Song, Simon P. Ringer, Ting Zhu, and Xiaozhou Liao. Deformation-induced crystalline-to-amorphous phase transformation in a crmnfeconi high-entropy alloy. Science Advances, 7(14), 2021.
- [4] Charles Meade and Raymond Jeanloz. Static compression of ca(oh)2 at room temperature: Observations of amorphization and equation of state measurements to 10.7 gpa. Geophysical Research Letters, 17(8):1157–1160, 1990.
- [5] Hu Tang, Xiaohong Yuan, Yong Cheng, Hongzhan Fei, Fuyang Liu, Tao Liang, Zhidan Zeng, Takayuki Ishii, Ming-Sheng Wang, Tomoo Katsura, Howard Sheng, and Huiyang Gou. Synthesis of paracrystalline diamond. Nature, 599(7886):605–610, 2021.
- [6] Paul F. McMillan, Mark Wilson, Dominik Daisenberger, and Denis Machon. A density-driven phase transition between semiconducting and metallic polyamorphs of silicon. Nature Materials, 4(9):680–684, 2005.
- [7] Alexander Rosu-Finsen, Michael B. Davies, Alfred Amon, Han Wu, Andrea Sella, Angelos Michaelides, and Christoph G. Salzmann. Medium-density amorphous ice. Science, 379(6631):474–478, 2023.
- [8] Carl C. Koch, Odis Burl Cavin, C. G. Mckamey, and J. O. Scarbrough. Preparation of “amorphous” ni60nb40 by mechanical alloying. Applied Physics Letters, 43:1017–1019, 1983.
- [9] C. Suryanarayana. Mechanical alloying and milling. Progress in Materials Science, 46(1–2):1–184, 2001.
- [10] Hai Yang Bai, C. Michaelsen, and R. Bormann. Inverse melting in a system with positive heats of formation. Phys. Rev. B, 56:R11361–R11364, 1997.
- [11] Mingwei Chen, James W. McCauley, and Kevin J. Hemker. Shock-induced localized amorphization in boron carbide. Science, 299(5612):1563–1566, 2003.
- [12] Shiteng Zhao, R. Flanagan, Eric N. Hahn, Bimal K. Kad, Bruce Remington, Chris Wehrenberg, Robert C. Cauble, Karren L. More, and Marc A. Meyers. Shock-induced amorphization in silicon carbide. Acta Materialia, 2018.
- [13] Luyao Li, Guo-Jian Lyu, Hongzhen Li, Caitao Fan, Wenxin Wen, Hongji Lin, Bo Huang, Sajad Sohrabi, Shuai Ren, Xiong Liang, Yun-Jiang Wang, Jiang Ma, and Weihua Wang. Ultra-fast amorphization of crystalline alloys by ultrasonic vibrations. Journal of Materials Science & Technology, 142:76–88, 2023.
- [14] Yang He, Li Zhong, Feifei Fan, Chongmin Wang, Ting Zhu, and Scott X. Mao. In situ observation of shear-driven amorphization in silicon crystals. Nature Nanotechnology, 11(10):866–871, 2016.
- [15] Long Zhang, Haifeng Zhang, Xiaobing Ren, Jürgen Eckert, Yandong Wang, Zhengwang Zhu, Thomas Gemming, and Simon Pauly. Amorphous martensite in -ti alloys. Nature Communications, 9(1), 2018.
- [16] Hubin Luo, Hongwei Sheng, Hongliang Zhang, Fengqing Wang, Jinkui Fan, Juan Du, J. Ping Liu, and Izabela Szlufarska. Plasticity without dislocations in a polycrystalline intermetallic. Nature Communications, 10(1), 2019.
- [17] Yuchen Shang, Zhaodong Liu, Jiajun Dong, Mingguang Yao, Zhenxing Yang, Quanjun Li, Chunguang Zhai, Fangren Shen, Xuyuan Hou, Lin Wang, Nianqiang Zhang, Wei Zhang, Rong Fu, Jianfeng Ji, Xingmin Zhang, He Lin, Yingwei Fei, Bertil Sundqvist, Weihua Wang, and Bingbing Liu. Ultrahard bulk amorphous carbon from collapsed fullerene. Nature, 599(7886):599–604, 2021.
- [18] Xuanxin Hu, Nuohao Liu, Vrishank Jambur, Siamak Attarian, Ranran Su, Hongliang Zhang, Jianqi Xi, Hubin Luo, John Perepezko, and Izabela Szlufarska. Amorphous shear bands in crystalline materials as drivers of plasticity. Nature Materials, 22(9):1071–1077, 2023.
- [19] Wei Huang, Mehdi Shishehbor, Nicolás Guarín-Zapata, Nathan D. Kirchhofer, Jason Li, Luz Cruz, Taifeng Wang, Sanjit Bhowmick, Douglas Stauffer, Praveena Manimunda, Krassimir N. Bozhilov, Roy Caldwell, Pablo Zavattieri, and David Kisailus. A natural impact-resistant bicontinuous composite nanoparticle coating. Nature Materials, 19(11):1236–1243, 2020.
- [20] S. Sharma, R. Vaidyanathan, and C. Suryanarayana. Criterion for predicting the glass-forming ability of alloys. Applied Physics Letters, 90(11), 2007.
- [21] Satyajeet Sharma and Challapalli Suryanarayana. Effect of nb on the glass-forming ability of mechanically alloyed Fe-Ni-Zr-B alloys. Scripta Materialia, 58:508–511, 2008.
- [22] Russell J. Hemley, Andrew P. Jephcoat, Ho kwang Mao, Li Chung Ming, and Murli H. Manghnani. Pressure-induced amorphization of crystalline silica. Nature, 334:52–54, 1988.
- [23] C. Suryanarayana. Phase formation under non-equilibrium processing conditions: rapid solidification processing and mechanical alloying. Journal of Materials Science, 53(19):13364–13379, 2018.
- [24] Shiteng Zhao and Xiaolei Wu. Amorphization-mediated plasticity. Nature Materials, 22(9):1057–1058, 2023.
- [25] Alan C. Lund and Christopher A. Schuh. Molecular simulation of amorphization by mechanical alloying. Acta Materialia, 52:2123–2132, 2004.
- [26] Z. P. Lu and C. T. Liu. Glass formation criterion for various glass-forming systems. Phys. Rev. Lett., 91:115505, Sep 2003.
- [27] Wenjuan Ge, Yingzi Wang, Caiyun Shang, Zitang Zhang, and Yan Wang. Microstructures and properties of equiatomic CuZr and CuZrAlTiNi bulk alloys fabricated by mechanical alloying and spark plasma sintering. Journal of Materials Science, 52(10):5726–5737, 2017.
- [28] Juping Xu, Yuanguang Xia, Zhiduo Li, Huaican Chen, Xunli Wang, Zhenzhong Sun, and Wen Yin. Multi-physics instrument: Total scattering neutron time-of-flight diffractometer at china spallation neutron source. Nuclear Instruments and Methods in Physics Research Section A: Accelerators, Spectrometers, Detectors and Associated Equipment, 1013:165642, 2021.
- [29] O. Arnold, J.C. Bilheux, J.M. Borreguero, A. Buts, S.I. Campbell, L. Chapon, M. Doucet, N. Draper, R. Ferraz Leal, M.A. Gigg, V.E. Lynch, A. Markvardsen, D.J. Mikkelson, R.L. Mikkelson, R. Miller, K. Palmen, P. Parker, G. Passos, T.G. Perring, P.F. Peterson, S. Ren, M.A. Reuter, A.T. Savici, J.W. Taylor, R.J. Taylor, R. Tolchenov, W. Zhou, and J. Zikovsky. Mantid-data analysis and visualization package for neutron scattering and sr experiments. Nuclear Instruments and Methods in Physics Research Section A: Accelerators, Spectrometers, Detectors and Associated Equipment, 764:156–166, 2014.
- [30] Pierre Hirel. Atomsk: A tool for manipulating and converting atomic data files. Computer Physics Communications, 197:212–219, 2015.
- [31] M. I. Mendelev, Y. Sun, F. Zhang, C. Z. Wang, and K. M. Ho. Development of a semi-empirical potential suitable for molecular dynamics simulation of vitrification in Cu-Zr alloys. The Journal of Chemical Physics, 151(21), 2019.
- [32] Aidan P. Thompson, Hasan Metin Aktulga, Richard Berger, Dan S. Bolintineanu, W. Michael Brown, Paul S. Crozier, Pieter J. in ’t Veld, Axel Kohlmeyer, Stan G. Moore, Trung Dac Nguyen, Ray Shan, Mark J. Stevens, Julien Tranchida, Christian R. Trott, and Steven J. Plimpton. Lammps - a flexible simulation tool for particle-based materials modeling at the atomic, meso, and continuum scales. Computer Physics Communications, 2021.
- [33] Alexander Stukowski. Visualization and analysis of atomistic simulation data with ovito–the open visualization tool. Modelling and Simulation in Materials Science and Engineering, 18(1):015012, 2009.
- [34] Shuichi Nosé. A unified formulation of the constant temperature molecular dynamics methods. Journal of Chemical Physics, 81:511–519, 1984.
- [35] Glenn J. Martyna, Douglas J. Tobias, and Michael L. Klein. Constant pressure molecular dynamics algorithms. Journal of Chemical Physics, 101:4177–4189, 1994.
- [36] A. S. Rogachev, A. Fourmont, Dmitry Kovalev, S. G. Vadchenko, N. A. Kochetov, Natalia Shkodich, Florence Baras, and Olivier Politano. Mechanical alloying in the co-fe-ni powder mixture: Experimental study and molecular dynamics simulation. Powder Technology, 2022.
- [37] Paul J. Steinhardt, David R. Nelson, and Marco Ronchetti. Bond-orientational order in liquids and glasses. Phys. Rev. B, 28:784–805, 1983.
- [38] S. Auer and D. Frenkel. Numerical prediction of absolute crystallization rates in hard-sphere colloids. The Journal of Chemical Physics, 120(6):3015–3029, 2004.
- [39] John Russo and Hajime Tanaka. The microscopic pathway to crystallization in supercooled liquids. Scientific Reports, 2(1), 2012.
- [40] S. C. Glade, Ralf Busch, D. S. Lee, William l. Johnson, Rainer Karl Wunderlich, and Hans-Jörg Fecht. Thermodynamics of Cu47Ti34Zr11Ni8, Zr52.5Cu17.9Ni14.6Al10Ti5 and Zr57Cu15.4Ni12.6Al10Nb5 bulk metallic glass forming alloys. Journal of Applied Physics, 87:7242–7248, 2000.
- [41] Isabella Gallino, Jan Schroers, and Ralf Busch. Kinetic and thermodynamic studies of the fragility of bulk metallic glass forming liquids. Journal of Applied Physics, 108:063501, 2010.
- [42] David M. Turnbull. Formation of crystal nuclei in liquid metals. Journal of Applied Physics, 21:1022–1028, 1950.
- [43] S. Zhao, B. Kad, E.N. Hahn, B.A. Remington, C.E. Wehrenberg, C.M. Huntington, H.-S. Park, E.M. Bringa, K.L. More, and M.A. Meyers. Pressure and shear-induced amorphization of silicon. Extreme Mechanics Letters, 5:74–80, 2015.
- [44] Janki R. Patel and Morris Cohen. Criterion for the action of applied stress in the martensitic transformation. Acta Metallurgica, 1:531–538, 1953.
- [45] Dong Ma, Alexandru D. Stoica, and Xun-Li Wang. Power-law scaling and fractal nature of medium-range order in metallic glasses. Nature materials, 8 1:30–4, 2009.
- [46] Weihua Wang. The elastic properties, elastic models and elastic perspectives of metallic glasses. Progress in Materials Science, 57:487–656, 2012.
- [47] Jayanta Das, Mei Bo Tang, Ki Buem Kim, Ralf Theissmann, Falko Baier, Wei Hua Wang, and Jürgen Eckert. “work-hardenable” ductile bulk metallic glass. Phys. Rev. Lett., 94:205501, 2005.
- [48] J. Zemp, M. Celino, B. Schönfeld, and J. F. Löffler. Crystal-like rearrangements of icosahedra in simulated copper-zirconium metallic glasses and their effect on mechanical properties. Phys. Rev. Lett., 115:165501, 2015.
- [49] Y. Li, Q. Guo, J. A. Kalb, and C. V. Thompson. Matching glass-forming ability with the density of the amorphous phase. Science, 322(5909):1816–1819, 2008.
- [50] F. Zhu, H. K. Nguyen, S. X. Song, Daisman P. B. Aji, A. Hirata, H. Wang, K. Nakajima, and M. W. Chen. Intrinsic correlation between -relaxation and spatial heterogeneity in a metallic glass. Nature Communications, 7(1), 2016.
- [51] Y. H. Liu, D. Wang, K. Nakajima, W. Zhang, A. Hirata, T. Nishi, A. Inoue, and M. W. Chen. Characterization of nanoscale mechanical heterogeneity in a metallic glass by dynamic force microscopy. Phys. Rev. Lett., 106:125504, 2011.
- [52] Peng Luo, Chongjing Cao, Fuxiang Zhu, Yulin Lv, Y. H. Liu, Patrick Y. Wen, Haiyang Bai, Gavin B. M. Vaughan, Marco di Michiel, Beatrice Ruta, and Wen chao Wang. Ultrastable metallic glasses formed on cold substrates. Nature Communications, 9, 2018.
- [53] Hai‐Bin Yu, Yuansu Luo, and Konrad Samwer. Ultrastable metallic glass. Advanced Materials, 25(41):5904–5908, 2013.
- [54] David M. Turnbull. Under what conditions can a glass be formed. Contemporary Physics, 10:473–488, 1969.
- [55] Ming-Xing Li, Yi-Tao Sun, Chao Wang, Li-Wei Hu, Sungwoo Sohn, Jan Schroers, Wei-Hua Wang, and Yan-Hui Liu. Data-driven discovery of a universal indicator for metallic glass forming ability. Nature Materials, 21(2):165–172, 2021.
- [56] Challapalli Suryanarayana. Mechanical alloying: A novel technique to synthesize advanced materials. Research, 2019, 2019.
- [57] J. Eckert. Mechanical alloying of highly processable glassy alloys. Materials Science and Engineering: A, 226–228:364–373, 1997.
- [58] E. Hellstern and L. Schultz. Amorphization of transition metal zr alloys by mechanical alloying. Applied Physics Letters, 48(2):124–126, 1986.
- [59] G. Mazzone, A. Montone, and M. Vittori Antisari. Effect of plastic flow on the kinetics of amorphous phase growth by solid state reaction in the ni-zr system. Phys. Rev. Lett., 65:2019–2022, 1990.
- [60] L.M. Zou, Y.H. Li, C. Yang, S.G. Qu, and Y.Y. Li. Effect of fe content on glass-forming ability and crystallization behavior of a (Ti69.7Nb23.7Zr4.9Ta1.7)100-xFex alloy synthesized by mechanical alloying. Journal of Alloys and Compounds, 553:40–47, 2013.
- [61] C. Yang, Q.R. Cheng, L.H. Liu, Y.H. Li, and Y.Y. Li. Effect of minor cu content on microstructure and mechanical property of niticu bulk alloys fabricated by crystallization of metallic glass powder. Intermetallics, 56:37–43, 2015.
- [62] Yuan-Chao Hu and Hajime Tanaka. Physical origin of glass formation from multicomponent systems. Science Advances, 6(50), 2020.
- [63] W. L. Johnson, J. H. Na, and M. D. Demetriou. Quantifying the origin of metallic glass formation. Nature Communications, 7(1), 2016.
- [64] Richard Becker and Werner Döring. Kinetische behandlung der keimbildung in übersättigten dämpfen. Annalen der Physik, 416:719–752, 1935.
- [65] Shiteng Zhao, Eric N. Hahn, Bimal K. Kad, Bruce A. Remington, Chris Wehrenberg, Eduardo M. Bringa, and Marc André Meyers. Amorphization and nanocrystallization of silicon under shock compression. Acta Materialia, 103:519–533, 2016.
- [66] Valery I. Levitas, Hao Chen, and Liming Xiong. Lattice instability during phase transformations under multiaxial stress: Modified transformation work criterion. Phys. Rev. B, 96:054118, 2017.
- [67] S. Zhao, B. Li, B.A. Remington, C.E. Wehrenberg, H.S. Park, E.N. Hahn, and M.A. Meyers. Directional amorphization of covalently-bonded solids: A generalized deformation mechanism in extreme loading. Materials Today, 49:59–67, 2021.
- [68] Valery I. Levitas, Yanzhang Ma, Emre Selvi, Jianzhe Wu, and John A. Patten. High-density amorphous phase of silicon carbide obtained under large plastic shear and high pressure. Physical Review B, 85:054114, 2012.
- [69] Ralf Busch, Y. J. Kim, and William l. Johnson. Thermodynamics and kinetics of the undercooled liquid and the glass transition of the zr41.2ti13.8cu12.5ni10.0be22.5 alloy. Journal of Applied Physics, 77:4039–4043, 1995.
- [70] Li Zhong, Jiangwei Wang, Hongwei Sheng, Ze Zhang, and Scott X. Mao. Formation of monatomic metallic glasses through ultrafast liquid quenching. Nature, 512:177–180, 2014.
- [71] R. Zhao, H.Y. Jiang, P. Luo, Y.T. Sun, L.Q. Shen, H.Y. Bai, and W.H. Wang. Sampling stable amorphous tantalum states from energy landscape. Scripta Materialia, 202:114018, 2021.
- [72] Caitao Fan, Luyao Li, Wenxin Wen, Hongzhen Li, Jianan Fu, Wenqing Ruan, Shuai Ren, Sajad Sohrabi, Zhenxuan Zhang, Xiong Liang, and Jiang Ma. Rapid amorphization of crmnfeconi high-entropy alloy under ultrasonic vibrations. Materials & Design, 225:111575, 2023.
Supplementary
S1 Supplementary Notes
S1.1 Supplementary Note 1: shear stress and hydrostatic pressure
According to the generalized Hook’s law, , where presents the elastic constants, presents the uniaxial strain. Correspondingly, the hydrostatic pressure and maximum shear stress can be determined by and , where is the impact stress. In terms of ZrCu-based metallic glass systems, the Poisson’s ration is under the range of . Hence, the value of v is 0.305 for all of alloy systems herein.
S1.2 Supplementary Note 2: Determination of crystallization activation energy by Kissinger equation
The apparent activation energy of crystallization is determined under isochronal heating conditions using the following Kissinger equation
| (S1) |
where is the Boltzmann’s constant, B is the heating rate (K s-1), is the constant and T is the specific temperature dependence of heating rate. Generally, T is denoted as the temperature corresponding to the beginning or to the peak of the exothermic crystallization event detected by DSC. Then, through plotting as a function of , the quantity can be determined by the slope. In this work, is taken as the onset crystallization temperature and is understood as crystallization activation energy in this case. Correspondingly, Fig. S13 shows the valid of this dependence.
S1.3 Supplementary Note 3: Estimation of the input energy in a planetary milling system
In terms of a planetary milling, the geometry of one vial can be schematized in Fig. S20. It can be expressed that the absolute velocity of one peripheral point can be depicted by the following equation:
| (S2) |
where and (RPM, rotations per minute) present the absolute angular velocity of the milling plate and steel vial respectively; and (mm) present vectorial distances from the center of the plate to the center of the vial and radius of the vial respectively; is the angle formed by the vectors of and . It is assumed that the steel ball moves without sliding at the point (Fig. S20). At a specific moment, it is launched towards the opposite inner wall. And the ball moves back to the wall after a short hit and is accelerated by the vial at the next launch cycle. Note that the previous hypotheses are realistically starting from the moment at which a thin powder layer covered the ball. Hence, the condition for the ball detached from the inner wall of vial is expressed by:
| (S3) |
Combined Eqs. S2 and S3, the absolute velocity of one ball leaving the wall can be expressed by:
| (S4) |
where (mm) refers to the diameter of one ball. When attached solidly again with the wall, the velocity of the ball after a hit, , equal to that of the inner wall and can be given by:
| (S5) |
When the ball is launched, the energy can be shown as:
| (S6) |
where (g) refers to the mass weight of one ball. After collision, a fraction of energy is released in ways of deformation of powder materials and instantaneous temperature rise of systems. The remaining energy of the ball becomes:
| (S7) |
Hence, the released energy of one ball during a series of collision events can be expressed by:
| (S8) |
In general, a number of balls, , widely used to accelerate the process of amorphization, hinder each other so that Eq. S8 must be considered the effect of filling degree of vial by introducing a related empirical parameter, . To simplification, two boundary cases is: i) for only one or few balls and ii) when the vial is completely filled by the balls, no movement occurs. Correspondingly, Eq. S8 is modified as in a realistic experiment:
| (S9) |
where refers to the kinetic energy of one ball in the system including balls. Hence, the total released energy can be given by:
| (S10) |
where refers to the frequency of launching for ball, which is proportions the relative rotation speed, . Therefore, Eq. S10 is modified as normalizing by powder weight and multiplying by milling time t denoted as :
| (S11) |
Note that, the above model can be used to determine the released energy by collision between balls and vial walls, while the focused energy transferred to powder materials is apparently only a portion of the derived released energy . In spite of the restrictions and hypotheses, the aforementioned model was used to rationalize the previously reported experimental results.
S1.4 Supplementary Note 4: Deduction for expression
As far as is concerned, it is found convenient to express it as a function of two parameters and :
| (S12) |
Where refers to the number of balls that can be contained in a simple cubic arrangement in the vial and is given by the following estimation
| (S13) |
Where and is the height and diameter of the vial;
| (S14) |
Where refers to the number of balls needed to cover one third of the inner surface in a simple cubic arrangement and is shown as
| (S15) |
In order to derive a simple analytical expression for , it is assumed that i) for (vial is completely empty); ii) for (vial is completely filled up); iii) is close to 1 (e.g. 0.95) for (this assumed that the reciprocal hindering of the ball is negligible until one third of the inner surface wall is not covered). According to above assumptions, a simple formulation of can be estimated by
| (S16) |
Where refers to a parameter dependent of ball diameter that can be evaluated by the assumption (iii):
| (S17) |
S1.5 Supplementary Note 5: mechanical amorphization type
In this work, the evolution of XRD patterns corresponded to a feature of type II that a decrease of elemental peaks accompanied with an increase of the amorphous broad peak for all of compositions herein (see the upper part of Figs. S1, S2, S3, S4, S5, S6). We supplemented the eds mapping to further detect the evolution of structures with the increase of milling time for the binary system. As shown in Fig. S21, each elements distributed incompatibly and no compounds formed at early milling of Zr and Cu elemental powders, corresponding to the peak intensity of pure elements decreased with the simultaneously increased amorphous halo peak. The identical amorphization type of here-considered alloy systems provided a prerequisite for discussion about relationship between MAA and GFA.
S1.6 Supplementary Note 6: relationship between , FWHM, and
As shown in Fig. S23, is well correlated with GFA indicators FWHM and , which is consistent with the reported studies[6,7]. In terms of ball milling, a large portion of the input work can be dissipated in the form of heat, a small portion of which is stored in the crystalline powder material, achieving transformation from order to disorder.
To an extent, varied with compositions may be considered as a parameter reflecting the difficulty of amorphization transformation. That means that the poor MMA systems need more for amorphization during milling. Hence, the negative plot of with (Fig. S15) can be considered an energetic expression for the inverse relationship between GFA and MAA.
S2 Supplementary Table
| Composition | FWHM | |||||||
|---|---|---|---|---|---|---|---|---|
| (at. %) | (K) | (K) | (K) | (Å-1) | (kJ mol-1) | (K) | ||
| Zr65Cu35 | 622 | 675 | 1294 | 0.48561 | 0.481 | 0.352 | 286.67 | 1289.8 |
| Zr60Cu40 | 641 | 689 | 1290 | 0.49731 | 0.497 | 0.357 | 307.24 | 1277.6 |
| Zr55Cu45 | 654 | 705 | 1227 | 0.52161 | 0.533 | 0.375 | 331.31 | 1221.6 |
| Zr50Cu50 | 666 | 723 | 1228 | 0.53283 | 0.542 | 0.382 | 337.33 | 1223 |
| Zr72.5Cu17.5Al10 | 624 | 658 | 1318 | 0.41504 | 0.473 | 0.339 | 250.56 | 1256 |
| Zr70Cu20Al10 | 633 | 671 | 1309 | 0.42253 | 0.484 | 0.346 | 257.17 | 1242.9 |
| Zr67.5Cu22.5Al10 | 640 | 703 | 1306 | 0.43148 | 0.490 | 0.361 | 248.81 | 1204.4 |
| Zr65Cu25Al10 | 644 | 729 | 1306 | 0.43748 | 0.493 | 0.374 | 273.17 | 1208.1 |
| Zr62.5Cu27.5Al10 | 664 | 736 | 1230 | 0.44032 | 0.540 | 0.389 | 297.87 | 1223 |
| Zr60Cu30Al10 | 664 | 739 | 1223 | 0.46186 | 0.543 | 0.392 | 292.56 | 1211.6 |
| Zr57.5Cu32.5Al10 | 682 | 743 | 1220 | 0.48898 | 0.559 | 0.391 | 318.84 | 1199.3 |
| Zr55Cu35Al10 | 698 | 750 | 1211 | 0.49216 | 0.576 | 0.393 | 345.52 | 1190.5 |
| Zr52.5Cu37.5Al10 | 692 | 751 | 1199 | 0.50786 | 0.577 | 0.397 | 342.48 | 1178.9 |
| Zr50Cu40Al10 | 707 | 753 | 1163 | 0.51413 | 0.608 | 0.403 | 342.16 | 1143 |
| Zr47.5Cu42.5Al10 | 710 | 757 | 1154 | 0.54548 | 0.615 | 0.406 | 353.41 | 1149.2 |
| Zr45Cu45Al10 | 714 | 765 | 1159 | 0.56429 | 0.616 | 0.408 | 369.19 | 1154.8 |
| Zr60Cu20Al10Ni10 | 662 | 757 | 1222 | 0.48048 | 0.542 | 0.402 | 239.44 | 1113.3 |
| Zr55Cu25Al10Ni10 | 680 | 769 | 1228 | 0.48553 | 0.554 | 0.403 | 294.28 | 1152.4 |
| Zr50Cu30Al10Ni10 | 701 | 773 | 1232 | 0.51909 | 0.569 | 0.400 | 310.99 | 1175.3 |
| Zr45Cu35Al10Ni10 | 715 | 787 | 1239 | 0.53175 | 0.577 | 0.403 | 346.66 | 1190.7 |
| Composition | ||||
|---|---|---|---|---|
| (at. %) | (J g atom-1 K-2) | (J g atom-1 K-3) | (J g atom-1 K-2) | (J g atom-1 K) |
| Zr65Cu35 | 2.37 | 2.00 | 4.33 | 4.46 |
| Zr60Cu40 | 1.37 | 6.37 | 8.35 | 3.99 |
| Zr55Cu45 | -10.05 | 13.09 | 5.33 | 4.28 |
| Zr50Cu50 | 7.39 | 3.93 | 11.13 | 4.84 |
| Zr72.5Cu17.5Al10 | 9.14 | 0.34 | 9.22 | 5.74 |
| Zr70Cu20Al10 | -9.72 | 17.58 | 11.65 | 3.84 |
| Zr67.5Cu22.5Al10 | -5.54 | 10.66 | 10.72 | 5.33 |
| Zr65Cu25Al10 | -4.44 | 12.23 | 11.78 | 5.56 |
| Zr62.5Cu27.5Al10 | -7.77 | 16.04 | 11.87 | 5.36 |
| Zr60Cu30Al10 | -13.65 | 19.70 | 10.76 | 4.69 |
| Zr57.5Cu32.5Al10 | 0.75 | 8.15 | 10.76 | 5.43 |
| Zr55Cu35Al10 | 9.25 | 1.25 | 9.88 | 5.49 |
| Zr52.5Cu37.5Al10 | 4.09 | 4.66 | 10.09 | 5.71 |
| Zr50Cu40Al10 | 5.25 | 6.83 | 15.23 | 5.45 |
| Zr47.5Cu42.5Al10 | -3.09 | 11.27 | 14.31 | 4.40 |
| Zr45Cu45Al10 | 4.00 | 1.31 | 10.03 | 5.45 |
| Zr60Cu20Al10Ni10 | 3.05 | 4.03 | 8.27 | 5.24 |
| Zr55Cu25Al10Ni10 | -1.85 | 11.59 | 12.11 | 5.82 |
| Zr50Cu30Al10Ni10 | -0.09 | 10.65 | 13.00 | 5.82 |
| Zr45Cu35Al10Ni10 | 5.23 | 1.87 | 7.52 | 8.50 |
S3 Supplementary Figures