Stellar Loci VI: An Updated Catalog of the Best and Brightest Metal-poor Stars
Abstract
We employ Gaia, 2MASS, and ALLWISE photometry, as well as astrometric data from Gaia, to search for relatively bright very metal-poor ([Fe/H] ; VMP) giant star candidates using three different criteria: 1) the derived Gaia photometric metallicities from Xu et al. (2022), 2) the lack of stellar molecular absorption near 4.6 microns, and 3) their high tangential velocities. With different combinations of these criteria, we have identified six samples of candidates with 15: the Gold sample (24,304 candidates), the Silver GW sample (40,157 candidates), the Silver GK sample (120,452 candidates), the Bronze G sample (291,690 candidates), the Bronze WK sample (68,526 candidates), and the Low sample (4,645 candidates). The Low sample applies to sources with low Galactic lattitude, , while the others are for sources with . By cross-matching with results derived from medium-resolution ( 1800) from LAMOST DR8, we establish that the success rate for identifying VMP stars is 60.1 for the Gold sample, 39.2 for the Silver GW sample, 41.3 for the Silver GK sample, 15.4 for the Bronze G sample, 31.7 for the Bronze WK sample, and 16.6 for the Low sample, respectively. An additional strict cut on the quality parameter can further increase the success rate of the Silver GW, Silver GK, and Bronze G samples to 46.9, 51.6, and 29.3, respectively. Our samples provide valuable targets for high-resolution follow-up spectroscopic observations, and are made publicly available.
1 Introduction
Very metal-poor (VMP) stars are defined as having [Fe/H] (Beers & Christlieb 2005). They are crucial “fossil probes” of the first nucleosynthesis events in the early universe, and thus play an unique role in studies of Population III stars. The VMP stars in the Galactic halo also provide important constraints on the formation and early evolution of the Milky Way. The extremely metal-poor (EMP; [Fe/H] ) and ultra metal-poor (UMP; [Fe/H] 4.0) stars are thought to form several hundred million years after the Big Bang, and in addition provide probes of lithium production from Big Bang nucleosynthesis (Iwamoto et al., 2005) and the production of carbon by high-mass early generation stars (Heger & Woosley, 2010; Meynet et al., 2010; Chiappini, 2013).
Medium-resolution spectroscopy () is often utilized to search for metal-poor stars, making use of the Ca H and K absorption lines (Beers et al. 1985, 1992; Christlieb et al. 2008), or the Ca triplet lines (Fulbright et al. 2010). Large-scale spectroscopic surveys, such as the Sloan Extension for Galactic Understanding and Exploration (SEGUE, Yanny et al. 2009; SEGUE-2, Rockosi et al. 2022) and the Large sky Area Multi-Object fiber Spectroscopic Telescope (LAMOST; Cui et al. 2012; Deng et al. 2012; Zhao et al. 2012; Liu et al. 2014), provide the opportunity to identify VMP stars from among millions of medium- to intermediate-resolution () spectra (e.g., Li et al. 2015a, b, c, 2018; Aguado et al. 2017; Mardini et al. 2019; Li et al. 2022; Wang et al. 2022).
VMP candidates can also be effectively identified using photometric data, particularly those that include narrow- and intermediate-band filters designed for stellar-parameter determinations, such as the SkyMapper survey (Keller et al. 2007, 2014; Huang et al. 2022), the Pristine survey (Starkenburg et al. 2017; Aguado et al. 2019), the Javalambre Photometric Local Universe Survey (J-PLUS; Cenarro et al. 2019; Whitten et al. 2019; Galarza et al. 2022; Yang et al. 2022) and the Southern Photomeric Local Universe Survey (S-PLUS; Mendes de Oliveira et al. 2019,Whitten et al. 2021,Placco et al. 2022). Stellar metallicities can also be precisely determined down to [Fe/H] with broadband filters, if the data quality is sufficiently high (e.g., Yuan et al. 2015; An & Beers 2020; Zhang et al. 2021; Xu et al. 2022).
For a VMP candidate, particularly those selected exclusively by photometry, follow-up high-resolution spectroscopy is often used to confirm whether or not it is a true VMP star, to determine if it is chemically peculiar in some respect (e.g., if it is carbon-enhanced or exhibits enhanced neutron-capture elements), or in order to carry out more in-depth studies of its full elemental-abundance distribution. According to Schlaufman & Casey (2014), it takes about four hours for a 6.5m-aperture telescope to obtain a R 25,000 spectrum with S/N 100 pixel-1 at 400 nm for a VMP candidate with V 16. Bright VMP candidates have the huge advantage that follow-up high-resolution spectroscopy can be obtained in substantially less time or even with smaller-aperture telescopes. By making use of the fact that VMP stars generally lack strong molecular absorption near 4.6 microns, Schlaufman & Casey (2014) identify 11,916 bright () metal-poor star candidates from the public, all-sky APASS optical, 2MASS near-infrared, and WISE mid-infrared photometry. Follow-up high-resolution spectroscopy shows about 2036% of their candidates have [Fe/H] (Schlaufman & Casey 2014; Casey & Schlaufman 2015).
Limberg et al. (2021) have demonstrated that the use of kinematic parameters, such as the radial velocities and tangential velocities (based on proper motions and distance estimates), or their combination, can dramatically improve the success rates for identification of likely VMP stars in several previous surveys. Below we use a similar scheme as one of our search criteria.
Taking advantage of the unprecedented photometric quality of Gaia Early Data Release 3 (EDR3; Brown et al. 2021), we have previously obtained reliable photometric metallicty estimates for a magnitude-limited sample of 27 million stars with (Xu et al. 2022), including nearly 7 million giant stars. In this work, we combine Gaia photometric metallicities, kinematics, and ALLWISE colors to identify large samples of relatively bright () VMP giant stars.
2 Data
The data we employ are drawn from the 2MASS All-Sky Point Source Catalog (2MASS; Skrutskie et al. 2006), the ALLWISE Source Catalog (ALLWISE; Wright et al. 2010; Mainzer et al. 2011), and Gaia EDR3 (Brown et al. 2021).
2MASS collected data covering 99.998% of the celestial sphere in the near-infrared (1.25 m), (1.65 m), and (2.16 m) bands, and obtained data for 471 million stellar objects. The ALLWISE program builds upon the work of the successful Wide-field Infrared Survey Explorer mission (WISE; Wright et al. 2010), by combining data from the WISE cryogenic and NEOWISE Mainzer et al. 2011). The ALLWISE Source Catalog has provided photometry in four infrared bands: (3.4 m), (4.6 m), (12 m), and (22 m) for over 747 million objects.
Gaia EDR3 has provided the best available photometric data to date, obtaining colors with unprecedented mmag precision, as well as parallaxes of unprecedented mas precision for more than one billion stars over the entire sky. Using the color correction of Niu et al. (2021), the -magnitude correction of Yang et al. (2021), the parallax correction of Lindegren et al. (2021a), and careful reddening corrections using empirical color- and reddening-dependent coefficients, Xu et al. (2022) have provided photometric metallicities for a magnitude-limited sample of 27 million FGK stars down to [Fe/H] with , , and mag, based on the empirical metallicity-dependent stellar locus determined from LAMOST DR7 (Luo et al. 2015). The metallicity catalog of Xu et al. (2022) contains about 7 million giants. Their typical metallicity errors are 0.2 – 0.3 dex for sources with . We compare the [Fe/H] from Xu et al. (2022) with four other catalogs in Appendix A, and find good consistency in all cases. Note that the General Stellar Parametrizer from Spectroscopy of Gaia (Gaia GSP-Spec; Gaia Collaboration et al. 2022) provides a good sample to search for metal-poor stars, but most Gaia GSP-Spec sources have .
However, there exist (at least) two flaws in the Gaia photometric metallicites mentioned above. One is that the metallicities of some metal-rich stars were significantly under-estimated due to the effects of binary or phot_bp_rp_excess_factor111 Note that the binary effect and the phot_bp_rp_excess_factor effect show a similar behavior, as binaries tend to have a slightly larger phot_bp_rp_excess_factor., and mis-classified as metal-poor stars. Such a flaw can be largely avoided with the use of additional criteria, as described below. The other is that we failed to obtain metallicities for a large ( 30 %) fraction of VMPs because their Gaia colors lie beyond the boundaries of the metallicity-dependent stellar locus of Xu et al. (2022); as a result, those stars were dropped in their catalog. We bring them back in this work because they are very likely VMPs, and we find that we can assign reasonably precise metallicities down to [Fe/H] = through the use of additional criteria.
3 Methodologies Employed
Due to the relatively small number of bright VMP dwarf stars in the solar neighbourhood, we only focus on giants with in this work. A relative error cut of parallax_over_error 2 is also applied to remove stars with likely large distance errors.
We have further adopted three independent criteria to select VMP candidates: the Gaia criterion, the WISE criterion, and the kinematic criterion. The criteria can be used independently, or in combination, in order to select VMP samples with different efficiency. Below we describe these three criteria.
3.1 Gaia Criterion
The Gaia criterion is very straightforward. We simply select candidate giant stars with [Fe/H] from Xu et al. (2022). But it has two limitations. One is that it cannot include stars with . The other is contamination from more metal-rich stars due to the effects of binary or phot_bp_rp_excess_factor, as mentioned in Section 2.
3.2 WISE Criterion
Following Schlaufman & Casey (2014), we also use the WISE colors to select VMP candidates. However, differing from Schlaufman & Casey (2014), we have performed reddening corrections and use an updated criterion to improve the selection efficiency.
To determine the new WISE criterion, we use a selected sample of giant stars from LAMOST DR8 (Wang et al. 2022) that have high-quality 2MASS and ALLWISE photometry with errors smaller than 0.025 mag and reddening values smaller than 0.01 mag. These stars are dereddened using the Schlegel, Finkbeiner, & Davis (1998, hereafter SFD) dust reddening map. The reddening coefficients for the and colors are empirically determined by Zhang et al. (2022, in preparation), which are 0.11 and 0.056, respectively. With the sample above, by considering both the selection efficiency and completeness, we set the new criterion to be , as shown in Figure 1; it yields a success rate of 46 and a completeness of 84 for the sample used.
With the new criterion, we cross-match the Gaia EDR3, 2MASS, and ALLWISE catalogs to first select giant stars, then the subset of these that are candidate VMP stars. For stars with , the giant stars are from Xu et al. (2022). and the SFD reddening map is used. For stars with , the three-dimensional dust map from Chen et al. (2019) is used to do the reddening correction, which provides , and . The giant stars are selected as those with , assuming that , as given by Yuan et al. (2013). Note there is also a cut of kpc, because of the distance limit of Chen et al. (2019). To avoid low success rates caused by large photometric errors, we also require that errors of the , and bands are lower than 0.03, 0.025, and 0.025 mag, respectively. Note that the color can also be used to select M giant stars and estimate their metallicities (Li et al. 2016).

3.3 Kinematic Criteria
As mentioned above, some metal-rich stars are mis-classified as metal-poor stars with the Gaia photometric metallicities. Most metal-rich stars are disk stars, while most VMP ones are halo stars. Since the majority of disk stars and halo stars have different motions, we explore kinematics to exclude metal-rich stars from candidate Gaia VMP stars.
Figure 2 shows the Gaia tangential velocities, as a function of [Fe/H], for stars over different Galactic longitude ranges. Note that the unit for tangential velocities is mas kpc year-1, which can easily be converted to km s-1 by multiplying by 4.74. Here the stars are from the giant test sample of Xu et al. (2022). One can see that most metal-rich ([Fe/H] ) stars have tangential velocities lower than 40 mas kpc year-1, but metal-poor stars ([Fe/H] ) have a much wider range, from 0 to 140 mas kpc year-1. Therefore, one can make a cut on tangential velocities to remove of the most metal-rich stars. The limits (red lines in Figure 2) are different: 30 mas kpc year-1 for sources within , 20 mas kpc year-1 for sources with , and 25 mas kpc year-1 for sources with or . Such a kinematic criterion can be used together with the Gaia and WISE criteria to select cleaner VMP samples, albeit with the introduction of a kinematic bias. Note that a small number of VMP stars with disk-like orbits are likely excluded by this criterion.

3.4 Different Samples
There are three criteria in our work, as described above. For sources with , we define a Gold sample, two Silver samples, and two Bronze samples, corresponding to the confidence we place in the selection of VMP stars. The Gold sample satisfies all three criteria. The Silver GK sample satisfies the Gaia and Kinematic criteria, and the Silver GW sample satisfies the Gaia and WISE criteria. The Bronze G sample satisfies the Gaia criterion only. The Bronze WK sample satisfies the WISE and Kinematic criteria. For sources with , we use the WISE and kinematic criteria to select VMP stars, and refer to them as the Low sample. The samples and their selection criteria are summarized in Table 1.
By cross-matching with results derived from medium-resolution ( 1800) from LAMOST DR8, we establish that the success rate for identifying VMP stars is 60.1 for the Gold sample, 39.2 for the Silver GW sample, 41.3 for the Silver GK sample, 15.4 for the Bronze G sample, 31.7 for the Bronze WK sample, and 16.6 for the Low sample, respectively.
| Kinematic | WISE | Gaia | |
|---|---|---|---|
| ✓ | ✓ | ✓ | |
| ✓ | ✓ | ||
| ✓ | ✓ | ||
| ✓ | |||
| ✓ | ✓ | ||
| bb | ✓ | ✓ |
a For sources with . b for sources with .
4 Results
After applying the criteria described above, for sources with , we have identified 24,304 Gold sample stars, 40,157 Silver GW sample stars, 120,452 Silver GK sample stars, 291,690 Bronze G sample stars, and 68,526 Bronze WK sample stars. A total of 4,645 stars with is also collected in the Low sample. All of the samples are publicly available222https://doi.org/10.12149/101160. The columns for the five samples with sources of are the same as listed in Table 2. The columns for the Low sample are listed in Table 3. In this section, we describe our six samples and discuss their relative success rates.
4.1 Properties of the Samples
The -magnitude distributions for the six samples are shown in Figure 3. All of the candidate stars are brighter than 15 in the -band, which are relatively easy to access with high-resolution follow-up spectroscopic observations. There is a peak around in the Gold, Silver GW, and Bronze WK samples, due to the cut on photometric errors in the WISE criterion.

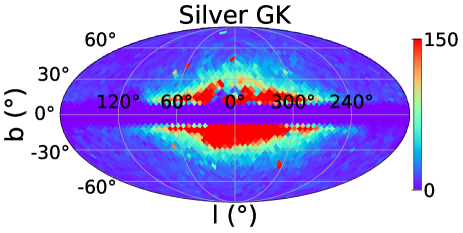
Spatial distributions of the six samples in the Galactic coordinate system are shown in Figure 4. The sources are roughly evenly distributed over high Galactic latitude areas, and slightly increase toward the Galactic center direction. For the Bronze G sample, there is a strong over-density in the dense Galactic center and disk regions, mainly because there are more metal-rich stars mis-classified as VMP stars. Such an over-density is significantly reduced by application of the Wise and Kinematic criteria. For the Gold sample, there is still a weak over-density in the Galactic center direction, which is likely real to some extent, because we expect to have more VMP stars there compared to those near the Sun’s position in the Galaxy.


| Field | Description | Unit |
|---|---|---|
| source_id | Unique source identifier for EDR3 (unique with a particular Data Release) | – |
| ra | Right ascension | deg |
| dec | Declination | deg |
| parallax | Parallax | mas |
| parallax_error | Standard error of parallax | mas |
| pmra | Proper motion in right ascension direction | mas/year |
| pmra_error | Standard error of proper motion in right ascension direction | mas/year |
| pmdec | Proper motion in declination direction | mas/year |
| pmdec_error | Standard error of proper motion in declination direction | mas/year |
| ruwe | Renormalised unit weight error | – |
| phot_g_mean_flux_over_error | -band mean flux divided by its error | – |
| phot_g_mean_mag | -band mean magnitude | – |
| phot_bp_mean_flux_over_error | -band mean flux divided by its error | – |
| phot_bp_mean_mag | Integrated -band mean magnitude | – |
| phot_rp_mean_flux_over_error | -band mean flux divided by its error | – |
| phot_rp_mean_mag | Integrated -band mean magnitude | – |
| phot_bp_rp_excess_factor | excess factor | – |
| l | Galactic longitude | deg |
| b | Galactic latitude | deg |
| ebv | Value of E (B V ) from from the extinction map of SFD98 | – |
| correct_bp_rp | Intrinsic color after color correction of Niu et al. (2021) | – |
| correct_bp_g | Intrinsic color after color correction of Niu et al. (2021) | – |
| correct_g_rp | Intrinsic color after color correction of Niu et al. (2021) | – |
| FeH_Gaia | Photometric metallicity | – |
| FeH_Gaia_error | Formal error of FeH_Gaia | dex |
| W1mag | magnitude | – |
| W2mag | magnitude | – |
| Jmag | magnitude | – |
| Hmag | magnitude | – |
| Kmag | magnitude | – |
| e_W1mag | Error of magnitude | mag |
| e_W2mag | Error of magnitude | mag |
| e_Jmag | Error of magnitude | mag |
| e_Hmag | Error of magnitude | mag |
| e_Kmag | Error of magnitude | mag |
| parallax_corrected | Parallax corrected by Lindegren et al. (2021a) | mas |
| radial_velocity | radial velocity | km s-1 |
| radial_velocity_error | radial velocity error | km s-1 |
| Field | Description | Unit |
|---|---|---|
| source_id | Unique source identifier for EDR3 (unique with a particular Data Release) | – |
| ra | Right ascension | deg |
| dec | Declination | deg |
| parallax | Parallax | mas |
| parallax_error | Standard error of parallax | mas |
| pmra | Proper motion in right ascension direction | mas/year |
| pmra_error | Standard error of proper motion in right ascension direction | mas/year |
| pmdec | Proper motion in declination direction | mas/year |
| pmdec_error | Standard error of proper motion in declination direction | mas/year |
| ruwe | Renormalised unit weight error | – |
| phot_g_mean_flux_over_error | -band mean flux divided by its error | – |
| phot_g_mean_mag | -band mean magnitude | – |
| phot_bp_mean_flux_over_error | -band mean flux divided by its error | – |
| phot_bp_mean_mag | Integrated -band mean magnitude | – |
| phot_rp_mean_flux_over_error | -band mean flux divided by its error | – |
| phot_rp_mean_mag | Integrated -band mean magnitude | – |
| phot_bp_rp_excess_factor | excess factor | – |
| l | Galactic longitude | deg |
| b | Galactic latitude | deg |
| correct_bp_rp | Intrinsic color after color correction of Niu et al. (2021) | – |
| and reddening correction of Chen et al. (2019) | ||
| W1mag | magnitude | – |
| W2mag | magnitude | – |
| Jmag | magnitude | – |
| Hmag | magnitude | – |
| Kmag | magnitude | – |
| M_K_S | Absolute magnitude in the band | |
| e_W1mag | Error of magnitude | mag |
| e_W2mag | Error of magnitude | mag |
| e_Jmag | Error of magnitude | mag |
| e_Hmag | Error of magnitude | mag |
| e_Kmag | Error of magnitude | mag |
| parallax_corrected | Parallax corrected by Lindegren et al. (2021a) | mas |
| radial_velocity | radial velocity | km s-1 |
| radial_velocity_error | radial velocity error | km s-1 |
4.2 Success Rates of the Samples
We cross-match our six samples with LAMOST DR8 (Wang et al. 2022) in order to test the success rates of our various criteria. LAMOST DR8 has provided values of stellar atmospheric parameters for 5.16 million unique stars, including reliable estimates of [Fe/H] down to (see Figure A4 of Wang et al. 2022).
There are 2764, 4719, 6153, 18353, 8377, and 193 stars found in common for the Gold, Silver GW, Silver GK, Bronze G, Bronze WK, and Low samples, respectively, after a signal-to-noise cut in the -band (). Their [Fe/H] distributions are plotted in black in Figure 5. The Bronze G, Silver GW, and Silver GK samples show two clear peaks, one for the VMP stars, the other for the metal-rich stars. The metal-rich peak is most prominent in the Bronze G sample, as explained in Section 2. The metal-rich peak becomes weaker and weaker in the Silver GW and GK samples, and disappears in the Gold sample. The result suggests that the WISE and Kinematic criterion, particularly the latter, work well in removing contamination from metal-rich stars. There are quite large fractions of metal-poor stars ( [Fe/H] ) in the Bronze WK and Low samples, both of which have used the WISE criterion. This is perhaps not surprising, given the relatively large errors in the WISE colors. Note that there is a dip at [Fe/H] in all samples, most prominent in the Bronze WK sample. This arises because, in LAMOST DR8, the metallicities for stars with [Fe/H] and are measured by two different pipelines (see Section 5 of Wang et al. 2022).
For a given sample, we define its success rate for selecting stars with [Fe/H] lower than a given limit as the ratio of DR8 stars in common with [Fe/H] lower than the limit, relative to the total number of stars in common. The results are listed in Table 4. For the Gold sample, the success rate is 93.0%, 83.1%, 60.1%, and 16.2% for stars with [Fe/H] lower than , , , and , respectively. For the two Silver samples, the success rate is somewhat lower, about 40% for stars with [Fe/H] . It decreases to 31.8% for the Bronze WK sample, 15.4% for the Bronze G sample, and 16.6% for the Low sample, respectively.
The Bronze G sample shows the lowest success rate in all cases, due to the much larger number of metal-rich binary stars compared to VMP stars. To increase its success rate, we use the Renormalized Unit Weight Error (RUWE; Lindegren et al. 2021b) to exclude binaries with poor astrometric solutions. The sources with larger RUWE values are more likely binaries. We find that an empirical cut of (red lines in Figure 5) can well-remove metal-rich binaries for the Gaia criterion333 Note the cut on RUWE is only used to remove binaries, regardless of their metallicites. However, as most binaries are metal-rich in terms of numbers, it seems that the cut preferentially removes metal-rich binaries.. With this simple additional criterion, the success rate of VMP stars increases to 63.1 for the Gold sample, about 50 for the Silver samples, and 29.3 for the Bronze G sample, as listed in Table 4.
| Sample | Total No. | No. of common sources | [Fe/H] | [Fe/H] | [Fe/H] | [Fe/H] | [Fe/H] |
|---|---|---|---|---|---|---|---|
| 24,304 | 2,764 | 2.9% | 16.2% | 60.1% | 83.1% | 93.0% | |
| 20,436 | 2,139 | 3.3% | 17.4% | 63.1% | 86.2% | 95.7% | |
| 40,157 | 4,719 | 1.9% | 10.9% | 39.2% | 54.6% | 61.8% | |
| 30,492 | 3,272 | 2.4% | 13.3% | 46.9% | 64.8% | 72.7% | |
| 120,452 | 6,153 | 2.1% | 11.1% | 41.3% | 60.0% | 73.3% | |
| 91,952 | 4,168 | 2.8% | 14.3% | 51.6% | 73.4% | 87.4% | |
| 291,690 | 18,353 | 0.8% | 4.2% | 15.4% | 22.4% | 28.2% | |
| 173,544 | 8,185 | 1.6% | 9.3% | 29.3% | 41.8% | 50.6% | |
| 69,526 | 8,377 | 1.3% | 6.8% | 31.8% | 56.0% | 82.5% | |
| 60,896 | 7,065 | 1.4% | 6.9% | 31.7% | 56.0% | 83.2% | |
| ba | 4,645 | 193 | 1.5% | 4.7% | 16.6% | 32.6% | 66.3% |
| bb | 3,910 | 144 | 0.0% | 4.2% | 18.8% | 36.1% | 68.8% |
a Default samples. b Samples after applying the additional cut of .

Figure 6 plots the success rate of VMP stars identified in different sky areas. The success rate is relatively larger in the higher Galactic latitude regions due to less contamination. For samples using the Gaia criterion, the success rate in the Southern Galactic Hemisphere is lower than that in the Northern Galactic Hemisphere, likely due to the different systematics in the SFD reddening map (Schlafly et al. 2010; Sun et al. 2022). Systematic errors in the SFD map result in systematic errors in the Gaia metallicities.
We also cross-match our six samples with SEGUE DR12 (Alam et al. 2015) in order to test the success rates of our various criteria. The numbers of stars in common are limited, due to the bright limit for SDSS () – only 49 stars for the Gold sample and 323 stars for the Bronze G sample. We find that the overall success rates are slightly better than those with LAMOST DR8, because most sources from SEGUE DR12 have , where higher success rates are found in the test with LAMOST DR8.
To analyse the success rate over the full sky, metallicities from the Apache Point Observatory Galactic Evolution Experiment(APOGEE; Majewski et al. 2017) Data Release 17 (Abdurro’uf et al. 2022) are also used. There is an offset between the LAMOST and APOGEE metallicities, so we cross-match LAMOST DR8 giants of and K and those of APOGEE DR17 with to correct for this. Figure 7 plots [Fe/H] LAMOST vs. Fe/H] APOGEE. The linear fitting result of [Fe/H] LAMOST = 0.62 Fe/H] APOGEE 0.94 is over-plotted as the black line. The APOGEE metallicities are converted into LAMOST metallicities using the above relation.
We cross-match our six samples with APOGEE DR17, and only sources with are used in subsequent studies. The result is plotted in Figure 8. The trend is similar to Figure 6. Note the much lower success rate in the region and , due to systematics in the SFD map.


5 Summary
We have used three independent criteria, including the Gaia criterion, the WISE criterion, and the Kinematic criterion, to identify bright VMP giant candidate stars. The Gaia criterion is based on the photometric metallicities from Xu et al. (2022). The WISE criterion takes advantage of the lack of molecular absorption near 4.6 microns for VMP stars (Figure 1). The Kinematic criterion relies on the generally much higher tangential velocities of VMP stars compared to disk stars (Figure 2).
With different combinations of these criteria, we have collected six samples with (Table 1): one Gold sample, two Silver samples, two Bronze samples, and one Low sample. The Gold, Silver GW and GK, Bronze G and WK samples contain 24,304, 40,157, 120,452, 291,690, and 68,526 VMP candidates with , respectively. The Low sample contains 4,645 candidates with . By cross-matching with the LAMOST DR8, the success rate for VMP stars is 60.1 for the Gold sample, 39.2 for the Silver GW sample, 41.3 for the Silver GK sample, 15.4 for the Bronze G sample, 31.7 for the Bronze WK sample, and 16.6 for the Low sample, respectively. The success rate varies with spatial position; this trend is further confirmed with APOGEE DR17. If needed, a simple additional strict cut of can further increase these success rates, to 63.1 for the Gold sample, about 50 for the Silver samples, and 29.3 for the Bronze G sample. Using 3D velocities, when available, rather than tangential velocities alone, will also increase the success rate of the Silver GK from 41.3 to 46.0 and Bronze WK samples from 31.8 to 38.5.
Our samples provide valuable candidates for high-resolution follow-up spectroscopic observations to find and study the most metal-poor stars. The samples are also useful in studies of the Galactic halo.
With the latest release of Gaia DR3 BP/RP spectra, one expects to identify VMP stars more easily and accurately than from Gaia colors alone. Such explorations will be carried out in the near future.
Appendix A comparison of [Fe/H] with other catalogs
We cross-match Xu et al. (2022) catalog with five other catalogs: Gaia GSP-Spec, the GALactic Archaeology with HERMES (GALAH) survey (Martell et al. 2016; Buder et al. 2021, SEGUE, PASTEL (Soubiran et al. 2010, 2016), and the Stellar Abundances for Galactic Archaeology (SAGA; Suda et al. 2008, 2011; Yamada et al. 2013; Suda et al. 2017). Only giants with are used in this comparison. The numbers of common sources are 144549, 126338, 2501, 611, and 501 for the Gaia GSP-Spec, GALAH, SEGUE, PASTEL, and SAGA, respectively. The results are shown in Figure A1. One can see that the [Fe/H] measurements are consistent. Note that the GSP-Spec metallicities are systematically higher by about 0.25 dex compared to the Xu et al. (2022) results.


References
- Abdurro’uf et al. (2022) Abdurro’uf, Accetta, K., Aerts, C., et al. 2022, ApJS, 259, 35, doi: 10.3847/1538-4365/ac4414
- Aguado et al. (2017) Aguado, D. S., Allende Prieto, C., González Hernández, J. I., Rebolo, R., & Caffau, E. 2017, A&A, 604, A9, doi: 10.1051/0004-6361/201731320
- Aguado et al. (2019) Aguado, D. S., Youakim, K., González Hernández, J. I., et al. 2019, MNRAS, 490, 2241, doi: 10.1093/mnras/stz2643
- Alam et al. (2015) Alam, S., Albareti, F. D., Allende Prieto, C., et al. 2015, ApJS, 219, 12, doi: 10.1088/0067-0049/219/1/12
- An & Beers (2020) An, D., & Beers, T. C. 2020, ApJ, 897, 39, doi: 10.3847/1538-4357/ab8d39
- Beers & Christlieb (2005) Beers, T. C., & Christlieb, N. 2005, ARA&A, 43, 531, doi: 10.1146/annurev.astro.42.053102.134057
- Beers et al. (1985) Beers, T. C., Preston, G. W., & Shectman, S. A. 1985, AJ, 90, 2089, doi: 10.1086/113917
- Beers et al. (1992) —. 1992, AJ, 103, 1987, doi: 10.1086/116207
- Brown et al. (2021) Brown, A. G. A., Vallenari, A., Prusti, T., et al. 2021, Astronomy & Astrophysics, 650, C3, doi: 10.1051/0004-6361/202039657e
- Buder et al. (2021) Buder, S., Sharma, S., Kos, J., et al. 2021, Monthly Notices of the Royal Astronomical Society, 506, 150, doi: 10.1093/mnras/stab1242
- Casey & Schlaufman (2015) Casey, A. R., & Schlaufman, K. C. 2015, ApJ, 809, 110, doi: 10.1088/0004-637X/809/2/110
- Cenarro et al. (2019) Cenarro, A. J., Moles, M., Cristóbal-Hornillos, D., et al. 2019, A&A, 622, A176, doi: 10.1051/0004-6361/201833036
- Chen et al. (2019) Chen, B. Q., Huang, Y., Yuan, H. B., et al. 2019, MNRAS, 483, 4277, doi: 10.1093/mnras/sty3341
- Chiappini (2013) Chiappini, C. 2013, Astronomische Nachrichten, 334, 595, doi: 10.1002/asna.201311902
- Christlieb et al. (2008) Christlieb, N., Schörck, T., Frebel, A., et al. 2008, A&A, 484, 721, doi: 10.1051/0004-6361:20078748
- Cui et al. (2012) Cui, X.-Q., Zhao, Y.-H., Chu, Y.-Q., et al. 2012, Research in Astronomy and Astrophysics, 12, 1197, doi: 10.1088/1674-4527/12/9/003
- Deng et al. (2012) Deng, L.-C., Newberg, H. J., Liu, C., et al. 2012, Research in Astronomy and Astrophysics, 12, 735, doi: 10.1088/1674-4527/12/7/003
- Fulbright et al. (2010) Fulbright, J. P., Wyse, R. F. G., Ruchti, G. R., et al. 2010, ApJ, 724, L104, doi: 10.1088/2041-8205/724/1/L104
- Gaia Collaboration et al. (2022) Gaia Collaboration, Creevey, O. L., Sarro, L. M., et al. 2022, arXiv e-prints, arXiv:2206.05870. https://arxiv.org/abs/2206.05870
- Galarza et al. (2022) Galarza, C. A., Daflon, S., Placco, V. M., et al. 2022, A&A, 657, A35, doi: 10.1051/0004-6361/202141717
- Heger & Woosley (2010) Heger, A., & Woosley, S. E. 2010, ApJ, 724, 341, doi: 10.1088/0004-637X/724/1/341
- Huang et al. (2022) Huang, Y., Beers, T. C., Wolf, C., et al. 2022, ApJ, 925, 164, doi: 10.3847/1538-4357/ac21cb
- Iwamoto et al. (2005) Iwamoto, N., Umeda, H., Tominaga, N., Nomoto, K., & Maeda, K. 2005, Science, 309, 451, doi: 10.1126/science.1112997
- Keller et al. (2007) Keller, S. C., Schmidt, B. P., Bessell, M. S., et al. 2007, PASA, 24, 1, doi: 10.1071/AS07001
- Keller et al. (2014) Keller, S. C., Bessell, M. S., Frebel, A., et al. 2014, Nature, 506, 463, doi: 10.1038/nature12990
- Li et al. (2015a) Li, H., Aoki, W., Zhao, G., et al. 2015a, PASJ, 67, 84, doi: 10.1093/pasj/psv053
- Li et al. (2018) Li, H., Tan, K., & Zhao, G. 2018, ApJS, 238, 16, doi: 10.3847/1538-4365/aada4a
- Li et al. (2022) Li, H., Aoki, W., Matsuno, T., et al. 2022, arXiv e-prints, arXiv:2203.11529. https://arxiv.org/abs/2203.11529
- Li et al. (2015b) Li, H.-N., Aoki, W., Honda, S., et al. 2015b, Research in Astronomy and Astrophysics, 15, 1264, doi: 10.1088/1674-4527/15/8/011
- Li et al. (2015c) Li, H.-N., Zhao, G., Christlieb, N., et al. 2015c, ApJ, 798, 110, doi: 10.1088/0004-637X/798/2/110
- Li et al. (2016) Li, J., Smith, M. C., Zhong, J., et al. 2016, The Astrophysical Journal, 823, 59, doi: 10.3847/0004-637x/823/1/59
- Limberg et al. (2021) Limberg, G., Santucci, R. M., Rossi, S., et al. 2021, ApJ, 913, 11, doi: 10.3847/1538-4357/abeefe
- Lindegren et al. (2021a) Lindegren, L., Bastian, U., Biermann, M., et al. 2021a, A&A, 649, A4, doi: 10.1051/0004-6361/202039653
- Lindegren et al. (2021b) Lindegren, L., Klioner, S. A., Hernández, J., et al. 2021b, A&A, 649, A2, doi: 10.1051/0004-6361/202039709
- Liu et al. (2014) Liu, X. W., Yuan, H. B., Huo, Z. Y., et al. 2014, in Setting the scene for Gaia and LAMOST, ed. S. Feltzing, G. Zhao, N. A. Walton, & P. Whitelock, Vol. 298, 310–321, doi: 10.1017/S1743921313006510
- Luo et al. (2015) Luo, A.-L., Zhao, Y.-H., Zhao, G., et al. 2015, Research in Astronomy and Astrophysics, 15, 1095, doi: 10.1088/1674-4527/15/8/002
- Mainzer et al. (2011) Mainzer, A., Bauer, J., Grav, T., et al. 2011, ApJ, 731, 53, doi: 10.1088/0004-637X/731/1/53
- Majewski et al. (2017) Majewski, S. R., Schiavon, R. P., Frinchaboy, P. M., et al. 2017, AJ, 154, 94, doi: 10.3847/1538-3881/aa784d
- Mardini et al. (2019) Mardini, M. K., Li, H., Placco, V. M., et al. 2019, ApJ, 875, 89, doi: 10.3847/1538-4357/ab0fa2
- Martell et al. (2016) Martell, S. L., Sharma, S., Buder, S., et al. 2016, Monthly Notices of the Royal Astronomical Society, 465, 3203, doi: 10.1093/mnras/stw2835
- Mendes de Oliveira et al. (2019) Mendes de Oliveira, C., Ribeiro, T., Schoenell, W., et al. 2019, MNRAS, 489, 241, doi: 10.1093/mnras/stz1985
- Meynet et al. (2010) Meynet, G., Hirschi, R., Ekstrom, S., et al. 2010, A&A, 521, A30, doi: 10.1051/0004-6361/200913377
- Niu et al. (2021) Niu, Z., Yuan, H., & Liu, J. 2021, ApJ, 908, L14, doi: 10.3847/2041-8213/abe1c2
- Placco et al. (2022) Placco, V. M., Almeida-Fernandes, F., Arentsen, A., et al. 2022, arXiv e-prints, arXiv:2206.09003. https://arxiv.org/abs/2206.09003
- Rockosi et al. (2022) Rockosi, C. M., Lee, Y. S., Morrison, H. L., et al. 2022, ApJS, 259, 60, doi: 10.3847/1538-4365/ac5323
- Schlafly et al. (2010) Schlafly, E. F., Finkbeiner, D. P., Schlegel, D. J., et al. 2010, The Astrophysical Journal, 725, 1175, doi: 10.1088/0004-637x/725/1/1175
- Schlaufman & Casey (2014) Schlaufman, K. C., & Casey, A. R. 2014, ApJ, 797, 13, doi: 10.1088/0004-637X/797/1/13
- Schlegel et al. (1998) Schlegel, D. J., Finkbeiner, D. P., & Davis, M. 1998, ApJ, 500, 525, doi: 10.1086/305772
- Skrutskie et al. (2006) Skrutskie, M. F., Cutri, R. M., Stiening, R., et al. 2006, AJ, 131, 1163, doi: 10.1086/498708
- Soubiran et al. (2016) Soubiran, C., Le Campion, J.-F., Brouillet, N., & Chemin, L. 2016, A&A, 591, A118, doi: 10.1051/0004-6361/201628497
- Soubiran et al. (2010) Soubiran, C., Le Campion, J. F., Cayrel de Strobel, G., & Caillo, A. 2010, A&A, 515, A111, doi: 10.1051/0004-6361/201014247
- Starkenburg et al. (2017) Starkenburg, E., Oman, K. A., Navarro, J. F., et al. 2017, MNRAS, 465, 2212, doi: 10.1093/mnras/stw2873
- Suda et al. (2011) Suda, T., Yamada, S., Katsuta, Y., et al. 2011, MNRAS, 412, 843, doi: 10.1111/j.1365-2966.2011.17943.x
- Suda et al. (2008) Suda, T., Katsuta, Y., Yamada, S., et al. 2008, PASJ, 60, 1159, doi: 10.1093/pasj/60.5.1159
- Suda et al. (2017) Suda, T., Hidaka, J., Aoki, W., et al. 2017, PASJ, 69, 76, doi: 10.1093/pasj/psx059
- Sun et al. (2022) Sun, Y., Yuan, H., & Chen, B. 2022, The Astrophysical Journal Supplement Series, 260, 17, doi: 10.3847/1538-4365/ac642f
- Wang et al. (2022) Wang, C., Huang, Y., Yuan, H., et al. 2022, ApJS, 259, 51, doi: 10.3847/1538-4365/ac4df7
- Whitten et al. (2019) Whitten, D. D., Placco, V. M., Beers, T. C., et al. 2019, A&A, 622, A182, doi: 10.1051/0004-6361/201833368
- Whitten et al. (2021) —. 2021, ApJ, 912, 147, doi: 10.3847/1538-4357/abee7e
- Wright et al. (2010) Wright, E. L., Eisenhardt, P. R. M., Mainzer, A. K., et al. 2010, AJ, 140, 1868, doi: 10.1088/0004-6256/140/6/1868
- Xu et al. (2022) Xu, S., Yuan, H., Niu, Z., et al. 2022, ApJS, 258, 44, doi: 10.3847/1538-4365/ac3df6
- Yamada et al. (2013) Yamada, S., Suda, T., Komiya, Y., Aoki, W., & Fujimoto, M. Y. 2013, MNRAS, 436, 1362, doi: 10.1093/mnras/stt1652
- Yang et al. (2021) Yang, L., Yuan, H., Zhang, R., et al. 2021, ApJ, 908, L24, doi: 10.3847/2041-8213/abdbae
- Yang et al. (2022) Yang, L., Yuan, H., Xiang, M., et al. 2022, A&A, 659, A181, doi: 10.1051/0004-6361/202142724
- Yanny et al. (2009) Yanny, B., Rockosi, C., Newberg, H. J., et al. 2009, AJ, 137, 4377, doi: 10.1088/0004-6256/137/5/4377
- Yuan et al. (2015) Yuan, H., Liu, X., Xiang, M., Huang, Y., & Chen, B. 2015, ApJ, 803, 13, doi: 10.1088/0004-637X/803/1/13
- Yuan et al. (2013) Yuan, H. B., Liu, X. W., & Xiang, M. S. 2013, MNRAS, 430, 2188, doi: 10.1093/mnras/stt039
- Zhang et al. (2021) Zhang, R.-Y., Yuan, H.-B., Liu, X.-W., et al. 2021, Research in Astronomy and Astrophysics, 21, 319, doi: 10.1088/1674-4527/21/12/319
- Zhao et al. (2012) Zhao, G., Zhao, Y.-H., Chu, Y.-Q., Jing, Y.-P., & Deng, L.-C. 2012, Research in Astronomy and Astrophysics, 12, 723, doi: 10.1088/1674-4527/12/7/002