2022
[1]\fnmIlse C. F. \surIpsen
[1]\orgdivDepartment of Mathematics, \orgnameNorth Carolina State University, \orgaddress\cityRaleigh, \postcode27695, \stateNC, \countryUS
2]\orgdivMathematical Sciences, \orgnameUniversity of Southampton, \orgaddress\citySouthampton, \postcodeSO17 1BJ, \countryUK
3]\orgdivSchool of Mathematics and Statistics, \orgnameNewcastle University, \orgaddress\cityNewcastle-upon-Tyne, \postcodeNE1 7RU, \countryUK
Statistical Properties of BayesCG under the Krylov prior
Abstract
Abstract
1 Introduction
We present a rigorous analysis of the probabilistic numeric solver BayesCG under the Krylov prior Cockayne:BCG; RICO21 for solving systems of linear equations
| (1) |
with symmetric positive definite coefficient matrix .
Probabilistic numerics.
This area Cockayne:BPNM; HOG15; Oates seeks to quantify the uncertainty due to limited computational resources, and to propagate these uncertainties through computational pipelines—sequences of computations where the output of one computation is the input for the next. At the core of many computational pipelines are iterative linear solvers CIOR20; HBH20; NW06; PZSHG12; SHB21, whose computational resources are limited by the impracticality of running the solver to completion. The premature termination generates uncertainty in the computed solution.
Probabilistic numeric linear solvers.
Probabilistic numeric extensions of Kry-lov space and stationary iterative methods Bartels; CIOR20; Cockayne:BCG; Fanaskov21; Hennig; RICO21; WH20 model the ‘epistemic uncertainty’ in a quantity of interest, which can be the matrix inverse Hennig; Bartels; WH20 or the solution Cockayne:BCG; Bartels; CIOR20; Fanaskov21. Our quantity of interest is the solution , and the ‘epistemic uncertainty’ is the uncertainty in the user’s knowledge of the true value of .
The probabilistic solver takes as input a prior distribution which models the initial uncertainty in and then computes posterior distributions which model the uncertainty remaining after each iteration. Figure 1.1 depicts a prior and posterior distribution for the solution of 2-dimensional linear system.


Calibration.
An important criterion of probabilistic solvers is the statistical quality of their posterior distributions. A solver is ‘calibrated’ if its posterior distributions accurately model the uncertainty in (Cockayne:BCG, Section 6.1). Probabilistic Krylov solvers are not always calibrated because their posterior distributions tend to be pessimistic. This means, the posteriors imply that the error is larger than it actually is (Bartels, Section 6.4), (Cockayne:BCG, Section 6.1). Previous efforts for improving calibration have focused on scaling the posterior covariances (Cockayne:BCG, Section 4.2), (Fanaskov21, Section 7), (WH20, Section 3).
BayesCG.
We analyze the calibration of BayesCG under the Krylov prior Cockayne:BCG; RICO21. BayesCG was introduced in Cockayne:BCG as a probabilistic numeric extension of the Conjugate Gradient (CG) method Hestenes for solving (1). The Krylov prior proposed in RICO21 makes BayesCG competitive with CG. The numerical properties of BayesCG under the Krylov prior are analysed in RICO21, while here we analyse its statistical properties.
1.1 Contributions and Overview
Overall Conclusion.
BayesCG under the Krylov prior is not calibrated in the strict sense, but has the desirable properties of a calibrated solver. Under the efficient approximate Krylov posteriors, BayesCG is only slightly optimistic and competitive with CG.
Background (Section 2).
We present a short review of BayesCG, and the Krylov prior and posteriors.
Approximate Krylov posteriors (Section 3).
We define the -Wasserstein distance (Definition 3.3, Theorem 3.4); determine the error between Krylov posteriors and their low-rank approximations in the -Wasserstein distance (Theorem 3.5); and present a statistical interpretation of a Krylov prior as an empirical Bayesian procedure (Theorem 3.7, Remark 3.8).
Calibration (Section 4).
We review the strict notion of calibration for probabilistic solvers (Definition 4.1, Lemma 4.2), and show that it does not apply to BayesCG under the Krylov prior (Remark 4.6).
We relax the strict notion above and propose as an alternative form of assessment two test statistics that are necessary but not sufficient for calibration: the -statistic (Theorem 4.9) and the new -statistic (Theorem 4.15, Definition 4.17). We present implementations for both (Algorithms 4.1 and 4.2); and apply a Kolmogorov-Smirnov statistic (Definition 4.11) for evaluating the quality of samples from the -statistic.
Numerical Experiments (Section 5).
We create a calibrated but slowly converging version of BayesCG which has random search directions, and use it as a baseline for comparison with two BayesCG versions that both replicate CG: BayesCG under the inverse and the Krylov priors.
We assess calibration with the - and -statistics for BayesCG with random search directions (Algorithms B.1 and B.2); BayesCG under the inverse prior (Algorithms 2.1 and B.3); and BayesCG under the Krylov prior with full posteriors (Algorithm B.4) and approximate posteriors (Algorithm B.5).
Both, - and statistics indicate that BayesCG with random search directions is indeed a calibrated solver, while BayesCG under the inverse prior is pessimistic.
The -statistic indicates that BayesCG under full Krylov posteriors mimics a calibrated solver, and that BayesCG under rank-50 approximate posteriors does as well, although not as much, since it is slightly optimistic.
1.2 Notation
Matrices are represented in bold uppercase, such as ; vectors in bold lowercase, such as ; and scalars in lowercase, such as .
The identity matrix is , or just if the dimension is clear. The Moore-Penrose inverse of a matrix is , and the matrix square root is (Higham08, Chapter 6).
Probability distributions are represented in lowercase Greek, such as ; and random variables in uppercase, such as . The random variable having distribution is represented by , and its expectation by .
The Gaussian distribution with mean and covariance is denoted by , and the chi-squared distribution with degrees of freedom by .
2 Review of Existing Work
We review BayesCG (Section 2.1), the ideal Krylov prior (Section 2.2), and practical approximations for Krylov posteriors (Section 2.3). All statements in this section hold in exact arithmetic.
2.1 BayesCG
We review the computation of posterior distributions for BayesCG under general priors (Theorem 2.1), and present a pseudo code for BayesCG (Algorithm 2.1).
Given an initial guess , BayesCG Cockayne:BCG solves symmetric positive definite linear systems (1) by computing iterates that converge to the solution . In addition, BayesCG computes probability distributions that quantify the uncertainty about the solution at each iteration . Specifically, for a user-specified Gaussian prior , BayesCG computes posterior distributions , by conditioning a random variable on information from search directions .
Theorem 2.1 ((Cockayne:BCG, Proposition 1), (RICO21, Theorem 2.1)).
Let be a linear system where is symmetric positive definite. Let be a prior with symmetric positive semi-definite covariance , and initial residual .
Pick so that has and is non-singular. Then, the BayesCG posterior has mean and covariance
| (2) | ||||
| (3) |
Algorithm 2.1 represents the iterative computation of the posteriors from (Cockayne:BCG, Propositions 6 and 7), (RICO21, Theorem 2.7). To illustrate the resemblance of BayesCG and the Conjugate Gradient method, we present the most common implementation of CG in Algorithm 2.2.
BayesCG (Algorithm 2.1) computes specific search directions with two additional properties:
-
1.
They are -orthogonal, which means that is diagonal (Cockayne:BCG, Section 2.3), thus easy to invert.
-
2.
They form a basis for the Krylov space (BCG:Supp, Proposition S4)
Remark 2.2.
2.2 The ideal Krylov Prior
After defining the Krylov space of maximal dimension (Definition 2.3), we review the ideal but impractical Krylov prior (Definition 2.4), and discuss its construction (Lemma 2.6) and properties (Theorem 2.7).
Definition 2.3.
The Krylov space of maximal dimension for Algorithm 2.2 is
Here represents the grade of with respect to (Liesen, Definition 4.2.1), or the invariance index for (Berljafa, Section 2), which is the minimum value where
The Krylov prior is a Gaussian distribution whose covariance is constructed from a basis for the maximal dimensional CG Krylov space.
Definition 2.4 ((RICO21, Definition 3.1)).
The ideal Krylov prior for is with symmetric positive semi-definite covariance
| (4) |
The columns of are an -orthonormal basis for , which means that
The diagonal matrix has diagonal elements
| (5) |
Remark 2.5.
The Krylov prior covariance satisfies the requirement of Algorithm 2.1 that . This follows from (Liesen, Section 5.6),
If the maximal Krylov space has dimension , then is singular.
Lemma 2.6 ((RICO21, Remark SM2.1)).
The Krylov prior can be constructed from quantities computed by CG (Algorithm 2.2),
The posterior distributions from BayesCG under the Krylov prior depend on submatrices of and ,
| (6) |
where , , and , .
Under suitable assumptions, BayesCG (Algorithm 2.1) produces the same iterates as CG (Algorithm 2.2).
Theorem 2.7 ((RICO21, Theorem 3.3)).
Explicit construction of the ideal Krylov prior, followed by explicit computation of the Krylov posteriors in Algorithm 2.1 is impractical, because it is more expensive than solving the linear system (1) in the first place. That is the reason for introducing practical, approximate Krylov posteriors.
2.3 Practical Krylov posteriors
We dispense with the explicit computation of the Krylov prior, and instead compute a low-rank approximation of the final posterior (Definition 2.8) by running additional iterations. The corresponding CG-based implementation of BayesCG under approximate Krylov posteriors is relegated to Algorithm B.5 in Appendix B.
Definition 2.8 ((RICO21, Definition 3.4)).
Given the Krylov prior with posteriors , pick some . The rank- approximation of is a Gaussian distribution with the same mean as , and a rank- covariance
that consists of the leading columns of .
In contrast to the full Krylov posteriors, which reproduce the error as in (8), approximate Krylov posteriors underestimate the error (RICO21, Section 3.4),
| (9) |
where is the error after iterations of CG. The error underestimate is equal to (StrakosTichy, Equation(4.9)), and it is more accurate when convergence is fast. Fast convergence makes a more accurate estimate because fast convergence implies that , and this, along with (9), implies that (StrakosTichy, Section 4).
3 Approximate Krylov Posteriors
We determine the error in approximate Krylov posteriors (Section 3.1), and interpret the Krylov prior as an empirical Bayesian method (Section 3.2).
3.1 Error in Approximate Krylov Posteriors
We review the -Wasserstein distance (Definition 3.1), extend the 2-Wasserstein distance to the -Wasserstein distance weighted by a symmetric positive definite matrix (Theorem 3.4), and derive the -Wasserstein distance between approximate and full Krylov posteriors (Theorem 3.5).
The -Wasserstein distance is a metric on the set of probability distributions.
Definition 3.1 ((KLMU20, Definition 2.1), (Villani09, Definition 6.1)).
The -Wasser-stein distance between probability distributions and on is
| (10) |
where is the set of couplings between and , that is, the set of probability distributions on that have and as marginal distributions.
In the special case , the -Wasserstein or Fréchet distance between two Gaussian distributions admits an explicit expression.
Lemma 3.2 ((Gelbrich90, Theorem 2.1)).
The 2-Wasserstein distance between Gaussian distributions and on is
We generalize the 2-Wasserstein distance to the -Wasserstein distance weighted by a symmetric positive definite matrix .
Definition 3.3.
The two-norm of weighted by a symmetric positive definite is
| (11) |
The -Wasserstein distance between Gaussian distributions and on is
| (12) |
where is the set of couplings between and .
We derive an explicit expression for the -Wasserstein distance analogous to the one for the 2-Wasserstein distance in Lemma 3.2.
Theorem 3.4.
For symmetric positive definite , the -Wasserstein distance between Gaussian distributions and on is
| (13) |
where and .
Proof: First express the -Wasserstein distance as a 2-Wasserstein distance, by substituting (11) into (12),
| (14) |
Lemma A.1 in Appendix A implies that and are again Gaussian random variables with respective means and covariances
Thus (14) is equal to the 2-Wasserstein distance
| (15) |
At last, apply Lemma 3.2 and the linearity of the trace.
We are ready to derive the -Wasserstein distance between approximate and full Krylov posteriors.
Theorem 3.5.
Proof: We factor the covariances into square factors, to obtain an eigenvalue decomposition for the congruence transformations of the covariances in (3.4).
Expand the column dimension of from to by adding an -orthogonal complement to create an -orthogonal matrix
with . Analogously expand the dimension of the diagonal matrices by padding with trailing zeros,
Factor the covariances in terms of the above square matrices,
Substitute the factorizations into (3.4), and compute the -Wasserstein distance between and as
| (17) |
where the congruence transformations of and are again Hermitian,
Lemma A.3 implies that is an orthogonal matrix, so that the second factorizations of and represent eigenvalue decompositions. Commutativity of the trace implies
Since and have the same eigenvector matrix, they commute, and so do diagonal matrices,
where the last equality follows from the fact that and share the leading diagonal elements. Thus
Substituting the above expressions into (17) gives
Theorem 3.5 implies that the -Wasserstein distance between approximate and full Krylov posteriors is the sum of the CG steps sizes skipped by the approximate posterior, and this, as seen in (9) and (StrakosTichy, Equation (4.4)), is equal to the distance between the error estimate and the true error . As a consequence, the approximation error decreases as the convergence of the posterior mean accelerates, or the rank of the approximation increases.
Remark 3.6.
The distance in Theorem 3.5 is a special case of the 2-Wasserstein distance between two distributions whose covariance matrices commute (KLMU20, Corollary 2.4).
To see this, consider the -Wasserstein distance between and from Theorem 3.5, and the 2-Wasserstein distance between and . Then (15) implies that the -Wasserstein distance is equal to the 2-Wassterstein distance of a congruence transformation,
The covariance matrices and associated with the 2-Wasserstein distance commute because they are both diagonalized by the same orthogonal matrix .
3.2 Probabilistic Interpretation of the Krylov Prior
We interpret the Krylov prior as an ‘empirical Bayesian procedure’ (Theorem 3.7), and elucidate the connection between the random variables and the deterministic solution (Remark 3.8).
An empirical Bayesian procedure estimates the prior from data (Berger1985, Section 4.5). Our ‘data’ are the pairs of normalized search directions and step sizes , , from iterations of CG. In contrast, the usual data for BayesCG are the inner products , . However, if we augment the usual data with the search directions, which is natural due to their dependence on , then is just a function of the data.
From these data we construct a prior in an empirical Bayesian fashion, starting with a random variable
where are independent and identically distributed scalar Gaussian random variables, . Due to the independence of the , the above sum is the matrix vector product
| (18) |
where is a vector-valued Gaussian random variable.
The distribution of is the empirical prior, while the distribution of conditioned on the random variable taking the value is the empirical posterior. We relate these distributions to the Krylov prior.
Theorem 3.7.
Under the assumptions of Theorem 2.7, the random variable in (18) is distributed according to the empirical prior
which is the rank- approximation of the Krylov prior . The variable conditioned on taking the value is distributed according to the empirical posterior
which, in turn, is the rank- approximation of the Krylov posterior.
Proof: As in the proof of Theorem 2.1 in (BCG:Supp, Proof of Proposition 1), we exploit the stability and conjugacy of Gaussian distributions in Lemmas A.1 and A.2 in Appendix A.
Prior.
Posterior.
From (19) follows that and have the joint distribution
| (20) |
and that . This, together with the linearity of the expectation and the -orthonormality of implies
Analogously,
From (Stuart:BayesInverse, Theorem 6.20) follows the expression for the posterior mean,
and for the posterior covariance
where
Substituting this into gives the expression for the posterior covariance
Thus, the posterior mean is equal to the one in Theorem 2.7, and the posterior covariance is equal to the rank- approximate Krylov posterior in Definition 2.8.
Remark 3.8.
The random variable in Theorem 3.7 is a surrogate for the unknown solution . The solution is a deterministic quantity, but prior to solving the linear system (1), we are uncertain of , and the prior models this uncertainty.
During the course of the BayesCG iterations, we acquire information about , and the posterior distributions , incorporate our increasing knowledge and, consequently, our diminishing uncertainty.
4 Calibration of BayesCG Under the Krylov Prior
We review the notion of calibration for probabilistic solvers, and show that this notion does not apply to BayesCG under the Krylov prior (Section 4.1). Then we relax this notion and analyze BayesCG with two test statistics that are necessary but not sufficient for calibration: the -statistic (Section 4.2) and the -statistic (Section 4.3).
4.1 Calibration
We review the definition of calibration for probabilistic linear solvers (Definition 4.1, Lemma 4.2), discuss the difference between certain random variables (Remark 4.3), present two illustrations (Examples 4.4 and 4.5), and explain why this notion of calibration does not apply to BayesCG under the Krylov prior (Remark 4.6).
Informally, a probabilistic numerical solver is calibrated if its posterior distributions accurately model the uncertainty in the solution CGOS21; CIOR20.
Definition 4.1 ((CIOR20, Definition 6)).
Let be a class of linear systems where is symmetric positive definite, and the random right hand sides are defined by random solutions .
Assume that a probabilistic linear solver under the prior and applied to a system computes posteriors , . Let , and let have an orthogonal eigenvector matrix where and satisfy
The probabilistic solver is calibrated if all posterior covariances are independent of and satisfy
| (21) | ||||
Alternatively, one can think of a probabilistic linear solver as calibrated if and only if the solutions are distributed according to the posteriors.
Lemma 4.2.
Under the conditions of Definition 4.1, a probabilistic linear solver is calibrated, if and only if
Proof: Let be an eigendecomposition where the eigenvalue matrix is commensurately partitioned with in Definition 4.1. Multiply the first equation of (21) on the left by ,
combine the result with the second equation in (21),
and multiply by on the left,
At last, substitute and subtract .
Since the covariance matrix is singular, its probability density function is zero on the subspace of where the solver has eliminated the uncertainty about . From (21) follows that in . Hence, this subspace must be , and any remaining uncertainty about lies in .
Remark 4.3.
We discuss the difference between the random variable in Definition 4.1 and the random variable in Theorem 3.7.
In the context of calibration, the random variable represents the set of all possible solutions that are accurately modeled by the prior . If the solver is calibrated, then Lemma 4.2 shows that . Thus, solutions accurately modeled by the prior are also accurately modeled by all posteriors .
By contrast, in the context of a deterministic linear system , the random variable represents a surrogate for the particular solution and can be viewed as an abbreviation for . The prior models the uncertainty in the user’s initial knowledge of , and the posteriors model the uncertainty remaining after iterations of the solver.
The following two examples illustrate Definition 4.1.
Example 4.4.
Suppose there are three people: Alice, Bob, and Carol.
-
1.
Alice samples from the prior and computes the matrix vector product .
-
2.
Bob receives , , and from Alice. He estimates by solving the linear system with a probabilistic solver under the prior , and then samples from a posterior .
-
3.
Carol receives , and , but she is not told which vector is and which is . Carol then attempts to determine which one of or is the sample from . If Carol cannot distinguish between and , then the solver is calibrated.


Example 4.5.
This is the visual equivalent of Example 4.4, where Carol receives the images in Figure 4.1 of three different probabilistic solvers, but without any identification of the solutions and posterior samples.
-
•
Top plot. This solver is calibrated because the solutions look indistinguishable from the samples of the posterior distribution.
-
•
Bottom left plot. This solver is not calibrated because the solutions are unlikely to be samples from the posterior distribution.
The solver is optimistic because the posterior distribution is concentrated in an area of that is too small to cover the solutions. -
•
Bottom right plot. The solver is not calibrated. Although the solutions could plausibly be sampled from the posterior, they are concentrated too close to the center of the distribution.
The solver is pessimistic because the area covered by the posterior distribution is much larger than the area containing the solutions.
Remark 4.6.
The posterior means and covariances from a probabilistic solver can depend on the solution , as is the case for BayesCG. If a solver is applied to a random linear system in Definition 4.1 and if the posterior means and covariances depend on the solution , then the posterior means and covariances are also random variables.
Definition 4.1 prevents the posterior covariances from being random variables by forcing them to be independent of the random right hand side . Although this is a realistic constraint for the stationary iterative solvers in RICO21, it does not apply to BayesCG under the Krylov prior, because Krylov posterior covariances depend non-linearly on the right-hand side. In Sections 4.2 and 4.3, we present a remedy for BayesCG in the form of test statistics that are motivated by Definition 4.1 and Lemma 4.2.
4.2 The -statistic
We assess BayesCG under the Krylov prior with an existing test statistic, the -statistic, which is a necessary condition for calibration and can be viewed as a weaker normwise version of criterion (21). We review the -statistic (Section 4.2.1), and apply it to BayesCG under the Krylov prior (Section 4.2.2).
4.2.1 Review of the -statistic
We review the -statistic (Definition 4.7), and the chi-square distribution (Definition 4.8), which links the -statistic to calibration (Theorem 4.9). Then we discuss how to generate samples of the -statistic (Algorithm 4.1), how to use them for the assessment of calibration (Remark 4.10), and then present the Kolmogorov-Smirnov statistic as a computationally inexpensive estimate for the difference between two general distributions (Definition 4.11).
The -statistic was introduced in (Cockayne:BCG, Section 6.1) as a means to assess the calibration of BayesCG, and has subsequently been applied to other probabilistic linear solvers (Bartels, Section 6.4), (Fanaskov21, Section 9).
Definition 4.7 ((Cockayne:BCG, Section 6.1)).
Let be a class of linear systems where is symmetric positive definite, and . Let , , be the posterior distributions from a probabilistic solver under the prior applied to . The -statistic is
| (22) |
The chi-squared distribution below furnishes the link from -statistic to calibration.
Definition 4.8 ((Ross07, Definition 2.2)).
If are independent
random normal variables, then
is distributed according to the chi-squared distribution with degrees of freedom and mean .
In other words, if , then
and .
We show that the -statistic is a necessary condition for calibration. That is: If a probabilistic solver is calibrated, then the -statistic is distributed according to a chi-squared distribution.
Theorem 4.9 ((BCG:Supp, Proposition 1)).
Let be a class of linear systems where is symmetric positive definite, and . Assume that a probabilistic solver under the prior applied to computes the posteriors with , .
If the solver is calibrated, then
Proof: Write , where . Lemma 4.2 implies that a calibrated solver produces posteriors with
With the eigenvector matrix as in Definition 4.1, Lemma A.1 in Appendix A implies
Since the covariance of is an orthogonal projector, Lemma A.7 implies .
Theorem 4.9 implies that BayesCG is calibrated if the -statistic is distributed according to a chi-squared distribution with degrees of freedom. For the Krylov prior specifically, .
Generating samples from the -statistic and assessing calibration.
For a user-specified probabilistic linear solver and a symmetric positive definite matrix , Algorithm 4.1 samples solutions from the prior distribution , defines the systems , runs iterations of the solver on , and computes in (22).
The application of the Moore-Penrose inverse in Line 6 can be implemented by computing the minimal norm solution of the least squares problem
| (23) |
followed by the inner product .
Remark 4.10.
We assess calibration of the solver by comparing the -statistic samples from Algorithm 4.1 to the chi-squared distribution with degrees of freedom, based on the following criteria from (Cockayne:BCG, Section 6.1).
- Calibrated:
-
If , then and the solutions are distributed according to the posteriors .
- Pessimistic:
-
If the are concentrated around smaller values than , then the solutions occupy a smaller area of than predicted by .
- Optimistic:
-
If the are concentrated around larger values than , then the solutions cover a larger area of than predicted by .
In (Cockayne:BCG, Section 6.1) and (Bartels, Section 6.4), the -statistic samples and the predicted chi-squared distribution are compared visually. In Section 5, we make an additional quantitative comparison with the Kolmogorov-Smirnov test to estimate the difference between two probability distributions.
Definition 4.11 ((Kaltenbach12, Section 3.4.1)).
Given two distributions and on with cumulative distribution functions and , the Kolmogorov-Smirnov statistic is
In contrast to the Wasserstein distance in Definition 3.1, the Kolmogorov-Smirnov statistic can be easier to estimate—especially if the distributions are not Gaussian—but it is not a metric. Consequently, if and do not overlap, then regardless of how far and are apart, while the Wasserstein metric still gives information about the distance between and .
4.2.2 -Statistic for BayesCG under the Krylov prior
We apply the -statistic to BayesCG under the Krylov prior. We start with an expression for the Moore-Penrose inverse of the Krylov posterior covariances (Lemma 4.12). Then we show that the -statistic for the full Krylov posteriors has the same mean as the corresponding chi-squared distribution (Theorem 4.13), but its distribution is different. Therefore the -statistic is inconclusive about the calibration of BayesCG under the Krylov prior (Remark 4.14).
Lemma 4.12.
In Definition 2.8, abbreviate and . The rank- approximate Krylov posterior covariances have the Moore-Penrose inverse
Proof: We exploit the fact that all factors of have full column rank.
The factors and have full column and row rank, respectively, because has -orthonormal columns. Additionally, the diagonal matrix is nonsingular. Then Lemma A.5 in Appendix A implies that the Moore-Penrose inverses can be expressed in terms of the matrices proper,
| (24) |
and
| (25) |
Since also has full row rank, apply Lemma A.5 to ,
We apply the -statistic to the full Krylov posteriors, and show that -statistic samples reproduce the dimension of the unexplored Krylov space.
Theorem 4.13.
Under the assumptions of Theorem 2.7, let BayesCG under the Krylov prior produce full Krylov posteriors . Then the -statistic is equal to
Proof: Express the error in terms of by inserting
| (26) |
from Theorem 2.7 into
This expression is identical to (Liesen, Equation (5.6.5)), which relates the CG error to the search directions and step sizes of the remaining iterations.
With Lemma 4.12, this implies for the -statistic in Theorem 4.9
In other words,
where the last inequality follows from in Definition 2.4.
Remark 4.14.
The -statistic is inconclusive about the calibration of BayesCG under the Krylov prior.
Theorem 4.13 shows that the -statistic is distributed according to a Dirac distribution at . Thus, the -statistic has the same mean as the chi-squared distribution , which suggests that BayesCG under the Krylov prior is neither optimistic or pessimistic. However, although the means are the same, the distributions are not. Hence, Theorem 4.13 does not imply that BayesCG under the Krylov prior is calibrated.
4.3 The -statistic
We introduce a new test statistic for assessing the calibration of probabilistic solvers, the -statistic. After discussing the relation between calibration and error estimation (Section 4.3.1), we define the -statistic (Section 4.3.2), compare the -statistic to the -statistic (Section 4.3.3), and then apply the -statistic to BayesCG under the Krylov prior (Section 4.3.4).
4.3.1 Calibration and Error Estimation
We establish a relation between the error of the posterior means (approximations to the solution) and the trace of posterior covariances (Theorem 4.15).
Theorem 4.15.
Let be a class of linear systems where is symmetric positive definite and . Let , be the posterior distributions from a probabilistic solver under the prior applied to .
If the solver is calibrated, then
| (27) |
Proof: For a calibrated solver Lemma 4.2 implies that . Then apply Lemma A.8 in Appendix A to the error .
For a calibrated solver, Theorem 4.15 implies that the equality holds on average. This means the trace can overestimate the error for some solutions, while for others, it can underestimate the error.
We explain how Theorem 4.15 relates the errors of a calibrated solver to the area in which its posteriors are concentrated.
Remark 4.16.
The trace of a posterior covariance matrix quantifies the spread of its probability distribution—because the trace is the sum of the eigenvalues, which in the case of a covariance are the variances of the principal components (JWHT21, Section 12.2.1).
In analogy to viewing the -norm as the 2-norm weighted by , we can view as the trace of weighted by . Theorem 4.15 shows that the -norm errors of a calibrated solver are equal to the weighted sum of the principal component variances from the posterior. Thus, the posterior means and the areas in which the posteriors are concentrated both converge to the solution at the same speed, provided the solver is calibrated.
4.3.2 Definition of the -statistic
We introduce the -statistic (Definition 4.17), present an algorithm for generating samples from the -statistic (Algorithm 4.2), and discuss their use for assessing calibration of solvers (Remark 4.18).
The -statistic represents a necessary condition for calibration, as established in Theorem 4.15.
Definition 4.17.
Let be a class of linear systems where is symmetric positive definite, and . Let , , be the posterior distributions from a probabilistic solver under the prior applied to . The -statistic is
| (28) |
If the solver is calibrated then Theorem 4.15 implies
| (29) |
Generating samples from the -statistic and assessing calibration.
For a user specified probabilistic linear solver and a symmetric positive definite matrix , Algorithm 4.2 samples solutions from the prior distribution , defines the linear systems , runs iterations of the solver on the system, and computes and from (28).
As with the -statistic, Algorithm 4.2 requires a separate reference when sampling solutions for BayesCG under the Krylov prior.
Remark 4.18.
We assess calibration of the solver by comparing the -statistic samples from Algorithm 4.2 to the traces , . The following criteria are based on Theorem 4.15 and Remark 4.16.
- Calibrated:
-
If the solver is calibrated, the traces should all be equal to the empirical mean of the -statistic samples .
- Pessimistic:
-
If the are concentrated around smaller values than the , then the solutions occupy a smaller area of than predicted by the posteriors .
- Optimistic:
-
If the are concentrated around larger values than the , then the solutions occupy a larger area of than predicted by .
We can also compare the empirical means of the and , because a calibrated solver should produce and with the same mean. Note that a comparison via the Kolmogorov-Smirnov statistic is not appropriate because the empirical distributions of and are generally different.
4.3.3 Comparison of the - and -statistics
Both, - and -statistic represent necessary conditions for calibration ((27) and (29)); and both measure the norm of the error : The -statistic in the -pseudo norm (Definition 4.7), and the -statistic in the -norm (Definition 4.17). Deeper down, though, the -statistic projects errors onto a single dimension (Theorem 4.9), while the -statistic relates errors to the areas in which the posterior distributions are concentrated.
Due to its focus on the area of the posteriors, the -statistic can give a false positive for calibration. This occurs when the solution is not in the area of posterior concentration but the size of the posteriors is consistent with the errors. The -statistic is less likely to encounter this problem, as illustrated in Figure 4.2.
The -statistic is better at assessing calibration, while the statistic produces accurate error estimates, which default to the traditional -norm estimates. The -statistic is also faster to compute because it does not require the solution of a least squares problem.


Top left: Both statistics decide that the solver is not calibrated. Top right: The -statistic decides that the solver is calibrated, while the -statistic does not. Bottom: Both statistics decide that the solver is calibrated.
4.3.4 -statistic for BayesCG under the Krylov prior
We show that BayesCG under the Krylov prior is not calibrated, but that it is has similar performance to a calibrated solver under full posteriors and is optimistic under approximate posteriors.
Calibration of BayesCG under full Krylov posteriors.
Theorem 2.7 implies that the -statistic for any solution is equal to
Thus, the -statistic indicates that the size of Krylov posteriors is consistent with the errors, which is a desirable property of calibrated solvers. However, BayesCG under the Krylov prior is not a calibrated solver because the traces of posterior covariances from calibrated solvers are distributed around the average error instead of always being equal to the error.
Calibration of BayesCG under approximate posteriors.
From (9) follows that is concentrated around smaller values than the -statistic; and the underestimate of the trace is equal to the Wasserstein distance between full and approximate Krylov posteriors in Theorem 3.5. This underestimate points to the optimism of BayesCG under approximate Krylov posteriors. This optimism is expected because approximate posteriors model the uncertainty about in a lower dimensional space than full posteriors.
5 Numerical experiments
We present numerical assessments of BayesCG calibration via the - and -statistics.
After describing the setup of the numerical experiments (Section 5.1), we assess the calibration of three implementations of BayesCG: (i) BayesCG with random search directions (Section 5.2)—a solver known to be calibrated—so as to establish a baseline for comparisons with other versions of BayesCG; (ii) BayesCG under the inverse prior (Section 5.3); and (iii) BayesCG under the Krylov prior (Section 5.4). We choose the inverse prior and the Krylov priors because under each of these priors, the posterior mean from BayesCG coincides with the solution from CG.
Conclusions from all the experiments.
Both, - and statistics indicate that BayesCG with random search directions is indeed a calibrated solver, and that BayesCG under the inverse prior is pessimistic.
The -statistic indicates that BayesCG under full Krylov posteriors mimics a calibrated solver, and that BayesCG under rank-50 approximate posteriors does as well, but not as much since it is slightly optimistic.
However, among all versions, BayesCG under approximate Krylov posteriors is the only one that is computationally practical and that is competitive with CG.
5.1 Experimental Setup
We describe the matrix in the linear system (Section 5.1.1); the setup of the - and -statistic experiments (Section 5.1.2); and the three BayesCG implementations (Section 5.1.3).
5.1.1 The matrix in the linear system (1)
The symmetric positive definite matrix of dimension is a preconditoned version of the matrix BCSSTK14 from the Harwell-Boeing collection in bcsstk14. Specifically,
and is BCSSTK14. Calibration is assessed at iterations .
5.1.2 -statistic and -statistic
The -statistic and -statistic experiments are implemented as described in Algorithms 4.1 and 4.2, respectively. The calibration criteria for the -statistic are given in Remark 4.10, and for the -statistic in Remark 4.18.
We sample from Gaussian distributions by exploiting their stability. According to Lemma A.1 in Appendix A, if , and is a factorization of the covariance, then
Samples are generated with randn() in Matlab, and with numpy.random.randn() in NumPy.
-statistic experiments.
We quantify the distance between the -statistic samples and the chi-squared distribution by applying the Kolmogorov-Smirnov statistic (Definition 4.11) to the empirical cumulative distribution function of the -statistic samples and the analytical cumulative distribution function of the chi-squared distribution.
The degree of freedom in the chi-squared distribution is chosen as the median numerical rank of the posterior covariances. Note that the numerical rank of can differ from
and choosing the median rank gives an integer equal to the rank of at least one posterior covariance.
In compliance with the Matlab function rank and the NumPy function numpy.linalg.rank, we compute the numerical rank of as
| (30) |
5.1.3 Three BayesCG implementations
We use three versions of BayesCG: BayesCG with random search directions, BayesCG under the inverse prior, and BayesCG under the Krylov prior.
BayesCG with random search directions.
The implementation in Algorithm B.2 in Appendix B.2 computes posterior covariances that do not depend on the solution . This, in turn, requires search directions that do not depend on (CIOR20, Section 1.1) which is achieved by starting with a random search direction instead of the initial residual . The prior is .
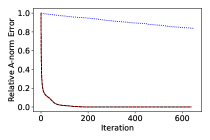
By design, this version of BayesCG is calibrated. However, it is also impractical due to its slow convergence, see Figure 5.1, and an accurate solution is available only after iterations. The random initial search direction leads to uninformative -dimensional subspaces, so that the solver has to explore all of before finding the solution.

BayesCG under the inverse prior .
BayesCG under the Krylov prior.
For full posteriors, the modified Lanczos solver Algorithm B.1 in Appendix B.4 computes the full prior, which is then followed by the direct computation of the posteriors from the prior in Algorithm B.2.
For approximate posteriors, Algorithm B.5 in Appendix B.4 computes rank- covariances at the same computational cost as iterations of CG.
In - and -statistic experiments, solutions are usually sampled from the prior distribution. We cannot sample solutions from the Krylov prior because it differs from solution to solution. Instead we sample solutions from the reference distribution . This is a reasonable choice because the posterior means in BayesCG under the inverse and Krylov priors coincide with the CG iterates (Cockayne:BCG, Section 3).
5.2 BayesCG with random search directions
By design, BayesCG with random search directions is a calibrated solver. The purpose is to establish a baseline for comparisons with BayesCG under the inverse and Krylov priors, and to demonstrate that the - and -statistics perform as expected on a calibrated solver.
Summary of experiments below.
Both, - and -statistics strongly confirm that BayesCG with random search directions is indeed a calibrated solver, thereby corroborating the statements in Theorem 4.9 and Definition 4.17.


| Iteration | -stat mean | mean | K-S statistic |
|---|---|---|---|


| Iteration | -stat mean | Trace mean | Trace standard deviation |
|---|---|---|---|
Figure 5.2 and Table 5.1.
Figure 5.3 and Table 5.2.
The traces in Figure 5.3 are tightly concentrated around the empirical mean of the -statistic samples. Table 5.2 confirms the strong clustering of the trace and -statistic sample means around , together with the very small deviation of the traces. Thus, the area in which the posteriors are concentrated is consistent with the error, confirming again that BayesCG with random search directions is calibrated.
5.3 BayesCG under the inverse prior .
Summary of experiments below.
Both, - and -statics indicate that BayesCG under the inverse prior is pessimistic, and that the pessimism increases with the iteration count. This is consistent with the experiments in (Cockayne:BCG, Section 6.1).


| Iteration | -stat mean | mean | K-S statistic |
|---|---|---|---|


| Iteration | -stat mean | Trace mean | Trace standard deviation |
|---|---|---|---|
Figure 5.4 and Table 5.3.
The -statistic samples in Figure 5.4 are concentrated around smaller values than the predicted chi-squared distribution. The Kol-mogorov-Smirnov statistics in Table 5.3 are all equal to 1, indicating no overlap between -statistic samples and chi-squared distribution. The first two columns of Table 5.3 show that -statistic samples move further away from the chi-squared distribution as the iterations progress. Thus, BayesCG under the inverse prior is pessimistic, and the pessimism increases with the iteration count.
Figure 5.5 and Table 5.4.
The -statistic samples in Figure 5.5 are concentrated around smaller values than the traces. Table 5.4 indicates trace values at , while the -statistic samples move towards zero as the iteration progress. Thus the errors are much smaller than the area in which the posteriors are concentrated, meaning the posteriors overestimate the error. This again confirms the pessimism of BayesCG under the inverse prior.
5.4 BayesCG under the Krylov prior
We consider full posteriors (Section 5.4.1), and then rank-50 approximate posteriors (Section 5.4.2).
5.4.1 Full Krylov posteriors
Summary of experiments below.
The -statistic indicates that BayesCG under full Krylov posteriors is somewhat optimistic, while the -statistic indicates resemblance to a calibrated solver.


| Iteration | -stat mean | mean | K-S statistic |
|---|---|---|---|


| Iteration | -stat mean | Trace mean | Trace standard deviation |
|---|---|---|---|
Figure 5.6 and Table 5.5.
The -statistic samples in Figure 5.6 are concentrated at somewhat larger values than the predicted chi-squared distribution. The Kolmogorov-Smirnov statistics in Table 5.5 are around .8 and .9, thus close to 1, and indicate very little overlap between -statistic samples and chi-squared distribution. Thus, BayesCG under full Krylov posteriors is somewhat optimistic.
These numerical results differ from Theorem 4.13, which predicts -statistic samples equal to . A possible reason might be that the rank of the Krylov prior computed by Algorithm B.1 is smaller than the exact rank. In exact arithmetic, . However, in finite precision, is determined by the convergence tolerance which is set to , resulting in .
Figure 5.7 and Table 5.6.
The -statistic samples in Figure 5.7 match the traces extremely well, with Table 5.6 showing an agreement to 3 figures, as predicted in Section 4.3.4, Thus, the area in which the posteriors are concentrated is consistent with the error, as would be expected from a calibrated solver.
However, BayesCG under the Krylov prior does not behave exactly like a calibrated solver, such as BayesCG with random search directions in Section 5.2, where all traces are concentrated at the empirical mean of the -statistic samples. Thus, BayesCG under the Krylov prior is not calibrated but has a performance similar to that of a calibrated solver.
5.4.2 Rank-50 approximate Krylov posteriors
Summary of the experiments below.
Both, - and -statistic indicate that BayesCG under rank-50 approximate Krylov posteriors is somewhat optimistic, and is not as close to a calibrated solver as BayesCG with full Krylov posteriors. In contrast to the -statistic, the respective -statistic samples and traces for BayesCG under full and rank-50 posteriors are close.


| Iteration | -stat mean | mean | K-S statistic |
|---|---|---|---|


| Iteration | -stat mean | Trace mean | Trace standard deviation |
|---|---|---|---|
Figure 5.8 and Table 5.7.
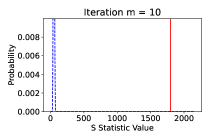
The -statistic samples in Figure 5.8 are concentrated around larger values than the predicted chi-squared distribution, which is steady at 50. All Kolmogorov-Smirnov statistics in Table 5.7 are equal to 1, indicating no overlap between -statistic samples and chi-squared distribution. Thus, BayesCG under approximate Krylov posteriors is more optimistic than BayesCG under full posteriors.
Figure 5.9 and Table 5.8.
The traces in Figure 5.9 are concentrated around slightly smaller values than the -statistic samples, but they all have the same order of magnitude, as shown in Table 5.8. This means, the errors are slightly larger than the area in which the posteriors are concentrated; and the posteriors slightly underestimate the errors.
A comparison of Tables 5.6 and 5.8 shows that the -statistic samples and traces, respectively, for full and rank-50 posteriors are close. From the point of view of the -statistic, BayesCG under approximate Krylov posteriors is somewhat optimistic, and close to being a calibrated solver but not as close as BayesCG under full Krylov posteriors.
Appendix A Auxiliary Results
We present auxiliary results required for proofs in other sections.
The stability of Gaussian distributions implies that a linear transformation of a Gaussian random variable remains Gaussian.
Lemma A.1 (Stability of Gaussian Distributions (Muirhead, Section 1.2)).
Let be a Gaussian random variable with mean and covariance . If and , then
The conjugacy of Gaussian distributions implies that the distribution of a Gaussian random variable conditioned on information that linearly depends on the random variable is a Gaussian distribution.
Lemma A.2 (Conjugacy of Gaussian Distributions (Ouellette, Section 6.1), (Stuart:BayesInverse, Corollary 6.21)).
Let and . The jointly Gaussian random variable has the distribution
where and the conditional distribution of given is
We show how to transform a -orthogonal matrix into an orthogonal matrix.
Lemma A.3.
Let be symmetric positive definite, and let be a -orthogonal matrix with . Then
is an orthogonal matrix with .
Proof: The symmetry of and the -orthogonality of imply
From the orthonormality of the columns of , and the fact that is square follows that is an orthogonal matrix (HornJohnson85, Definition 2.1.3).
Definition A.4.
(HornJohnson85, Section 7.3) The thin singular value decomposition of the rank- matrix is
where and are matrices with orthonormal columns and is a diagonal matrix with positive diagonal elements. The Moore-Penrose inverse of is
If a matrix has full column-rank or full row-rank, then its Moore-Penrose can be expressed in terms of the matrix itself. Furthermore, the Moore-Penrose inverse of a product is equal to the product of the Moore-Penrose inverses, provided the first matrix has full column-rank and the second matrix has full row-rank.
Lemma A.5 ((CM09, Corollary 1.4.2)).
Let and have full column and row rank respectively, so . The Moore-Penrose inverses of and are
respectively, and the Moore-Penrose inverse of the product equals
Below is an explicit expression for the mean of a quadratic form of Gaussians.
Lemma A.6 ((Mathai, Sections 3.2b.1–3.2b.3)).
Let be a Gaussian random variable in , and be symmetric positive definite. The mean of is
We show that the squared Euclidean norm of a Gaussian random variable with an orthogonal projector as its covariance matrix is distributed according to a chi-squared distribution.
Lemma A.7.
Let be a Gaussian random variable in . If the covariance matrix is an orthogonal projector, that is, if and , then
where .
Proof: We express the projector in terms of orthonormal matrices and then use the invariance of the 2-norm under orthogonal matrices and the stability of Gaussians.
Since is an orthogonal projector, there exists such that and . Choose so that is an orthogonal matrix. Thus,
| (31) |
Lemma A.1 implies that is distributed according to a Gaussian distribution with mean and covariance . Similarly, is distributed according to a Gaussian distribution with mean and covariance , thus .
Substituting and into (31) gives . From follows .
Lemma A.8.
If is symmetric positive definite, and and are independent random variables in , then
Proof: The random variable has mean , and covariance
where the covariances because and are independent. Now apply Lemma A.6 to .
Appendix B Algorithms
We present algorithms for the modified Lanczos method (Section B.1), BayesCG with random search directions (Section B.2), BayesCG with covariances in factored form (Section B.3), and BayesCG under the Krylov prior (Section B.4).
B.1 Modified Lanczos method
The Lanczos method (Saad, Algorithm 6.15) produces an orthonormal basis for the Krylov space , while the modified version in Algorithm B.1 produces an -orthonormal basis.
B.2 BayesCG with random search directions
The version of BayesCG in Algorithm B.2 is designed to be calibrated because the search directions do not depend on , hence the posteriors do not depend on either (CIOR20, Section 1.1).
After sampling an initial random search direction , Algorithm B.2 computes an -orthonormal basis for the Krylov space with Algorithm B.1. Then Algorithm B.2 computes the BayesCG posteriors directly with (2) and (3) from Theorem 2.1. The numerical experiments in Section 5 run Algorithm B.2 with the inverse prior .
B.3 BayesCG with covariances in factored form
Algorithm B.3 takes as input a general prior covariance in factored form, and subsequently maintains the posterior covariances in factored form as well. Theorem B.1 presents the correctness proof for Algorithm B.3.
Theorem B.1.
Under the conditions of Theorem 2.1, if for and some , then with
Proof: Fix . Substituting into (3) and factoring out on the left and on the right gives where
Show that is a projector,
Hence .
B.4 BayesCG under the Krylov prior
We present algorithms for BayesCG under full Krylov posteriors (Section B.4.1) and under approximate Krylov posteriors (Section B.4.2).
B.4.1 Full Krylov posteriors
Algorithm B.4 computes the following: a matrix whose columns are an -orthonormal basis for ; the diagonal matrix in (5); and the posterior mean in (26). The output consists of the posterior mean , and the factors and for the posterior covariance.
B.4.2 Approximate Krylov posteriors
Algorithm B.5 computes rank- approximate Krylov posteriors in two main steps: (i) posterior mean and iterates in Lines 5-14; and (ii) factorization of the posterior covariance in Lines 16-26.