Static Code Analysis with CodeChecker
![[Uncaptioned image]](https://cdn.awesomepapers.org/papers/4148a113-d95b-430c-85ac-096e1d01e90b/DragonMedium.png)
1 Introduction
Static analysis is the analysis of a program without executing it that is carried out by an automated tool. It is a widely used approach for several problems. It is used for optimising code, large-scale refactoring, code metrics, code visualisation and several other purposes. Unfortunately, there are some strong theoretical limits on the power of such analysis – for example the halting problem.Notwithstanding the limitations, it proved to be a practical tool and also continues to be an active field of research.
Maintenance costs of a software increase with the size of the codebase. Static analysis has a great impact on reducing maintenance costs of complex software [7]. For example, compilers can detect more and more optimisation possibilities statically and these optimisations make it possible to develop software using high-level language features. Static analysis, however, is also a great approach to find bugs and code smells [1]. The earlier a bug is detected the lower the cost of the fix [2]. This makes static analysis a useful and cheap supplement to testing. Moreover, some properties of the code cannot be tested, such as compliance with coding conventions.
Symbolic execution [5] is a major abstract interpretation technique. During symbolic execution, the program is being interpreted, without any knowledge about the run-time environment. Symbols are used to represent unknown values (the value might be only known at run-time, e.g. user input), and symbolic calculations are carried out on them. The analyser attempts to enumerate all the possible execution paths. Due to the vast number of possible paths, there are certain heuristics regarding where to cut the analysis and how to deal with missing information and approximate certain aspects of the program.
The open source Clang compiler [6] has a component called Static Analyzer (SA). It implements a powerful symbolic execution engine for C, C++, and Objective-C. It also implements a lot of useful checks to detect programming errors.
Clang Tidy is an open source tool to find code smells and refactor code. This tool is used extensively within Google during code reviews. It is using a domain specific pattern matching language on the abstract syntax tree.
CodeChecker is an open source project to integrate different static analysis tools such as the Clang Static Analyzer and Clang Tidy into the build system, CI loop, and the development workflow. It also has a powerful issue management system to make it easier to evaluate the reports of the static analysis tools.
CodeCompass [3] is a tool that also utilises static analysis approaches to aid code comprehension on large-scale projects.
2 Compilers
It is worth to study compilers since they are everywhere. You will find multiple compilers in the browsers, there are also some in the graphics card drivers, your spreadsheet application, your machine learning framework, and so on. Knowing the basics of how compilers work might help you understand the tools that we use on a daily basis.
The most widely used tools that use static analysis are compilers. For this reason, historically lots of the algorithms and data structures that are used in such tools originate from compiler research. This section introduces some of the compiler related concepts that are used throughout this handout.
The compilation process usually starts with lexical analysis (lexing). During lexing the compiler identifies lexical elements in the source text such as operators, identifiers, and literals. The result of the lexing phase is a stream of tokens. Tokens are lexical elements that consist of source locations and a kind.
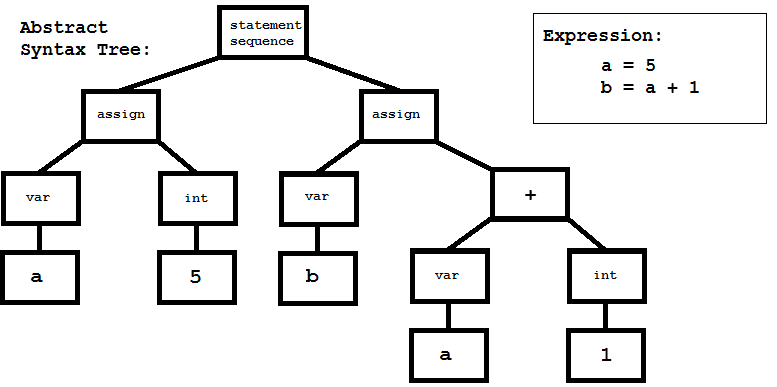
The token stream is parsed. During parsing the compiler builds the abstract syntax tree (AST). This tree data structure represents the relationships between the lexical elements. The syntax tree is called abstract because some of the lexical elements might not appear explicitly (like parentheses) because this information might be available implicitly in the structure of the tree. It may also contain implicit constructs that do not appear in the source text. On the other hand parse trees or concrete syntax trees contain all the information about the source text (including whitespaces and comments), so the original text could be restored from this data structure using pretty-printing. It is common to not build a parse tree at all, only build the abstract syntax tree instead. A parse tree can be useful when precise pretty printing support is required. An example AST can be viewed in Figure 1.
After parsing the source code, sometimes some syntactic constructs are reduced to a simplified form. This method is called desugaring. Basically, the language is reduced to a core language which is much simpler to deal with. This core language has the same expressive power than the original one but it is not as convenient to write.
A process closely related to desugaring is called cannibalisation. In some cases, there are more ways to express the same concept in a language or an intermediate representation. For example, there might be more ways to represent loops. Cannibalisation will try to transform different representations to the same form so later phases dealing with these construct are less complex.
After parsing, the next phase is semantic analysis. This phase consists of type checking and scope checking. The AST is decorated with type information during this step. The resulting data structure contains enough information to generate executable code.
In some languages, in order to resolve ambiguities in the grammar, it is necessary to have some type information available. In this case, parsing and semantic analysis is done in the same phase.
During the compilation, errors might be found in the source text. There are multiple kinds of possible errors depending on which phase is responsible to for finding them. The most common ones are lexical errors, syntax errors, and type errors.
Nowadays compilers provide the user with advanced warning messages, for example, they can detect variables that are uninitialised on an execution path. In order to carry out such analysis, it is often beneficial to build the control flow graph (CFG). The CFG is a graph that has basic blocks as its nodes and the edges are the possible jumps between those blocks. A basic block is a fragment of code that contains only sequentially executed instructions. This means that it contains no jump instructions and every such instruction can only jump to the beginning of a basic block.
Since creating a parser for a language requires heroic effort, it is more common to build static analysis tools on the top of an existing compiler. This way the tool would use the internal representation of the compiler, for example, the AST or the CFG instead of introducing its own parser.
3 LLVM
The LLVM Project is a collection of modular and reusable compiler and toolchain technologies. Despite its name, LLVM has little to do with traditional virtual machines. The name ”LLVM” itself is not an acronym; it is the full name of the project.
The LLVM core libraries provide a modern source and target-independent optimiser and code generators for many popular architectures.
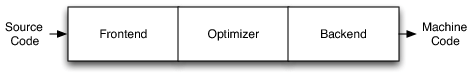
Traditionally compilers have three parts. The front-end is parsing the source code and creates an intermediate representation. The middle end or optimiser does platform independent optimisations. The back-end will generate the executable code. This architecture can be seen in Figure 2.
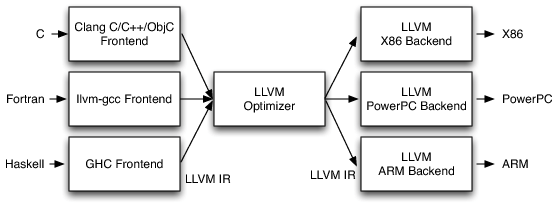
LLVM has its own intermediate representation. There are multiple compilers that can generate LLVM IR. These compilers are utilising the same optimisation and code generation libraries. This approach significantly lowers the barriers writing a new industrial strength optimising compiler and also helps the community to focus on better tools by sharing the work on the middle end and the back-end among the developers of different compilers.
This architecture also improves the interoperability between languages. Combining the LLVM IR from multiple front-ends might enable optimisations that span across calls between different languages. The architecture can be seen on Figure 3.
The Clang compiler is also part of the LLVM Project.
The optimiser is doing fair amount of static analysis on the LLVM IR. Two of the major tasks of optimisations are the following: establishing a cost model and approximate the execution time of a piece of code and proving that a transformation does not change the semantics of the code. If a transformation is safe and it improves the performance of the program according to the cost model the optimiser has, LLVM will apply the transformation.
There are lots of different transformations within LLVM and they are called passes. The order of passes has a significant effect on the end result. It is also not uncommon to run a pass multiple times or have a pass whose sole purpose is to make code more suitable for the subsequent passes.
4 The Challenges of Static Analysis
Due to the limitations of static analysis, in general, it is inevitable to either have false positives (incorrectly reporting an error) or false negatives (missing errors). In software verification and mission critical applications, it is more important to catch all possible errors. For a practical bug finding tool, however, it is more important to have few false alarms, so developers will take the results seriously. Usually, it is possible to reduce the number of false negative results at the cost of increasing the number of false positive ones and vice-versa. The classification of defects found by an analysis tool can be seen in Table 4.
| Bug exists | Correct code | |
|---|---|---|
| Error reported | True Positive | False Positive |
| No error reported | False Negative | True Negative |
The halting problem is the problem of determining, from a description of an arbitrary program and an input, whether the program terminates or runs forever. A general program to solve this problem for all program-input pairs cannot exist. Since it is infeasible to automatically prove the correctness of large-scale programs, analyses make unsound assumptions due to approximations. The implications of these approximations are the false positive and false negative reports. There are several techniques to deal with false positives. It is possible to rank the results and make important violations appear first. Statistical methods and other heuristics are also often used.
Fortunately, the approximations that the analyses are using work well most of the time. Code containing complex data and control dependencies are rare, because they are also difficult for programmers to understand, so they avoid them as bad practice.
Let us investigate why it is impossible to solve the halting problem. To prove this we need to show that there is no total computable function that decides whether an arbitrary program halts on arbitrary input :
Where refers to the th program in an enumeration of all programs. We can show that every total computable function with two arguments differs from .
Given any total computable binary function, is a computable partial function:
Since is computable, there must be a program , that computes . We can show that has a different value than . It follows from the definition of that exactly one of the following two cases must hold:
-
•
so . In this case .
-
•
so is undefined. In this case .
In either case must be different from . Because the choice of was arbitrary, cannot be computable.
Rice’s theorem from 1953 can be informally paraphrased as all interesting questions about program behaviour are undecidable. This can be easily proved for any special case. Assume the existence of an analyser that can check whether a variable has a constant value during the execution of the program. We could use this analyser to decide on the halting problem by using an input program such as Figure 5 where returns if and only if the th program in the enumeration terminates on empty input.
This can be a very discouraging result, but most of the time the real focus of static analysis is not to prove such properties but rather to solve practical problems. This means that such analysis can often produce approximate results.
5 Challenges Implied by Languages
The syntax and the type system of a language can have a significant effect on the compilation time and the complexity of language-related tools. The compilation model has similar impacts. Programs written in dynamically typed languages tend to convey much less information statically about the properties of the program, making the static analysis much more challenging. In order to overcome this obstacle, it is common to augment static analysis with information that was gathered during an execution of the program.
The efficiency of static analysis tools depends on how easy it is to parse a language. The main challenge in parsing is the ambiguities. In order to solve these ambiguities, the parser needs to look ahead and read additional tokens. The minimum number of times a token needs to be inspected in the worst case depends on the grammar of the language. Designing the language grammar with these problems in mind can make the life of compiler and tool authors easier.
The grammar of C and C++ is ambiguous without sufficient type information. There are some examples of ambiguity in Figure 6. If is a type, then the first line is the definition of a variable, otherwise, if is a function, then that expression is a function call. The second line can be interpreted as a definition of a pointer or a multiplication depending on the type context. The third line can be a multiplication or a dereference followed by a C type cast. The last line shows that it is possible to have the same name as both a variable name and a type name in the same scope. To get the type information the headers included in a file need to be parsed before the file can be parsed.
One of the factors that makes static analysis harder is the number of dynamic bindings. In case a virtual method is invoked, the analyser cannot know which method will be executed unless the allocation of the receiver object is known.
The type system also has an important role in the analysis. The purpose of the type system is to prove certain properties of the program. The process of type checking is also static analysis. But in case one develops a separate analysis it is often assumed that the analysed program is correctly typed. This assumption provides the analysis with much useful information. The more expressive the type system is the more information is likely to be available at compile time. Note that, type checking has the same limitations as any other kind of static analysis. There are strongly normalising type systems that guarantee the termination of all well-typed programs. Unfortunately, either the expressivity of those systems is very limited or the type checking of an arbitrary program is undecidable.
6 Dynamic Analysis
In dynamic analysis special code is generated and sometimes a run-time library or virtual execution environment is also used to analyse the run-time behaviour of the program.
Dynamic analysis has a run-time cost but it can also be more precise. During execution much more information is available, it is possible to achieve fewer false positives. On the other hand only executed code can be analysed. In case a bug is not triggered or a piece of code is not covered we will miss the problem. Static analysis has the possibility to discover errors in uncovered code or find unexpected errors that we did not write a test for.
Also, there are some properties of the code that can not be tested or analysed dynamically. These properties include naming conventions, code formatting, misusing some language features, code smells, and portability issues.
LLVM has a number of dynamic analysis tools, the sanitisers. These can find memory addressing issues, memory leaks, race conditions, and other sources of undefined behaviour like division by zero. There are other popular tools outside of the LLVM project such as Valgrind.
We do not cover the details of dynamic analysis in this class but it is a useful tool to have at your disposal. Static and dynamic analysis are two different tools for slightly different purposes. It is better to use both techniques to get the best of both worlds.
7 Methods of Static Analysis
There are several methods to analyse software statically. The easiest way is to transform the code into a canonical form, tokenise it, and then use regular expressions or other pattern matching method on that token stream. This method is efficient and it is used in CppCheck. Unfortunately, it has a lot of weaknesses as well, for example, the type information cannot be utilised easily. It is also hard to match for implicit constructs in the language, for example implicit casts.
A more advanced approach is to use the AST of the source code and match patterns on the tree representation. The tree can be handled more easily than a token stream. In case this AST is typed, type information and implicit constructs are available as well. One of the disadvantages of this approach is that it is hard to do any control flow-dependent matching on the AST. For example, it is hard to reason about the values of the variables in this representation. For some class of analysis this approach is sufficient. Clang Tidy is using this approach.
In a flow-sensitive analysis the analyser builds the CFG. A flow-sensitive analysis is a polynomial analysis that traverses the CFG and analyses each node during the traversal. Each time two branches fold into one, the information gathered on those branches are merged. This analysis is powerful enough to catch issues like non-trivial cases of division by zero.
Unfortunately, flow-sensitive analysis is not precise enough for some purposes. Consider an analysis that checks for division by zero errors. It would track the values of the variables and store which ones are zero. What should such analysis do, when two branches fold together? One option would be to mark the value of a variable zero when it was zero on any of the branches. If you look at Figure 7, there will be a false positive case when is divided by , since this branch is only taken when is not zero. This decision makes this analysis an over-approximation. The other option would be to mark the variable as zero when it is marked as zero on both of the branches. This analysis marks none of the variables as zero in Figure 7. There is a false negative in the last line of the code snippet in this case, this makes the analysis an under-approximation.
Obviously, there is room for improvement which is called path-sensitive analysis. In path-sensitive analysis, each possible execution path of the program is considered. This method this method can achieve a great precision. The analysis can exclude some impossible branches and it can track the possible values of the variables more precisely. There is a cost to this precision in execution time, as this kind of analysis analysis has exponential complexity in the number of branches. Fortunately, the run-time of such analysis turns out to be manageable in practice. There are existing tools that use this method on industrial scale codebase. In case the analyser tracks the possible values of variables as symbols and does symbolic computation with them, we are talking about symbolic execution. To track the possible values of those symbols a constraint manager and a constraint solver are used. One of the main sources of those constraints are conditions on the branches of the CFG.
Symbolic execution is a way of performing abstract interpretation. Abstract interpretation is a way of interpreting programs, but instead of using the concrete semantics (the most precise interpretation) of the program we use an abstract semantics. The reason of defining abstract semantics is to make the problem more tractable.
Software semantics are not always determined by the program code. It can also depend on compilation parameters. For this reason, it is crucial to know those parameters during abstract interpretation. Those parameters can be macro definitions, the language standard choice, platform etc. This makes determining such parameters part of the static analysis in most of the cases. Most of the time in practice this is achieved by the logging of the arguments passed to the compiler during a compilation.
Note that there are several formal methods (a lot of them are based on abstract interpretation) that are used to verify the correctness of software, but they are out of the scope of the class. It focuses on practical tools with large-scale industrial applications.
Once we have flow-sensitive or path-sensitive analysis it is interesting to consider what is the biggest scope that the analyser can reason about using these approaches.
8 Clang Static Analyzer
The Clang SA uses symbolic execution to analyse C, C++, and Objective-C code. During symbolic execution, the source code is interpreted, each unknown value is represented with a symbol, the calculations are carried out symbolically. During interpretation, the SA attempts to enumerate all possible execution paths. We call such analyses path-sensitive. To represent the analysis SA uses a data structure called exploded graph [8]. Each vertex of this graph is a (symbolic state, program point) pair. A symbolic state can correspond to a set of real program states. The program point determines the current location in the program, it is similar to an instruction pointer. The graph edges are transitions between the vertices. Memory is represented using a hierarchy of memory regions [9]. The analyser is building the graph on demand during the analysis using a depth-first method with a path-sensitive walk over the control flow graph. The vertices of the control flow graph are basic blocks which are code segments that are always executed sequentially. The edges are possible jumps between these blocks.
The symbolic state consists of three components:
-
•
Environment – a mapping from source code expressions to symbolic expressions.
-
•
Store – a mapping from memory locations to symbolic expressions.
-
•
Generic Data Map (GDM) – checks can store domain specific information here.
During the execution of a path, the analyser collects constraints on the symbolic expressions. There is a built-in constraint solver that represents these constraints using alternation of ranges. This solver can reason about pointers and integers. It is also possible to use Z3 [4] as an external solver. These constraints are used to skip the analysis of infeasible paths. The constraint solver can also be utilised by the checks to query certain information about the program states. This functionality can be used, for instance, to detect out of bounds errors.
An example analysis can be seen along with its exploded graph in Figure 8. Function g contains two execution paths. Since the values of b and x are initially unknown, these values are represented with the corresponding symbols $b and $x. These symbols can have arbitrary values. As the analysis continues on one of the execution paths the value of b is known to be zero and later on this path we discover that the value of x is the constant 42. The symbol $x is no longer needed on this path. On the second path, the value of b can be anything but zero. On this path, we also discover that the value of x is greater by one than the original value of b. The symbol $x is no longer needed on any of the paths, it can be garbage collected.
If the analyser finds a critical issue such as division by zero it reports the issue to the user and also stops the analysis on that execution path. The reason is that there is no meaningful way to simulate the program execution after a critical error happened. The finding is presented along with the execution path to make it easier to understand how a program execution can lead to the error.
The SA also supports interprocedural analysis in a context-sensitive way. When there is a call to a function with a known body, the analyser can continue the analysis inside the callee preserving all the information known at the call site. This is called inline analysis.
The analyser cannot know where to start the analysis. The main function might not be available or in case of libraries, it might not exist at all. SA usually picks a function and starts to interpret it without calling context. Such function is called a top level function. If a function body is not available it will evaluate it conservatively by losing precision otherwise it will do inline analysis. After the analysis is done, the analyser will pick a new top level function which was not visited (inlined) during the analysis of earlier top level functions.
Let us look at Figure 9. The definition of is in a separate translation unit, the definition of , however, is available. When the analyser evaluates it creates a symbol to represent the unknown value of . It collects the constraints on this symbol as alternation of intervals. It knows that at the point at which is called for the first time the value of is positive due to the constraint in the if statement. The value of after the call to is unknown, because might modify it. Consequently, we have less amount of information about the program state at the second call to . This loss of precision can be quite severe. In case an element of an array or a member of a struct is passed to , the whole array or struct is marked as unknown, because might use pointer arithmetic to modify elements other than the one that was passed to it.
This loss of precision can cause both false positive and false negative results. For example the analyser might not catch a division by zero error, because the information about the variable which has zero value on that path might be erased by a call to an unknown function. False positives are the result of analysing more impossible branches due to a lack of information.
It is intractable to enumerate all the execution paths of non-trivial programs as the number of paths is exponential in the branching factor. Loops make this problem even worse as potentially every iteration might involve multiple branches. To circumvent this problem the analyser employs heuristics to limit the size of the generated exploded graph and keep the run-time of the analysis within reasonable limits. Here are some of the applied approaches:
-
•
After some call depth, functions will not be inlined but evaluated conservatively, even when the body is available. Small enough functions will always be inlined regardless of this limit.
-
•
Functions with too large control flow graphs will be inlined only a limited number of times.
-
•
If a basic block is visited more than some threshold on a path the analysis will terminate on that path. This is particularly useful for loops.
-
•
If the number of generated exploded graph vertices exceeds a threshold the analysis of the top level function will be terminated.
We call the set of thresholds together analysis budget. The heuristics above were designed to cover a reasonable amount of execution paths in a reasonable time while maintaining a good coverage of the code. If we want to extend the scope of the analysis, it is important to ensure that we do not suffer significant coverage loss due to running out of analysis budget before finding the interesting issues.
9 CodeChecker
CodeChecker is a static analysis infrastructure built on the LLVM/Clang Static Analyzer tool-chain, replacing scan-build in a Linux or macOS (OS X) development environment. Its main features include:
-
•
Support for multiple analysers, currently Clang Static Analyzer and Clang-Tidy
-
•
Store results of multiple large-scale analysis runs efficiently, either in a PostgreSQL or SQLite database
-
•
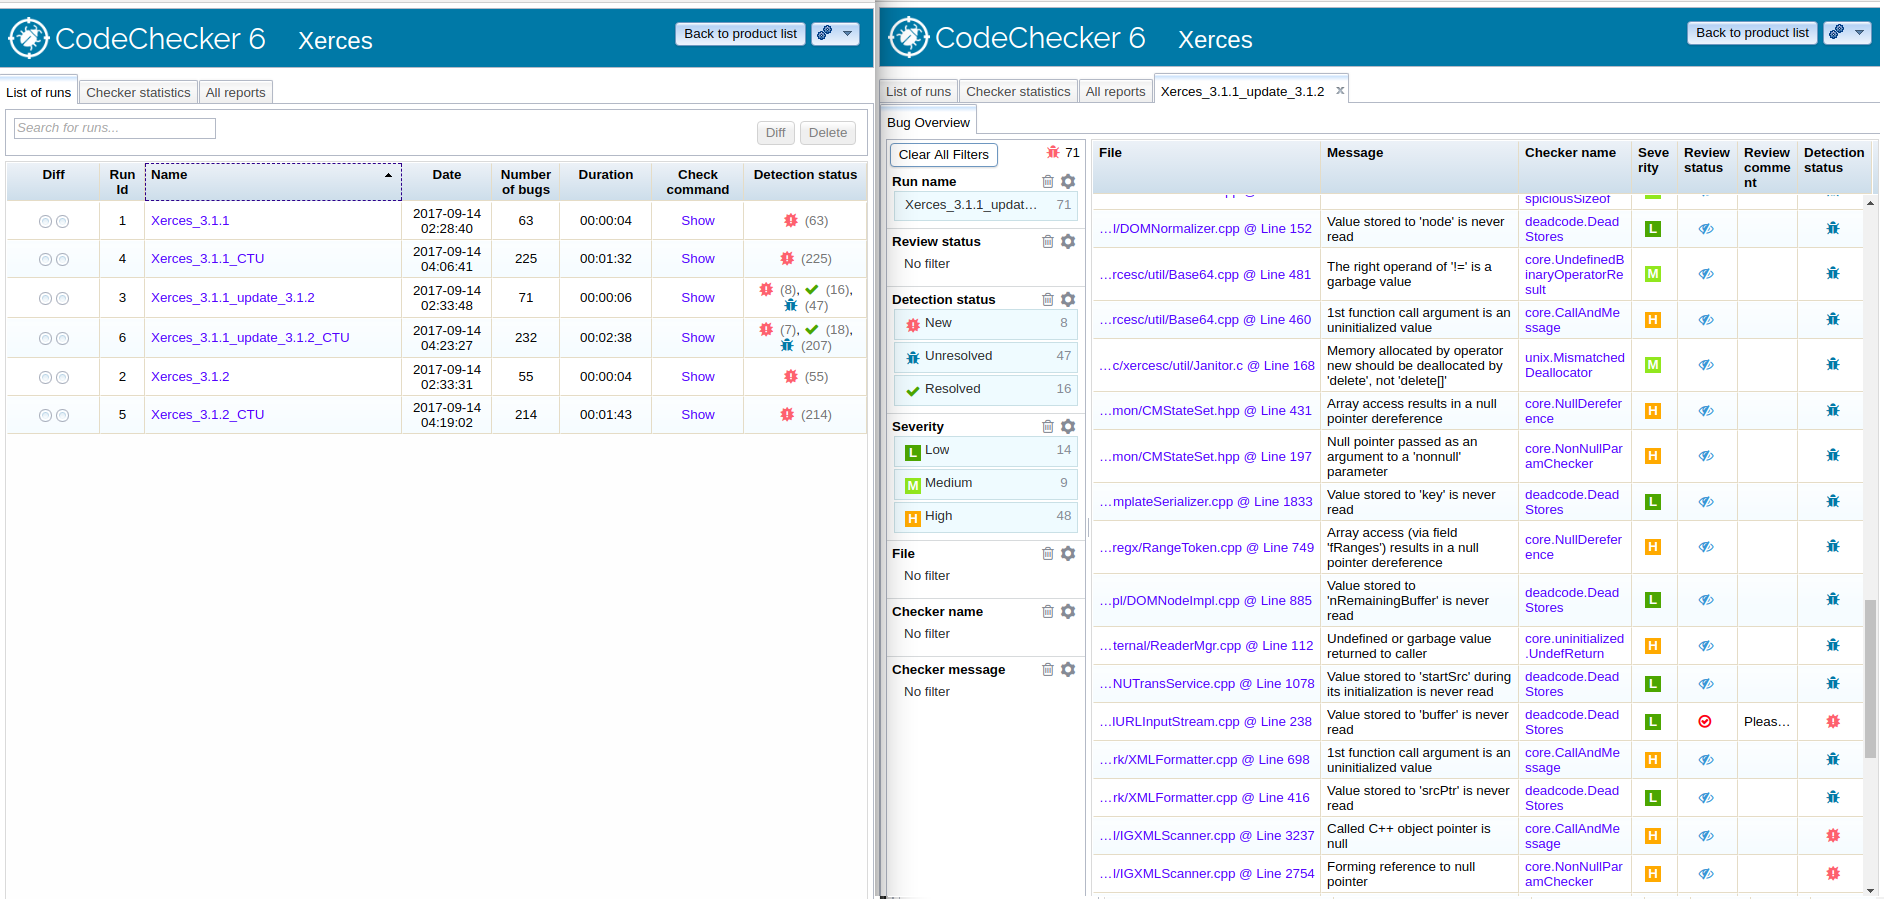
Web application for viewing discovered code defects with a streamlined, easy experience
-
•
Filterable (defect checker name, severity, source paths, …) and comparable (calculates difference between two analyses of the project, showing which bugs have been fixed and which are newly introduced) result viewing
-
•
Subsequent analysis runs only check and update results for modified files without analysing the entire project (depends on build tool-chain support!)
-
•
See the list of bugs that have been introduced since your last analyser execution
-
•
Suppression of known false positive results, either using a configuration file or via annotation in source code, along with the exclusion of entire source paths from analysis
-
•
Results can be shared with fellow developers, the comments and review system aids the communication of code defects
-
•
Can show analysis results on standard output
-
•
Easily implementable Thrift-based server-client communication used for the storage and query of discovered defects
-
•
Support for multiple bug visualisation front-ends, such as the a application, a command-line tool, and an Eclipse plugin
9.1 Quick Tutorial
First add CodeChecker to your PATH and activate the python environment.
Analyse your project with the check command:
check will print an overview of the issues found in your project by the analysers.
Start a CodeChecker web and storage server in another terminal or as a background process. By default it will listen on localhost:8001.
The SQLite database containing the reports will be placed in your workspace directory ( /.codechecker by default), which can be provided via the -w flag.
Store your analysis reports onto the server to be able to use the Web Viewer.
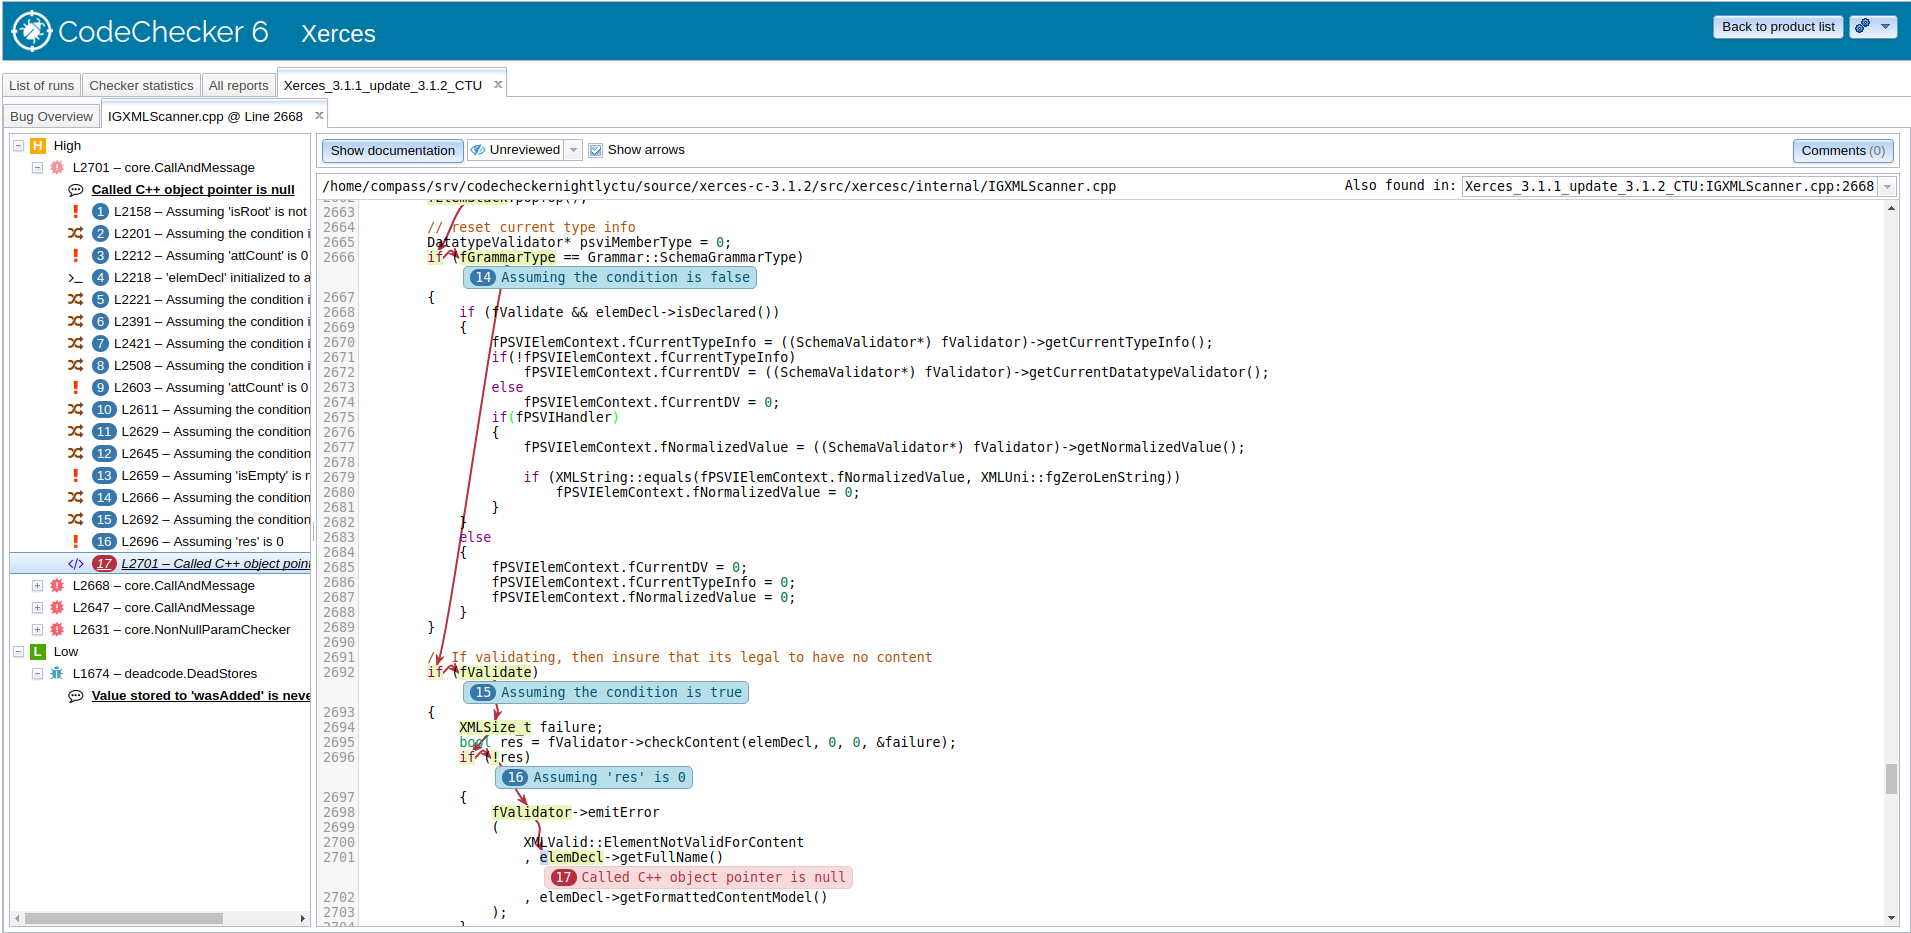
Open the CodeChecker Web Viewer in your browser, and you should be greeted with a web application showing you the analysis results.
For more information see the GitHub page.
References
- [1] Al Bessey, Ken Block, Ben Chelf, Andy Chou, Bryan Fulton, Seth Hallem, Charles Henri-Gros, Asya Kamsky, Scott McPeak, and Dawson Engler. A few billion lines of code later: Using static analysis to find bugs in the real world. Commun. ACM, 53(2):66–75, February 2010. URL: http://doi.acm.org/10.1145/1646353.1646374, doi:10.1145/1646353.1646374.
- [2] Barry Boehm and Victor R. Basili. Software defect reduction top 10 list. Computer, 34(1):135–137, January 2001. URL: http://dx.doi.org/10.1109/2.962984, doi:10.1109/2.962984.
- [3] CodeCompass. Codecompass: a code comprehension tool, January 2018. URL: https://github.com/Ericsson/CodeCompass.
- [4] Leonardo de Moura and Nikolaj Bjørner. Z3: An Efficient SMT Solver, volume 4963, pages 337–340. Springer Berlin Heidelberg, Berlin, Heidelberg, 2008. doi:10.1007/978-3-540-78800-3_24.
- [5] Hari Hampapuram, Yue Yang, and Manuvir Das. Symbolic path simulation in path-sensitive dataflow analysis. SIGSOFT Softw. Eng. Notes, 31(1):52–58, September 2005. URL: http://doi.acm.org/10.1145/1108768.1108808, doi:10.1145/1108768.1108808.
- [6] Chris Lattner. Llvm and clang: Next generation compiler technology. Lecture at BSD Conference 2008, 2008.
- [7] Zhivich Michael and K. Cunningham Robert. The real cost of software errors. IEEE Security & Privacy, 7(2):87–90, 2009. URL: http://dx.doi.org/10.1109/MSP.2009.56, doi:10.1109/MSP.2009.56.
- [8] Thomas Reps, Susan Horwitz, and Mooly Sagiv. Precise interprocedural dataflow analysis via graph reachability. In Proceedings of the 22Nd ACM SIGPLAN-SIGACT Symposium on Principles of Programming Languages, POPL ’95, pages 49–61, New York, NY, USA, 1995. ACM. URL: http://doi.acm.org/10.1145/199448.199462, doi:10.1145/199448.199462.
- [9] Zhongxing Xu, Ted Kremenek, and Jian Zhang. A memory model for static analysis of C programs. In Proceedings of the 4th International Conference on Leveraging Applications of Formal Methods, Verification, and Validation - Volume Part I, ISoLA’10, pages 535–548, Berlin, Heidelberg, 2010. Springer-Verlag. URL: http://dl.acm.org/citation.cfm?id=1939281.1939332.