Spreading and Suppression of Infection Clusters
on the Ginibre Continuum Percolation Clusters
Abstract
Off-lattice SIR models are constructed on continuum percolation clusters defined on the Ginibre point process (GPP) and on the Poisson point process (PPP). The static percolation transitions in the continuum percolation models as well as the infection-spreading transitions in the SIR models, which are regarded as the dynamic percolation transitions, are enhanced in the GPP-based model compared with the PPP-based model. This enhancement is caused by hyperuniformity of the GPP. On the other hand, in the extinction phase of infection on the phase diagram, a wide parameter region is determined in which formation of infection clusters is suppressed in the GPP-based model compared with the PPP-based model. We think that the PPP approximates a disordered configuration of individuals and the GPP does a configuration of citizens adopting a strategy to keep social distancing in a city in order to avoid contagion. The suppression of infection clusters observed in the GPP-based model implies that such a strategy is effective when the infectivity is relatively small.
I Introduction
In the previous paper [1], we introduced a new type of stochastic epidemic models defined on two-dimensional continuum percolation clusters. For the continuum percolation model known as the standard Gilbert disk model [2, 3, 4], we prepare a random configuration of points on and put a set of disks with the same radius centered at the points. When the distances of points are less than , the disks centered at these points overlap and form clumps of disks called percolation clusters. A statistical ensemble of random point configurations specified by a probability law is generally called a point process [5]. Here we assume that the point process has translational symmetry with a constant finite density . The product of and the area of a disk ,
| (1) |
is called the filling factor. A unique critical value is defined such that if any percolation cluster includes only finite number of disks with probability one, while if we have a positive probability to observe a percolation cluster involving an infinite number of disks an (infinite percolation cluster). We interpret each sample of point process as a realization of spatial configuration of individuals, and if and only if two disks overlap, then the individuals living at the centers of these disks are regarded as neighbors of each other. Infection can occur only between neighboring individuals, and hence our model is for a contagious disease. We introduce a parameter indicating infectivity so that each susceptible (S) individual will be infected with the rate multiplied by the total number of neighboring infected (I) individuals. And each I-individual becomes recovered (R) with a constant rate which is normalized to be unity. That is, we consider a SIR model with parameter on percolation clusters specified by a given point process with filling factor . When , we can find an infinite percolation cluster with probability as mentioned above, and hence if we consider the SIR model on an infinite percolation cluster, we will see a phase transition at a critical infectivity between an extinction phase ) and an infection-spreading phase ). In the former phase any infection process ceases with a finite duration of time with probability one, while in the latter phase processes can continue forever on an infinite percolation cluster with a positive probability . We notice that such dynamical phase transitions have been extensively studied for lattice SIR models [6, 7, 8, 9, 10, 11] (or the lattice SIS models called the contact processes [12, 13, 14, 15]). The phase transitions in the lattice SIR models belong to the dynamic percolation universality class [6, 7, 16, 17]. The present epidemic models are off-lattice generalizations of the lattice SIR models.
For an underlying point process of our epidemic model, we have chosen the Ginibre point process (GPP) [18, 19, 20] which has been extensively studied in random matrix theory [21, 22, 23]. We compared infection processes on the GPP-based SIR model with those on the SIR model defined on the Poisson point process (PPP) [5]. While there is no correlation among points in the PPP, a repulsive interaction acts between any pair of points in the GPP and the system becomes hyperuniform [24, 25]. The hyperuniformity implies rigidity of the GPP in the sense that occasional appearance of clumping of points and vacant spaces are suppressed compared with the PPP [26]. As a result, a static percolation transition is enhanced in the GPP-based continuum percolation model than in the PPP-based model and hence we have an in equality
| (2) |
Moreover, with a fixed which was chosen to be greater than , we observed , which means an enhancement of the dynamic percolation transition to the infection-spreading phase in the GPP-based SIR model compared with the PPP-based model [1].
At the same time, we studied infection processes with relatively small values of infectivity and found a parameter regime in which formation of infection clusters are suppressed in the GPP-based SIR model compared with the PPP-based model. We think that the PPP approximates a disordered configuration of individuals and the GPP does a configuration of citizens adopting a strategy to keep social distancing in a city in order to avoid contagion. The above results seem to prove effectiveness of such a strategy at least in the time periods between epidemic waves of a contagious disease [1].
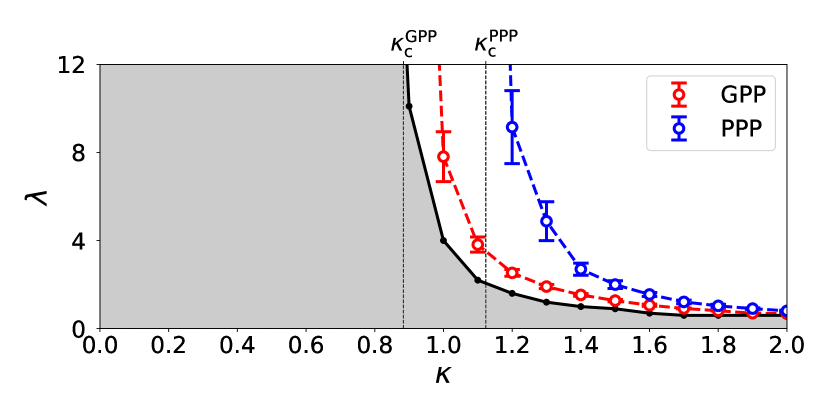
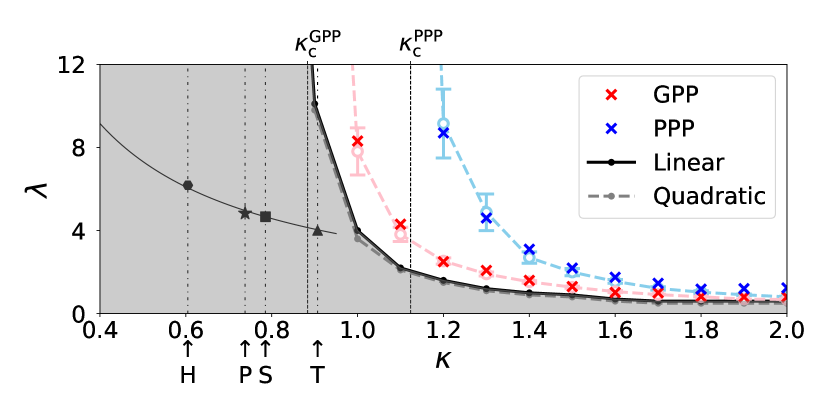
We have developed our numerical study on these new types of epidemic models and evaluated the critical values and by systematically changing the filling factor . In Fig. 1, the estimated phase boundaries between the extinction phases and the infection-spreading phases, and , are plotted. Both of and are decreasing in so that for GPP and PPP, as is approaching from the above, as , and the following inequality holds,
| (3) |
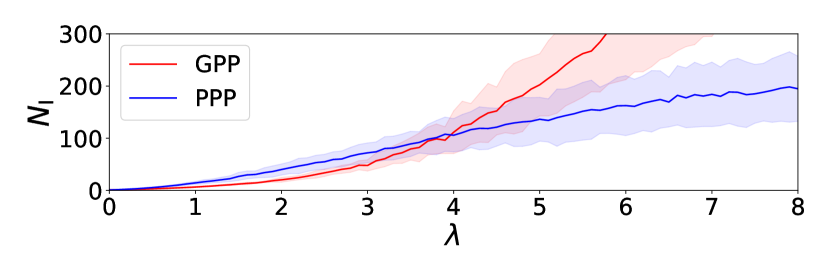
In the extinction phase of infection, we have focused on the largest, but finite percolation cluster realized in our simulation and observed infection processes on it, each of which starts from a single infected individual. We define the mass of infection cluster as the total number of R-individuals in the final configuration of each process. Since this is equal to the cumulative number of I-individuals during a process, we write it as . We numerically obtained statistical average , which is a function of and . Figure 2 shows the dependence of and on when . We find an intersection of the two curves at and it implies that, if , formation of infection clusters is suppressed in the GPP-based SIR model compared with the PPP-based model. The parameter regime in which infection clusters are suppressed in the GPP-based SIR model is shown by the shaded region in Fig. 1.
II The Ginibre and the Poisson Continuum Percolation Models
Let . We prepared random matrices such that the real and the imaginary parts of each entry are independently and identically distributed real standard Gaussian random variables. Then we calculated complex eigenvalues and plot them on the complex plane which is identified with the two-dimensional plane . We have confirmed that almost all eigenvalues are uniformly distributed in a disk around the origin with radius ; that is, they follows the circle law [21, 22]. We have used only the point distribution in the central square and performed a scale change by factor to obtain a point process on the unit square . The obtained point process has density , which well approximates the GPP and is denoted by . The PPP is a uniform point process without any correlation and hence it is easy to generate samples of the PPP with points in . The obtained point process is denoted by which has density . For each sample of point process on , we imposed the periodic boundary condition.
Consider a point process extended over whole , which is a set of an infinite number of points with a finite constant density . Then we introduce a real number . We place disks of radius centered at each point; , . Two points and are neighbors, if and only if . If there is a finite sequence of points such that and is a neighbor of , , then the two points and are connected. The maximal connected components are called percolation clusters whose sizes are given by the numbers of points of included in the clusters. The above defines the standard Gilbert disk model with radius , which is one of the Boolean percolation models, on the point process [2, 3, 4, 27, 28, 29]. It is said that the system percolates if there is at least one infinite cluster, whose size is infinity [30, 31]. It is proved that an infinite cluster exists uniquely with probability one for the Boolean percolation models on the PPP and the GPP [3, 4, 29]. The probability that the system percolates is called the percolation probability. In the present Boolean percolation model on , it is a function of the filling factor defined by (1) [32]. We write the percolation probability as . There is a unique critical value of filling factor such that if , and if .
In the standard Gilbert disk model defined on a finite point process in , is approximated by the ratio of the number of points included in the largest cluster to the total number of points [30]. We have generated 10 samples of finite approximations and for seven different , . In [1], we performed extrapolation of the numerical results to and obtained the following evaluations,
| (4) |
The above estimation of is consistent with the value reported in [32] evaluated using efficient algorithms [33, 34, 35, 36], .
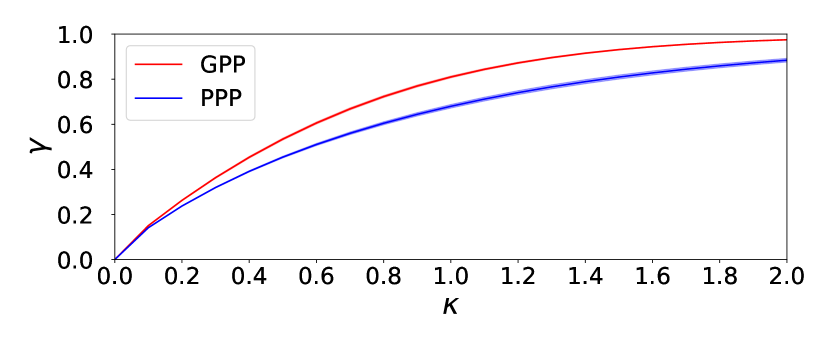
By the definition (1), denotes the total area of disks with radius which are penetrable to each other. One of the origin of the difference of and shown above is the difference of frequencies of overlapping of disks under the same values of and in these two distinct point processes. Since the GPP is hyperuniform [24, 25], while the PPP is not, the overlapping of disks occurs less frequently in the GPP than in the PPP and hence the net area of disks will be larger in the GPP than in the PPP under the same value of . Therefore, the percolation transition occurs on the GPP clusters at which is smaller than . Here we use the 10 samples with 1000 points on for and , in which . For each sample of random points on , we impose the periodic boundary condition and increase the radius of disks centered at the points. At each value of , we measured the area of the subdomain in which is not covered by any disk at all. We define the variable , which indicates the net area of disks in the unit square, that is, . Figure 3 shows the occupation ratios of disks for GPP and PPP. As expected for all . By Fig. 3, the critical values of filling factor (4) are mapped to the following,
| (5) |
If we interpret the site percolation model on the square lattice as the Bernoulli distribution of unit disks on sites with probability , the percolation threshold [30] will give the critical occupation ratio . The critical values (5) for the random point processes are greater than , which is due to the off-lattice effect. We see that the relative difference of ’s, is reduced to for ’s. It should be noticed that is larger than . It suggests that even at the percolation threshold, overlapping of disks occurs less frequently in the GPP-based SIR model than in the PPP-based model. If we interpret centers of disks as locations of individuals, the above implies that the area per one individual in the GPP-based SIR model is larger than that in the PPP-based model. Hence if the infectivity is small enough, infection could be more suppressed in the GPP-based SIR model compared with in the PPP-based model.
III Spreading of Infection on Continuum Percolation Clusters
For each finite approximation of point process on with the periodic boundary condition, we have defined the continuum percolation model with the filling factor as explained above. Here we consider the supercritical case . We pick up the largest percolation cluster and write it as . The size of is defined as the total number of disks included in it and denoted by . We use as an underlying graph of our contagious epidemic model of the SIR type as follows.
At each point , we put a random variable . We consider a continuous-time Markov process, , where . Let denote the probability in this Markov process starting from the configuration . The transition mechanism is given by
| (6) |
where is a positive parameter called the infectivity and is a positive function depending on a point and a configuration . That is, if an individual at point is in the susceptible (S) state, it is infected (I) at rate , while if it is infected (I), it becomes recovered (R) at rate 1. Once , the state at does not change forever. We require that only one-variable-change happens in each transition; that is, as for each with given a configuration on [12, 13]. Here we set the function as
| (7) |
where is the indicator function of an event ; if is satisfied and otherwise. In other words, the infection rate is given by the total number of infected neighbors multiplied by the infectivity . In the previous paper [1], we called the SIR model with (7) the linear model. We have simulated this continuum Markov process on by the Gillespie algorithm [37, 38, 39]. This method is also called the n-fold way algorithm for spin systems [40].
If we consider the above SIR model on an infinite percolation cluster which is found in the supercritical phase formed on an infinite point process, we can discuss the percolation problem for an infection cluster consisting of -individuals and -individuals [6, 7, 8, 9, 10, 11, 12, 13, 14, 15, 16, 17]. The percolation probability of infection cluster denoted by is increasing in for each and a unique critical value , , is defined so that
In the present numerical simulation, we consider the off-lattice SIR model on a finite percolation cluster with . Therefore, any infection process on ceases sooner or later and in a final configuration we have a percolation cluster consisting of -individuals embedded in a field of -individuals. For each , we simulated the SIR model from a single infected individual 100 times and evaluated the mean ratio of total number of -individuals to in a final configuration. We regard this as an approximation of infection probability with size [6, 16, 8, 9]. Increasing the size of point process systematically, we prepare a series of approximations with , and 7000.
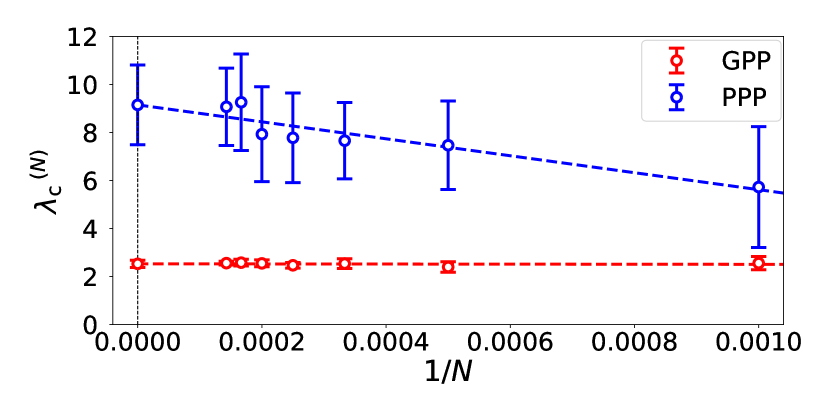
We have evaluated for by the following procedure. Fix . For each , we numerically generated 10 samples of and then , and have drawn curves versus . For each curve an approximate value of critical infectivity denoted by is defined by the value of at which the numerical value of attains a maximum. We plot and versus . Figure 4 shows the plots for , where the error bars are estimated by the 10 samples for each . The linear extrapolation with respect to gives , and . By this procedure the phase boundaries between the extinction phases and the infection-spreading phases of infection, , , and , , are plotted in Fig. 1.
IV Suppression of Infection Clusters in the GPP-based Epidemic Model
With we have prepared 10 samples of and then generate 10 finite percolation clusters with a filling factor . Here we consider the extinction phase of infection, . On each , we simulated the present off-lattice SIR model starting from a single infected individual 100 times. For each process of the SIR model with parameter , we counted the total number of R-individuals in the final configuration, which is equal to the cumulative number of I-individuals during the process and represents the mass of infection cluster. Then is defined as its mean value over the 100 runs of simulations. Moreover, we have averaged over 10 samples of to obtain . Comparison of and was already demonstrated by Fig. 2 for .
When , we have found an intersection of the two curves and at . The value of is decreasing in and behaves as as approaches from the above, and as . When , for any and there is no intersecting point. As shown by the shaded region in the - phase diagram of the epidemic models (Fig. 1), formation of infection clusters is suppressed in the GPP-based SIR model compared with the PPP-based model in the parameter regions (i) and (ii) , .
V Concluding Remarks
We put three remarks on the present study.
(a) In the previous paper [1], we studied variations of the present off-lattice SIR model by modifying the function specifying the infection transition (6). In particular, we reported that the suppression of infection clusters in the GPP-based SIR model is enhanced in the quadratic mode, in which is given by
| (8) |
instead of (7). As reported in [1], the suppression of mass of infection clusters in the GPP-based SIR model is indeed enhanced in the quadratic model, but the value of , does not change so much from . See Fig. 5.
(b) For each , we have a critical infectivity for the present off-lattice SIR model. In the infection-spreading phase , is positive and regarded as the order parameter of dynamic percolation transition. In the vicinity of the phase boundary, it is expected that behaves as
| (9) |
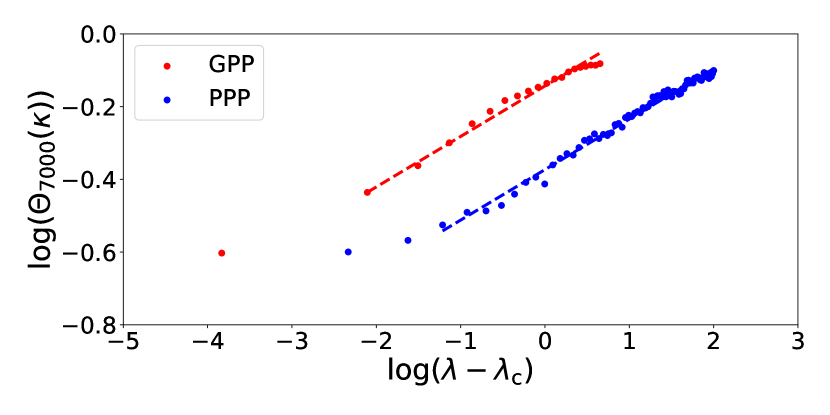
with a critical exponent . Such a power law indicates one of the critical phenomena. The present off-lattice SIR model will belong to the same universality class with the lattice SIR models, which is called the dynamic percolation universality class, and [6, 16, 7, 8]. Using the simulation results on the largest systems with , we applied the least-square linear regression to log-log plots of the data versus for , where is regarded as a fitting parameter, while the slope of fitting line is fixed to be . Figure 6 shows the best fitting result when , which gives and . In Fig. 5 we plotted the values of , GPP and PPP by this method. The results are consistent with those obtained by the linear extrapolation method in the -plots explained in Section III. It means the validity of the assumption (9) with .
(c) While the original SIR model was given by a system of deterministic differential equations [41], the lattice SIR models include randomness and are described by stochastic processes [6, 7, 8, 9, 10, 11]. In the present off-lattice versions, we have introduced another randomness to generate spatial configurations of individuals. It is an interesting problem to compare the lattice SIR models and the present off-lattice SIR models based on random point processes. As mentioned in the item (b), the additional randomness of underlying graphs seems to be irrelevant for the critical phenomena associated with the infection transitions at . The values of critical infectivity are, however, sensitive to the point configurations of individuals. For the triangular (T), the square (S), and the honeycomb (H) lattices in two dimensions, the filling factors (1) are calculated as , , and , respectively. The critical infectivities were reported as [42], [9], and [42], respectively. Recently Santos et al. [11] simulated the SIR model on the Penrose tiling and evaluated as . We have the value [43]. As shown by Fig. 5, we see the tendency such that decreases as increases for H, P, S, T, which is in common with the critical lines , for = GPP and PPP. Moreover, we notice an approximate reciprocal law , H, P, S, T. The spatial configurations of individuals are deterministic in the lattice SIR models, random but having hyperuniformity in the GPP [24, 25], and uniformly random-distributed in PPP, respectively. Hence we say that, for each infectivity , the spread of infection can be observed only in higher values of filling factor of individuals, as the randomness of spatial configuration of individuals is increased. Further systematic studies of the dependence of of the SIR models on the underlying graphs are required, in which deterministic but heterogeneous lattices [11], random point processes [1], as well as a variety of randomly perturbed lattices [44] shall be considered.
Acknowledgements
The present authors would like to thank Robert M. Ziff for allowing them to use the results reported in their preprint. They also thank Tomonari Dotera for useful discussion on quasicrystal lattices. Machiko K. thanks to T.J.Kobayashi for encouraging the present work. Makoto K. expresses his gratitude to John W. Essam for a stimulating communication which motivated this study. Machiko K. was supported by the ANRI Fellowship and International Graduate Program of Innovation for Intelligent World (IIW) of The University of Tokyo. Makoto K. was supported by the Grant-in-Aid for Scientific Research (C) (No.19K03674), (B) (No.18H01124), (S) (No.16H06338), and (A) (No.21H04432) of Japan Society for the Promotion of Science.
Machiko K. and Makoto K. designed and performed the research and the paper was written cooperatively. Machiko K. performed computer simulations and data analysis.
References
- Machiko Katori and Makoto Katori [2021] Machiko Katori and Makoto Katori, Phys. A Stat. Mech. its Appl. , 126191 (2021), arXiv:2103.08461 .
- Gilbert [1961] E. N. Gilbert, J. Soc. Ind. Appl. Math. 9, 533 (1961).
- Meester and Roy [1996] R. Meester and R. Roy, Continuum Percolation, Cambridge Tracts in Mathematics (Cambridge University Press, Cambridge, 1996).
- Bollobas and Riordan [2006] B. Bollobas and O. Riordan, Percolation (Cambridge University Press, Cambridge, 2006).
- Daley and Vere-Jones [2003] D. J. Daley and D. Vere-Jones, An Introduction to the Theory of Point Processes, 2nd ed., Probability and its Applications (Springer-Verlag, New York, 2003).
- Grassberger [1983] P. Grassberger, Math. Biosci. 63, 157 (1983).
- Muñoz et al. [1999] M. A. Muñoz, R. Dickman, A. Vespignani, and S. Zapperi, Phys. Rev. E 59, 6175 (1999).
- de Souza and Tomé [2010] D. R. de Souza and T. Tomé, Phys. A Stat. Mech. its Appl. 389, 1142 (2010).
- Tomé and Ziff [2010] T. Tomé and R. M. Ziff, Phys. Rev. E 82, 051921 (2010).
- Saha et al. [2020] S. Saha, A. Mishra, S. K. Dana, C. Hens, and N. Bairagi, Phys. Rev. E 102, 052307 (2020).
- Santos et al. [2020] G. Santos, T. Alves, G. Alves, A. Macedo-Filho, and R. Ferreira, Phys. Lett. A 384, 126063 (2020).
- Liggett [1985] T. M. Liggett, Interacting Particle Systems, Classics in Mathematics (Springer, Berlin, Heidelberg, 1985).
- Liggett [1999] T. M. Liggett, Stochastic Interacting Systems: Contact, Voter and Exclusion Processes, Grundlehren der mathematischen Wissenschaften, Vol. 324 (Springer, Berlin, Heidelberg, 1999).
- Marro and Dickman [1999] J. Marro and R. Dickman, Nonequilibrium Phase Transitions in Lattice Models, Collection Alea-Saclay: Monographs and Texts in Statistical Physics (Cambridge University Press, 1999).
- Hinrichsen [2000] H. Hinrichsen, Adv. Phys. 49, 815 (2000).
- Cardy and Grassberger [1985] J. L. Cardy and P. Grassberger, J. Phys. A. Math. Gen. 18, L267 (1985).
- Ziff [2021] R. M. Ziff, Phys. A Stat. Mech. its Appl. 568, 125723 (2021).
- Ginibre [1965] J. Ginibre, J. Math. Phys. 6, 440 (1965).
- Shirai [2006] T. Shirai, J. Stat. Phys. 123, 615 (2006).
- Hough et al. [2009] J. Hough, M. Krishnapur, Y. Peres, and B. Virág, Zeros of Gaussian Analytic Functions and Determinantal Point Processes, University Lecture Series, Vol. 51 (American Mathematical Society, Providence, Rhode Island, 2009).
- Mehta [2004] M. L. Mehta, Random Matrices, 3rd ed. (Elsevier, Amsterdam, 2004).
- Forrester [2010] P. J. Forrester, Log-Gases and Random Matrices (LMS-34) (Princeton University Press, Princeton, 2010).
- Katori [2016] M. Katori, Bessel Processes, Schramm–Loewner Evolution, and the Dyson Model, SpringerBriefs in Mathematical Physics, Vol. 11 (Springer, Singapore, 2016).
- Torquato [2018] S. Torquato, Phys. Rep. 745, 1 (2018).
- Matsui et al. [2021] T. Matsui, M. Katori, and T. Shirai, J. Phys. A Math. Theor. 54, 165201 (2021).
- Ghosh and Lebowitz [2017] S. Ghosh and J. L. Lebowitz, Indian J. Pure Appl. Math. 48, 609 (2017).
- Błaszczyszyn and Yogeshwaran [2013] B. Błaszczyszyn and D. Yogeshwaran, Electron. J. Probab. 18, 1 (2013), arXiv:1112.2227 .
- Błaszczyszyn and Yogeshwaran [2014] B. Błaszczyszyn and D. Yogeshwaran, Adv. Appl. Probab. 46, 1 (2014), arXiv:1111.6017 .
- Ghosh et al. [2016] S. Ghosh, M. Krishnapur, and Y. Peres, Ann. Probab. 44, 3357 (2016).
- Stauffer and Aharony [1992] D. Stauffer and A. Aharony, Introduction To Percolation Theory (Taylor & Francis, London, 1992).
- Essam [1971] J. W. Essam, Discrete Math. 1, 83 (1971).
- Mertens and Moore [2012] S. Mertens and C. Moore, Phys. Rev. E 86, 061109 (2012), arXiv:1209.4936 .
- Quintanilla and Torquato [1999] J. Quintanilla and S. Torquato, J. Chem. Phys. 111, 5947 (1999).
- Quintanilla et al. [2000] J. Quintanilla, S. Torquato, and R. M. Ziff, J. Phys. A. Math. Gen. 33, L399 (2000).
- Newman and Ziff [2001] M. E. J. Newman and R. M. Ziff, Phys. Rev. E 64, 016706 (2001), arXiv:0101295 [cond-mat] .
- Quintanilla and Ziff [2007] J. A. Quintanilla and R. M. Ziff, Phys. Rev. E 76, 051115 (2007).
- Gillespie [1976] D. T. Gillespie, J. Comput. Phys. 22, 403 (1976).
- Gillespie [1977] D. T. Gillespie, J. Phys. Chem. 81, 2340 (1977).
- Erban and Chapman [2020] R. Erban and S. J. Chapman, Stochastic Modelling of Reaction–Diffusion Processes, Cambridge Texts in Applied Mathematics (Cambridge University Press, 2020).
- Bortz et al. [1975] A. B. Bortz, M. H. Kalos, and J. L. Lebowitz, J. Comput. Phys. 17, 10 (1975).
- Kermack and McKendrick [1927] W. O. Kermack and A. G. McKendrick, Proc. R. Soc. London. Ser. A, Contain. Pap. a Math. Phys. Character 115, 700 (1927).
- Tomé et al. [2013] T. Tomé, D. R. de Souza, and R. M. Ziff, preprint (2013).
- Henley [1986] C. L. Henley, Phys. Rev. B 34, 797 (1986).
- Ghosh et al. [2020] S. Ghosh, N. Miyoshi, and T. Shirai, arXive (2020), arXiv:2009.08811 .