Spin–gap formation due to spin–Peierls instability in –orbital–ordered NaO2
Abstract
We have investigated the low–temperature magnetism of sodium superoxide (NaO2), in which spin, orbital, and lattice degrees of freedom are closely entangled. The magnetic susceptibility shows anomalies at K and K, which correspond well to the structural phase transition temperatures, and a sudden decrease below K. At 4.2 K, the magnetization shows a clear stepwise anomaly around 30 T with a large hysteresis. In addition, the muon spin relaxation experiments indicate no magnetic phase transition down to K. The inelastic neutron scattering spectrum exhibits magnetic excitation with a finite energy gap. These results confirm that the ground state of NaO2 is a spin–singlet state. To understand this ground state in NaO2, we performed Raman scattering experiments. All the Raman–active libration modes expected for the marcasite phase below are observed. Furthermore, we find that several new peaks appear below . This directly evidences the low crystal symmetry, namely, the presence of the phase transition at . We conclude the singlet–ground state of NaO2 due to the spin–Peierls instability.
pacs:
Valid PACS appear hereThe entanglement of spins, orbitals, charge, and lattice degrees of freedom is a fundamental issue in solid–state physics Tokura ; Goodenough ; Kugel ; Kanamori . They yield a variety of phenomena such as superconductivity, quantum liquids, multi–ferroics, and orbital liquids BaCuSbO ; Kimura ; Ishihara . While these physics have been discussed mainly in – and –electron systems, there has been very little discussion in – or –electron systems fullerene ; tdae_kambe . The magnetism of alkali–metal superoxide, O2, originates from the unpaired –electrons on O2 molecule. In O2, as two unpaired electrons occupy two –orbitals, and , whose spins are in parallel to each other, O2 is a magnetic molecule with the spin quantum number, , of 1. In O2, as –cation is usually fully ionized to form state, the additional electron on O2 occupies one of two half–filled –orbitals. This allows the O molecule to gain the orbital degrees of freedom. As three electrons exist on two s, the energy band for the O state is quarter–filled. The ab initio band calculations for O2 show that the Fermi energy locates within the –band KO2_kim ; RbO2_Mott ; KO2_Solovyev . On the contrary, the experimental magnetic properties suggest electron localization, which implies the importance of an electronic correlation on the O2 molecule. Thus, O2 should be considered as a Mott insulator KO2_kim ; RbO2_Mott . Spontaneous Jahn–Teller distortion should occur to lift the degeneracy of –orbital, which leads to the selection of the –orbitals. The coherent arrangement of the O2 orbitals is expected to lead to a three–dimensional magnetic exchange interaction between the spins. Therefore, in O2, spins, orbitals, charge and lattice degrees of freedom are strongly coupled KO2_Solovyev . O2 is expected to be a candidate material to exhibit such fascinating phenomena.
Recently, O2 has attracted much attention for its magnetic quantum phenomena at low temperatures CsO2_Riyadi ; CsO2_NMR ; CsO2_ESR ; CsO2_Miyajima ; RbO2_Fahmi ; Fahmi_thesis ; Miyajima_thesis . CsO2 shows one–dimensional (1D) antiferromagnetic (AF) behavior in the magnetic susceptibility and the high–magnetic field magnetization CsO2_Riyadi ; CsO2_Miyajima . It was suggested that a 1D chain should form as a result of the –orbital ordering, but the detailed low–temperature structure has not been determined CsO2_Riyadi . NMR experiments showed a power–law dependence of the spin–lattice relaxation function, suggesting the emergence of a Tomonaga–Luttinger Liquid state in the 1D short range ordered phase CsO2_NMR .
Contrary to RbO2 and CsO2, NaO2 has a cubic (Space group; 3̄) symmetry at room–temperature, in which O2 has an orientational disorder AO2_XRD . With decreasing temperature, NaO2 shows successive structural phase transitions at and K AO2_XRD . In the marcasite phase below , the degeneracy of the orbitals is considered to be lifted due to the low local symmetry around O2. The magnetic susceptibility shows a weak decrease below and, then, a sudden drop below K. These experimental findings remind us of a low dimensionality of the spin system and of a magnetic phase change below . Theoretical calculations for the marcasite phase pointed to the quasi–1D AF character along the –axis and frustration of exchange interactions between different sublattice spins NaO2_Solovyev . However, because of no experimental inspection on an existence of magnetic phase transition and a change in crystal symmetry, the magnetic ground state of NaO2 has not yet been clarified. In this Letter, we investigate low–temperature magnetic and structural properties of the –orbital system NaO2 in detail. For this purpose, we performed magnetic susceptibility, high–field magnetization, muon spin relaxation (SR), x–ray diffraction (xrd), inelastic neutron scattering (ins) and Raman scattering experiments using high quality samples.
First, we define three phases AO2_XRD ; the phase I above , the phase II between and , the phase III between and . NaO2 has a remarkable temperature dependence of magnetic susceptibility, , where and denote the magnetization and the magnetic field, respectively. Figure 1 (b) shows the temperature dependence of for a powder sample using a cooling and heating protocol with a magnetic field of 0.1 T. shows anomalies around , and , which is consistent with the literature AO2_magnetism . The temperatures of and correspond well to the structural phase transition temperatures supple_1 . In the phase I, the follows the Curie–Weiss law with a negative Weiss constant of K. Small indicates a weak AF interaction, which should be due to the orientational disorder of O2. In the phase II, the changes to K, suggesting ferromagnetic correlations due to the orientational ordering of O2. The effective magnetic moments above and below are estimated to be about 1.82 and 1.68 , respectively, which increase slightly from the value expected from the spin only. This may be due to the orbital effect. Following a clear hysteresis around , which indicates a first order phase transition, shows a weak decrease with decreasing temperature. As the localized spins on O2 are responsible for the magnetism of NaO2, the remarkable decrease of in the phase III is an important key to consider the low–temperature magnetism NaO2_Mahanti ; NaO2_Solovyev . In other words, it may be reasonable to think that it comes from low–dimensionality. To evaluate from the , we used the Bonner–Fisher model BF and a two–dimensional model with weak inter–chain interaction Keith , as shown in Fig. S3 in Supplemental Material. However, we could not reproduce the experiments by these models using the temperature–independent . The xrd experiments showed that the thermal shrinkage coefficient of the –axis was (Å/K), which was the largest value among the principal axes. Thus, the shrinkage of the nearest neighbor (NN) length between O2s, which corresponds to the –axis length, may be sufficient to make AF stronger as the temperature decreases.
Below , decreases rapidly with decreasing temperature with no temperature hysteresis and, then, increases. The SR experiment showed that no magnetic ordering was found down to 0.3 K as described later. Therefore, the decrease of implies the appearance of a spin–gap in the spin excitation spectrum. Note that the low–temperature Curie–tail is strongly dependent on the sample batch, indicating that it is due to the extrinsic spins. To evaluate the intrinsic temperature dependence of , we use the equation: , where the denotes the spin–gap and is the Boltzmann constant muSR_NaTiSiO ; SP_NMR . The first term is the Curie–tail contribution, which can be subtracted from the data, and the second term is responsible for the spins excited from the singlet state to the magnetic excited states. As shown in Fig. 1 (c), the fitting by this equation with K is good. The Curie tail allows us to estimate the number of extrinsic spins with to be 0.014 mol in this sample.
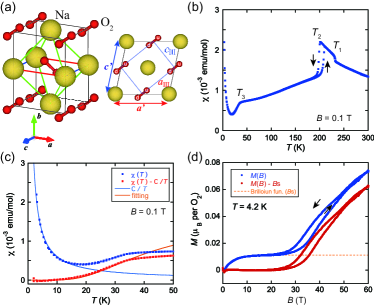
Figure 1 (d) shows the magnetization curve, , as a function of up to 60 T at K. The saturation magnetization is equivalent to . Note that the experiment was performed using the same sample as the experiments. At K, the shows a nonlinear increase at low fields and an anomaly with a large hysteresis around T. To evaluate the low–magnetic field part of the curve, we use a Brillouin function as shown in Fig. 1 (d). The fitting was good and the number of paramagnetic spins was obtained to be 0.011 mol. This value is consistent with that obtained from the Curie–tail in the experiment, allowing us to subtract the low–field Brillouin contribution from the curve. Accordingly, shows the magnetic field induced transition from non–magnetic to magnetic state with the large hysteresis around T.
To find out any signatures of a magnetic ordering in NaO2, we performed SR experiments down to 0.3 K. Figure 2(a) shows corrected time spectra measured at 0.3 K (), 5 K and 100 K () in the zero–field (ZF) condition. Neither the loss of the initial asymmetry at = 0 nor the muon–spin precession was observed down to 0.3 K. These findings exclude the presence of a long–range magnetic order down to 0.3 K.
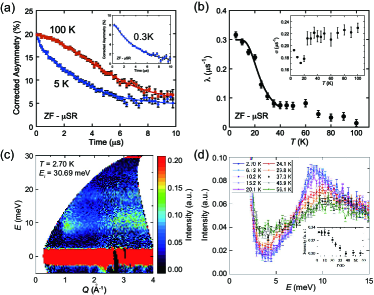
To focus on collecting some data points around , we analyzed the depolarization rate obtained in ZF by using the function: Kubo_Toyabe . In here, the Gaussian term arises from the muon–spin relaxation caused by randomly distributed internal fields coming from surrounding nuclear dipoles. The exponential term ascribes the effect of the fluctuating electronic moments around the muonMuon_Relax_1 ; Muon_Relax_2 . The B.G. indicates background signals from muons which do not stop in the sample but in a sample mounting plate. These B.G. signals were subtracted from the raw signal as a constant term in order to achieve corrected SR time spectra.
The temperature dependence of and are shown in Fig. 2 (b). Above , we obtained and s-1. The result of obtained above indicates that electronic spins likely fluctuate beyond the SR characteristic time window ( sec), resulting in the motional narrowing limit. The increases below suggests that the muon is expected to sense the formation of the spin–gap state in NaO2. One possible scenario to explain this result is that the muon spin relaxes its polarization by the thermally activated electronic spins across the spin–gap. The same behavior was observed in other spin–gap systems muSR_NaTiSiO . Following this scenario, the spin–gap is estimated from the temperature dependence of below by applying the following function: muSR_NaTiSiO ; SP_NMR . Using this equation, we estimated the to be 44.6 K, which was consistent with that obtained from the magnetic susceptibility measurement.
Figure 2(c) shows the ins spectra of powder sample at 2.70 K, where the background contribution was subtracted (see Supplemental Material). The excitation around Å-1 is shown to have a finite energy gap. The intensity decreases with , which is typical behavior of magnetic scattering, in the range of Å-1. The enhanced intensity at Å-1 is from remnant phonon scattering of the sample cell made of Aluminum. The first momentum of the dynamical structure factor in 1D AF spin chain is proportional to , where is the distance between spins Igor , leading to the pronounced intensity at Å-1.
To reveal the change in the intensity as a function of temperature, the spectra integrated between 0.5 Å-1 and 1.5 Å-1 are shown in Fig. 2(d). At 2.70 K, the intensity starts to increase at meV and has a maximum at meV. The temperature dependence of the intensity at the maximum energy is shown in the inset. It shows no temperature dependence above , and gradually increases with decreasing temperature below . This result directly indicates that NaO2 has the magnetic excitation with an excitation gap energy of 9 meV below . As the SR experiments indicated no magnetic long–range ordering down to 0.3 K, this peak results not from magnetic excitation in the magnetic long–range ordered phase but from singlet–triplet excitation in the non–magnetic ground state.
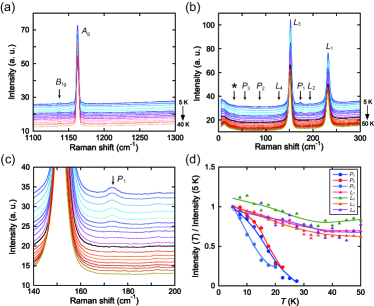
We searched for structural dimerization of the O2 molecules as the cause of the non–magnetic state by the xrd and neutron diffraction measurements, but could not experience the direct evidence on the structural change below supple_2 . Then, we perform Raman scattering experiments because of high sensitivity to changes in crystal symmetry and/or molecular charge. Figures 3 (a) and (b) show the temperature dependence of the Raman scattering spectra in the stretching and the libration mode region of O2, respectively. We will focus on the change of the Raman–active modes around .
As the crystal symmetry of the phase III is determined as (), the sets of Raman active stretching and libration modes are given by and , respectively AO2_Raman ; AO2_opt . As shown in Fig. 3 (a), two peaks can be clearly observed in the stretching mode region. We can assign that the peaks at 1163 cm-1 and 1140 cm-1 originate from the in–phase and the out–of–phase stretching modes, namely, and , respectively. The mode is observed for the first time. In the libration mode region (see Fig. 3 (b)), two major peaks are observed around 150 cm-1 () and 240 cm-1 (). Moreover, very weak peaks around 130 cm-1 () and 190 cm-1 () are observed for the first time. These libration modes can be assigned from the intensity and energy, but a more detailed consideration will be needed. Anyway, these results demonstrate that all Raman active modes for the phase with the symmetry can be successfully detected AO2_Raman . Below , while no change was observed in the stretching mode region, in the libration mode region, new peaks at 173, 86 and 56 cm-1 gradually appeared, which are represented as , and in Fig. 3 (b), respectively. Figure 3 (c) shows the temperature dependence of the peak and Fig. 3 (d) summarizes the temperature dependence of the peak intensity observed in the libration mode region. While the modes depended weakly on the temperatures, the , and peak intensities increased markedly below 30 K, following order parameter like behavior. Note that no splittings of the stretching modes are found, suggesting an absence of charge ordering on O2. Thus, this result clearly indicates an existence of a phase transition around . Because all Raman–active modes are confirmed in the phase III, the observation of the new peaks is direct evidence for the low crystal symmetry below .
To discuss the cause of the non–magnetic state, it is necessary to understand the crystal structure of the precursor phase, i.e., the phase III. O2 is octahedrally surrounded by Na atoms in all phases. In the phase II, the molecular axis is aligned along one of the four equivalent [111]–directions of the octahedron (see Supplemental Material). The NN molecules arrange their molecular axes to avoid each other, i.e., coherent antiferro–like arrangement of the molecular axes. Because the symmetry of the octahedron is still cubic, the degeneracy of the orbital should be conserved. On the contrary, in the phase III, the three–fold symmetry of the octahedron is lost and the molecular axis is slightly tilted from the [111]–direction of the octahedron. Na–Na bond lengths are changed to be not equivalent and the Na–O bond length is increased along the –axis (In Fig.1 (a), different Na–Na bond lengths are displayed by colors). The NN molecules within the –plane arrange their molecular axes to be parallel to each other, namely, the ferro–like arrangement of the molecular axes is realized. Thus, the NN molecular axis is parallel to each other along the –axis while those is canted along the – and –axis. The two–fold distortion of the octahedron should break the orbital degeneracy, and stabilizes the orbital perpendicular to the –axis as unoccupied orbital. Namely, a ferro–orbital ordering realizes in the –plane. The –axis length, i.e., the length between the NN molecules, is obtained to be 3.39 Å at 100 K, which is close to the length between molecules in the –phase of the solid–O2 ( Å) O2_Defoits ; O2_Date . Consequently, we can expect the strong AF exchange interaction along the –axis. This structural peculiarity should be manifested in the below , namely, the low–dimensional nature. Moreover, because there was no structural dimerization of O2 in any directions in all phases, we were able to deny both isolated dimerization of O2 and 1D alternating AF chain as the cause of the spin–gap. Accordingly, we can conclude that the magnetism in the phase III is based on the uniform AF spin–chain and, then, the magnetic ground state is the spin–Peierls (SP) state.
Finally, we consider the SP state in NaO2. As the spin–gap value and the SP transition temperature are obtained to be K and K, respectively, from the magnetic measurements, the value of is calculated to be 3.01. This is comparable with the BCS weak coupling result (3.54). The alternating exchange interaction constants, and , in the SP state can be written as using the alternating parameter SP_Pytte . The spin–gap is also related to with . Using the Bulaevskii’s formula for the below the SP transition Bulaevskii , we estimate the by fitting to the experiment. When we use the K in the 1D uniform AF phase, which was obtained around 50 K, we obtain the of 0.11. For the organic SP compounds TTF–CuBDT TTF_CuBDT_Bray and the inorganic CuGeO3 CuGeO3_Hase , the was estimated to be 0.167 and 0.167, respectively. The in NaO2 is comparable to these values. Moreover, the of 0.11 roughly leads to the of 51 K, which is almost identical to the spin–gap value obtained in the experiment. It is known that the AF of the solid–O2 magnet depends exponentially on the inter–molecular length O2_Hermert ; O2_Wormer ; O2_Bussery ; O2_Date . As we expect that the direct magnetic interaction between NN O2s along the –axis is dominant, the same dependence can be applied. If so, even though the lattice dimerization in NaO2 would be extremely so small not to be observed experimentally, the –alternation may occur in the SP phase. More detailed structural study in the SP phase of NaO2 is a future task.
In summary, we have investigated the low–temperature magnetism of NaO2. We found no magnetic phase transition down to K and confirmed the spin–singlet ground state below . Raman scattering experiments clearly indicated the presence of the phase transition at . Consequently, we conclude that the singlet–ground state of NaO2 is due to the SP instability.
The authors acknowledge fruitful discussions with H. O. Jescheke, J. Otsuki, M. Naka, K. Okada, R. Kondo, T. Goto, H. Sagayama, R. Kumai. The x–ray diffraction study was performed under the approval of the Photon Factory Program Advisory Committee (Proposal No. 2017G636, 2019T003, 2020G666). The neutron scattering experiment at the HRC was approved by the Neutron Scattering Program Advisory Committee of IMSS, KEK (proposals no. 2019S01), and ISSP. This work was partly supported by JSPS KAKENHI (15H03529, 20K20896, 21H04441), MEXT, Japan.
† Corresponding author; [email protected]
§ Present address; Institute for Molecular Science, Okazaki, Japan
¶ Present address; Department of Physics, Institut Teknologi Sepuluh Nopember, Indonesia
∗ These authors contributed equally to this work.
References
- (1) Y. Tokura and N. Nagaosa, Science, 288, 462 (2000).
- (2) J. B. Goodenough. Magnetism and Chemical Bond, (Interscience, New York, (1963).
- (3) K. I. Kugel and D. I. Khomskii, Sov. Phys. Usp. , 25(4), 231(1982).
- (4) J. Kanamori, J. Phys. Chem. Solids, 10(2), 87 (1959).
- (5) Y. Ishiguro, K. Kimura, S. Nakatsuji, S. Tsutsui, A. Q R Baron, T. Kimura, Y. Wakabayashi, Nat. Commun., 4, 2022, (2013).
- (6) T. Kimura, T. Goto, H. Shintani, K. Ishizaka, T. Arima, and Y. Tokura. Nature, 426, 55–58, (2003).
- (7) S. Ishihara, M. Yamanaka, and N. Nagaosa. Phys. Rev. B, 56(2), 686–692, 07 1997.
- (8) S. Margadonna, K. Prassides, H. Shimoda, T. Takenobu, and Y. Iwasa, Phys. Rev. B, 64, 132414 (2001).
- (9) T. Kambe, K. Kajiyoshi, M. Fujiwara and K. Oshima, Phys. Rev. Lett., 99, 177205, (2007).
- (10) M. Kim and B. I. Min. Phys. Rev. B, 89(12), 121106(R), (2014).
- (11) R. Kováčik, P. Werner, K. Dymkowski, and C. Ederer. Phys. Rev. B, 86(7), 075130, (2012).
- (12) I V Solovyev. New J. Phys., 10(1), 013035, (2008).
- (13) S. Riyadi, B. Zhang, R. A. de Groot, A. Caretta, P. H. M. van Loosdrecht, T. T. M. Palstra, and G. R. Blake. Phys. Rev. Lett., 108, 217206, (2012).
- (14) M. Klanjšek, D. Arčon, A. Sans, P. Adler, M. Jansen, and C. Felser. Phys. Rev. Lett., 115, 057205, (2015).
- (15) T. Knaflič, M. Klanjšek, A. Sans, P. Adler, M. Jansen, C. Felser, and D. Arčon. Phys. Rev. B, 91, 174419, (2015).
- (16) M. Miyajima, F. Astuti, T. Kakuto, A. Matsuo, D. P. Sari, R. Asih, K. Okunishi, T. Nakano, Y. Nozue, K. Kindo, I. Watanabe, and T. Kambe. J. Phys. Soc. Jpn., 87(6), 063704, (2018).
- (17) F. Astuti, M. Miyajima, T. Fukuda, M. Kodani, T. Nakano, T. Kambe, and I. Watanabe. J. Phys. Soc. Jpn., 88(4), 043701, (2019).
- (18) Fahmi Astuti. PhD thesis, Hokkaido University, (2019).
- (19) Mizuki Miyajima. PhD thesis, Okayama University, (2021).
- (20) M. Ziegler, M. Rosenfeld, and W. Känzig, Helv. Phys. Acta, 49, 57, (1976).
- (21) I. V. Solovyev, Z. V. Pchelkina, and V. V. Mazurenko. Cryst. Eng. Comm, 16, 522, (2014).
- (22) A. Zumsteg, M. Ziegler, W. Känzig, and M. Bösch. J. Phys. Condens. Matter, 17(4), 267, (1974).
- (23) The crystal structures for these phases were analyzed by the Rietveld refinement and are shown in Supplemental Material.
- (24) S. D. Mahanti and G. Kemeny. Phys. Rev. B, 20, 2105, (1979).
- (25) J. C. Bonner and M. E. Fisher. Phys. Rev., 135, A640, (1964).
- (26) B. C. Keith, C. P. Landee, T. Valleau, M. M. Turnbull, and N. Harrison. Phys. Rev. B, 84, 104442, (2011).
- (27) P. J. Baker, S. J. Blundell, F. L. Pratt, T. Lancaster, M. L. Brooks, W. Hayes, M. Isobe, Y. Ueda, M. Hoinkis, M. Sing, M. Klemm, S. Horn, and R. Claessen. Phys. Rev. B, 75, 094404, (2007).
- (28) E. Ehrenfreund and L. S. Smith. Phys. Rev. B, 16(5), 1870, (1977).
- (29) R. S. Hayano, Y. J. Uemura, J. Imazato, N. Nishida, T. Yamazaki, and R. Kubo. Phys. Rev. B, 20, 850, (1979).
- (30) I. Watanabe, M. Akoshima, Y. Koike, S. Ohira, and K. Nagamine. Phys. Rev. B, 62, 14524, (2000).
- (31) T. Adachi, N. Oki, Risdiana, S. Yairi, Y. Koike, and I. Watanabe. Phys. Rev. B, 78, 134515, (2008).
- (32) I. Zaliznyak and S. Lee, Magnetic Neutron Scattering in Modern Techniques for Characterizing Magnetic Materials, edited by Y. Zhu (Springer, Heidelberg, 2005).
- (33) In Supplemental Material, we estimated the upper limit of a distortion along the –axis, where the strong AF interaction should be present between the NN O2s, by taking into account the systematic error of the experimental background in the neutron elastic diffraction experiments.
- (34) J. B. Bates, M. H. Brooker, and G. E. Boyd. Chem. Phys. Lett., 16(2), 391, (1972).
- (35) M. Bösch and W. Känzig. Helv. Phys. Acta, 48(5-6), 743, (1975).
- (36) G. C. DeFotis. Phys. Rev. B, 23, 4714, (1981).
- (37) C. Uyeda, K. Sugiyama, and M. Date. J. Phys. Soc. Jpn., 54(3), 1107, (1985).
- (38) E. Pytte. Phys. Rev. B, 10, 4637, (1974).
- (39) N. Bulaevskii. Sov. Phys. Solid state, 11(5), 921, (1969).
- (40) J. W. Bray, H. R. Hart, L. V. Interrante, I. S. Jacobs, J. S. Kasper, G. D. Watkins, S. H. Wee, and J. C. Bonner. Phys. Rev. Lett., 35(11), 744, (1975).
- (41) M. Hase, I. Terasaki, and K. Uchinokura. Phys. Rev. Lett., 70, 3651, (1993).
- (42) M. C. van Hemert, P. E. S. Wormer, and A. van der Avoird. Phys. Rev. Lett., 51, 1167, (1983).
- (43) Paul E. S. Wormer and Ad van der Avoird. J. Chem. Phys., 81(4), 1929, (1984).
- (44) B. Bussery, S. Ya. Umanskii, M. Aubert–Frécon, and O. Bouty. J. Chem. Phys., 101(1), 416, (1994).