Spatiotemporal Data Mining: A Survey
Abstract.
Spatiotemporal data mining aims to discover interesting, useful but non-trivial patterns in big spatial and spatiotemporal data. They are used in various application domains such as public safety, ecology, epidemiology, earth science etc. This problem is challenging because of the high societal cost of spurious patterns and exorbitant computational cost. Recent surveys of spatiotemporal data mining need update due to rapid growth. In addition, they did not adequately survey parallel techniques for spatiotemporal data mining. This paper provides a more up-to-date survey of spatiotemporal data mining methods. Furthermore, it has a detailed survey of parallel formulations of spatiotemporal data mining.
1. Introduction
Spatiotemporal data mining is the process of discovering novel, non-trivial but potentially useful patterns in large scale spatiotemporal data. Spatiotemporal (ST) data include georeferenced climate variables, epidemic outbreaks, crime events, social media, traffic, transportation dynamics, etc. Analyzing and mining such data is of great importance for advancing the state-of-the-art in many scientific problems and real-world applications due to its interdisciplinary nature. Hence, ST data are used prominently in various domains such as public safety, ecology, epidemiology, etc.
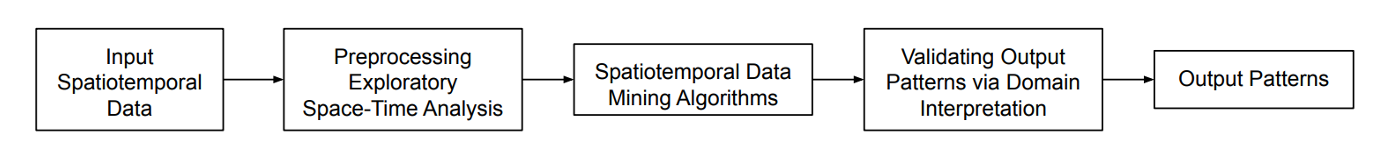
Figure 1 shows the overall process of spatiotemporal data mining. After preprocessing to remove noise, errors, etc., the input data undergo space-time analysis to understand their spatiotemporal distribution. Appropriate spatiotemporal data mining algorithms are applied to produce output patterns that are then studied and validated by domain experts to discover novel insights, and the data mining algorithms are refined accordingly.

An example of a spatiotemporal (ST) pattern is shown in Figure 2. The figure depicts a cascading spatiotemporal pattern (Mohan et al., 2010) that was output on an urban crime dataset involving several event types (bar closings, drunk driving, assaults). Figures 2(a) -2 (c) show the instances of each event type with their times and locations, and Figure 2 (e) shows the same event instances altogether. The detected ST pattern suggests the interesting hypothesis that bars at closing time are potential generators of drunk driving and assault crimes in nearby areas. Such information can help law enforcement agencies, public safety groups, and policymakers determine appropriate crime mitigation action.
Mining spatiotemporal data via algorithms pose unique computing challenges. For instance, due to large data volume, users may experience unacceptable runtime or expending great efforts in pre-processing the data due to great variety. Besides volume and variety, high data velocity relative to ingest capacity is another computing challenge where user experiences frequent data loss. For instance, the real-time processing of millions of tweets involves real-time pre-processing and mining of certain information. COVID 19 Safegraph data (saf, 2020) records human mobility movements every minute via nearby information (e.g., POIs, Business Categories) across the country. This involves real-time updates on information such as the number of visits to different POIs resulting in massive data volume (Terabytes), which is impossible to store and process in a local machine. In addition, the US Census (USC, 2020) including millions of records saved in different tables and schema spanning terabytes of data space.
Querying such data may be time-consuming, and further applying algorithms often perform poorly in terms of computation time at a large scale on scientific or geographic computing platforms. Such computations require a scalable and reliable software ecosystem to solve broad research problems and efficiently help society’s decision-makers. Hence, it is important that a broad community of scientists and users be informed about the high performance, scalable, and open-source software tools available today that can facilitate spatiotemporal data analytics with parallel computation to significantly advance domain research.
However, most of these efforts have received little attention in recent surveys of spatial and spatiotemporal data mining research. Here we provide a comprehensive survey of spatiotemporal data mining techniques along with a brief description of their statistical foundations and major output pattern families (e.g., outliers, predictions, hotspots, etc.). We also provide current literature on recent approaches that are being widely studied in both sequential and parallel processing environments.
Similar to Shekhar et al. (Shekhar et al., 2015), this survey starts with a review of previous surveys, followed by a statement of our contribution towards this survey (Section 2). Section 3 provides key terms related to spatial and spatiotemporal data and describes their statistics foundation along with a brief statement about the societal importance of parallel processing in spatiotemporal data mining. Section 4 describes six main output pattern families (i.e., spatiotemporal outliers, telecouplings, prediction, partitioning and summarization, hotspots, and change detection) along with their respective detection approaches in both sequential and parallel frameworks. Some current research tools are discussed in Section 5, including state of the art parallel tools, frameworks, and libraries, which are being used in many applications. Section 6 concludes the chapter with a look at the current research trends and future directions.
2. Related Work and Contribution
2.1. Framework
A large number of literature surveys can be found on spatial and spatiotemporal data mining. Older surveys focused on methodologies without statistical significance tests, whereas recent works have focused on pattern families with limited attention to parallel spatiotemporal data mining techniques. Hence, we categorized it into two groups, one without a statistical foundation and the other with statistical foundations, as shown in Figure 3. The earliest of these date to the 1990s (Ester et al., 1997; Koperski et al., 1996; Roddick and Spiliopoulou, 1999). Miller et al. (Roddick and Spiliopoulou, 1999) later reviewed trends in spatial and spatiotemporal data mining; like earlier surveys, none of the works covered considered statistical significance.

Shekhar et al. (Shekhar et al., 2003) focused on the unique characteristics of spatial data and offered the first in-depth review of its statistical foundation. Zhou et al. (Zhou et al., 2014) described various techniques involved in change detection from an interdisciplinary perspective; Aggarwal et al. (Aggarwal, 2017) reviewed spatial and spatiotemporal outlier techniques, and Cheng et al. (Cheng et al., 2014) talked about spatiotemporal autocorrelation, space-time forecasting, space-time clustering and its visualization. More comprehensive reviews by Shekhar et al. (Shekhar et al., 2011) covered most of the pattern families but did not include any research done in the parallel computing domain. Among recent works, Atluri et al. (Atluri et al., 2018) give a good overview of spatiotemporal data mining that addresses pattern families and describes the methods used in a parallel framework to some extent. Overall, however, there is no current survey on spatiotemporal data mining that covers prominent pattern families from both a sequential and parallel perspective.
Contributions: This chapter makes the following contributions: (i) It surveys major pattern families with current literature in spatiotemporal data mining from both sequential and parallel computing perspective; (ii) It informs researchers about the current tools, platforms, and libraries that are available for spatiotemporal data analysis in parallel computing environments and (iii) It summarizes recent trends and suggests future work for the advancement of high-performance spatiotemporal data mining.
3. Definitions and Societal Importance
This section provides key terms and a taxonomy of spatial and spatiotemporal data and its attributes and relationships. It also explains why parallel computing in ST data mining is essential for society.
Spatial and Spatiotemporal Data: Spatial data provides information related to different instances in coordinate space and can be represented as object models (points, lines, and polygons), field models, and spatial networks (e.g., graphs) (Shekhar, 2007). Spatiotemporal data includes additional temporal information and can be represented by temporal snapshot models, temporal change models, and event or process models. In temporal snapshot models, snapshots can be considered trajectories of lines and polygons, including spatial layers (i.e., points or multi-points). Temporal change models represent spatiotemporal data with incremental changes from a given start time on a spatial layer (e.g., Brownian motion, random walk). Event models represent events as entities that remain consistent over time, while process models represent processes as entities that are subject to change over time.
Spatiotemporal Data Attributes: Attributes of spatiotemporal data include spatial and non-spatial characteristics and temporal attributes that include snapshots of spatial objects, raster layers, spatial networks, and process durations. Since materializing spatiotemporal relationships may result in the loss of spatial information, spatiotemporal statistics and techniques are preferred over traditional methods. Spatiotemporal statistics integrate spatial and temporal statistics based on first and second-order moments (mean, variance, co-variance) and can be further classified into descriptive and dynamic models (Cressie and Wikle, 2015).
Societal Importance: Geo-spatial algorithms use spatial and spatiotemporal data in polygonal or raster form. However, these algorithms are hard to execute due to the irregular structure of the statistics’ data and complexity, making it important to optimize computations for time-critical operations. In turn, runtime optimization supports timely decision-making by city planners, policymakers, federal governments, etc. For instance, real-time emergency response is required in a pandemic (COVID-19) or a natural disaster (e.g., hurricane, tornado) where every second lost in the decision-making process (e.g., rescue operation) may lead to property damage, injuries, or loss of life (Prasad et al., 2017).

Our recent work (Sharma et al., 2021), we visually monitored human mobility patterns every week for every Point of Interest (POI) and Business Category in Minnesota during an early phase of the COVID-19 pandemic. Figure 4 shows the change in weekly mobility patterns for the most frequently visited business categories, positively correlated to several cases. This information helped Minnesota policymakers plan how to safely reopen the state economy while reducing the virus’s spread. In another example, Chang et al. (Chang et al., 2021) used US Census data to study the effects of mobility among disadvantaged racial and socioeconomic groups for more-effective and equitable policy responses to COVID-19. However, computing such intricate mobility patterns involves large data volumes with millions of records updated periodically in real-time. Hence, big data processing platforms (Zaharia et al., 2012) and hardware (e.g., graphical processing units) tools are used are needed to perform accelerated computing and provide output in real-time for time-critical decision making.
4. Output Pattern Families
This section provides a brief description of major pattern families with current literature surveys in non-parallel and parallel frameworks. This section describes six major pattern families in spatiotemporal data mining and briefly surveys the current related literature in non-parallel and parallel environments.
4.1. Spatiotemporal Outliers and Anomalies
Outliers are sets of observations that appear to deviate from expected behavior as compared to other observations, resulting in abnormal patterns that may arouse suspicion in some cases (e.g., illegal fishing (Sharma et al., 2020)). A spatial outlier is a spatially referenced object whose non-spatial attribute value significantly varies from other spatially referenced objects in the spatial neighborhood. Figure 5b shows a variogram cloud of the example dataset shown in Figure 5a, where the locations which are near one another but with large attribute differences might indicate a spatial outlier. For instance, pairs (P, S) and (Q, S) in Figure 5b may be potential spatial outlier candidates since they lie above the main group of pairs. Point S might also be considered a spatial outlier since it is present in both the (P, S) and (Q, S) groups. A spatiotemporal outlier that differs significantly both spatially and temporally from its spatiotemporal neighborhood results in instability or inconsistency of the actual data. Statistics include bi-partite multidimensional tests (e.g., Moran scatterplot) and quantitative tests (e.g., scatterplots), which can also be applied to spatiotemporal data.


4.1.1. Common Approaches
Outliers in spatial time series: Detection of spatial time series outliers is based on visualization approaches (e.g., variograms, Moran scatterplots) and the spatiotemporal neighborhood, which can be identified with distance measures such as K nearest neighbors or graph connectivity (Banerjee
et al., 2003). The methods can also be extended to include non-spatial, weighted, categorical, or local spatial outliers, etc.
In the parallel computing domain, a tile-map interface is proposed for detecting anomalous events (Shin et al., 2017) by simultaneously processing multiple tiles using multi-threading, providing substantial computational speedup. Another spatiotemporal outlier detection method (Barua and Alhajj, 2007) uses a parallel wavelet transform to process massive meteorological data on high-performance architecture.
Anomalies in Spatiotemporal Data: Outliers in spatiotemporal data such as trajectories can be defined as anomalous patterns or anomalies. Many sequential approaches are used in finding outliers while monitoring trajectories (Zheng, 2015; Lee et al., 2008). Recently, Lam et al. (Lam, 2016) proposed a neighbor search approach to detect abnormal driving patterns that efficiently summarize and analyze their spatial and temporal patterns. A trajectory partitioning strategy was recently proposed (Lu
et al., 2017) in the parallel domain using similarity measures and taking into account the multi-motion characteristics of a vehicle (e.g., speed, acceleration, etc.)
4.2. Spatiotemporal Couplings and Tele-couplings
Spatiotemporal coupling patterns are based on instances that occur in close spatial and temporal proximity. These patterns can be unordered (co-occurrences), partially ordered (cascading patterns), or ordered (sequential patterns). The finding that bar closings lead to drunk driving and assault, shown in Figure 2, is an example of a partially ordered cascading pattern. In addition, there is the spatiotemporal tele-coupling pattern, which identifies a significant positive or negative correlation in a spatial time series. Statistics include the spatiotemporal cross K function, an extension of Ripley’s K function with multiple variables.
Discovering various spatiotemporal coupling patterns and tele-coupling is important in applications related to ecology, environmental science, public safety, and climate science. Recent work proposed a data-driven approach for inferring traffic cascading patterns over a real-world dataset (Liang et al., 2017).
4.2.1. Common Approaches
o-Occurrence Patterns: Spatiotemporal co-occurrence patterns are simultaneous occurrences of two or more subsets of events in both spatial and temporal proximity. Mixed drove co-occurrence pattern detection (Celik et al., 2006) is one such approach used in various fields such as transportation planning, battlefield strategy, and gaming but these patterns are computationally expensive. Other work includes a monotonic composite interest measure (Pillai et al., 2013). In parallel computing, asynchronous co-occurrence patterns (Yu et al., 2015a) have been studied for flood prediction by relating precipitation with actual precipitable water through association mining. The framework uses a MapReduce paradigm for parallelization and scalability and identifies spatial associations on climate data between one target location and its corresponding asynchronous locations.
Sequence Patterns: Sequence patterns are spatiotemporal events in the form of a “chain reaction” of subsequent ordered events. Some application domains include epidemiology to follow disease transmission patterns between several species. Methods proposed in (Huang et al., 2008) use a spatial sequence index as a significance measure that interprets the K-function. Other approaches (Zheng et al., 2011) mine uncertain sequences via probabilistic methods. Parallel implementation of sequential pattern mining (Qiao et al., 2008) was proposed for trajectory data by first reducing candidate trajectories, performing data parallelism for counting support, and finally using a MapReduce model for distributing jobs for scalability. A similar MapReduce implementation (Liang and Wu, 2015) proposed constructing a lexicographical sequence tree for efficiently finding frequent itemsets and then implementing a breadth-wide support pruning strategy for scalability over trajectories.
Spatial time series and teleconnections: Teleconnections are used to identify pairs of spatial time-series at different locations and are important in climate science and other domains for understanding oscillations (e.g., pairwise correlations, spatial autocorrelation on spatial time-series). Finding these patterns is computationally expensive due to the length of the time-series and the need for frequent enumeration of many candidates. Other techniques (Zhang et al., 2003; Kawale et al., 2012) use spatial autocorrelation and statistical significance testing to reduce recurrent computations. DStep framework (Kendall et al., 2011) was proposed for efficient domain traversal over data-intensive analysis tasks such as teleconnection analysis on atmospheric CO2 and climate data.
4.3. Spatiotemporal Prediction
Spatiotemporal predictions (Zheng, 2015) aim to learn a model that can forecast a target variable from the given explanatory feature’s forecast-dependent variables. This includes predicting continuous values via spatiotemporal regression or classifying outcomes via spatiotemporal classification. Spatiotemporal prediction allows spatiotemporal dependency over variables (e.g., neighborhood relationship, strength between elements etc.) at different locations.
Applications vary from remote sensing, where features include spectral bands and dependent variables such as forest, urban, water, etc. Other applications include regression analysis to predict global or regional climate variables, real estate pricing, etc.
4.3.1. Common Approaches
Spatiotemporal Regression: More recently, deep learning has been shown to solve complex non-linear problems. Deep learning techniques have been applied in traffic flow prediction (Chen et al., 2018; Moosavi et al., 2019) and duration of traffic incidents (Fu et al., 2019) by utilizing data attributes such as traffic events, weather data, points of interest, etc. In the parallel computing domain, a novel spatiotemporal recurrent convolutional neural network (RCNN) is proposed (Yu et al., 2017) in transportation science where the spatial dependencies are captured in deep CNN layers while the temporal dynamics are learned by Long Short Term Memory units and further applied in GPUs for accelerating the model learning procedure. A similar technique, DeepTC, uses a ConvLSTM network (Kim et al., 2018) for forecasting accurate tropical cyclone trajectories using a Weather Research and Forecasting Model.
Spatiotemporal Kriging: Kriging is used for interpolating unknown observations based on prior knowledge of known trajectories. Semantic Kriging (SemK) (Bhattacharjee et al., 2016) fetches land-use/land-cover distribution of terrain and incorporates the existing interpolation process of climatological pattern analysis. A parallel spatiotemporal Kriging algorithm (Zhang et al., 2018) predicts points with increasing observations, varying acceleration proportional to prediction points, comparing the original point, and cross-validating with real-world temperature data with the traditional model.
4.4. Spatiotemporal Partitioning and Summarization:
Spatiotemporal partitioning is a method of dividing underlying space and time and clustering a set of similar observations by partitioning the. In contrast, a spatiotemporal summarization is a brief representation of the spatiotemporal data associated with a spatiotemporal partition where aggregated statistics represent each partition. An example of clustering a common sub-trajectory from a set of trajectories T1, T2, T3, T4 (as described in (Lee et al., 2007)) is shown in Figure 6. Scan statistics include spatiotemporal point density estimation and temporal correlation.

Spatiotemporal partitioning and summarization are important in application domains such as public health, public safety, environmental science, and law enforcement. For instance, partitioning vehicle accident data, which is spatial and temporal, helps law enforcement agencies find trends and effectively deploy their resources.
4.4.1. Common Approaches
Spatiotemporal Event Partitioning: Methods for partitioning spatiotemporal events can be classified as global density-based (e.g., DBSCAN, ST-DBSCAN); hierarchical (e.g., BIRCH (Zhang et al., 1996)), which partitions spatiotemporal data at different hierarchical levels; and graph-based (e.g., CHAMELEON (Karypis et al., 1999)), which proposes a sparse k nearest neighbor that partitions the graph into segments and later merges its fragments based on a similarity measure. A recent work (Xie and Shekhar, 2019b) added a statistical significance test to DBSCAN that detects statistically significant clusters of various shapes and densities.
In parallel computing, balanced K-means (von Looz et al., 2018) applies a new geometric based optimal partitioning algorithm, resulting in faster convergence. A parallel implementation of k-medoids clustering (Song et al., 2017) uses a two-phase seeding and refinement approach that provides high accuracy and efficiency. DBSCAN and other density-based clustering methods (Welton et al., 2013; He et al., 2011; Cordova and Moh, 2015) have been implemented across various frameworks and hardware. Spatiotemporal graph and hypergraph partitioning models have also been proposed on multicore architectures over sparse matrix data (Abubaker et al., 2018).
Spatial Time-Series Partitioning: Spatial time-series partitioning divides the space into identical regions where correlations between time-series within a region are maximum. A filter and refine approach (Zhang et al., 2003) reduce computationally expensive and redundant computations. In medical imaging, Fast-GPU-PCC has been proposed on functional MRI images (Eslami and Saeed, 2018).
Trajectory Data Partitioning: A recent survey (Huang et al., 2008) categorized trajectory partitioning methods based on time interval, the trajectory’s shape, and semantic meaning. Another recent work (Jiang et al., 2017) partitions trajectories based on features such as density, speed, and direction flow. In the parallel domain, recent work (Bao et al., 2016) based on temporal partitioning using distributed and parallel RP-DBSCAN (Song and Lee, 2018) on Apache Spark uses a random and simultaneous partition scheme and find density reachable relationships and finally merges into a global cluster.
4.5. Spatiotemporal Hotspots
Given a set of geolocated objects, spatial hotspots are areas or regions where concentration of objects inside the region is significantly greater than outside. The log-likelihood ratio (Log LR) provides an interest measure for estimating the concentration of activities inside the given arbitrary shape (e.g., circle, ring) concerning the number of activities outside the shape in a given study area. Hence, the ratio is directly proportional to the concentration inside the given shape or region. It is complimented by a statistical significance test (e.g., p-value) that removes patterns that are highly unlikely to occur and is inversely proportional to the concentration of activities inside the region.


Figure 7 shows a case study of a New York Bronx Legionnaire’s disease outbreak (Eftelioglu et al., 2014) where the locations of 78 infected individuals (circular blue) and five potential outbreak sources (rectangular red) were hand digitized on a map (Figure 7a). Figure 7b shows a circular hotspot (in red) output by SatScan around the Opera House Hotel with a high concentration of geo-located infected individuals inside the circle along with their associated Log LR values and p-values. Figure 7c shows a ring-shaped hotspot output by a different method around the same location with a higher concentration (Log LR 34.55) of individuals inside the ring area (green) and better statistical significance (i.e., p-value 0.001).
Spatiotemporal hotspots are high density-based cluster patterns where the number of objects is unexpectedly more elevated than other observations within a specific time interval. Spatial hotspots (e.g., circular (Eftelioglu et al., 2014), ellipsoidal (Kulldorff, 1997), linear (Tang et al., 2017)) can be extended to spatiotemporal hotspots by adding the dimension of time. Such hotspots are useful in application domains such as public health and criminology.
4.5.1. Common Approaches
Spatiotemporal Scan Statistics: Spatiotemporal hotspots can persist or emerge (e.g., disease outbreak) over time. Recently, Spatio-Temporal Network Kernel Density Estimation (STNKDE) (Romano and Jiang, 2017) provides visualization for capturing the temporal dynamics of hotspots on network space and can be used for detecting traffic accidents. Other visualization techniques (Lukasczyk et al., 2015) are based on the topological notion of temporal hotspots evolution over epidemiological and crime data. Lagrangian representation of linear hotspots is discussed over traffic data (Li et al., 2020). Parallel spatiotemporal hotspot detection was recently implemented using Getis-Ord G* as the scan statistic on a Spark framework (Mehta et al., 2016) using a MapReduce paradigm. A novel normalization-based scan statistic was recently proposed (Xie and Shekhar, 2019a) for robust spatial hotspot detection, which can also be extended to spatiotemporal hotspots by adding the time dimension.
4.6. Spatiotemporal Change
Spatiotemporal change accounts the change in footprint patterns depending on input data representations. A change is defined as a change in statistical distribution where the data is assumed to be a part of a certain distribution. A spatiotemporal footprint comprises both spatial and temporal direction where a temporal footprint can be classified as a single or set of snapshots and a point or an interval in a long series. A set of snapshots can represent a change in a spatial field whereas a single snapshot represents a purely spatial change.
Other spatial footprints are raster based (local, focal, zonal) and vector based (point(s), polygon(s), line(s), network). A focal change occurs between a location and its spatial neighborhood while a zonal change occurs inside a spatial zone where a transition of data attributes occurs [10]. Figure 8. shows an example of spatial zonal change footprint of vegetation cover in Africa and its spatial zonal change patterns with longitudinal changes throughout the years.


4.6.1. Common Approaches
Spatiotemporal Change Patterns with Raster-Based Spatial Footprints: A change in footprint can be a change in human activities, a natural disaster, climate change, etc., that is seen while comparing a collection of pixels between two raster snapshots. A change can also be zonal if we consider objects rather than pixels between snapshots (Zheng, 2015). Scalable probabilistic change detection was proposed (Hong and Vatsavai, 2016) for satellite imagery using a parallel multicore architecture by parallelizing Gaussian and KL-Divergence computations. Another parallel implementation uses recurrent convolutional neural network (RNN) architecture (Mou et al., 2018) for extracting both spectral and spatiotemporal features.
5. Tools for Parallel Spatiotemporal Analysis
The following provides an overview of the tools and libraries that are available for parallel spatiotemporal analysis, using both CPU and GPU resources as well as big data platforms such as Apache Spark.
GIS Software: ArcGIS and QGIS are widely used GIS software packages that provide in-depth spatial and spatiotemporal analysis with the help of Parallel Processing Factor, which divides the input for performing operations on multiple processors. ArcGIS provides parallel extensions on various tools such as 3D Analyst tools, spatial analysis, space-time pattern mining etc. The popular QGIS analysis tool also provides OpenCL and CUDA support for parallel processing.
Spatiotemporal Statistics Tools: Many statistical packages (e.g., gstat, geoR) for spatial and spatiotemporal analysis can be run in the free R software environment but are limited to parallel implementation. The pbdNCDF4 (Patel et al., 2013) package provides parallel read and write capabilities for NetCDF datasets. Python’s deep learning Tensorflow library provides various functions for analyzing spatial and 3D spatiotemporal data.
Spatiotemporal Big Data Platforms: Big data systems are widely used for handling large complex data and exploiting parallelism on modern hardware. SpatialHadoop (Eldawy and Mokbel, 2015) and GeoSpark (Yu et al., 2015b) provide support for spatial big data analytics. STARK (Hagedorn et al., 2017), Geomesa (Hughes et al., 2015), and webGlobe (Sharma et al., 2018), all based on the Apache Spark framework, integrate support for both spatial and temporal data operations.
6. Research Trends and Future Needs
This chapter covered state-of-the-art approaches for detecting six important spatiotemporal pattern families in both sequential and parallel computing environments. Our survey reveals that detection methods for some complex pattern families such as telecouplings (e.g., cascading patterns), summarization, change detection (e.g., vector-based footprints), etc., have not received much attention in parallel computing environments and can be a potential direction for future research.
Big data tools that can leverage the resources of modern architectures for parallel processing also offer promising research opportunities. Current big data platforms such as HadoopGIS, Spatial Hadoop etc. provide distributed frameworks for parallel processing and some recent efforts towards processing spatiotemporal data such as trajectory data from open-source communities (Shang et al., 2018; Ding et al., 2018) have a great potential to be extended toward finding non-trivial pattern families described in this chapter.
Besides parallel computing, other research directions might be interesting in spatiotemporal data mining. For instance, a space-time prism has been proposed (Miller, 1991) for finding regions of uncertainty within trajectory gaps given the maximum speed of the object. Further exploration of the space-time prism (Kuijpers et al., 2017) considers multi-attributes such as acceleration and cases such as a sudden change in direction, providing more realistic path scenarios(Sharma et al., 2020; Sharma and Shekhar, 2022).
Acknowledgements.
We would like to thank Kim Koffolt and the members of the University of Minnesota Spatial Computing Research Group for their comments.References
- (1)
- saf (2020) 2020. safegraph. https://www.safegraph.com/.
- USC (2020) 2020. US Census. https://www.safegraph.com/.
- Abubaker et al. (2018) Nabil Abubaker, Kadir Akbudak, and Cevdet Aykanat. 2018. Spatiotemporal graph and hypergraph partitioning models for sparse matrix-vector multiplication on many-core architectures. IEEE Transactions on Parallel and Distributed Systems 30, 2 (2018), 445–458.
- Aggarwal (2017) Charu C Aggarwal. 2017. An introduction to outlier analysis. In Outlier analysis. Springer, 1–34.
- Atluri et al. (2018) Gowtham Atluri, Anuj Karpatne, and Vipin Kumar. 2018. Spatio-temporal data mining: A survey of problems and methods. ACM Computing Surveys (CSUR) 51, 4 (2018), 1–41.
- Banerjee et al. (2003) Sudipto Banerjee, Bradley P Carlin, and Alan E Gelfand. 2003. Hierarchical modeling and analysis for spatial data. Chapman and Hall/CRC.
- Bao et al. (2016) Jie Bao, Ruiyuan Li, Xiuwen Yi, and Yu Zheng. 2016. Managing massive trajectories on the cloud. In Proceedings of the 24th ACM SIGSPATIAL International Conference on Advances in Geographic Information Systems. 1–10.
- Barua and Alhajj (2007) Sajib Barua and Reda Alhajj. 2007. Parallel wavelet transform for spatio-temporal outlier detection in large meteorological data. In International Conference on Intelligent Data Engineering and Automated Learning. Springer, 684–694.
- Bhattacharjee et al. (2016) Shrutilipi Bhattacharjee, Monidipa Das, Soumya K Ghosh, and Shashi Shekhar. 2016. Prediction of meteorological parameters: an a-posteriori probabilistic semantic kriging approach. In Proceedings of the 24th ACM SIGSPATIAL International Conference on Advances in Geographic Information Systems. 1–10.
- Celik et al. (2006) Mete Celik, Shashi Shekhar, James P Rogers, James A Shine, and Jin Soung Yoo. 2006. Mixed-drove spatio-temporal co-occurence pattern mining: A summary of results. In Sixth International Conference on Data Mining (ICDM’06). IEEE, 119–128.
- Chang et al. (2021) Serina Chang, Emma Pierson, Pang Wei Koh, Jaline Gerardin, Beth Redbird, David Grusky, and Jure Leskovec. 2021. Mobility network models of COVID-19 explain inequities and inform reopening. Nature 589, 7840 (2021), 82–87.
- Chen et al. (2018) Cen Chen, Kenli Li, Sin G Teo, Guizi Chen, Xiaofeng Zou, Xulei Yang, Ramaseshan C Vijay, Jiashi Feng, and Zeng Zeng. 2018. Exploiting spatio-temporal correlations with multiple 3d convolutional neural networks for citywide vehicle flow prediction. In 2018 IEEE international conference on data mining (ICDM). IEEE, 893–898.
- Cheng et al. (2014) Tao Cheng, James Haworth, Berk Anbaroglu, Garavig Tanaksaranond, and Jiaqiu Wang. 2014. Spatiotemporal data mining. Handbook of regional science (2014), 1173–1193.
- Cordova and Moh (2015) Irving Cordova and Teng-Sheng Moh. 2015. DBSCAN on resilient distributed datasets. In 2015 International Conference on High Performance Computing & Simulation (HPCS). IEEE, 531–540.
- Cressie and Wikle (2015) Noel Cressie and Christopher K Wikle. 2015. Statistics for spatio-temporal data. John Wiley & Sons.
- Ding et al. (2018) Xin Ding, Lu Chen, Yunjun Gao, Christian S Jensen, and Hujun Bao. 2018. UlTraMan: A unified platform for big trajectory data management and analytics. Proceedings of the VLDB Endowment 11, 7 (2018), 787–799.
- Eftelioglu et al. (2014) Emre Eftelioglu, Shashi Shekhar, Dev Oliver, Xun Zhou, Michael R Evans, Yiqun Xie, James M Kang, Renee Laubscher, and Christopher Farah. 2014. Ring-shaped hotspot detection: A summary of results. In 2014 IEEE International Conference on Data Mining. IEEE, 815–820.
- Eldawy and Mokbel (2015) Ahmed Eldawy and Mohamed F Mokbel. 2015. Spatialhadoop: A mapreduce framework for spatial data. In 2015 IEEE 31st international conference on Data Engineering. IEEE, 1352–1363.
- Eslami and Saeed (2018) Taban Eslami and Fahad Saeed. 2018. Fast-GPU-PCC: a GPU-based technique to compute pairwise Pearson’s correlation coefficients for time series data—fMRI study. High-throughput 7, 2 (2018), 11.
- Ester et al. (1997) Martin Ester, Hans-Peter Kriegel, and Jörg Sander. 1997. Spatial data mining: A database approach. In International symposium on spatial databases. Springer, 47–66.
- Fu et al. (2019) Kaiqun Fu, Taoran Ji, Liang Zhao, and Chang-Tien Lu. 2019. Titan: A spatiotemporal feature learning framework for traffic incident duration prediction. In Proceedings of the 27th ACM SIGSPATIAL International Conference on Advances in Geographic Information Systems. 329–338.
- Hagedorn et al. (2017) Stefan Hagedorn, Philipp Gotze, and Kai-Uwe Sattler. 2017. The STARK framework for spatio-temporal data analytics on spark. Datenbanksysteme für Business, Technologie und Web (BTW 2017) (2017).
- He et al. (2011) Yaobin He, Haoyu Tan, Wuman Luo, Huajian Mao, Di Ma, Shengzhong Feng, and Jianping Fan. 2011. Mr-dbscan: an efficient parallel density-based clustering algorithm using mapreduce. In 2011 IEEE 17th international conference on parallel and distributed systems. IEEE, 473–480.
- Hong and Vatsavai (2016) Seokyong Hong and Ranga Raju Vatsavai. 2016. A Scalable Probabilistic Change Detection Algorithm for Very High Resolution (VHR) Satellite Imagery. In 2016 IEEE International Congress on Big Data (BigData Congress). IEEE, 275–282.
- Huang et al. (2008) Yan Huang, Liqin Zhang, and Pusheng Zhang. 2008. A framework for mining sequential patterns from spatio-temporal event data sets. IEEE Transactions on Knowledge and data engineering 20, 4 (2008), 433–448.
- Hughes et al. (2015) James N Hughes, Andrew Annex, Christopher N Eichelberger, Anthony Fox, Andrew Hulbert, and Michael Ronquest. 2015. Geomesa: a distributed architecture for spatio-temporal fusion. In Geospatial informatics, fusion, and motion video analytics V, Vol. 9473. SPIE, 128–140.
- Jiang et al. (2017) Wei Jiang, Jie Zhu, Jiajie Xu, Zhixu Li, Pengpeng Zhao, and Lei Zhao. 2017. A feature based method for trajectory dataset segmentation and profiling. World Wide Web 20, 1 (2017), 5–22.
- Karypis et al. (1999) George Karypis, Eui-Hong Han, and Vipin Kumar. 1999. Chameleon: Hierarchical clustering using dynamic modeling. Computer 32, 8 (1999), 68–75.
- Kawale et al. (2012) Jaya Kawale, Snigdhansu Chatterjee, Dominick Ormsby, Karsten Steinhaeuser, Stefan Liess, and Vipin Kumar. 2012. Testing the significance of spatio-temporal teleconnection patterns. In Proceedings of the 18th ACM SIGKDD international conference on Knowledge discovery and data mining. 642–650.
- Kendall et al. (2011) Wesley Kendall, Jingyuan Wang, Melissa Allen, Tom Peterka, Jian Huang, and David Erickson. 2011. Simplified parallel domain traversal. In Proceedings of 2011 International Conference for High Performance Computing, Networking, Storage and Analysis. 1–11.
- Kim et al. (2018) Seongchan Kim, Ji-Sun Kang, Minho Lee, and Sa-kwang Song. 2018. DeepTC: ConvLSTM network for trajectory prediction of tropical cyclone using spatiotemporal atmospheric simulation data. (2018).
- Koperski et al. (1996) Krzysztof Koperski, Junas Adhikary, and Jiawei Han. 1996. Spatial data mining: progress and challenges survey paper. In Proc. ACM SIGMOD Workshop on Research Issues on Data Mining and Knowledge Discovery, Montreal, Canada. Citeseer, 1–10.
- Kuijpers et al. (2017) Bart Kuijpers, Harvey J Miller, and Walied Othman. 2017. Kinetic prisms: incorporating acceleration limits into space–time prisms. International Journal of Geographical Information Science 31, 11 (2017), 2164–2194.
- Kulldorff (1997) Martin Kulldorff. 1997. A spatial scan statistic. Communications in Statistics-Theory and methods 26, 6 (1997), 1481–1496.
- Lam (2016) Hoang Thanh Lam. 2016. A concise summary of spatial anomalies and its application in efficient real-time driving behaviour monitoring. In Proceedings of the 24th ACM SIGSPATIAL International Conference on Advances in Geographic Information Systems. 1–9.
- Lee et al. (2008) Jae-Gil Lee, Jiawei Han, and Xiaolei Li. 2008. Trajectory outlier detection: A partition-and-detect framework. In 2008 IEEE 24th International Conference on Data Engineering. IEEE, 140–149.
- Lee et al. (2007) Jae-Gil Lee, Jiawei Han, and Kyu-Young Whang. 2007. Trajectory clustering: a partition-and-group framework. In Proceedings of the 2007 ACM SIGMOD international conference on Management of data. 593–604.
- Li et al. (2020) Yan Li, Yiqun Xie, Pengyue Wang, Shashi Shekhar, and William Northrop. 2020. Significant lagrangian linear hotspot discovery. In Proceedings of the 13th ACM SIGSPATIAL International Workshop on Computational Transportation Science. 1–10.
- Liang et al. (2017) Yuxuan Liang, Zhongyuan Jiang, and Yu Zheng. 2017. Inferring traffic cascading patterns. In Proceedings of the 25th acm sigspatial international conference on advances in geographic information systems. 1–10.
- Liang and Wu (2015) Yen-hui Liang and Shiow-yang Wu. 2015. Sequence-growth: A scalable and effective frequent itemset mining algorithm for big data based on MapReduce framework. In 2015 IEEE International Congress on Big Data. IEEE, 393–400.
- Lu et al. (2017) Liping Lu, Hao Cheng, Shengwu Xiong, Pengfei Duan, and Yuan Xiao. 2017. Distributed anomaly detection algorithm for spatio-temporal trajectories of vehicles. In 2017 IEEE International Symposium on Parallel and Distributed Processing with Applications and 2017 IEEE International Conference on Ubiquitous Computing and Communications (ISPA/IUCC). IEEE, 590–598.
- Lukasczyk et al. (2015) Jonas Lukasczyk, Ross Maciejewski, Christoph Garth, and Hans Hagen. 2015. Understanding hotspots: A topological visual analytics approach. In Proceedings of the 23rd SIGSPATIAL international conference on advances in geographic information systems. 1–10.
- Mehta et al. (2016) Paras Mehta, Christian Windolf, and Agnès Voisard. 2016. Spatio-temporal hotspot computation on apache spark (gis cup). In 24th ACM SIGSPATIAL International Conference on Advances in Geographic Information Systems.
- Miller (1991) Harvey J Miller. 1991. Modelling accessibility using space-time prism concepts within geographical information systems. International Journal of Geographical Information System 5, 3 (1991), 287–301.
- Mohan et al. (2010) Pradeep Mohan, Shashi Shekhar, James A Shine, and James P Rogers. 2010. Cascading spatio-temporal pattern discovery: A summary of results. In Proceedings of the 2010 SIAM International Conference on Data Mining. SIAM, 327–338.
- Moosavi et al. (2019) Sobhan Moosavi, Mohammad Hossein Samavatian, Srinivasan Parthasarathy, Radu Teodorescu, and Rajiv Ramnath. 2019. Accident risk prediction based on heterogeneous sparse data: New dataset and insights. In Proceedings of the 27th ACM SIGSPATIAL International Conference on Advances in Geographic Information Systems. 33–42.
- Mou et al. (2018) Lichao Mou, Lorenzo Bruzzone, and Xiao Xiang Zhu. 2018. Learning spectral-spatial-temporal features via a recurrent convolutional neural network for change detection in multispectral imagery. IEEE Transactions on Geoscience and Remote Sensing 57, 2 (2018), 924–935.
- Patel et al. (2013) Pragneshkumar Patel, George Ostrouchov, Wei-Chen Chen, Drew Schmidt, and David Pierce. 2013. A Quick Guide for the pbdNCDF4 package. R Vignette, URL http://cran. r-project. org/package= pbdNCDF4 (2013).
- Pillai et al. (2013) Karthik Ganesan Pillai, Rafal A Angryk, and Berkay Aydin. 2013. A filter-and-refine approach to mine spatiotemporal co-occurrences. In Proceedings of the 21st ACM SIGSPATIAL International Conference on Advances in Geographic Information Systems. 104–113.
- Prasad et al. (2017) Sushil K Prasad, Danial Aghajarian, Michael McDermott, Dhara Shah, Mohamed Mokbel, Satish Puri, Sergio J Rey, Shashi Shekhar, Yiqun Xe, Ranga Raju Vatsavai, et al. 2017. Parallel processing over spatial-temporal datasets from geo, bio, climate and social science communities: A research roadmap. In 2017 IEEE International Congress on Big Data (BigData Congress). IEEE, 232–250.
- Qiao et al. (2008) Shaojie Qiao, Changjie Tang, Shucheng Dai, Mingfang Zhu, Jing Peng, Hongjun Li, and Yungchang Ku. 2008. Partspan: Parallel sequence mining of trajectory patterns. In 2008 Fifth International Conference on Fuzzy Systems and Knowledge Discovery, Vol. 5. IEEE, 363–367.
- Roddick and Spiliopoulou (1999) John F Roddick and Myra Spiliopoulou. 1999. A bibliography of temporal, spatial and spatio-temporal data mining research. ACM SIGKDD Explorations Newsletter 1, 1 (1999), 34–38.
- Romano and Jiang (2017) Benjamin Romano and Zhe Jiang. 2017. Visualizing traffic accident hotspots based on spatial-temporal network kernel density estimation. In Proceedings of the 25th ACM SIGSPATIAL International Conference on Advances in Geographic Information Systems. 1–4.
- Shang et al. (2018) Zeyuan Shang, Guoliang Li, and Zhifeng Bao. 2018. DITA: distributed in-memory trajectory analytics. In Proceedings of the 2018 International Conference on Management of Data. 725–740.
- Sharma et al. (2022) Arun Sharma, Majid Farhadloo, Yan Li, Jayant Gupta, Aditya Kulkarni, and Shashi Shekhar. 2022. Understanding COVID-19 Effects on Mobility: A Community-Engaged Approach. AGILE: GIScience Series 3 (2022), 1–15.
- Sharma et al. (2021) Arun Sharma, Yan Li, and Shashi Shekhar. May 21, 2021. SafeGraph Data Analysis to Assess COVID-19 Effects on MN Mobility. Impacts of the COVID-19 Pandemic on Minnesota’s Traffic and Transit Networks, Center for Transportation Studies, University of Minnesota (May 21, 2021). http://www.spatial.cs.umn.edu/Project/covid_19/Appendix_Weekly_Mobility_Patterns_05212021.pdf
- Sharma and Shekhar (2022) Arun Sharma and Shashi Shekhar. 2022. Analyzing Trajectory Gaps to Find Possible Rendezvous Region. ACM Transactions on Intelligent Systems and Technology (TIST) 13, 3 (2022), 1–23.
- Sharma et al. (2020) Arun Sharma, Xun Tang, Jayant Gupta, Majid Farhadloo, and Shashi Shekhar. 2020. Analyzing trajectory gaps for possible rendezvous: A summary of results. In 11th International Conference on Geographic Information Science (GIScience 2021)-Part I. Schloss Dagstuhl-Leibniz-Zentrum für Informatik.
- Sharma et al. (2018) Arun Sharma, Syed Mohammed Arshad Zaidi, Varun Chandola, Melissa R Allen, and Budhendra L Bhaduri. 2018. WebGIobe-A cloud-based geospatial analysis framework for interacting with climate data. In Proceedings of the 7th ACM SIGSPATIAL International Workshop on Analytics for Big Geospatial Data. 42–46.
- Shekhar (2007) Shashi Shekhar. 2007. Spatial databases. Pearson Education India.
- Shekhar et al. (2011) Shashi Shekhar, Michael R Evans, James M Kang, and Pradeep Mohan. 2011. Identifying patterns in spatial information: A survey of methods. Wiley Interdisciplinary Reviews: Data Mining and Knowledge Discovery 1, 3 (2011), 193–214.
- Shekhar et al. (2015) Shashi Shekhar, Zhe Jiang, Reem Y Ali, Emre Eftelioglu, Xun Tang, Venkata Gunturi, and Xun Zhou. 2015. Spatiotemporal data mining: A computational perspective. ISPRS International Journal of Geo-Information 4, 4 (2015), 2306–2338.
- Shekhar et al. (2003) Shashi Shekhar, Pusheng Zhang, Yan Huang, and Ranga Raju Vatsavai. 2003. Trends in spatial data mining. Data mining: Next generation challenges and future directions (2003), 357–380.
- Shin et al. (2017) Sungbok Shin, Minsuk Choi, Jinho Choi, Scott Langevin, Christopher Bethune, Philippe Horne, Nathan Kronenfeld, Ramakrishnan Kannan, Barry Drake, Haesun Park, et al. 2017. Stexnmf: Spatio-temporally exclusive topic discovery for anomalous event detection. In 2017 IEEE International conference on data mining (ICDM). IEEE, 435–444.
- Song and Lee (2018) Hwanjun Song and Jae-Gil Lee. 2018. RP-DBSCAN: A superfast parallel DBSCAN algorithm based on random partitioning. In Proceedings of the 2018 International Conference on Management of Data. 1173–1187.
- Song et al. (2017) Hwanjun Song, Jae-Gil Lee, and Wook-Shin Han. 2017. PAMAE: parallel k-medoids clustering with high accuracy and efficiency. In Proceedings of the 23rd ACM SIGKDD International Conference on Knowledge Discovery and Data Mining. 1087–1096.
- Tang et al. (2017) Xun Tang, Emre Eftelioglu, Dev Oliver, and Shashi Shekhar. 2017. Significant linear hotspot discovery. IEEE Transactions on Big Data 3, 2 (2017), 140–153.
- von Looz et al. (2018) Moritz von Looz, Charilaos Tzovas, and Henning Meyerhenke. 2018. Balanced k-means for parallel geometric partitioning. In Proceedings of the 47th International Conference on Parallel Processing. 1–10.
- Welton et al. (2013) Benjamin Welton, Evan Samanas, and Barton P Miller. 2013. Mr. scan: Extreme scale density-based clustering using a tree-based network of gpgpu nodes. In SC’13: Proceedings of the International Conference on High Performance Computing, Networking, Storage and Analysis. IEEE, 1–11.
- Xie and Shekhar (2019a) Yiqun Xie and Shashi Shekhar. 2019a. A nondeterministic normalization based scan statistic (NN-scan) towards robust hotspot detection: A summary of results. In Proceedings of the 2019 SIAM International Conference on Data Mining. SIAM, 82–90.
- Xie and Shekhar (2019b) Yiqun Xie and Shashi Shekhar. 2019b. Significant DBSCAN towards statistically robust clustering. In Proceedings of the 16th International Symposium on Spatial and Temporal Databases. 31–40.
- Yu et al. (2015a) Chung-Hsien Yu, Dong Luo, Wei Ding, Joseph Cohen, David Small, and Shafiqul Islam. 2015a. Spatio-temporal asynchronous co-occurrence pattern for big climate data towards long-lead flood prediction. In 2015 IEEE International Conference on Big Data (Big Data). IEEE, 865–870.
- Yu et al. (2017) Haiyang Yu, Zhihai Wu, Shuqin Wang, Yunpeng Wang, and Xiaolei Ma. 2017. Spatiotemporal recurrent convolutional networks for traffic prediction in transportation networks. Sensors 17, 7 (2017), 1501.
- Yu et al. (2015b) Jia Yu, Jinxuan Wu, and Mohamed Sarwat. 2015b. Geospark: A cluster computing framework for processing large-scale spatial data. In Proceedings of the 23rd SIGSPATIAL international conference on advances in geographic information systems. 1–4.
- Zaharia et al. (2012) Matei Zaharia, Mosharaf Chowdhury, Tathagata Das, Ankur Dave, Justin Ma, Murphy McCauly, Michael J Franklin, Scott Shenker, and Ion Stoica. 2012. Resilient distributed datasets: A Fault-Tolerant abstraction for In-Memory cluster computing. In 9th USENIX Symposium on Networked Systems Design and Implementation (NSDI 12). 15–28.
- Zhang et al. (2003) Pusheng Zhang, Yan Huang, Shashi Shekhar, and Vipin Kumar. 2003. Correlation analysis of spatial time series datasets: A filter-and-refine approach. In Pacific-Asia Conference on Knowledge Discovery and Data Mining. Springer, 532–544.
- Zhang et al. (1996) Tian Zhang, Raghu Ramakrishnan, and Miron Livny. 1996. BIRCH: an efficient data clustering method for very large databases. ACM sigmod record 25, 2 (1996), 103–114.
- Zhang et al. (2018) Yueheng Zhang, Xinqi Zheng, Zhenhua Wang, Gang Ai, and Qing Huang. 2018. Implementation of a parallel GPU-based space-time kriging framework. ISPRS International Journal of Geo-Information 7, 5 (2018), 193.
- Zheng et al. (2011) Kai Zheng, Goce Trajcevski, Xiaofang Zhou, and Peter Scheuermann. 2011. Probabilistic range queries for uncertain trajectories on road networks. In Proceedings of the 14th International Conference on Extending Database Technology. 283–294.
- Zheng (2015) Yu Zheng. 2015. Trajectory data mining: an overview. ACM Transactions on Intelligent Systems and Technology (TIST) 6, 3 (2015), 1–41.
- Zhou et al. (2014) Xun Zhou, Shashi Shekhar, and Reem Y Ali. 2014. Spatiotemporal change footprint pattern discovery: an inter-disciplinary survey. Wiley Interdisciplinary Reviews: Data Mining and Knowledge Discovery 4, 1 (2014), 1–23.