Spatial distribution of NH2D in massive star-forming regions
Abstract
To understand the relation between NH2D and its physical environment, we mapped ortho-NH2D at 85.9 GHz toward 24 Galactic late-stage massive star-forming regions with Institut de Radioastronomie Millimtrique (IRAM) 30-m telescope. Ortho-NH2D was detected in 18 of 24 sources. Comparing with the distribution of H13CN 1-0 as a dense gas tracer and radio recombination line H42, ortho-NH2D present complex and diverse spatial distribution in these targets. 11 of the 18 targets, present a different distribution between ortho-NH2D and H13CN 1-0, while no significant difference between these two lines can be found in other 7 sources, mainly due to limited spatial resolution and sensitivity. Moreover, with H42 tracing massive young stellar objects, ortho-NH2D seems to show a relatively weak emission near the massive young stellar objects.
keywords:
ISM: abundances—ISM: molecules—Stars: formation—Stars: massive1 Introduction
Deuterium chemistry is an active process in molecular clouds (Caselli et al., 2008). The deuterated molecules, such as DCN, DCO+, N2D+ and NH2D, can be formed at different evolution stages of star-forming (Caselli et al., 2008). Due to the relatively low zero-point energy, these deuterated molecules are generated more easily in molecular clouds (Herbst, 1982). Therefore, the deuterium fractionation (), as the ratio between deuterated and normal molecule, is often higher than the D/H ratio of (Linsky et al., 1995; Oliveira et al., 2003).
Deuterated ammonia (NH2D, NHD2 and ND3) can form in different ways: 1) The deuterated ions (D) take the place of hydrogen (H) in the ammonia in the gas phase (Rodgers & Charnley, 2001; Caselli et al., 2008; Caselli & Ceccarelli, 2012; Ceccarelli et al., 2014). 2) The reaction between deuterated ions and NH3. For cold regions (T<30K), H2D+ react with NH3, while in warm regions (T=30-80 K), the CH2D+ and C2HD+ react with NH3 to generate deuterated ammonia (Roberts & Millar, 2000a, b; Caselli & Ceccarelli, 2012; Ceccarelli et al., 2014). 3) The reactions with H, D and N atoms are also an effective approach (Brown & Millar, 1989; Fedoseev, Ioppolo, & Linnartz, 2015). 4) The chemical reaction of deuteration could happen on the surface of dust grains if the reactions of the gas phase are unavailable (Turner, 1990; Cazaux et al., 2003; Caselli et al., 2008). 5) In addition, shocks may be associated with the enhancement of deuterated species (Lis et al., 2002).
As a single deuterated form molecule, NH2D was detected extensively in the molecular cloud. (NH3) was observed to be in the cold environment (e.g. Hatchell, 2003; Crapsi et al., 2007; Harju et al., 2017) and in the warm environment (e.g. Busquet et al., 2010; Pillai et al., 2011; Gong et al., 2015). Besides, with the model calculations, deuterium fractionation is sensitive to its environment changes, such as temperature and density (Roberts & Millar, 2000a, b).
According to the high-resolution radio observation in late-stage massive star-forming regions, a series of the researches have reported the relation between NH2D and its physical environment. With the IRAM Plateau de Bure Interferometer (PdBI), Busquet et al. (2010) observed the ortho-NH2D at 85.9263 GHz in the ultracompact HII region (UCHII region) IRAS 20293+3952, through which they reported that the (NH3) in young stellar objects (YSOs) was lower than in pre-protostellar cores, and the (NH3) could be related to the evolutionary stage in the pre-protostellar phase. With AtacamaLarge Millimeter/Submillimeter Array (ALMA) observation of Orion KL Hot Core and Compact Ridge for NH2D at 239.848 GHz, Neill et al. (2013) found that the deuterium fractionation in Orion KL Hot Core was lower than that in Compact Ridge, suggesting that the hot core originated in a slightly warmer environment result in low deuterium fractionation. Mills et al. (2018) reported that the (NH3) of Sgr B2(N2) is times higher than that of Sgr B2(N1) with VLA observations of the NH2D transitions at 25.0 GHz and ATCA observations of the NH2D transitions at 49.9 GHz and the NH2D transitions at 43.0 GHz, so that they attributed the abundance variations to the shock and fast warmup in Sgr B2(N2). However, the researches mentioned above are only based on one or two sources (Busquet et al., 2010; Neill et al., 2013; Mills et al., 2018). Consequently, a relatively large sample of massive star-forming regions is needed to understand the relation between NH2D and its physical environment.
NH2D at 110.1535 GHz with single point observations using Institut de Radioastronomie Millimtrique (IRAM) 30-m telescope toward 50 late-stage massive star-forming regions was reported with 72% detection rate (Li et al., 2022). With stronger emission (e.g. Shah & Wootten, 2001; Wienen et al., 2021), ortho-NH2D at 85.9263 GHz is more suitable than para-NH2D at 110.1535 GHz to derive NH2D spatial distribution. Therefore, we mapped the ortho-NH2D at 85.9263 GHz in late-stage high mass star-forming regions with IRAM 30-m to obtain spatial distribution information of NH2D.
With IRAM 30-m telescope observation, this work presents the results of ortho-NH2D at 85.9263 GHz mapping toward a relatively large sample of 18 Galactic late-stage massive star-forming regions with known 6.7 GHz CH3OH masers. The observations are described in Section 2, the main results are reported in Section 3, a discussion is presented in Section 4, and a brief summary is given in Section 5.
2 Observations
The 24 targets, selected from Reid et al. (2014), are late-stage massive star-forming regions with 6.7 GHz CH3OH masers with HC3N 12-11 higher than 1 K () which is based on IRAM 30-m observations. The observations were performed with the Institut de Radioastronomie Millimtrique (IRAM) 30-m telescope at Pico Veleta, Spain during 2019 July, 2019 October, 2019 November, 2020 December and 2021 January. The on-the-fly (OTF) mode was used in our observations with the frequency coverage about 8 GHz bandwidth. The system temperatures were 80-150 K during our observation. We used the E090 receiver to cover 84 GHz to 92 GHz and the Fourier Transform Spectrometers (FTS) backend with a 195 kHz channel spacing, which corresponds to 0.68 km s-1 at 86 GHz. The map centers and map area are listed in table LABEL:source.
The antenna temperature () is converted to the main beam brightness temperature (), using = , the forward efficiency is 0.95 and the beam efficiency is 0.81. The used lines consist of ortho-NH2D at 85.9263 GHz, H13CN 1-0 at 86.3387 GHz and H42 at 85.6884 GHz. Data reduction was conducted with GILDAS software111http://www.iram.fr/IRAMFR/GILDAS. The angular resolution of the IRAM 30-m telescope is about 29.3 arcsec at 84 GHz and about 26.7 arcsec at 92 GHz, while all sources were re-gridded to steps of 9 arcsecs, about 1/3 beam size. First-order baseline was used for all spectra. The typical rms are around 50 mK at 0.7 km s-1 velocity resolution. In the following analysis, we assume that the beam-filling factor is unity.
3 Results
The ortho-NH2D at 85.9263 GHz was detected among 18 targets of our sample, while it was not detected in the rest six targets: G009.62+00.19, G011.49-014.8, G012.80-00.20, G043.16+00.01, G133.94+01.06 and G192.60-00.04. For ortho-NH2D detected targets, the H13CN 1-0 was also detected, while H42 was detected only in nine targets.
11 of 18 sources, present a different distribution between ortho-NH2D and H13CN 1-0 with asymmetrically and resolvable distributed spatial structure. Due to limited sensitivity, the structure of ortho-NH2D at 85.9263 GHz was unresolved in G005.88-00.39 and G188.94+00.88 (see Figure 1 and Figure 18). For 4 sources, G011.91-00.61, G023.44-00.18, G034.39+00.22 and G049.48-00.38 (see Figure 2, Figure 4, Figure 6 and Figure 11), no significant difference between these two lines can be found. It is mainly due to the limited spatial resolution. Only one target, G081.75+00.59 (see Figure 13), presents a relatively similar distribution between ortho-NH2D at 85.9263 GHz and H13CN 1-0 and resolvable distributed spatial structure.
The detailed results of the three lines are given in Section 3.1-3.4, the ortho-NH2D , H13CN 1-0 and H42 distribution details of each source are described in Section 3.5.
3.1 NH2D spatial distribution
The velocity integrated intensity of ortho-NH2D at 85.9263 GHz, observed with the IRAM-30m, are presented in Figure 1 - 18 as red contour. The spectra of ortho-NH2D at 85.9263 GHz are also presented in Figure 1 - 18. For overlaying with H13CN 1-0 spectra, there are some of the sources in which several offsets are shown in Figure 1 - 18. These several offsets are used to confirm the signal of ortho-NH2D emission if this target has spatial structures, such as G081.75+00.59 (see Figure 13).
Ortho-NH2D has six hyperfine structures, with relative intensities listed in Table LABEL:NH2D_HfS (Tiné et al., 2000). However, the transitions of F=2-1, F=2-2, F=1-1 and F=1-2 for ortho-NH2D are blended due to line broadening. For example, as shown in Figure 19, only three components can be found in G081.75+00.59 for NH2D spectra. Thus, the fluxes of ortho-NH2D were derived with the velocity integrated intensity of the emitting channels of its six hyperfine structures instead of Gaussian fitting. In the following analysis, we assume all NH2D spectra are optically thin.
Four sources, G011.91-00.61, G023.44-00.18, G034.39+00.22 and G049.48-00.38, are not detected asymmetrically distributed spatial structure of ortho-NH2D (see Figure 2, Figure 4, Figure 6 and Figure 11, respectively). Ortho-NH2D emissions were marginally detected and unresolved in two targets: G005.88-00.39 and G188.94+00.88 (see Figure 1 and Figure 18). In addition, although G015.03-00.67 and G037.43+01.51 (see Figure 3 and Figure 9) can be distinguished the spatial structure, the ortho-NH2D emissions are weak. Other targets can be distinguished the spatial structure and detected relatively strong ortho-NH2D emission.
The strongest velocity integrated intensity and distribution shape of ortho-NH2D for each source are listed in Table LABEL:distribution. The strongest ortho-NH2D emission is 6.950.14 K km/s in G081.75+00.59 and the weakest ortho-NH2D emission is 0.600.16 and 0.600.11 K km/s in G005.88-00.39 and G037.43+01.51, respectively. The median of ortho-NH2D emission is 2.27 K km/s. For the sources whose ortho-NH2D emission is lower than 1 K km/s, are considered as sources with weak NH2D emission. Conversely, we define strong NH2D emissions to be cases surpassing the 1 K km/s threshold. Accordingly, there are 4 sources characterized by weak NH2D emissions and 14 sources are classified into strong NH2D emissions.
With strong NH2D emission detected, 14 sources show complex and diverse distribution, which is different from other molecule transitions, such as the dense gas tracer H13CN 1-0 (details described in the following).
3.2 The ortho-to-para ratio of NH2D
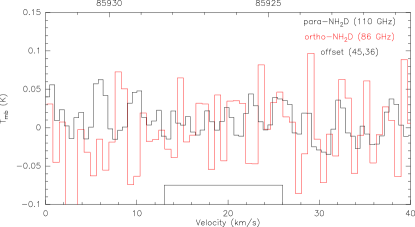
We presented single point observational results of para-NH2D at 110.1535 GHz with IRAM-30m toward 50 late-stage massive star-forming regions (Li et al., 2022), which included all the targets of this work. The NH2D spectra, both of the ortho-NH2D at 85.9263 GHz with OTF mode and para-NH2D at 110.1535 GHz with position-switching mode, are also shown in figure 1 - 18. All coordinates of para-NH2D at 110.1535 GHz are consistent with offset (0′′,0′′) ortho-NH2D at 85.9263 GHz, except G011.91-00.61, G015.03-00.67 and G034.39+00.22. Para-NH2D at 110.1535 GHz transition have offset about (-27′′,-27′′), (45′′,36′′) and (0′′,-45′′), corresponding to ortho-NH2D at 85.9263 GHz in G011.91-00.61 (see Figure 2), G015.03-00.67 (see Figure 3) and G034.39+00.22 (see Figure 6), respectively.
For two hydrogen atoms in NH2D, different nuclear spin angular momentum can produce different states: ortho and para state. The ortho state has the largest nuclear spin statistical weight, and the para state has the largest nuclear spin statistical weight (Harju et al., 2017). Since normal radiative and collisional transitions can not change the spin of H nuclei, the transitions between ortho- and para-NH2D are forbidden (Ho & Townes, 1983). Therefore, obtaining ortho- and para-NH2D could reflect an accurate abundance of NH2D.
The corresponding nuclear statistical weights are 27 and 9 for ortho-NH2D at 85.9263 GHz and para-NH2D at 110.1535 GHz, respectively (CDMS222https://cdms.astro.uni-koeln.de/classic/predictions/catalog/, Müller et al. (2001, 2005)). Therefore, the ratio of N(ortho-NH2D)/N(para-NH2D) is 3 in LTE and this ratio could indicate the discrepancy between total column density and ortho-NH2D or para-NH2D. The Einstein emission coefficient is 7.821410-6s-1 and 1.650310-5s-1 for ortho-NH2D at 85.9263 GHz and para-NH2D at 110.1535 GHz, respectively (CDMS, Müller et al. (2001, 2005)). In addition, the line ratios of velocity integrated intensities between ortho-NH2D at 85.9263 GHz and para-NH2D at 110.1535 GHz is also related to the excitation temperature. Considering Einstein emission coefficient, the line ratios of velocity integrated intensities between ortho-NH2D at 85.9263 GHz and para-NH2D at 110.1535 GHz is about 2.5 at 10 K and 2.4 at 20 K at LTE.
The line ratios of velocity integrated intensities between ortho-NH2D at 85.9263 GHz and para-NH2D at 110.1535 GHz are listed in Table LABEL:NH2D. The ortho-NH2D at 85.9263 GHz spectra from the mapping results at the same position as that of para-NH2D at 110.1535 GHz are used for this comparison. Upper limits are provided in six sources due to non-detection of ortho-NH2D or para-NH2D lines, in where coordinate is para-NH2D . The highest ratio is 4.731.99 in G035.20-01.73 and the lowest ratio is 0.890.44 in G005.88-00.39, both of them are with strong H42 emissions. In other sources, this ratio ranges from 1.260.07 to 2.950.12. Besides, the median of this ratio is 1.84.
3.3 H13CN 1-0 maps result
HCN lines can be used to trace dense gas ( cm-3) because of high dipole moment and large Einstein A-coefficient (Evans et al., 2006). With the similar dipole moment and Einstein A-coefficient, lines of H13CN, as an isotope molecule of HCN, can be used as a dense gas tracer. So, H13CN lines can be more accurate to trace dense molecular gas, since they are mainly optically thin. Therefore, H13CN 1-0 is used as a dense gas tracer (Gao & Solomon, 2004; Wu et al., 2010; Vasyunina et al., 2011).
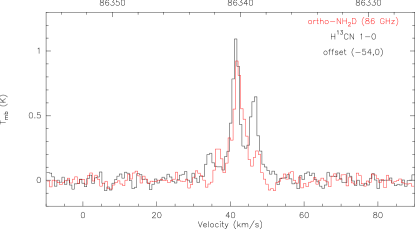
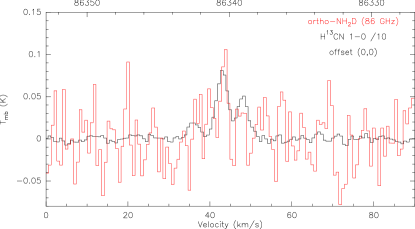
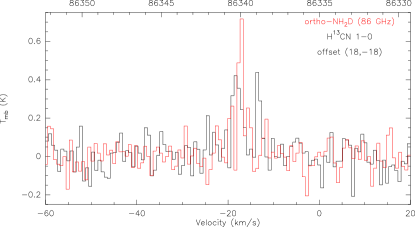
In this work, the H13CN 1-0 emission was detected in all targets. H13CN 1-0 has three hyperfine structures. Similar to ortho-NH2D , the velocity integrated intensity of H13CN 1-0 was derived from its three hyperfine structures with CLASS/GILDAS package. The mapping results and spectra of H13CN 1-0 are shown in Figure 1 - 18 (black contour and gray scale).
Table LABEL:distribution lists whether ortho-NH2D and H13CN 1-0 show similar distribution or not in each source. Ortho-NH2D and H13CN 1-0 are unresolved in two sources (G005.88-00.39 and G188.94+00.88, see Figure 1 and Figure 18), with weak ortho-NH2D emissions in these two sources. Weak NH2D emissions in G015.03-00.67 and G037.43+01.51 (see Figure 3 and Figure 9) were detected different distributions to that of H13CN 1-0. Among other sources with relatively strong ortho-NH2D emission detected, five sources show similar distributions and nine show different distributions between NH2D and H13CN 1-0 maps. G035.20-01.73, G075.76+00.33, G081.87+00.78 and G109.87+02.11 show that the distribution of strong NH2D is dislocation with H13CN (see Figure 8, Figure 12, Figure 14 and Figure 15, respectively). In addition, in the targets of G031.28+00.06, G035.19-00.74, G075.76+00.33, G111.54+00.77 and G121.29+00.65, some regions present a strong NH2D emission, while just weak H13CN 1-0 emission is detected in these regions (see Figure 5, Figure 7, Figure 12, Figure 16 and Figure 17, respectively).
In G011.91-00.61, G023.44-00.18, G034.39+00.22, G049.48-00.38 and G081.75+00.59, ortho-NH2D present a similar distribution with H13CN 1-0 (see Figure 2, Figure 4, Figure 6, Figure 11 and Figure 13, respectively). The strong ortho-NH2D emission was also detected in these five sources. The strongest NH2D spectra was detected in G081.75+00.59 with Tmb(NH2D)d=6.95 0.14 K km s-1. However, the asymmetrically structure of ortho-NH2D at 85.9263 GHz was not detected in G011.91-00.61, G023.44-00.18, G034.39+00.22 and G049.48-00.38. The reason is mainly due to the limited spatial resolution. Only G081.75+00.59 present asymmetrically structure of ortho-NH2D at 85.9263 GHz.
3.4 H42 maps result
The young massive stars, with spectral types of B or O, can produce ultra-violet photons, which can ionize the surrounding interstellar medium and create HII regions. Consequently, the abundantly ionized hydrogens exist in HII regions and can recombine with electrons to produce the radio recombination lines (RRLs). Therefore, the RRLs can be used to trace young massive star-forming and HII regions.
RRL H42 was detected in nine sources (see also in figure 1 - 18, the black contour and gray scale). Without turbulence, the full width at half maxima (FWHM) of RRLs is 19.1 km s-1 at 8000 K (Peters, Longmore, & Dullemond, 2012). Therefore, in the case of a faint RRLs signal observed in G031.28+00.06, the spectral resolution was smoothed to 1.4 kms-1 to confirm whether it is H42 emission or not in the present work. Among these nine targets, a completely different spatial distribution between ortho-NH2D and H42 is presented in five targets, while the spatial distribution of ortho-NH2D and H42 have overlapping regions in the rest four targets.
A strong H42 emission presents in G005.88-00.39 (see Figure 1), while the ortho-NH2D were marginally detected and almost unresolved in the same position. There are two NH2D emission features and a relatively weak H42 structure with associated NH2D emission in G011.91-00.61 (see Figure 2). G049.48-00.36 and G049.48-00.38 are two adjacent sources (see Figure 10 and Figure 11). Both of them, the ortho-NH2D and H42 present different spatial distributions. However, the ortho-NH2D emission peaks at the H42 emission peak in G049.48-00.36. Besides, in G049.48-00.36, the ortho-NH2D is weaker than that in G049.48-00.38.
In G015.03-00.67 (see Figure 3), a widely distributed and strong H42 emission was detected, while the ortho-NH2D is scattered in other positions. In G031.28+00.06 (see Figure 5), the ortho-NH2D is isolated by H42 and the emission of ortho-NH2D is very weak. The H42 are also observed in G035.20-01.73, G075.76+00.33 and G111.54+00.77 (see Figure 8, Figure 12 and Figure 16, respectively). The ortho-NH2D and H42 present a completely different spatial distribution in G035.20-01.73, G075.76+00.33 and G111.54+00.77, but the NH2D emission is far away from the H42 emission.
3.5 Individual target detail
In our observation, most sources show different spatial distributions between ortho-NH2D and H13CN 1-0 emission, or between ortho-NH2D and H42 emission, while a few sources show similar spatial distributions. For example, the ortho-NH2D and H13CN 1-0 emission present similar spatial distribution in G011.91-00.61. The details each source are described in following.
3.5.1 G005.88-00.39
G005.88-00.39 is a bright expanding shell-like UCHII region (Acord, Churchwell, & Wood, 1998). According to near-infrared NACO-VLT observations, Feldt et al. (2003) suggested G005.88-00.39 contains a massive young O5 V star. Furthermore, this target is one of the most powerful outflows in Galaxy (Harvey & Forveille, 1988; Zapata et al., 2020). In the present work, strong (d40 K km s-1) H13CN 1-0 and H42 emission were detected in G005.88-00.39, and their velocity integrated intensity maps(see figure 1). However, ortho-NH2D at 85.9 GHz was only observed at the source center with a weak emission, which is the weakest among our samples. Therefore, the ortho-NH2D may be marginally detected in this source and it was plotted from 2. Moreover, the ortho-NH2D velocity integrated intensity mapping presents less than a beam, so the spatial structure might not be distinguished in G005.88-00.39. Due to the weak ortho-NH2D emission and indistinguishable spatial structure, we can not confirm whether the distribution of ortho-NH2D is similar to other molecules or not.
3.5.2 G011.91-00.61
With the H76 detected, Wood & Churchwell (1989) indicated that an UCHII region exists in G11.94-00.62 (RA.(J2000)=18:14:01.006, DEC.(J2000)=-18:53:24.966), and Ilee et al. (2018) suggested that there was a proto-O star forming in this region. The distribution of ortho-NH2D, H13CN 1-0 and H42 (see figure 2) were obtained in G011.91-00.61. The ortho-NH2D and H13CN 1-0 show two structures and similar distributions. However, only the structure in the northeast (G11.94-00.62) has been detected to have H42 emission. Although the intensity of H13CN 1-0 is similar in these two structures, the ortho-NH2D appears weaker in the northeast structure where H42 is detected.
3.5.3 G015.03-00.67
G015.03-00.67 (M 17) is a molecular cloud complex (Lada, 1976) and it is the closest (1.98 kpc, Xu et al. (2011)) giant HII region to us (Lim, De Buizer, & Radomski, 2020). Hundreds of candidate massive YSOs with spectral types have been found earlier than B9 in G015.03-00.67(Lada, Bally, & Stark, 1991; Povich et al., 2009). We obtained a 4 size map of ortho-NH2D, H13CN 1-0 and H42 toward IRAM 30m observation in G015.03-00.67 (see figure 3). The ortho-NH2D was detected relatively weak emission in G015.03-00.67 (Tmb(NH2D)d=1.1 K km s-1 in the strongest pixel). The ortho-NH2D emission presents a fragmented distribution. A widely distributed H42 distribution was detected in G015.03-00.67, indicating it is a giant HII region. The ortho-NH2D fragments avoid obviously the widely distributed H42 distribution. The widely distributed H13CN 1-0 emission was also detected in this target. One of the ortho-NH2D fragments appears in the strongest H13CN 1-0 structure, others appear with relatively weak H13CN 1-0 emission. The strong H42 emission is at the northeast of G015.03-00.67 where H13CN 1-0 is marginally or even not detected.
3.5.4 G023.44-00.18
The strong 6.7 GHz CH3OH maser has been detected in the massive star-forming region G023.44-00.18 (Walsh et al., 1998). With Submillimeter Array (SMA) observation, Ren et al. (2011) reported that G023.44-00.18 presented two dust cores that were north and south arranged, the south one has active bipolar outflow. In addition, they suggested that these two dust cores were in the pre-UCHII evolutionary stage. By observing the ortho-NH2D at 85.9263 GHz toward PdBI, Zhang et al. (2020) found several NH2D cores in G023.44-00.18 with Dfrac0.1. But these cores are offset by two dust cores which are reported in Ren et al. (2011). However, because of the spatial resolution limitation, both ortho-NH2D and H13CN 1-0 emission can not be distinguished by two cores in our observation, and H42 was not detected (see Figure 4). Nevertheless, in the northwest of G023.44-00.18, the obvious NH2D signal was detected with weak H13CN 1-0 emission.
3.5.5 G031.28+00.06
G031.28+00.06 is located in W43, which is a molecular cloud complex (Nguyen Luong et al., 2011). As is shown in figure 5, ortho-NH2D, H13CN 1-0 and H42 were detected in G031.28+00.06. The ortho-NH2D emission presents two structures in this source, while H13CN 1-0 and H42 (see figure 5) present one structure. Compared with other targets, the ortho-NH2D and H42 emission in G031.28+00.06 are relatively weak. Furthermore, two NH2D structures seem to be isolated by the H42 structure. Besides, the ortho-NH2D and H13CN present a different distribution in this source.
3.5.6 G034.39+00.22
G034.39+00.22 is an UCHII region with 1000 M☉ mass (Miralles, Rodriguez, & Scalise, 1994). With IRAM 30m observation, Rathborne, Jackson, & Simon (2006) reported 1.2 mm continuum maps in G034.39+00.22 which present north to south distribution. They indicated that nine millimeter-dense clumps existed in G034.39+00.22. In the present work, we focus on the brightest region in G034.39+00.22. The distribution of strong ortho-NH2D and H13CN 1-0 emission were detected in G034.39+00.22. These two lines present a north to south distribution (see figure 6). The distribution of ortho-NH2D is similar to H13CN 1-0 in G034.39+00.22. Both ortho-NH2D and H13CN appear two structures and show two peaks in this target. Besides, H42 was not detected in G034.39+00.22.
3.5.7 G035.19-00.74
Dent, Little, & White (1984) reported that G035.19-00.74 was an UCHII region and contained a young B0 star. With James Clerk Maxwell Telescope (JCMT), Berkeley-Illinois-Maryland Association (BIMA) and VLA observation, Gibb et al. (2003) found CO outflow with 45∘ along the northeast-southwest direction in G035.19-00.74. In our work, the distribution of strong ortho-NH2D and H13CN 1-0 emission were detected in G035.19-00.74 while H42 was not detected (see figure 7). The distribution of ortho-NH2D is obviously different from H13CN 1-0. The H13CN 1-0 distribution seems like a core. However, the distribution of ortho-NH2D is oriented northwest to the southeast which is perpendicular to the CO outflow reported in Gibb et al. (2003).
3.5.8 G035.20-01.73
G035.20-01.73 (W 48) contains an UCHII region (Wood & Churchwell, 1989). The east to west evolutionary gradient was found in the HII region (Rygl et al., 2014). We obtained the H13CN 1-0, distributed from east to west with two strong peaks and a weak peak (see figure 8). Pillai et al. (2011) present the distribution of ortho-NH2D at 85.9 GHz oriented west to east in G035.20-01.73 toward PdBI observations. Combined with the 3.5 mm dust emission map, they found the dust emission peak is not the brightest NH2D peak in this target. H42 is observed in G035.20-01.73, which is near from the center peak of H13CN 1-0 distribution (see figure 8). The ortho-NH2D was also observed with strong emission (see figure 8). The ortho-NH2D, away from the H42, is located in the west of G035.20-01.73 and shows a similar distribution to the result in Pillai et al. (2011). Besides, the NH2D peak offsets H13CN 1-0 peak, while the NH2D distribution is similar to the 3.5 mm dust emission in Pillai et al. (2011).
3.5.9 G037.43+01.51
With MPIfR 37-element bolometer array observation, Beuther et al. (2002) detected an extended 1.2 mm continuum core. Several deuterated molecules, HDCO and D2CO (Zahorecz et al., 2021) and DC3N (Rivilla et al., 2020) were detected in G037.43+01.51. In G037.43+01.51, the relatively weak ortho-NH2D and H13CN 1-0 emission were detected, while H42 was not detected (see figure 9). The H13CN 1-0 emission is similar to the 1.2 mm continuum map reported in Beuther et al. (2002). However, the spatial distribution of weak ortho-NH2D emission appears to deviate from that of H13CN 1-0.
3.5.10 G049.48-00.36
G049.48-00.36 (W 51 IRS2) is one of the massive protocluster candidates in giant molecular cloud W51 (Ginsburg et al., 2012). W 51 is a complex structure molecular cloud with several velocity components (Scoville & Solomon, 1973). In the present work, the ortho-NH2D and H13CN 1-0, H42 (see figure 10) maps were obtained in G049.48-00.36. At the map center, the structures of the ortho-NH2D, H13CN 1-0 and H42 distribution are close. Although part of ortho-NH2D emission is detected near one of the H42 structures, most ortho-NH2D emission distributions deviate from the H42 emission. With strong emission, the ortho-NH2D, H13CN 1-0 and H42 were also detected in the southeast where G049.48-00.38 is located.
3.5.11 G049.48-00.38
G049.48-00.38 (W 51 M) is adjacent to G049.48-00.36 and it is also one of the massive protocluster candidates in W 51 (Ginsburg et al., 2012). As figure 11 shows, strong ortho-NH2D and H13CN 1-0, H42 were observed in this work (see figure 10). The ortho-NH2D distribution is similar to H13CN 1-0, while the ortho-NH2D and H13CN 1-0 emission offset H42 peak. With the PdBI observations, Vastel et al. (2017) reported that ortho-NH2D was detected in two marginally resolved sources, while we have detected only one here due to the spatial resolution limitation.
3.5.12 G075.76+00.33
With BIMA interferometer observation, Riffel & Lüdke (2010) mapped HCN 1–0 in G075.76+00.33 (the south one in their observation) and presented northeast to southwest distribution. In the north of G075.76+00.33, the UCHII region 075.78+00.34 was mapped by Wood & Churchwell (1989). This UCHII region was mapped H42 emission toward G075.76+00.33 observation in the present work (see figure 12). An east to west distribution of ortho-NH2D was obtained in G075.76+00.33 (see figure 12). The H13CN 1-0 was also mapped in G075.76+00.33 (see figure 12), and it has a similar distribution to HCN 1-0 emission, which has been observed by Riffel & Lüdke (2010). The ortho-NH2D emission is in the south of G075.76+00.33, away from the H42 emission in G075.76+00.33.
3.5.13 G081.75+00.59
G081.75+00.59 (DR 21) is a giant star-forming complex in Cygnus X molecular cloud complex (Dickel, Dickel, & Wilson, 1978; Kirby, 2009). It had been mapped to a 4 pc length ridge by Herschel observations(Motte et al., 2007; Hennemann et al., 2012) and contains three OH 1665 MHz emissions regions DR 21M, DR 21OH and W 75S (Koley et al., 2021). With IRAM observation, Christensen et al. (2023) reported integrated column density map of NH2D, DCN, DNC and DCO+ toward Cygnus-X. In our previous work, this target has been detected the strongest velocity integrated intensity of para-NH2D at 110.1535 GHz with IRAM-30m and the highest deuterated fraction of NH3 (Dfrac=0.044) (Li et al., 2022). In the present work, we mapped DR 21 (OH) and W 75S in DR 21 and we describe them separately in the following two parts.
W75S-FIR1, W75S-FIR2 and W75S-FIR3 embedded several massive YSOs in W 75S (Harvey et al., 1986; Motte et al., 2007). Near W75S-FIR2 (20h39m02.4 42∘24′59′′), the strongest ortho-NH2D emission was detected in the present work. In W 75S, the distribution of ortho-NH2D is slightly similar to H13CN 1-0 (see figure 13).
DR 21OH contains several high mass protostars (Mangum, Wootten, & Mundy, 1991). It is younger than DR 21M because it was undetected in the radio continuum emission (Davis et al., 2007). In the present work, we only obtained the north part in DR 21OH. The ortho-NH2D and H13CN 1-0 emissions are strong in this region (see figure 13). The H13CN 1-0 presents a strong peak in the southernmost toward our map and ortho-NH2D offset the H13CN peak.
3.5.14 G081.87+00.78
G081.87+00.78 (W 75N) is a massive star-forming region in Cygnus X molecular cloud complex and it is in the north of G081.75+00.59 (Dickel, Dickel, & Wilson, 1978; Persi, Tapia, & Smith, 2006). This source contains a large-scale high-velocity molecular outflow (Shepherd, Testi, & Stark, 2003) and a B-type YSO (Shepherd, Kurtz, & Testi, 2004). In the present work, the ortho-NH2D and H13CN 1-0 emission were obtained in G081.87+00.78, while H42 was not detected (see figure 14). In G081.87+00.78, the ortho-NH2D is oriented northwest-southeast and deviates the H13CN 1-0 peak.
3.5.15 G109.87+02.11
G109.87+02.11 (Cep A) is an active massive star-forming region, and it has been detected in several YSOs (Hughes & Wouterloot, 1984). The brightest radio source in G109.87+02.11 is HW2 (where locates at (0,0) in our maps), associated with an early-B spectral type zero-age main-sequence (ZAMS) star (Hughes & Wouterloot, 1984). With IRAM 30-m observations, Li et al. (2017) observed strong ortho-NH2D emission in the northeast of G109.87+02.11. As is shown in figure 15, the H13CN 1-0 and strong ortho-NH2D emission were detected in G109.87+02.11. The distribution of ortho-NH2D is presented in the northeast of G109.87+02.11, and it is similar to the result of Li et al. (2017). However, the ortho-NH2D is dislocation with the strongest H13CN 1-0 emission. The strongest H13CN 1-0 emission is situated in proximity to HW2, and the ortho-NH2D emissions appearing to be isolated by HW2. Besides, in this target, the strong ortho-NH2D was detected in the northeast of G109.87+02.11 and H13CN was detected relatively weakly.
3.5.16 G111.54+00.77
G111.54+00.77 (NGC 7538) is a massive star-forming region which locates in a giant molecular cloud complex (Ungerechts, Umbanhowar, & Thaddeus, 2000). With Herschel observation, Fallscheer et al. (2013) reported that G111.54+00.77 has several high-mass dense clumps candidates which may produce several intermediate- to high-mass stars in the future. A young O star with 25 M☉ embedded in NGC 7538 IRS 1 has been observed with a widely distributed molecular outflow (Qiu, Zhang, & Menten, 2011). In G111.54+00.77, the widely distributed ortho-NH2D and H13CN 1-0 distribution were detected (see figure 16), and H42 emission was detected in the north where is NGC 7538 IRS 1. A small part of ortho-NH2D emission is near to the H42 emission while a large part appears in the south of G111.54+00.77. In the west of G111.54+00.77, the ortho-NH2D emission is strong while H13CN 1-0 emission is weak.
3.5.17 G121.29+00.65
Toward SMA observations, Juárez et al. (2019) reported that G121.29+00.65 (L 1287) have a high fragmentation level and a bipolar outflow is oriented northeast to southwest direction. G121.29+00.65 have been detected 6.7 GHz CH3OH, implying that there is forming a massive star(Rygl et al., 2010). In G121.29+00.65, the distribution of H13CN 1-0 was obtained (see figure 17), similar to the distribution of HCN 1-0 which is reported by Yang et al. (1991). The distribution of ortho-NH2D is perpendicular to H13CN 1-0 and the widely distributed ortho-NH2D is oriented northwest to the southeast. The distribution of ortho-NH2D is also perpendicular to the outflow reported in Juárez et al. (2019).
3.5.18 G188.94+00.88
It was reported that G188.94+00.88 (S 252) includes two massive protostars and is near to the Sh 2-247 which is a complex of HII region and OB stars (Minier et al., 2005). Several very weak ortho-NH2D fragments were detected in G188.94+00.88 (see figure 18). These ortho-NH2D emissions are marginally detected in this target. Similar to G005.88-00.39, the spatial structure might also not be distinguished in G188.94+00.88 due to the beam size. The main ortho-NH2D emission region is presented in the south of H13CN 1-0 distribution. In G188.94+00.88, H42 was not detected.
4 Discussion
4.1 Spatial distribution of ortho-NH2D and the dense molecular gas
As shown in figure 1-18 and Section 3.5, most of the targets manifest that the NH2D emission deviates the H13CN 1-0 in the present work, such as G109.87+00.78 (see Figure 15). Moreover, five sources, G031.28+00.06, G035.19-00.74, G081.87+00.78, G109.87+02.11 and G121.29+00.65 (see Figure 5, Figure 7, Figure 14, Figure 15 and Figure 17, respectively), present that the strong NH2D emissions appear in some regions where the H13CN 1-0 emission is weak or even is marginally detected.
In four sources, G011.91-00.61, G023.44-00.18, G034.39+00.22 and G049.48-00.38, the distribution of strong ortho-NH2D emission is similar to H13CN 1-0 (see Figure 2, Figure 4, Figure 6 and Figure 11, respectively). However, the ortho-NH2D is not detected asymmetrically distributed spatial structure in G011.91-00.61, G023.44-00.18, G034.39+00.22 and G049.48-00.38. Their substructure is unresolved. Therefore, we can not confirm whether NH2D emission and H13CN 1-0 have similar distributions in these sources or not.
Without asymmetrically distributed spatial structures detected and unresolved sources, only G081.75+00.59 presents a relatively similar distribution between NH2D and H13CN 1-0. There may exist contingencies in this distribution.
As described in Section 3.3, H13CN 1-0 is used as a dense gas tracer (Gao & Solomon, 2004; Wu et al., 2010; Vasyunina et al., 2011) in the present work to analyze the distribution of NH2D and dense gas in massive star-forming late stage.
Crapsi et al. (2007) performed observations of para-NH2D at 110.1535 GHz toward low-mass starless core L 1544 with PdBI and they found that NH2D intensity peaks were at 1.2 mm continuum dust peak. Therefore, they suggested that NH2D is a good tracer of the high density gas in the low-mass starless core. However, toward the gas-phase model, Roberts & Millar (2000b) simulated that gas density seems to have no effect on Dfrac(NH3).
In present work, NH2D seems to be enhanced in G031.28+00.06, G035.19-00.74, G081.87+00.78, G109.87+02.11 and G121.29+00.65, at relatively low gas density part (see Figure 5, Figure 7, Figure 14, Figure 15 and Figure 17, respectively). Therefore, such results indicate that the gas density may not be an important physical parameter to influence the abundance of NH2D, which is opposite to that of Crapsi et al. (2007) and agrees with the gas-phase model of Roberts & Millar (2000b). Compared with other physical parameters (such as temperature), the gas density might not be the important physical parameter to affect the abundance of NH2D in the late-stage massive star-forming regions. But without any information of NH3, we can not confirm that the Dfrac(NH3) is affected by dense gas. More detail should be obtained with the information of NH3.
4.2 Spatial distribution of ortho-NH2D and massive star formation
To analyze whether NH2D is affected by the formed massive young stellar objects or not, we compare the distribution between ortho-NH2D and H42. In the present work, ortho-NH2D and HII regions present a different distribution in most targets. Both ortho-NH2D and H42 emissions were detected in nine targets. In five sources, G015.03-00.67, G031.28+00.06, G035.20-01.73, G075.76+00.33 and G111.54+00.77, the NH2D emission are away from HII regions (see Figure 3, Figure 5, Figure 8, Figure 12 and Figure 16, respectively). In these five HII regions, the NH2D may be depleted during the massive stars forming.
For G049.48-00.36 and G049.48-00.38, the relatively strong ortho-NH2D emission was detected in HII regions (see Figure 10 and Figure 11). The structure in W 51 is complex (Scoville & Solomon, 1973), we can not confirm if that the ortho-NH2D and H42 emission come from the same structure. But it is obvious that ortho-NH2D emission is away from H42 emission, especially the strong H42 emission and the center of the HII region.
The ortho-NH2D presents two structures in G011.91-00.61 (see Figure 2). One is the northeast structure which is similar to the distribution of H42 emission; another is the southwest structure without H42 emission. However, the ortho-NH2D emissions in the southwest structure are stronger and more extensive than emissions in the northeast structure. The reason may be that the massive star-forming stage in the northeast part is later than the southwest structure, and as a result, NH2D in the northeast part is much more depleted than NH2D in the southwest part.
In cold molecular gas, there is an active process of deuterated molecules forming (Caselli & Ceccarelli, 2012). And during this process, several neutral species are frozen-out onto dust grains and molecules are deuterated on the surface of dust grains (Caselli & Ceccarelli, 2012). Moreover, according to the simulation, Caselli et al. (2008) suggested that the deuterium fractionation of H (which means the abundance ratio of H to H2D+) dropped rapidly when the gas kinetic temperature is above 15 K. The formation process of NH2D is related to H2D+ (Emprechtinger et al., 2009). It may indicate that the (NH3) decreases with temperature increasing when the temperature is relatively high. Besides, with PdBI observation toward the massive star-forming region IRAS 20293+3952, Busquet et al. (2010) reported that they found strong NH2D emission in starless cores and did not detect NH2D near YSOs. Therefore, according to previous research of observation and theory (e.g. Caselli et al., 2008; Emprechtinger et al., 2009; Busquet et al., 2010; Caselli & Ceccarelli, 2012), the abundance of NH2D should decrease with the evolution of massive star formation.
Without H42 detected, these nine sources present both strong and weak NH2D emission. In two sources, G037.43+01.51 and G188.94+00.88, the velocity integrated intensity of ortho-NH2D is lower than 1 K km/s (see Figure 9 and Figure 18). In G037.43+01.51, the NH3 column density has been derived with VLA observation (Lu et al., 2014). Compared with other sources, this target presents low column density, such as G034.39+00.22 whose column density is one order of magnitude higher than G037.43+01.51 (Lu et al., 2014). Similarly, the NH3 column density of G188.94+00.88 is also lower than other sources, such as G081.75+00.59 whose column density is one order of magnitude higher than G188.94+00.88 with Effeslsberg observation (Jijina, Myers, & Adams, 1999). With low NH3 column density, the NH2D might generate relatively less in these two sources.
The NH2D seems to be depleted near the HII regions which indicates a later evolution stage. Furthermore, in the region without H42 emission, the strong ortho-NH2D emission is detected. Therefore, combining with previous researches (e.g. Caselli et al., 2008; Emprechtinger et al., 2009; Busquet et al., 2010; Caselli & Ceccarelli, 2012), we suggest that the abundance of NH2D may be affected by the evolution of massive star formation.
4.3 NH2D enhancement
With the Green Bank Telescope and the K-Band Focal Plane Array observation, Urquhart et al. (2015) have mapped the NH3 (1,1) and NH3 (2,2) inversion emission toward 66 massive star-forming regions, identified by the Red Midcourse Space Experiment Source survey (Lumsden et al., 2013). These 66 massive star-forming regions include several of our targets, such as G035.19-00.74 (see figure 20). In G035.19-00.74, strong NH2D emissions present a northwest to southeast distribution, while the northwest and the southeast regions present weak H13CN 1-0 emission (see figure 7), these regions might be devoid of dense molecular gases. However, in the weak H13CN 1-0 region, NH3(1,1) and NH3(2,2) were detected. Therefore, the molecular gases that exist in these regions and their density is relatively low.
The obvious NH2D enrichment is presented in the southeast and northwest of G035.19-00.74. In particular, in the northwest of G035.19-00.74, the very high deuterium fractionation of NH3 is detected. Compared with the H13CN emission in G035.19-00.74, the deuterium fractionation of NH3 is either not affected by gas density. Moreover, combining with the ammonia data, we could obtain the distribution of the deuterium fractionation in the following work.
5 Summary and conclusion remarks
Using of the IRAM-30m, we carried the ortho-NH2D at 85.9263 GHz mapping toward a sample of 24 late stage massive star-forming. The ortho-NH2D at 85.9263 GHz was detected in 18 targets. H13CN 1-0 at 86.3387 GHz was also detected in these 18 targets, while H42 at 85.6884 GHz was detected in nine targets.
11 of 18 sources, present a different distribution between ortho-NH2D and H13CN 1-0 with asymmetrically and resolvable distributed spatial structure. For the other 7 sources, no significant difference between these two lines can be found. This is mainly due to the limited spatial resolution and sensitivity.
Our main results include:
-
1.
The ortho-NH2D emissions present a complex distribution, which is different from other molecule transitions, such as H13CN 1-0.
-
2.
Most of the targets show the different distribution between ortho-NH2D and H13CN 1-0. Compared with other physical parameters (such as temperature), therefore, the dense gas (or gas density) may not be an important physical parameter to affect the NH2D enhancement in these targets.
- 3.
Acknowledgements
This work is supported by the National Key RD Program of China (No. 2022YFA1603101) and the National Natural Science Foundation of China (NSFC, Grant No. 12173067). This study is based on observations carried out under project numbers 042-19, 147-19, and 127-20 with the IRAM 30-m telescope. IRAM is supported by INSU/CNRS (France), MPG (Germany) and IGN (Spain).
Data availability
The original data observed with IRAM 30 meter can be accessed by IRAM archive system at https://www.iram-institute.org/EN/content-page-386-7-386-0-0-0.html. If anyone is interested in the reduced data presented in this paper, please contact Junzhi Wang at [email protected].
References
- Acord, Churchwell, & Wood (1998) Acord J. M., Churchwell E., Wood D. O. S., 1998, ApJL, 495, L107. doi:10.1086/311230
- Beuther et al. (2002) Beuther H., Schilke P., Menten K. M., Motte F., Sridharan T. K., Wyrowski F., 2002, ApJ, 566, 945. doi:10.1086/338334
- Brown & Millar (1989) Brown P. D., Millar T. J., 1989, MNRAS, 240, 25P. doi:10.1093/mnras/240.1.25P
- Busquet et al. (2010) Busquet G., Palau A., Estalella R., Girart J. M., Sánchez-Monge Á., Viti S., Ho P. T. P., et al., 2010, A&A, 517, L6. doi:10.1051/0004-6361/201014866
- Caselli et al. (2008) Caselli P., Vastel C., Ceccarelli C., van der Tak F. F. S., Crapsi A., Bacmann A., 2008, A&A, 492, 703. doi:10.1051/0004-6361:20079009
- Caselli & Ceccarelli (2012) Caselli P., Ceccarelli C., 2012, A&ARv, 20, 56. doi:10.1007/s00159-012-0056-x
- Cazaux et al. (2003) Cazaux S., Tielens A. G. G. M., Ceccarelli C., Castets A., Wakelam V., Caux E., Parise B., et al., 2003, ApJL, 593, L51. doi:10.1086/378038
- Ceccarelli et al. (2014) Ceccarelli C., Caselli P., Bockelée-Morvan D., Mousis O., Pizzarello S., Robert F., Semenov D., 2014, prpl.conf, 859. doi:10.2458/azu_uapress_9780816531240-ch037
- Crapsi et al. (2007) Crapsi A., Caselli P., Walmsley M. C., Tafalla M., 2007, A&A, 470, 221. doi:10.1051/0004-6361:20077613
- Christensen et al. (2023) Christensen I. B., Wyrowski F., Menten K. M., Beuther H., Cascade Team, 2023, pcsf.conf, 253
- Cox, Guesten, & Henkel (1987) Cox P., Guesten R., Henkel C., 1987, A&A, 181, L19
- Davis et al. (2007) Davis C. J., Kumar M. S. N., Sandell G., Froebrich D., Smith M. D., Currie M. J., 2007, MNRAS, 374, 29. doi:10.1111/j.1365-2966.2006.11163.x
- Dent, Little, & White (1984) Dent W. R. F., Little L. T., White G. J., 1984, MNRAS, 210, 173. doi:10.1093/mnras/210.1.173
- Dickel, Dickel, & Wilson (1978) Dickel J. R., Dickel H. R., Wilson W. J., 1978, ApJ, 223, 840. doi:10.1086/156317
- Emprechtinger et al. (2009) Emprechtinger M., Caselli P., Volgenau N. H., Stutzki J., Wiedner M. C., 2009, A&A, 493, 89. doi:10.1051/0004-6361:200810324
- Evans et al. (2006) Evans A. S., Solomon P. M., Tacconi L. J., Vavilkin T., Downes D., 2006, AJ, 132, 2398. doi:10.1086/508416
- Fallscheer et al. (2013) Fallscheer C., Reid M. A., Di Francesco J., Martin P. G., Hill T., Hennemann M., Nguyen-Luong Q., et al., 2013, ApJ, 773, 102. doi:10.1088/0004-637X/773/2/102
- Fedoseev, Ioppolo, & Linnartz (2015) Fedoseev G., Ioppolo S., Linnartz H., 2015, MNRAS, 446, 449. doi:10.1093/mnras/stu1852
- Feldt et al. (2003) Feldt M., Puga E., Lenzen R., Henning T., Brandner W., Stecklum B., Lagrange A.-M., et al., 2003, ApJL, 599, L91. doi:10.1086/381174
- Gao & Solomon (2004) Gao Y., Solomon P. M., 2004, ApJ, 606, 271. doi:10.1086/382999
- Gibb et al. (2003) Gibb A. G., Hoare M. G., Little L. T., Wright M. C. H., 2003, MNRAS, 339, 1011. doi:10.1046/j.1365-8711.2003.06251.x
- Ginsburg et al. (2012) Ginsburg A., Bressert E., Bally J., Battersby C., 2012, ApJL, 758, L29. doi:10.1088/2041-8205/758/2/L29
- Gong et al. (2015) Gong Y., Henkel C., Thorwirth S., Spezzano S., Menten K. M., Walmsley C. M., Wyrowski F., et al., 2015, A&A, 581, A48. doi:10.1051/0004-6361/201526275
- Harju et al. (2017) Harju J., Daniel F., Sipilä O., Caselli P., Pineda J. E., Friesen R. K., Punanova A., et al., 2017, A&A, 600, A61. doi:10.1051/0004-6361/201628463
- Harvey et al. (1986) Harvey P. M., Joy M., Lester D. F., Wilking B. A., 1986, ApJ, 300, 737. doi:10.1086/163848
- Harvey & Forveille (1988) Harvey P. M., Forveille T., 1988, A&A, 197, L19
- Hatchell (2003) Hatchell J., 2003, A&A, 403, L25. doi:10.1051/0004-6361:20030297
- Hennemann et al. (2012) Hennemann M., Motte F., Schneider N., Didelon P., Hill T., Arzoumanian D., Bontemps S., et al., 2012, A&A, 543, L3. doi:10.1051/0004-6361/201219429
- Herbst (1982) Herbst E., 1982, A&A, 111, 76
- Ho & Townes (1983) Ho P. T. P., Townes C. H., 1983, ARA&A, 21, 239. doi:10.1146/annurev.aa.21.090183.001323
- Hughes & Wouterloot (1984) Hughes V. A., Wouterloot J. G. A., 1984, ApJ, 276, 204. doi:10.1086/161603
- Ilee et al. (2018) Ilee J. D., Cyganowski C. J., Brogan C. L., Hunter T. R., Forgan D. H., Haworth T. J., Clarke C. J., et al., 2018, ApJL, 869, L24. doi:10.3847/2041-8213/aaeffc
- Jijina, Myers, & Adams (1999) Jijina J., Myers P. C., Adams F. C., 1999, ApJS, 125, 161. doi:10.1086/313268
- Juárez et al. (2019) Juárez C., Liu H. B., Girart J. M., Palau A., Busquet G., Galván-Madrid R., Hirano N., et al., 2019, A&A, 621, A140. doi:10.1051/0004-6361/201834173
- Kirby (2009) Kirby L., 2009, ApJ, 694, 1056. doi:10.1088/0004-637X/694/2/1056
- Koley et al. (2021) Koley A., Roy N., Menten K. M., Jacob A. M., Pillai T. G. S., Rugel M. R., 2021, MNRAS, 501, 4825. doi:10.1093/mnras/staa3898
- Lada (1976) Lada C. J., 1976, ApJS, 32, 603. doi:10.1086/190409
- Lada, Bally, & Stark (1991) Lada E. A., Bally J., Stark A. A., 1991, ApJ, 368, 432. doi:10.1086/169708
- Li et al. (2017) Li S., Wang J., Zhang Z.-Y., Fang M., Li J., Zhang J., Fan J., et al., 2017, MNRAS, 466, 248. doi:10.1093/mnras/stw3076
- Li et al. (2022) Li Y., Wang J., Li J., Liu S., Luo Q., 2022, MNRAS, 512, 4934. doi:10.1093/mnras/stab3186
- Lim, De Buizer, & Radomski (2020) Lim W., De Buizer J. M., Radomski J. T., 2020, ApJ, 888, 98. doi:10.3847/1538-4357/ab5fd0
- Linsky et al. (1995) Linsky J. L., Diplas A., Wood B. E., Brown A., Ayres T. R., Savage B. D., 1995, ApJ, 451, 335. doi:10.1086/176223
- Lis et al. (2002) Lis D. C., Gerin M., Phillips T. G., Motte F., 2002, ApJ, 569, 322. doi:10.1086/339232
- Lu et al. (2014) Lu X., Zhang Q., Liu H. B., Wang J., Gu Q., 2014, ApJ, 790, 84. doi:10.1088/0004-637X/790/2/84
- Lumsden et al. (2013) Lumsden S. L., Hoare M. G., Urquhart J. S., Oudmaijer R. D., Davies B., Mottram J. C., Cooper H. D. B., et al., 2013, ApJS, 208, 11. doi:10.1088/0067-0049/208/1/11
- Mangum, Wootten, & Mundy (1991) Mangum J. G., Wootten A., Mundy L. G., 1991, ApJ, 378, 576. doi:10.1086/170459
- Mills et al. (2018) Mills E. A. C., Corby J., Clements A. R., Butterfield N., Jones P. A., Cunningham M. R., Ott J., 2018, ApJ, 869, 121. doi:10.3847/1538-4357/aaed3f
- Minier et al. (2005) Minier V., Burton M. G., Hill T., Pestalozzi M. R., Purcell C. R., Garay G., Walsh A. J., et al., 2005, A&A, 429, 945. doi:10.1051/0004-6361:20041137
- Miralles, Rodriguez, & Scalise (1994) Miralles M. P., Rodriguez L. F., Scalise E., 1994, ApJS, 92, 173. doi:10.1086/191965
- Motte et al. (2007) Motte F., Bontemps S., Schilke P., Schneider N., Menten K. M., Broguière D., 2007, A&A, 476, 1243. doi:10.1051/0004-6361:20077843
- Müller et al. (2001) Müller H. S. P., Thorwirth S., Roth D. A., Winnewisser G., 2001, A&A, 370, L49. doi:10.1051/0004-6361:20010367
- Müller et al. (2005) Müller H. S. P., Schlöder F., Stutzki J., Winnewisser G., 2005, JMoSt, 742, 215. doi:10.1016/j.molstruc.2005.01.027
- Neill et al. (2013) Neill J. L., Crockett N. R., Bergin E. A., Pearson J. C., Xu L.-H., 2013, ApJ, 777, 85. doi:10.1088/0004-637X/777/2/85
- Nguyen Luong et al. (2011) Nguyen Luong Q., Motte F., Schuller F., Schneider N., Bontemps S., Schilke P., Menten K. M., et al., 2011, A&A, 529, A41. doi:10.1051/0004-6361/201016271
- Oliveira et al. (2003) Oliveira C. M., Hébrard G., Howk J. C., Kruk J. W., Chayer P., Moos H. W., 2003, ApJ, 587, 235. doi:10.1086/368019
- Pillai et al. (2011) Pillai T., Kauffmann J., Wyrowski F., Hatchell J., Gibb A. G., Thompson M. A., 2011, A&A, 530, A118. doi:10.1051/0004-6361/201015899
- Persi, Tapia, & Smith (2006) Persi P., Tapia M., Smith H. A., 2006, A&A, 445, 971. doi:10.1051/0004-6361:20053251
- Peters, Longmore, & Dullemond (2012) Peters T., Longmore S. N., Dullemond C. P., 2012, MNRAS, 425, 2352. doi:10.1111/j.1365-2966.2012.21676.x
- Povich et al. (2009) Povich M. S., Churchwell E., Bieging J. H., Kang M., Whitney B. A., Brogan C. L., Kulesa C. A., et al., 2009, ApJ, 696, 1278. doi:10.1088/0004-637X/696/2/1278
- Qiu, Zhang, & Menten (2011) Qiu K., Zhang Q., Menten K. M., 2011, ApJ, 728, 6. doi:10.1088/0004-637X/728/1/6
- Rathborne, Jackson, & Simon (2006) Rathborne J. M., Jackson J. M., Simon R., 2006, ApJ, 641, 389. doi:10.1086/500423
- Reid et al. (2014) Reid M. J., Menten K. M., Brunthaler A., Zheng X. W., Dame T. M., Xu Y., Wu Y., et al., 2014, ApJ, 783, 130. doi:10.1088/0004-637X/783/2/130
- Ren et al. (2011) Ren J. Z., Liu T., Wu Y., Li L., 2011, MNRAS, 415, L49. doi:10.1111/j.1745-3933.2011.01076.x
- Riffel & Lüdke (2010) Riffel R. A., Lüdke E., 2010, MNRAS, 404, 1449. doi:10.1111/j.1365-2966.2010.16355.x
- Rivilla et al. (2020) Rivilla V. M., Colzi L., Fontani F., Melosso M., Caselli P., Bizzocchi L., Tamassia F., et al., 2020, MNRAS, 496, 1990. doi:10.1093/mnras/staa1616
- Roberts & Millar (2000a) Roberts H., Millar T. J., 2000, A&A, 361, 388
- Roberts & Millar (2000b) Roberts H., Millar T. J., 2000, A&A, 364, 780
- Rodgers & Charnley (2001) Rodgers S. D., Charnley S. B., 2001, ApJ, 553, 613. doi:10.1086/320987
- Rygl et al. (2010) Rygl K. L. J., Brunthaler A., Reid M. J., Menten K. M., van Langevelde H. J., Xu Y., 2010, A&A, 511, A2. doi:10.1051/0004-6361/200913135
- Rygl et al. (2014) Rygl K. L. J., Goedhart S., Polychroni D., Wyrowski F., Motte F., Elia D., Nguyen-Luong Q., et al., 2014, MNRAS, 440, 427. doi:10.1093/mnras/stu300
- Tiné et al. (2000) Tiné S., Roueff E., Falgarone E., Gerin M., Pineau des Forêts G., 2000, A&A, 356, 1039
- Shah & Wootten (2001) Shah R. Y., Wootten A., 2001, ApJ, 554, 933. doi:10.1086/321396
- Shepherd, Testi, & Stark (2003) Shepherd D. S., Testi L., Stark D. P., 2003, ApJ, 584, 882. doi:10.1086/345743
- Shepherd, Kurtz, & Testi (2004) Shepherd D. S., Kurtz S. E., Testi L., 2004, ApJ, 601, 952. doi:10.1086/380633
- Scoville & Solomon (1973) Scoville N. Z., Solomon P. M., 1973, ApJ, 180, 31. doi:10.1086/151940
- Turner (1990) Turner B. E., 1990, ApJL, 362, L29. doi:10.1086/185840
- Ungerechts, Umbanhowar, & Thaddeus (2000) Ungerechts H., Umbanhowar P., Thaddeus P., 2000, ApJ, 537, 221. doi:10.1086/308992
- Urquhart et al. (2015) Urquhart J. S., Figura C. C., Moore T. J. T., Csengeri T., Lumsden S. L., Pillai T., Thompson M. A., et al., 2015, MNRAS, 452, 4029. doi:10.1093/mnras/stv1514
- Vastel et al. (2017) Vastel C., Mookerjea B., Pety J., Gerin M., 2017, A&A, 597, A45. doi:10.1051/0004-6361/201629289
- Vasyunina et al. (2011) Vasyunina T., Linz H., Henning T., Zinchenko I., Beuther H., Voronkov M., 2011, A&A, 527, A88. doi:10.1051/0004-6361/201014974
- Walsh et al. (1998) Walsh A. J., Burton M. G., Hyland A. R., Robinson G., 1998, MNRAS, 301, 640. doi:10.1046/j.1365-8711.1998.02014.x
- Wienen et al. (2021) Wienen M., Wyrowski F., Walmsley C. M., Csengeri T., Pillai T., Giannetti A., Menten K. M., 2021, A&A, 649, A21. doi:10.1051/0004-6361/201731208
- Wood & Churchwell (1989) Wood D. O. S., Churchwell E., 1989, ApJS, 69, 831. doi:10.1086/191329
- Wu et al. (2010) Wu J., Evans N. J., Shirley Y. L., Knez C., 2010, ApJS, 188, 313. doi:10.1088/0067-0049/188/2/313
- Xu et al. (2011) Xu Y., Moscadelli L., Reid M. J., Menten K. M., Zhang B., Zheng X. W., Brunthaler A., 2011, ApJ, 733, 25. doi:10.1088/0004-637X/733/1/25
- Yang et al. (1991) Yang J., Umemoto T., Iwata T., Fukui Y., 1991, ApJ, 373, 137. doi:10.1086/170032
- Zahorecz et al. (2021) Zahorecz S., Jimenez-Serra I., Testi L., Immer K., Fontani F., Caselli P., Wang K., et al., 2021, A&A, 653, A45. doi:10.1051/0004-6361/201937012
- Zapata et al. (2020) Zapata L. A., Ho P. T. P., Fernández-López M., Ccolque E. G., Rodríguez L. F., Reyes-Valdés J., Bally J., et al., 2020, ApJL, 902, L47. doi:10.3847/2041-8213/abbd3f
- Zhang et al. (2020) Zhang C.-P., Li G.-X., Pillai T., Csengeri T., Wyrowski F., Menten K. M., Pestalozzi M. R., 2020, A&A, 638, A105. doi:10.1051/0004-6361/201936118
| source name | RA(J2000) | DEC(J2000) | DGC | Size | |
|---|---|---|---|---|---|
| hh:mm:ss | dd:mm:ss | kpc | km s-1 | ||
| G005.88-00.39 | 18:00:30.31 | -24:04:04.50 | 5.3 | 9 | 2 |
| G009.62+00.19 | 18:06:14.66 | -20:31:31.70 | 3.3 | 2 | 2 |
| G011.49-014.8 | 18:16:22.13 | -19:41:27.20 | 7.1 | 11 | 2 |
| G011.91-00.61 | 18:13:59.72 | -18:53:50.30 | 5.1 | 37 | 3 |
| G012.80-00.20 | 18:14:14.23 | -17:55:40.50 | 5.5 | 34 | 4 |
| G015.03-00.67 | 18:20:22.01 | -16:12:11.30 | 6.4 | 22 | 4 |
| G023.44-00.18 | 18:34:39.29 | -08:31:25.40 | 3.7 | 97 | 2 |
| G031.28+00.06 | 18:48:12.39 | -01:26:30.70 | 5.2 | 109 | 2 |
| G034.39+00.22 | 18:53:19.00 | +01:24:50.80 | 7.1 | 57 | 2 |
| G035.19-00.74 | 18:58:13.05 | +01:40:35.70 | 6.6 | 30 | 2 |
| G035.20-01.73 | 19:01:45.54 | +01:13:32.50 | 5.9 | 42 | 3 |
| G043.16+00.01 | 19:10:13.41 | +09:06:12.80 | 7.6 | 10 | 2 |
| G037.43+01.51 | 18:54:14.35 | +04:41:41.70 | 6.9 | 41 | 2 |
| G049.48-00.36 | 19:23:39.82 | +14:31:05.00 | 6.3 | 56 | 2 |
| G049.48-00.38 | 19:23:43.87 | +14:30:29.50 | 6.3 | 58 | 2 |
| G075.76+00.33 | 20:21:41.09 | +37:25:29.30 | 8.2 | -9 | 2 |
| G081.75+00.59 | 20:39:01.99 | +42:24:59.30 | 8.2 | -3 | 2 |
| G081.87+00.78 | 20:38:36.43 | +42:37:34.80 | 8.2 | 7 | 2 |
| G109.87+02.11 | 22:56:18.10 | +62:01:49.50 | 8.6 | -7 | 2.5 |
| G111.54+00.77 | 23:13:45.36 | +61:28:10.60 | 9.6 | -57 | 2 |
| G121.29+00.65 | 00:36:47.35 | +63:29:02.20 | 8.8 | -23 | 2 |
| G133.94+01.06 | 02:27:03.82 | +61:52:25.20 | 9.8 | -47 | 2 |
| G188.94+00.88 | 06:08:53.35 | +21:38:28.70 | 10.4 | 8 | 2 |
| G192.60-00.04 | 06:12:54.02 | +17:59:47.3 | 9.9 | 6 | 2 |
| F′′-F′′ | frequency (MHz) | relative intensity |
| 0-1 | 85924.7829 | 0.111 |
| 2-1 | 85925.7031 | 0.139 |
| 2-2 | 85926.2703 | 0.417 |
| 1-1 | 85926.3165 | 0.083 |
| 1-2 | 85926.8837 | 0.139 |
| 1-0 | 85927.7345 | 0.111 |
| Source | (85.9 GHz)d | (110 GHz)d | |
|---|---|---|---|
| K km s-1 | K km s-1 | ||
| G005.88-00.39 | 0.330.15 | 0.370.07 | 0.890.44 |
| G011.91-00.61 | 2.240.14 | 1.080.05 | 2.070.16 |
| G015.03-00.67 | 0.509 | 0.157 | … |
| G023.44-00.18 | 1.52 0.14 | 0.750.05 | 2.030.23 |
| G031.28+00.06 | 0.280 | 0.180.04 | … |
| G034.39+00.22 | 5.11 0.18 | 1.730.03 | 2.950.12 |
| G035.19-00.74 | 1.290.16 | 0.570.04 | 2.260.32 |
| G035.20-01.73 | 0.520.11 | 0.110.04 | 4.731.99 |
| G037.43+01.51 | 0.310.11 | 0.180.02 | 1.720.64 |
| G049.48-00.36 | 1.060.17 | 0.550.05 | 1.930.36 |
| G049.48-00.38 | 2.920.14 | 2.310.06 | 1.260.07 |
| G075.76+00.33 | 0.305 | 0.096 | … |
| G081.75+00.59 | 5.980.07 | 4.100.03 | 1.450.02 |
| G081.87+00.78 | 0.410.14 | 0.310.03 | 1.320.47 |
| G109.87+02.11 | 0.472 | 0.080.02 | … |
| G111.54+00.77 | 0.881 | 0.200.02 | … |
| G121.29+00.65 | 1.590.14 | 0.910.02 | 1.750.16 |
| G188.94+00.88 | 0.257 | 0.140.02 | … |
| source |
|
NH2D direction |
|
|
|
||||||||
| G005.88-00.39 | 0.600.16 | ✓ | |||||||||||
| G011.91-00.61 | 2.330.15 | northeast-southwest | ✓ | ✓ | ✓ | ||||||||
| G015.03-00.67 | 1.110.18 | fragmentization | ✓ | ||||||||||
| G023.44-00.18 | 2.310.13 | disciform | ✓ | ✓ | |||||||||
| G031.28+00.06 | 0.860.11 | northeast-southwest | ✓ | ✓ | |||||||||
| G034.39+00.22 | 5.110.18 | north-south | ✓ | ✓ | |||||||||
| G035.19-00.74 | 3.050.11 | northwest-southeast | ✓ | ||||||||||
| G035.20-01.73 | 4.060.11 | west-east | ✓ | ✓ | |||||||||
| G037.43+01.51 | 0.600.11 | irregular | |||||||||||
| G049.48-00.36 | 2.450.17 | complex structure | ✓ | ✓ | |||||||||
| G049.48-00.38 | 2.920.14 | complex structure | ✓ | ✓ | ✓ | ||||||||
| G075.76+00.33 | 1.270.17 | west-east | ✓ | ✓ | |||||||||
| G081.75+00.59 | 6.950.14 | north-south | ✓ | ✓ | |||||||||
| G081.87+00.78 | 1.700.13 | northwest-southeast | ✓ | ||||||||||
| G109.87+02.11 | 2.510.17 | northeast-southwest | ✓ | ||||||||||
| G111.54+00.77 | 1.860.16 | complex structure | ✓ | ✓ | |||||||||
| G121.29+00.65 | 2.220.26 | northwest-southeast | ✓ | ||||||||||
| G188.94+00.88 | 0.860.16 |