SN 2022vqz: A Peculiar Subluminous Type Ia Supernova with Prominent Early Excess Emission
Abstract
We present extensive photometric and spectroscopic observations of the peculiar Type Ia supernova (SN Ia) 2022vqz. It shares many similarities with the SN 2002es-like Type Ia supernovae (SNe Ia), such as low luminosity ( mag) and moderate post-peak decline rate ( mag). The nickel mass synthesised in the explosion is estimated as from the bolometric light curve, which is obviously lower than that of normal SNe Ia. SN 2022vqz is also characterised by slowly expanding ejecta, with Si II velocities persisting around 7000 km s-1 since 16 days before peak brightness, unique among all known SNe Ia. While all of these properties imply a lower-energy thermonuclear explosion that should leave a considerable amount of unburnt materials, the absent signature of unburnt carbon in spectra of SN 2022vqz is puzzling. A prominent early peak is clearly detected in the ATLAS - and -band light curves and in the ZTF -band data within days after the explosion. Possible mechanisms for the early peak are discussed, including the sub-Chandrasekhar-mass double-detonation model and interaction of SN ejecta with circumstellar material. We find that both models face some difficulties in replicating all aspects of the observed data. As an alternative, we propose a hybrid C-O-Ne white dwarf as the progenitor of SN 2022vqz; it can simultaneously reconcile the tension between low ejecta velocity and the absence of carbon. We further discuss the diversity of SN 2002es-like objects and their origin in the context of different scenarios.
keywords:
supernovae: general – supernovae: individual (SN 2022vqz)1 Introduction
Although it is commonly accepted that Type Ia supernovae (SNe Ia) are thermonuclear explosions of carbon-oxygen (C-O) white dwarfs (WDs) in close binary systems (Hoyle & Fowler, 1960; Bloom et al., 2012), the detailed properties of their progenitors, as well as the exact explosion mechanism, are still inconclusive (Livio & Mazzali, 2018; Liu et al., 2023). Observationally, about 70% of SNe Ia display relatively homogeneous properties, especially after some empirical corrections based on their light-curve decline rates (Phillips, 1993) and colours (Guy et al., 2007; Jha et al., 2007; Wang et al., 2005). These SNe Ia are known as “Branch-normal” ones (Branch et al., 1993) and are used as excellent cosmological standardisable candles (Riess et al., 1998, 2022; Schmidt et al., 1998; Perlmutter et al., 1999). Note that even Branch-normal SNe Ia can be further classified into several subclasses that may also have different physical origins (Benetti et al., 2005; Wang et al., 2009, 2013, 2019).
Beside the normal ones, the remaining SNe Ia show a substantial diversity, and are classified into different subclasses depending on their photometric and spectroscopic properties (Filippenko, 1997; Parrent et al., 2014; Taubenberger, 2017). In particular, the subluminous group represented by SN 1991bg (“91bg-like") are characterised by their rapid evolving light curves, low ejecta velocity, more prominent intermediate-mass elements (IMEs), and strong Ti II absorption in spectra at maximum light (Filippenko et al., 1992; Leibundgut et al., 1993). These peculiarities are generally interpreted as signatures of a lower burning efficiency and a cooler ejecta temperature (Mazzali et al., 1997; Hachinger et al., 2009).
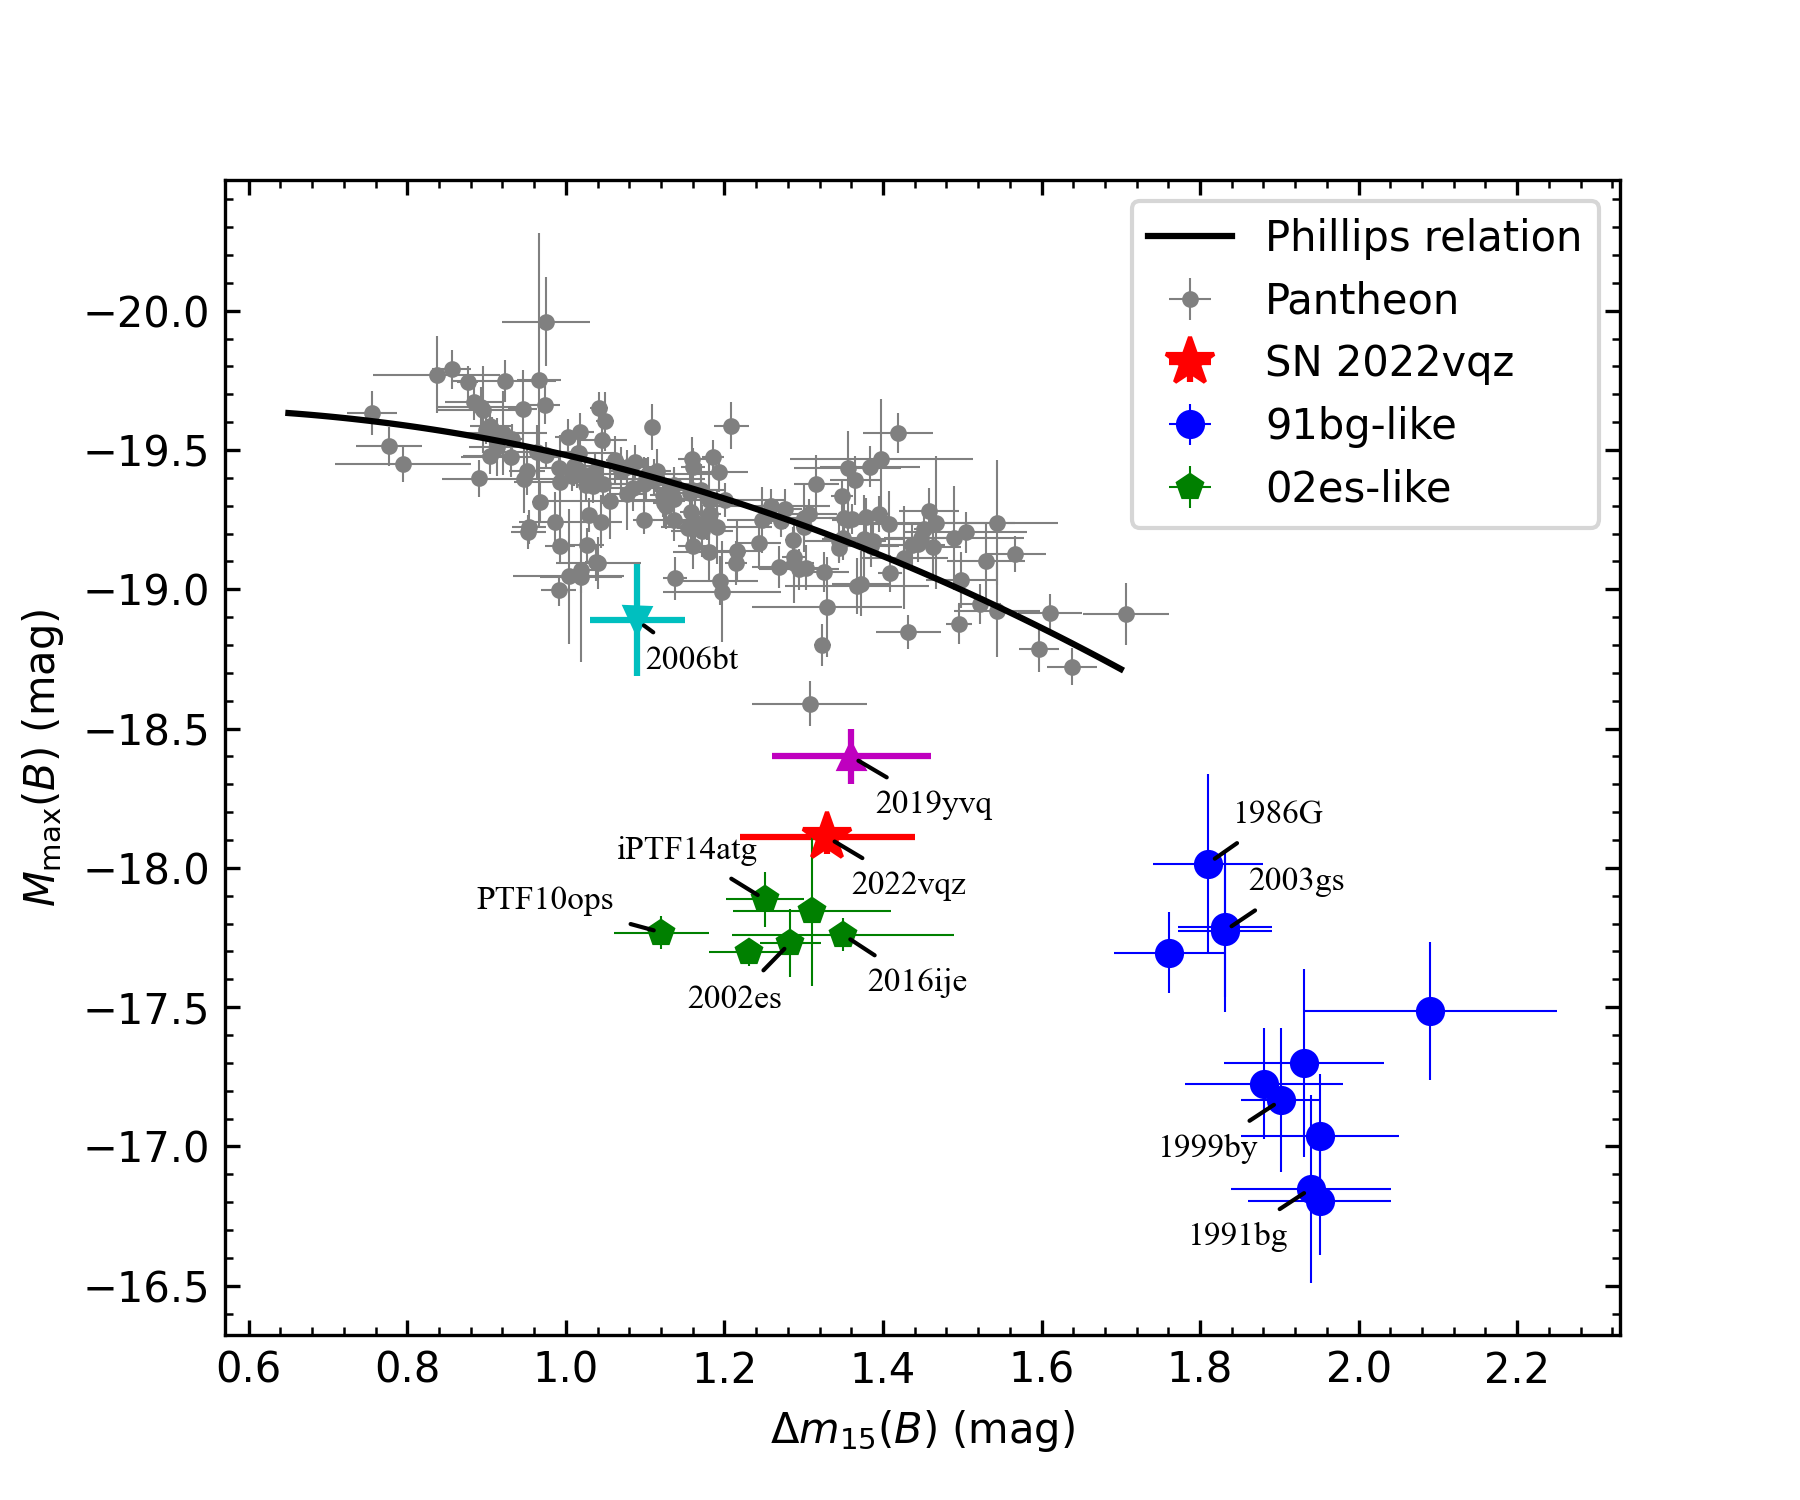
Another peculiar subluminous subclass of SNe Ia, which are represented by SN 2002es (dubbed “02es-like"), share most of the characteristics with the 91bg-like objects, except for displaying broader light curves that are comparable to those of normal SNe Ia (Ganeshalingam et al., 2012; White et al., 2015). The normal light-curve decline rate combined with the low peak luminosity put 02es-like objects at a position that was long believed to be devoid of events on the Phillips-relation diagram (Phillips, 1993). In comparison with other subtypes, the subclass of 02es-like SNe Ia is relatively rare, contributing to % of all SNe Ia (Ganeshalingam et al., 2012). By now, only about a dozen events have been identified as 02es-like (Burke et al., 2021). The prototype SN 2002es itself shows a subluminous peak luminosity ( mag) and a slow ejecta velocity ( 6000 km s-1 around maximum light). Its optical spectra are also characterised by strong Si II 5972, O I, and Ti II lines, similar to those of the 91bg-like SNe Ia. It is expected that the 02es-like SNe Ia should have subluminous peaks and slowly-expanding ejecta. However, some events with properties close to those of normal ones were also classified as 02es-like. For example, the peak magnitudes of SN 2006bt (Taubenberger, 2017), SN 2016jhr (Jiang et al., 2017), and SN 2022ywc (Srivastav et al., 2023) are as bright as mag. The Si II velocities of SN 2006bt (Foley et al., 2010) and PTF10ops (Maguire et al., 2011) measured near maximum light are km s-1. Another proposed candidate is SN 2019yvq (Miller et al., 2020; Tucker et al., 2021; Burke et al., 2021), which showed an unprecedented high velocity of km s-1. This greatly extends the range of 02es-like SNe Ia if they have similar origins. All of the above-mentioned events show normal light curves but have the spectral characteristics of low-luminosity SNe Ia, especially the distinct Ti II absorption. These commonalities make them classified as 02es-like SNe Ia and demonstrate the diversity in this subclass.
Observations of 02es-like SNe Ia revealed many other properties of this subclass. The nebular spectra of 02es-like SN 2010lp (Taubenberger et al., 2013) and iPTF14atg (Kromer et al., 2016) are characterised by broad and strong [Fe II] and [Ca II] emission, as in low-luminosity SNe Ia. However, in contrast to the 91bg-like events, they do not display narrow [Fe III] or [Co III] emission but rather narrow [O I] in their nebular spectra. The light curves of SN 2002es show a rapid decline from month after the peak (Ganeshalingam et al., 2012), which is not observed in other 02es-like SNe Ia. White et al. (2015) noticed that the 02es-like SNe Ia tend to reside in luminous, early-type galaxies with minimal star formation, and located far from the centre of their hosts, suggesting longevity of their progenitor systems (Taubenberger, 2017). There are also outliers, such as SN 2016ije, located in a bluer, low-mass, star-forming galaxy (Li et al., 2023).
More recent studies indicate that all the 02es-like SNe Ia with good early photometric coverage, including iPTF14atg (Cao et al., 2015), SN 2016jhr, 2019yvq, and 2022ywc, show early blue/ultraviolet (UV) excesses/peaks within days after the explosion. An early-time excess has been considered to be evidence for a nondegenerate companion in the single-degenerate (SD) scenario (Whelan & Iben, 1973), interacting with the expanding ejecta and creating additional UV/optical flux. However, owing to the effect of the viewing-angle distribution, the excess is predicted to be observable in only % of the events (Kasen, 2010). This prediction is more consistent with the observed rate of early excesses in normal SNe Ia (Burke et al., 2022), which is % (Deckers et al., 2022; Magee et al., 2022).
A promising scenario for 02es-like SNe Ia is that they arise from a double-degenerate (DD) system, in which the companion of the exploding WD is another He-C-O WD (Iben & Tutukov, 1984; Webbink, 1984). Maguire et al. (2011) and Ganeshalingam et al. (2012) suggested that PTF10ops and SN 2002es can be explained by a violent-merger model of two 0.9 WDs (Pakmor et al., 2010). Kromer et al. (2013, 2016) found that a revised merger model with WDs and different metallicities provide both light curves and spectra that match the observations of SN 2010lp and iPTF14atg. This model also leaves unburnt O near the centre of the ejecta, potentially reproducing the [O I] emission in the nebular spectra of 02es-like events. However, the merger model does not naturally explain the universal appearance of early-time excesses. A possible solution refers to the interaction between ejecta and extended circumstellar material (CSM; Piro & Morozova 2016; Piro et al. 2021). The CSM may be ejected before the merging state as tidal tails, disc winds, or jets (Raskin & Kasen, 2013; Levanon et al., 2015).
The DD scenario has a quite large parameter space. If the two merging WDs have larger masses, they can potentially result in a more-luminous super- event, falling into the category of SN 2003fg-like SNe Ia (Howell et al., 2006; van Kerkwijk et al., 2010; Scalzo et al., 2010). There are also some similarities between 02es-like and 03fg-like subtypes that are distinct from other SNe Ia, such as nonmonotonic early-time bumps and unique UV colour evolution, suggesting that they may originate from a single DD scenario with different WD masses (Hoogendam et al., 2023).
An alternative explanation proposed for the early peak of 02es-like objects is the double-detonation model, in which a sub-Chandrasekhar-mass (sub-) C-O WD is detonated by ignition of a surface He layer (Polin et al., 2019). A surface He layer of was adopted to explain the early-time excesses of SN 2016jhr (Jiang et al., 2017) and SN 2019yvq (Miller et al., 2020; Siebert et al., 2020; Burke et al., 2021). However, in the case of SN 2019yvq, the double-detonation model faces some issues that are difficult to reconcile (Tucker et al., 2021). The inferred WD masses from early-time photometry (0.96 M⊙; Miller et al. 2020) and nebular-phase spectroscopy (1.15 M⊙; Siebert et al. 2020) show a large discrepancy. Observing along the detonation pole of a thick He layer may reconcile the overluminous-model prediction of a more-massive WD (Siebert et al., 2020), but this will also introduce additional peculiar signals that were not observed in SN 2019yvq, such as severe line blanketing from He ashes (Tucker et al., 2021).
In this paper, we present our observations and analysis of SN 2022vqz, a subluminous 02es-like SN Ia with a remarkable early peak and extremely low ejecta velocity. Section 2 describes our observations and data reduction. Detailed analysis of the photometry and spectroscopy is presented in Section 3 and Section 4, respectively. In Section 5, we discuss possible explosion models for SN 2022vqz. We summarise the main results in Section 6.
2 Observations and Data Reduction
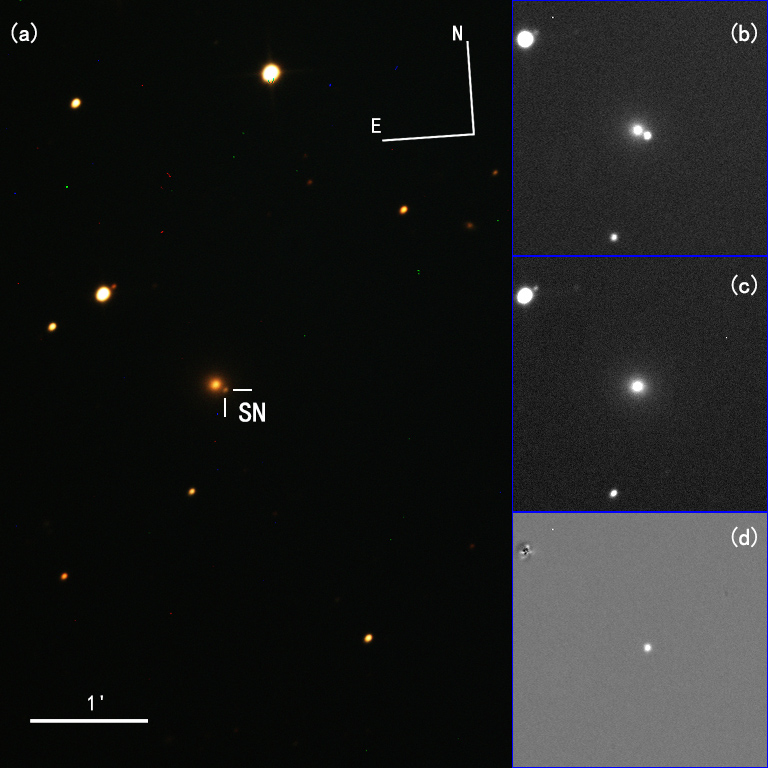
SN 2022vqz was discovered at 18.38 mag on MJD 59846.369 (2022 Sep. 24.369; UTC dates are used throughout this paper) by the Zwicky Transient Facility (ZTF; Fremling 2022) in the band. This transient was also detected by the Asteroid Terrestrial-impact Last Alert System (ATLAS; Tonry et al., 2018; Smith et al., 2020) survey on MJD 59845.471, day earlier than the ZTF discovery, at mag in their band. The last nondetection from the ATLAS survey was on MJD 59844.484, posting a strict constraint on its explosion time. Later, two spectra taken by Tucker (2022) and Maguire et al. (2022) classified this transient as a peculiar SN Ia. It is located at J2000 coordinates , , which is west and south of the centre of its host galaxy MCG+05-03-011, a lenticular (S0) galaxy with a heliocentric redshift of . Figure 1(a) shows the -band composite image of SN 2022vqz.
2.1 Photometric Data
We performed follow-up optical photometric observations of SN 2022vqz with multiple facilities, including the Tsinghua-NAOC 80 cm telescope at Xinglong Observatory of NAOC (TNT; Wang et al., 2008; Huang et al., 2012), the AZT-22 1.5 m telescope at Maidanak Observatory (Ehgamberdiev, 2018), and the Schmidt 67/92 cm and the 1.82 m Copernico Telescope at Cima Ekar Observing Station (Padova). Our multiband photometric monitoring began on 2022 Sep. 27.80 (MJD 59849.80) and has good coverage over a period of months. Standard IRAF111IRAF (Image Reduction and Analysis Facility) is distributed by the National Optical Astronomy Observatories (NOAO), which are operated by the Association of Universities for Research in Astronomy (AURA), Inc., under cooperative agreement with the U.S. National Science Foundation. routines were adopted to reduce the CCD images, including bias and flat-field corrections. The magnitudes are calibrated using a set of nearby reference stars from the Sloan Digital Sky Survey (SDSS) catalogue (York et al., 2000; Gunn et al., 2006). The number of reference stars ranges from 30 to 40 for the different facilities. For flux calibration of the -band photometry from AZT and -band photometry from TNT, the SDSS magnitudes of the reference stars are converted to standard magnitudes222http://classic.sdss.org/dr4/algorithms/sdssUBVRITransform.html#Lupton2005.
Although SN 2022vqz is offset from the centre of its host galaxy, background-light contamination is still prominent, especially for its late-time light curves. Usually, a host-galaxy template can be taken when the SN fades away, but this will take a long time for SN 2022vqz. As an alternative, we construct the host-galaxy templates of SN 2022vqz using two different methods. The first is smoothly interpolating the host-galaxy flux at the location of the SN by solving a diffusive equation bounded by surrounding starlight (Zhang et al., 2004). The second is using the flux information from the opposite side as a template since the host galaxy looks symmetric. The subtraction process follows Zrutyphot (Mo et al., in prep.). With the templates constructed by the above two methods, the final results of the photometry are consistent. Figure 1 shows an example of an original image, constructed template, and their difference image.
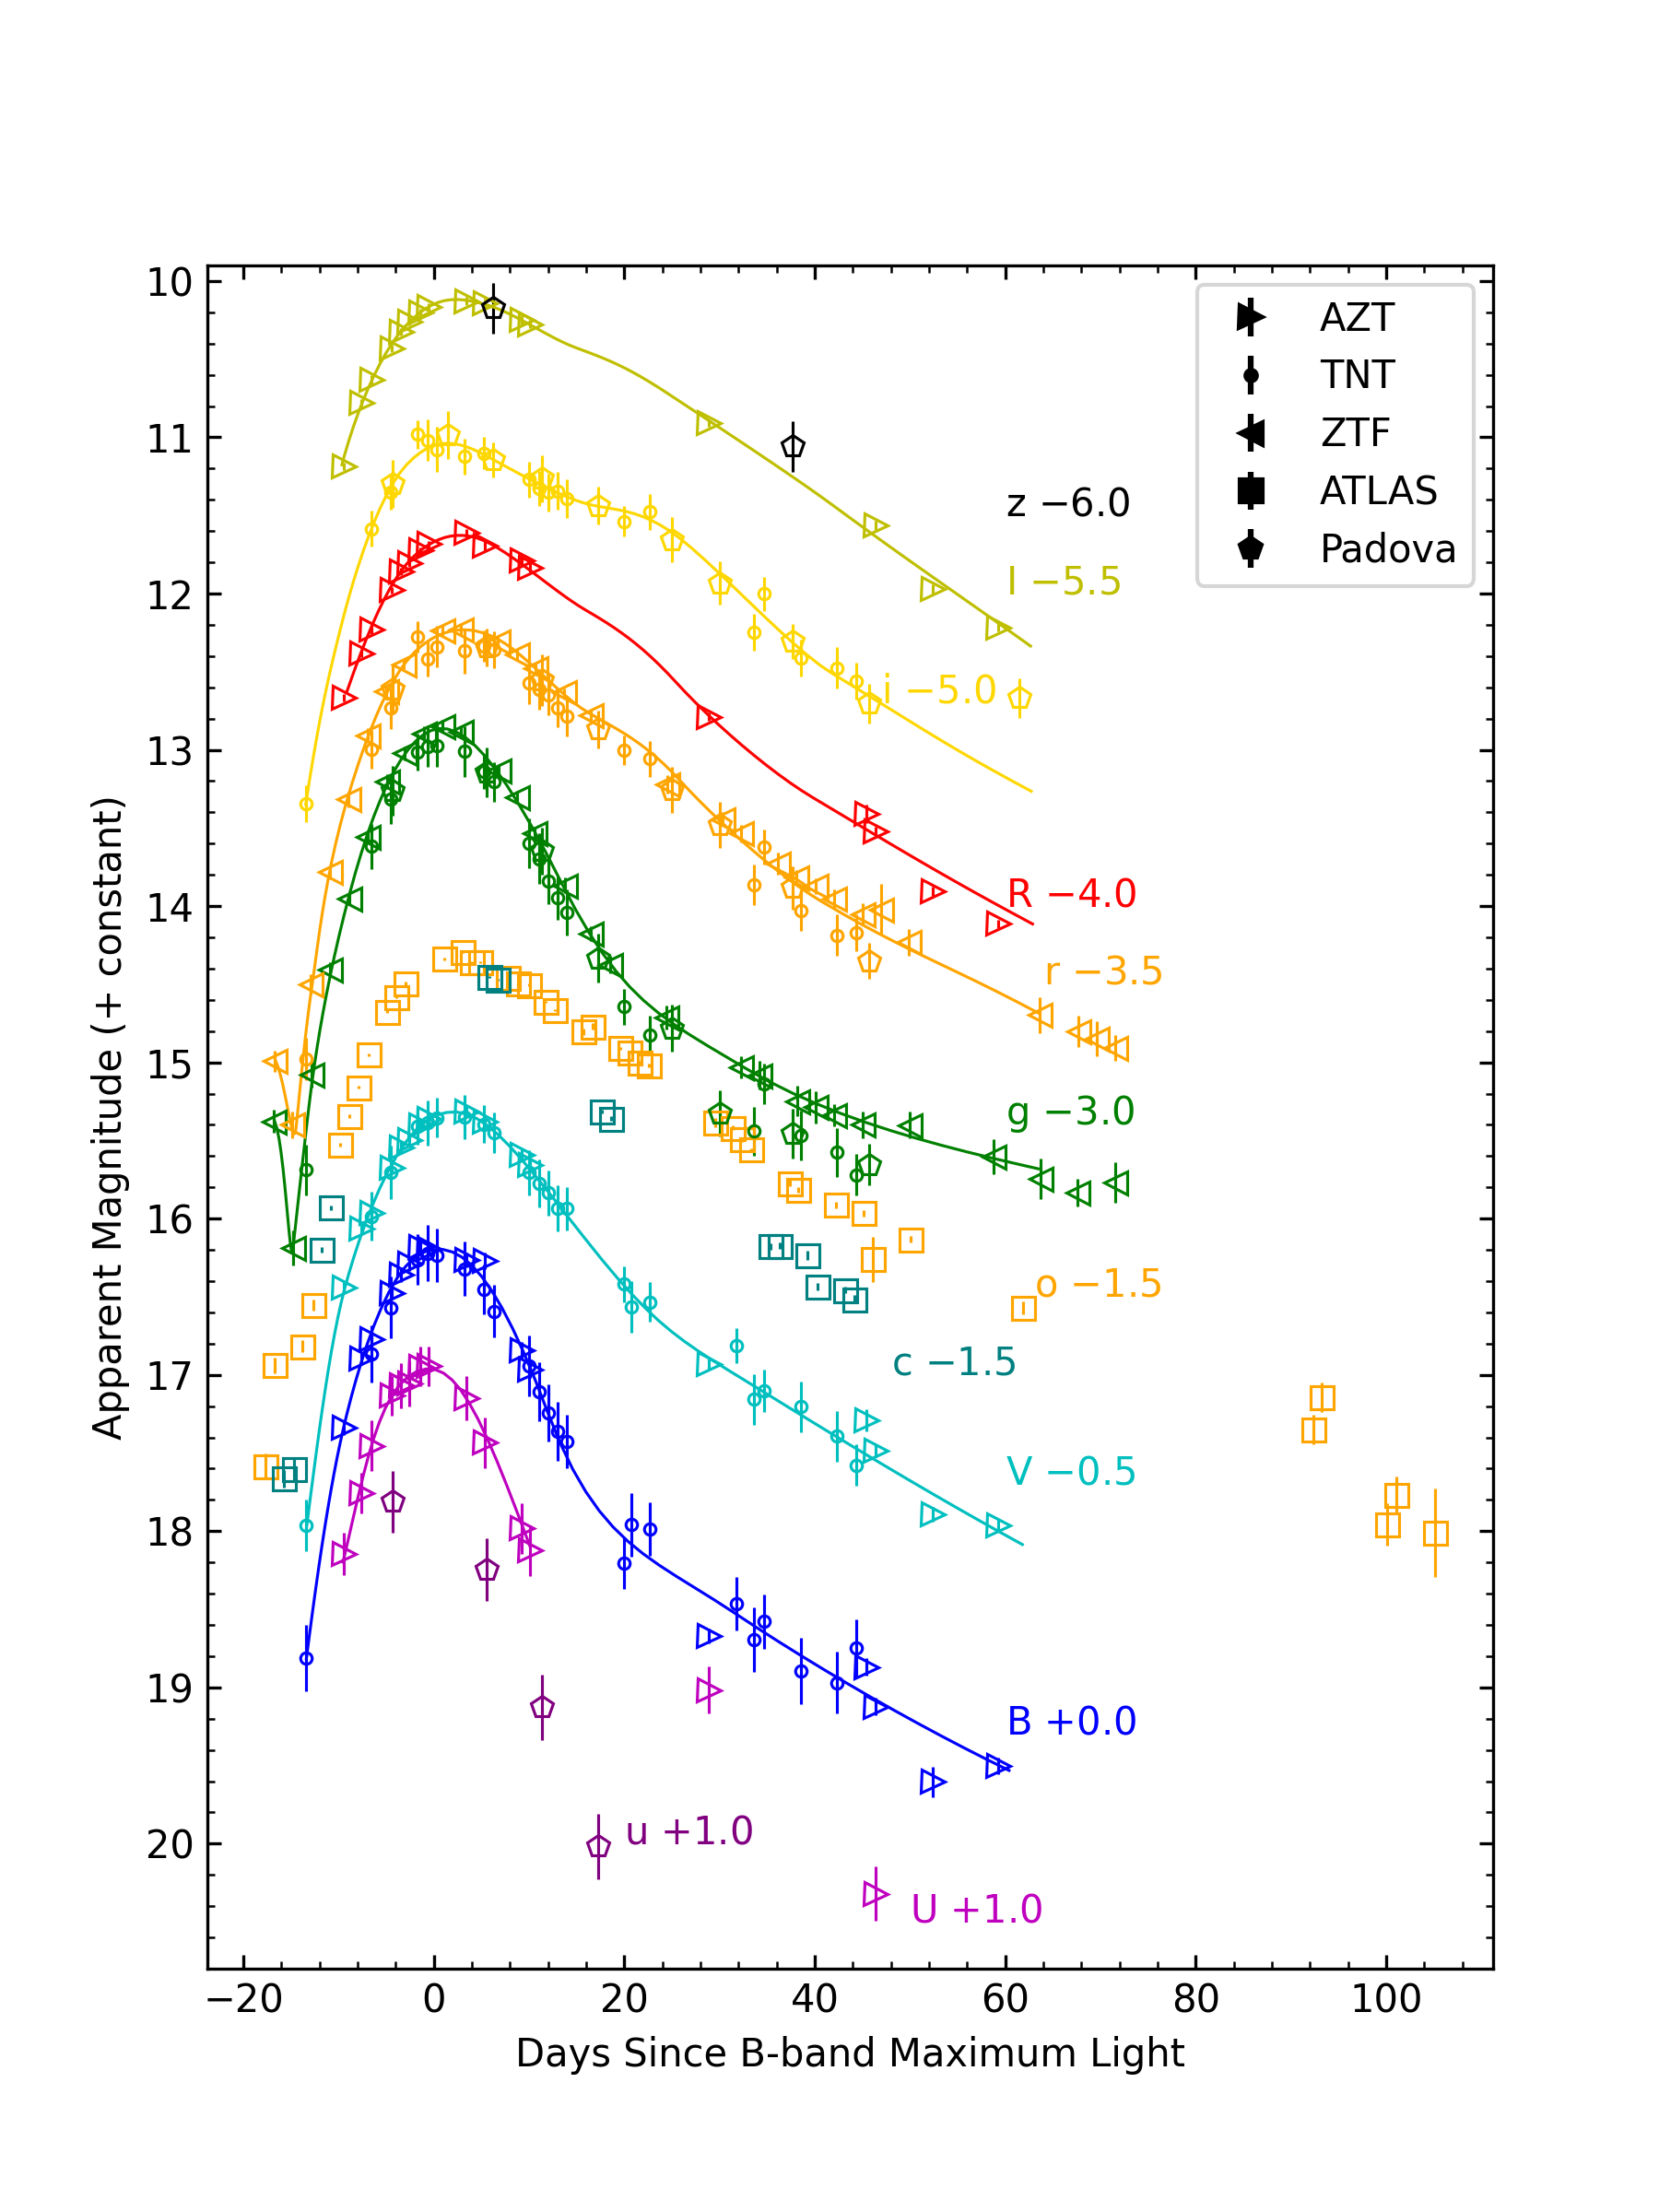
In our analysis, we also included the publicly available -band forced photometry from ZTF (Masci et al., 2019)333https://lasair-ztf.lsst.ac.uk/object/ZTF22abhrjld/ and -band (cyan, orange) forced photometry from ATLAS. These photomeric results were obtained after subtraction of the corresponding template images taken before the SN explosion, and hence are more reliable. The first observation of ATLAS was on 2022 Sep. 23.471 (MJD 59845.471), less than 1 day after the latest nondetection. Combined with the early ZTF observations which started day later, the early-time photometric evolution of SN 2022vqz can be well constrained. Figure 2 shows the multiband light curves of SN 2022vqz.
2.2 Spectroscopic Data
Our spectroscopy of SN 2022vqz covered phases from to days relative to its peak brightness. We obtained 9 spectra with BFOSC mounted on the 2.16 m telescope of the Xinglong Observatory (XLT), 5 spectra with YFOSC mounted on the Lijiang 2.4 m telescope (LJT; Fan et al., 2015) of Yunnan Observatories (YNAO), 3 spectra with the Kast spectrograph(Miller & Stone, 1994) on the 3 m Shane reflector at Lick Observatory, and 1 spectrum with AFOSC mounted on the 1.82 m Copernico Telescope of Padova. In addition, 1 spectrum was taken of the host galaxy MCG+05-03-011 with XLT+BFOSC. The Lick/Kast spectra were taken with the slit oriented along the parallactic angle to minimise the effects of atmospheric dispersion (Filippenko, 1982). The journal of spectroscopic observations is shown in Table 1.
Standard IRAF routines were adopted for reduction of all the optical spectra taken by LJT, XLT, Lick 3 m Shane, and Padova 1.82 m Copernico telescopes, including bias, flat-field corrections, and removal of cosmic rays. The Copernico spectrum is reduced using a dedicated pipeline foscgui444foscgui is a graphic user interface aimed at extracting SN spectroscopy and photometry obtained with FOSC-like instruments. It was developed by E. Cappellaro. A package description can be found at http://sngroup.oapd.inaf.it/foscgui.html .. The wavelength scale was calibrated with comparison-lamp spectra, and the fluxes were calibrated with standard stars observed on the same night at similar airmasses. All spectra were further corrected for atmospheric extinction using the extinction curves obtained at each observatory, and telluric lines were also removed from the spectra.
We also included two classification spectra from the Spectroscopic Classification of Astronomical Transients (SCAT; Tucker et al. 2022; Tucker 2022) and ZTF (Maguire et al., 2022), and one spectrum taken by Las Cumbres Observatory (LCOGT; Brown et al., 2013) in our analysis. The spectral evolution of SN 2022vqz is shown in Figure 7.
3 Photometric Results
3.1 Light Curves and Photometric Properties
Figure 2 shows the multiband light curves of SN 2022vqz. The data reveal an early-time peak that is clearly separated from the main peak. The SN brightness increased by mag in the band in the first day after discovery, reaching an early peak and then dropping to a minimum in another few days, followed by a slow rise to maximum light. No secondary peak or significant shoulder can be seen in the and bands, consistent with the light curves of subluminous SNe Ia such as the 02es-like or 91bg-like objects.
Applying a polynomial fit to the -band light curve around maximum light indicates that SN 2022vqz reaches the peak on MJD , with mag. We use the time of maximum as the reference epoch throughout this paper. The decline in the first 15 days after peak is measured as mag, slightly fast among normal SNe Ia.
The distance modulus of SN 2022vqz can be estimated based on the redshift of its host galaxy, which is in the Hubble flow: after correcting for the solar peculiar velocity. Adopting a cosmological model with , , and (Riess et al., 2022), the corresponding distance modulus is mag. With this value, the absolute peak magnitude of SN 2022vqz is mag, after accounting for a Galactic extinction of mag (Schlafly & Finkbeiner, 2011). The extinction of the host galaxy is assumed to be negligible, considering that the SN is offset from the centre of the host and no Na I D absorption can be recognised in the SN spectra.
3.2 Comparison of Light and Colour Curves
Figure 3 shows the location of SN 2022vqz in the – diagram, together with those of some comparison objects including normal SNe Ia. Its low peak luminosity and moderate decline rate fit into the category of 02es-like objects. One may note that with the discovery of some events in recent years, especially SN 2019yvq, the gap between 02es-like objects and normal SNe Ia now seems to be filled by a continuous distribution. However, the absolute magnitude of SN 2019yvq is highly uncertain owing to large discrepancies (over 2 mag) of its host-galaxy extinction estimates from different methods (Burke et al., 2021). In Figure 3 we adopt the value reported by Burke et al. (2021).
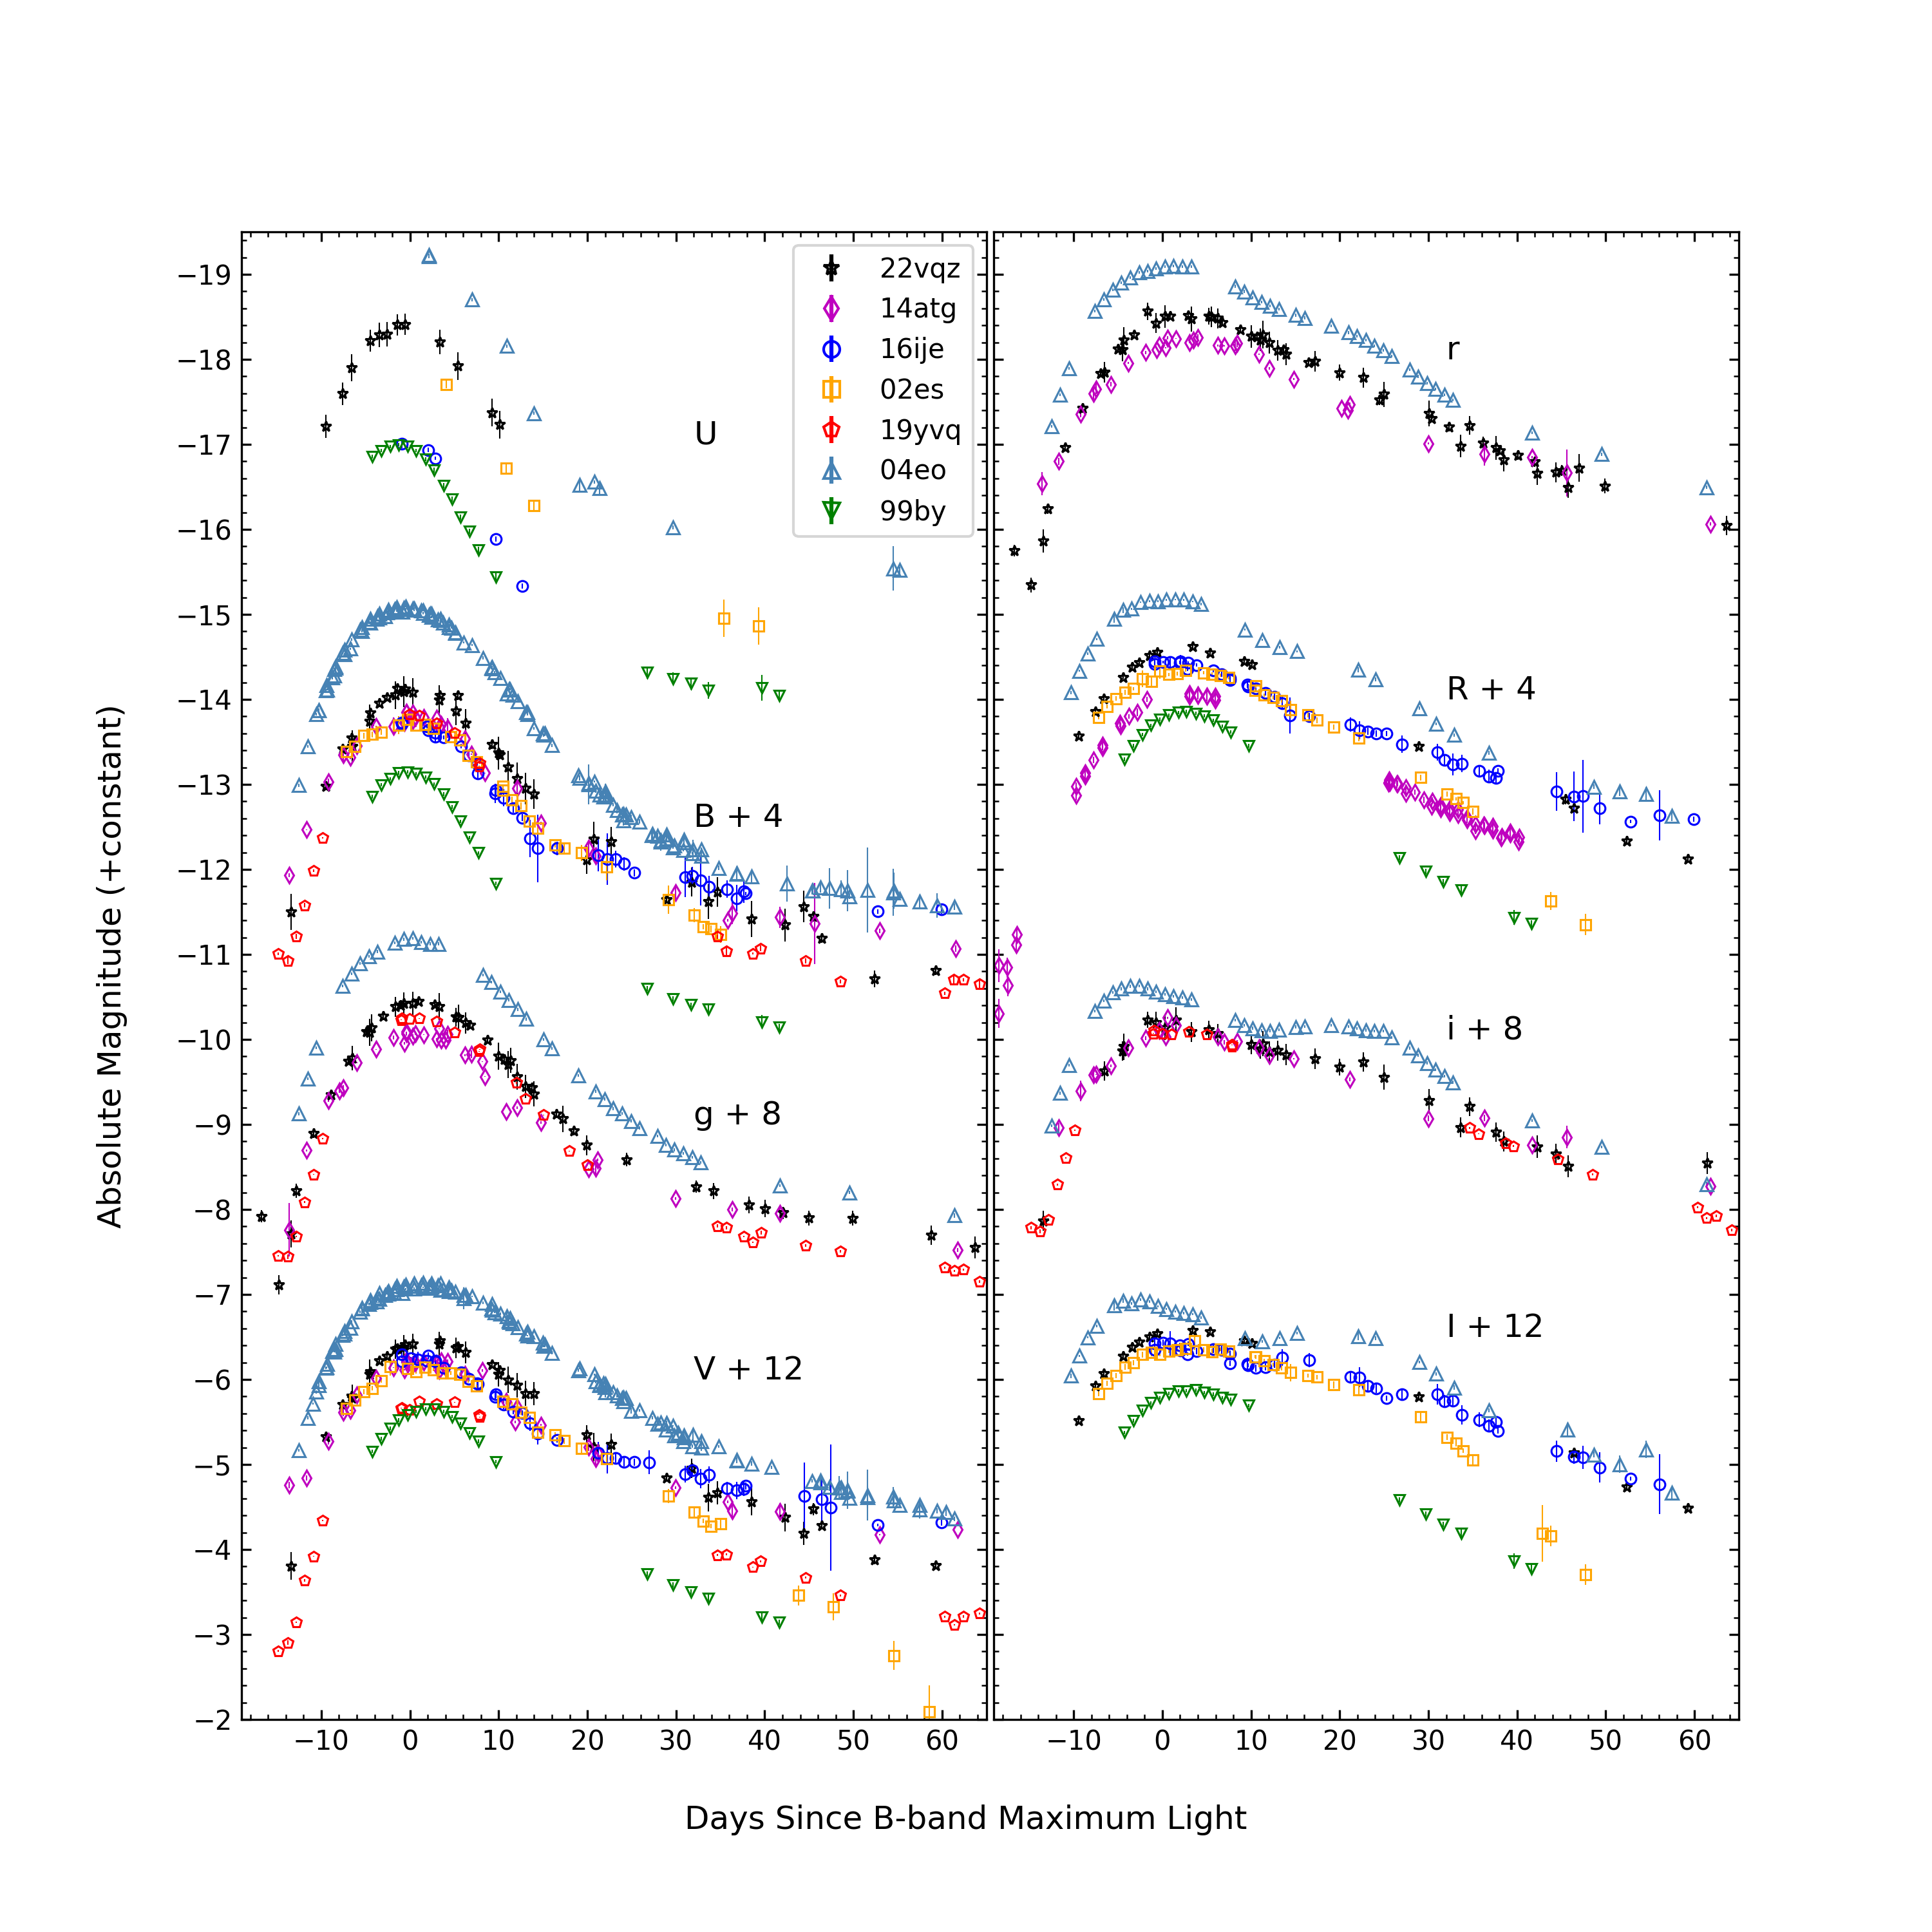
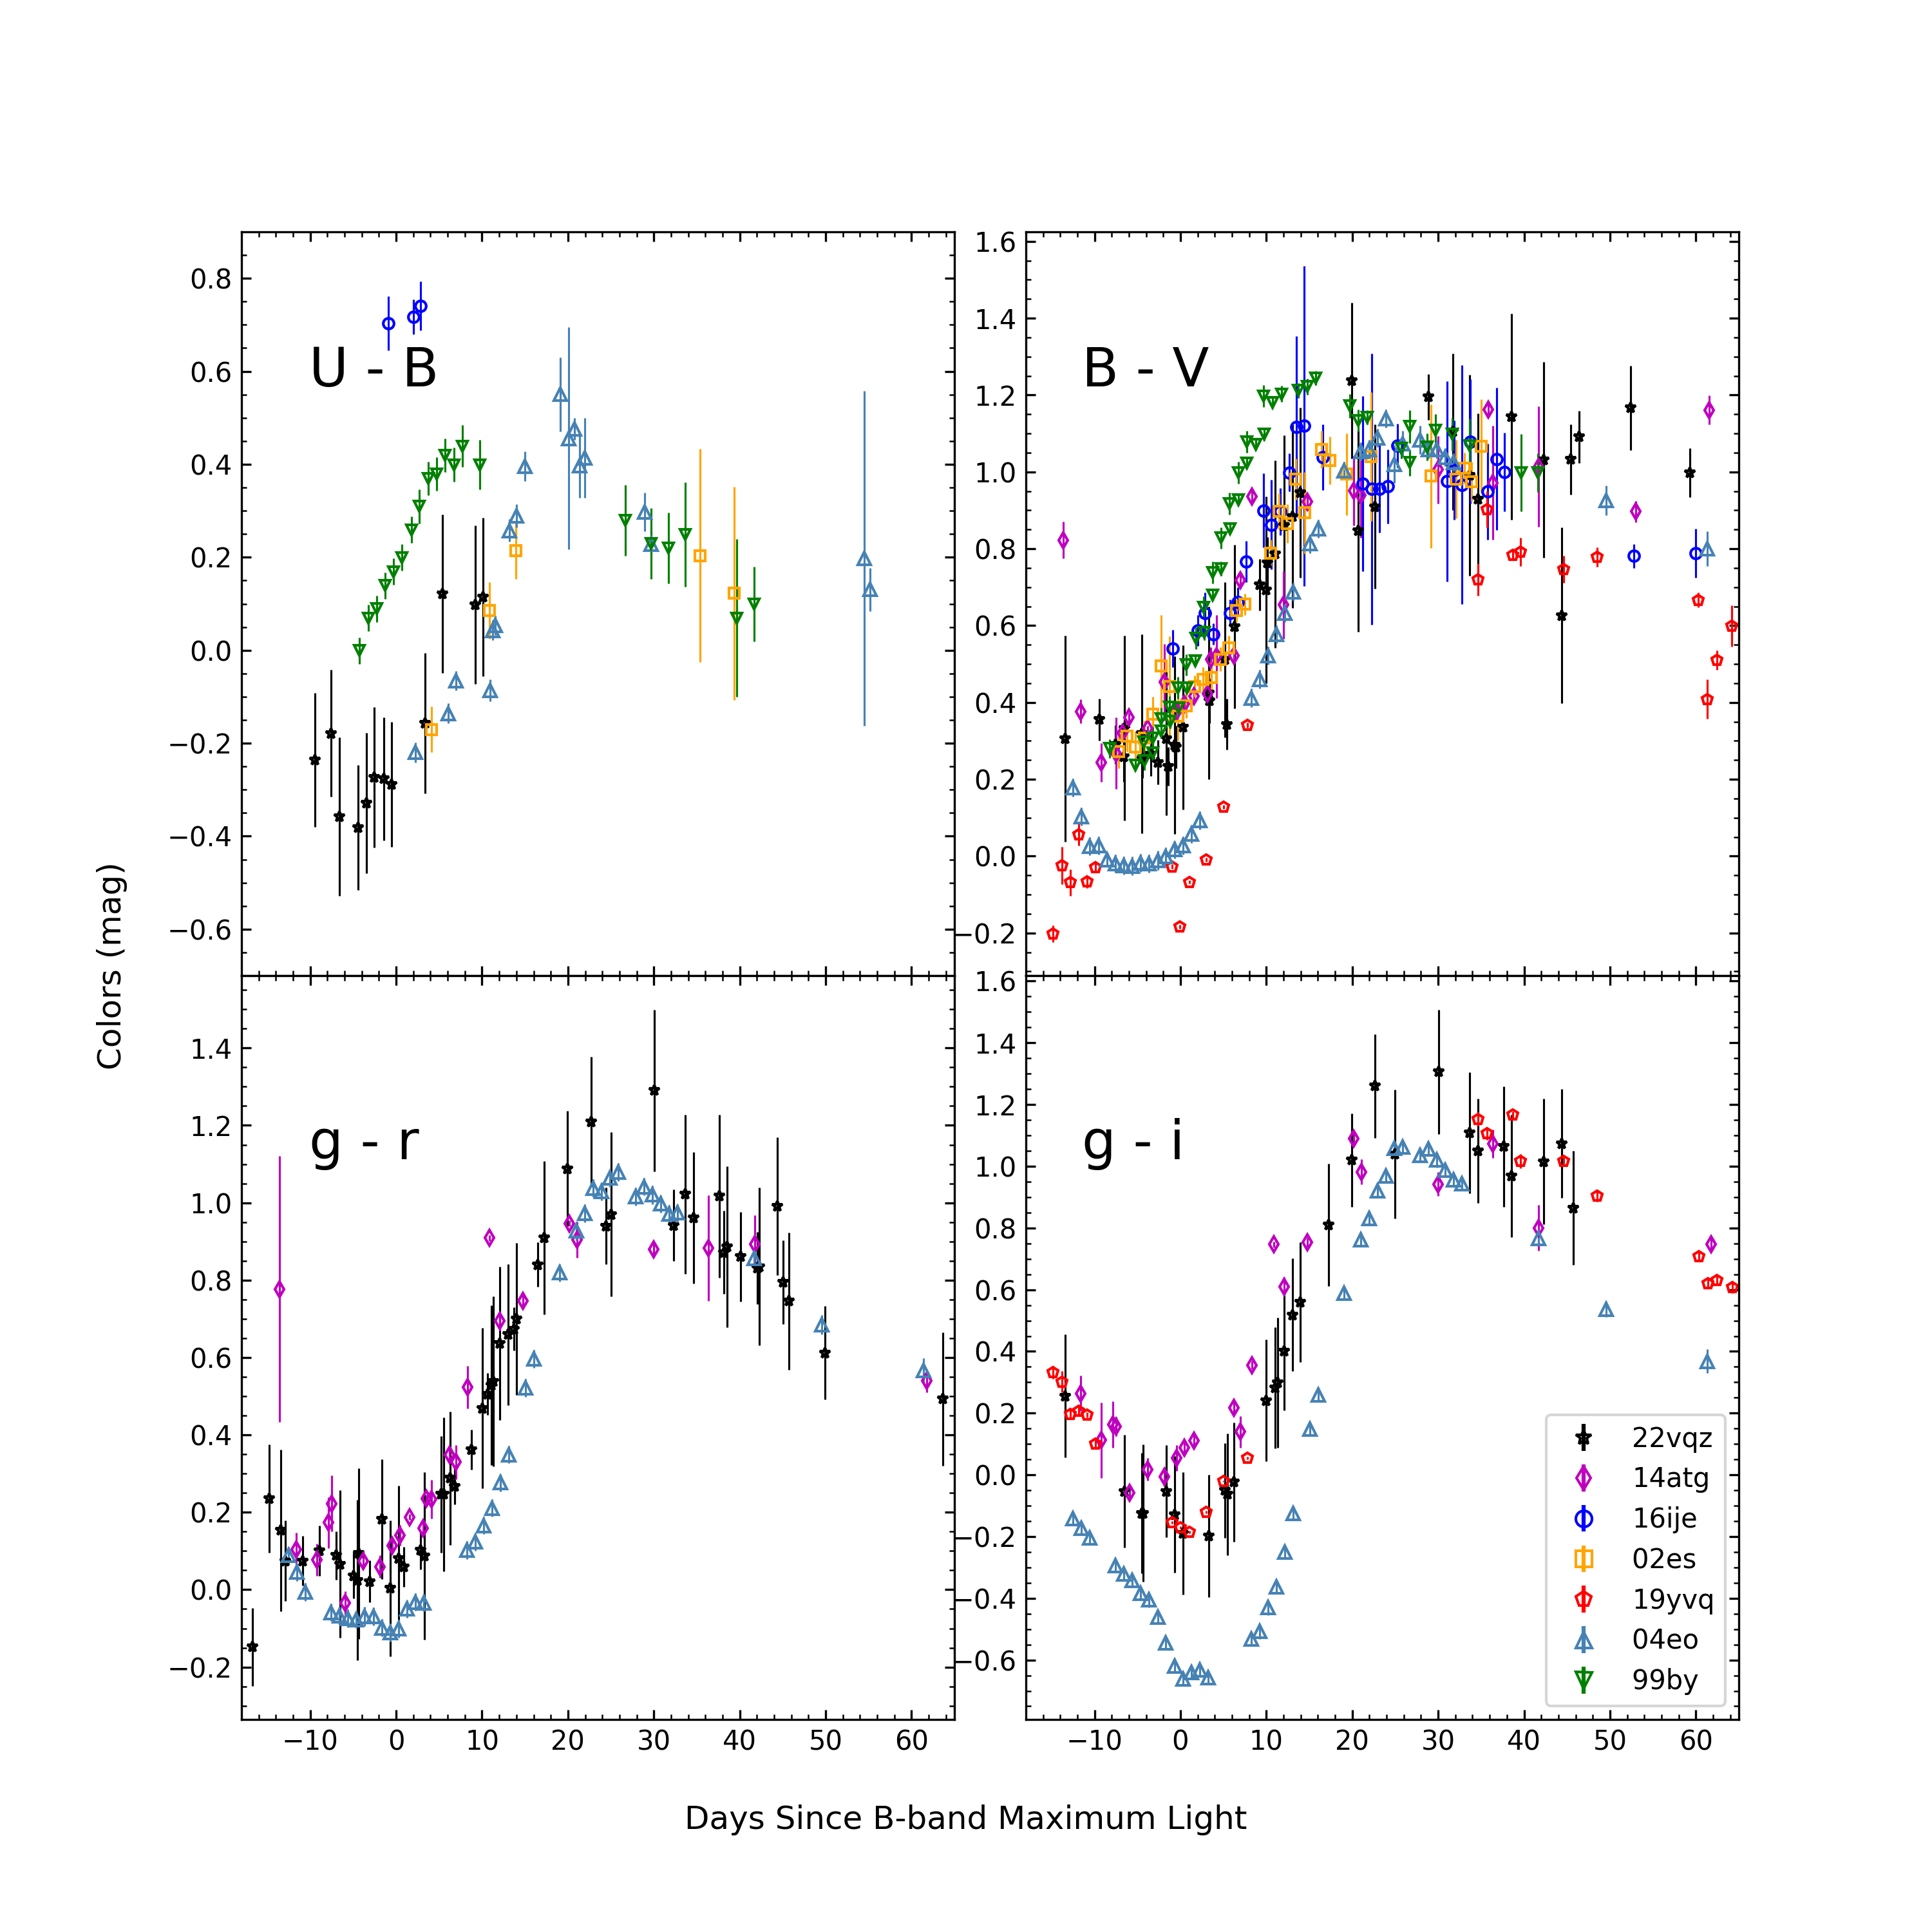
We further compare in Figure 4 the absolute and light curves of SN 2022vqz with those of some well-observed SNe Ia, including 02es-like SN 2002es (Ganeshalingam et al., 2012), SN 2016ije (Li et al., 2023), SN 2019yvq (Burke et al., 2021), iPTF14atg (Cao et al., 2015), 91bg-like SN 1999by (Garnavich et al., 2004), and the normal SN 2004eo (Pastorello et al., 2007) but with a similar (1.46 mag) as SN 2022vqz.
The light-curve morphology of SN 2022vqz is overall similar to that of iPTF14atg and SN 2019yvq. We notice that SN 2022vqz and other 02es-like objects do not exhibit a rapid decline after month when compared to SN 2002es. This indicates an additional peculiarity intrinsic to SN 2002es that is still unexplained (Taubenberger, 2017). The absolute magnitudes of SN 2022vqz are slightly brighter than all objects in the 02es-like comparison sample, while they are all bounded by subluminous 91bg-like SN 1999by and normal SN 2004eo. Note that in Figure 4 we assumed zero host extinction for all 02es-like SNe. SN 2019yvq appears not to be brighter than other 02es-like objects without applying a significant host extinction correction. Some evolution features seen in SN 2016ije, like slower and decline rates after days and strong line blanketing in the band, are absent in SN 2022vqz. These features can be interpreted as the result of a broader line-forming region and a smaller total amount of iron-group elements (IGEs) distributed in the line of sight. A more extended line-forming region could result in stronger line blanketing at early phases, while less IGEs can reduce their absorptions in the spectra, especially at short wavelengths, thereby providing more-luminous late-time fluxes and flatter light curves in (Li et al., 2023). In contrast, SN 2022vqz should have a less extended line-forming region for IGEs, suggesting a more stratified and less mixed IGE distribution.
Figure 5 shows the comparison of the colour evolution, with all data corrected for Galactic extinction. Overall, the colour curves of SN 2022vqz show a close resemblance to those of other 02es-like SNe, while it seems to have a more extended and rapid evolution in relative to iPTF14atg. In , SN 2022vqz shows slower evolution than SN 1999by, and it is –0.3 mag redder than SN 2004eo before days. Immediately after the explosion, SN 2022vqz appears exceptionally blue, mag at days from maximum brightness, and it then evolves rapidly to a red peak two days later. This trend is coincident with the declining part of the early peak of SN 2022vqz, suggesting a blue colour of the early peak luminosity.
3.3 Time of Explosion
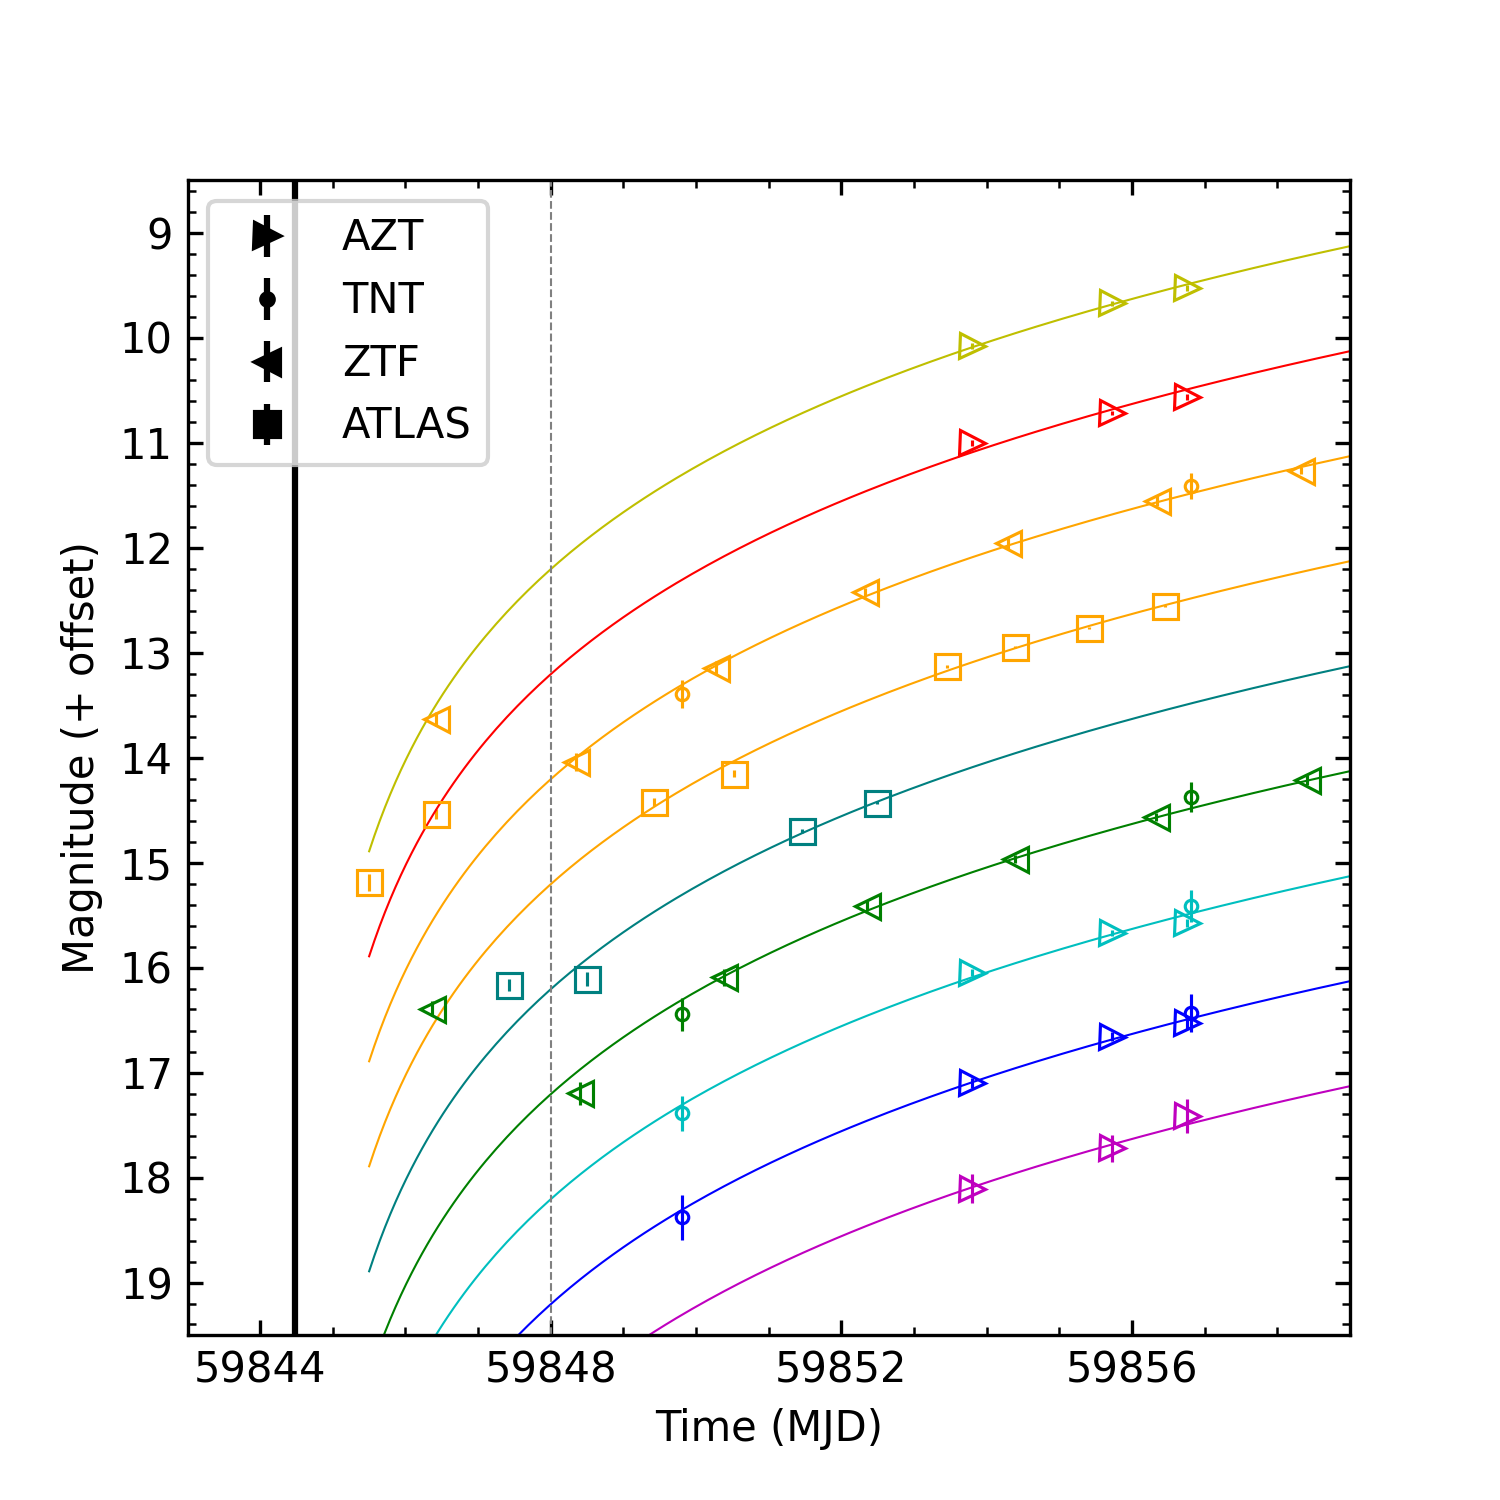
An accurate explosion time estimation is crucial for further analysis of the explosion physics of SN 2022vqz. A nondetection was reported day before the discovery, indicating that this SN exploded not long before the first observations. The time of explosion can be estimated from the early phase of the multiband light curves by adopting a simple “fireball” model (Riess et al., 1999; Nugent et al., 2011). Assuming the early-time SN can be described by a photosphere expanding at a constant velocity, its luminosity should be proportional to , where is the time of explosion and should be same for all bands.
Note that SN 2022vqz shows an early peak which lasts for days since time of discovery and cannot be fitted by the fireball model. To avoid its influence, photometric data before MJD 59848 are excluded from the fit. The fitting method follows that described by Xi et al. (2022), and data earlier than 5 days before maximum are used. The fitting procedure gives , which coincides with the last nondetection time, MJD 59844.484. Given the uncertainty of , the SN may have either not yet exploded or be too dim for detection at the latest time of nondetection. The rise time is thereby given as days. Figure 6 shows the fitting result.
3.4 Bolometric Light Curve and 56Ni Mass
Based on the -band photometry, we adopted SNooPy2 (Burns et al., 2011, 2014) to construct the bolometric light curve of SN 2022vqz. Since SN 2022vqz is a subluminous object, we use spectral energy distribution (SED) templates of subluminous 91bg-like SNe Ia (Nugent et al., 2002) for flux integration.
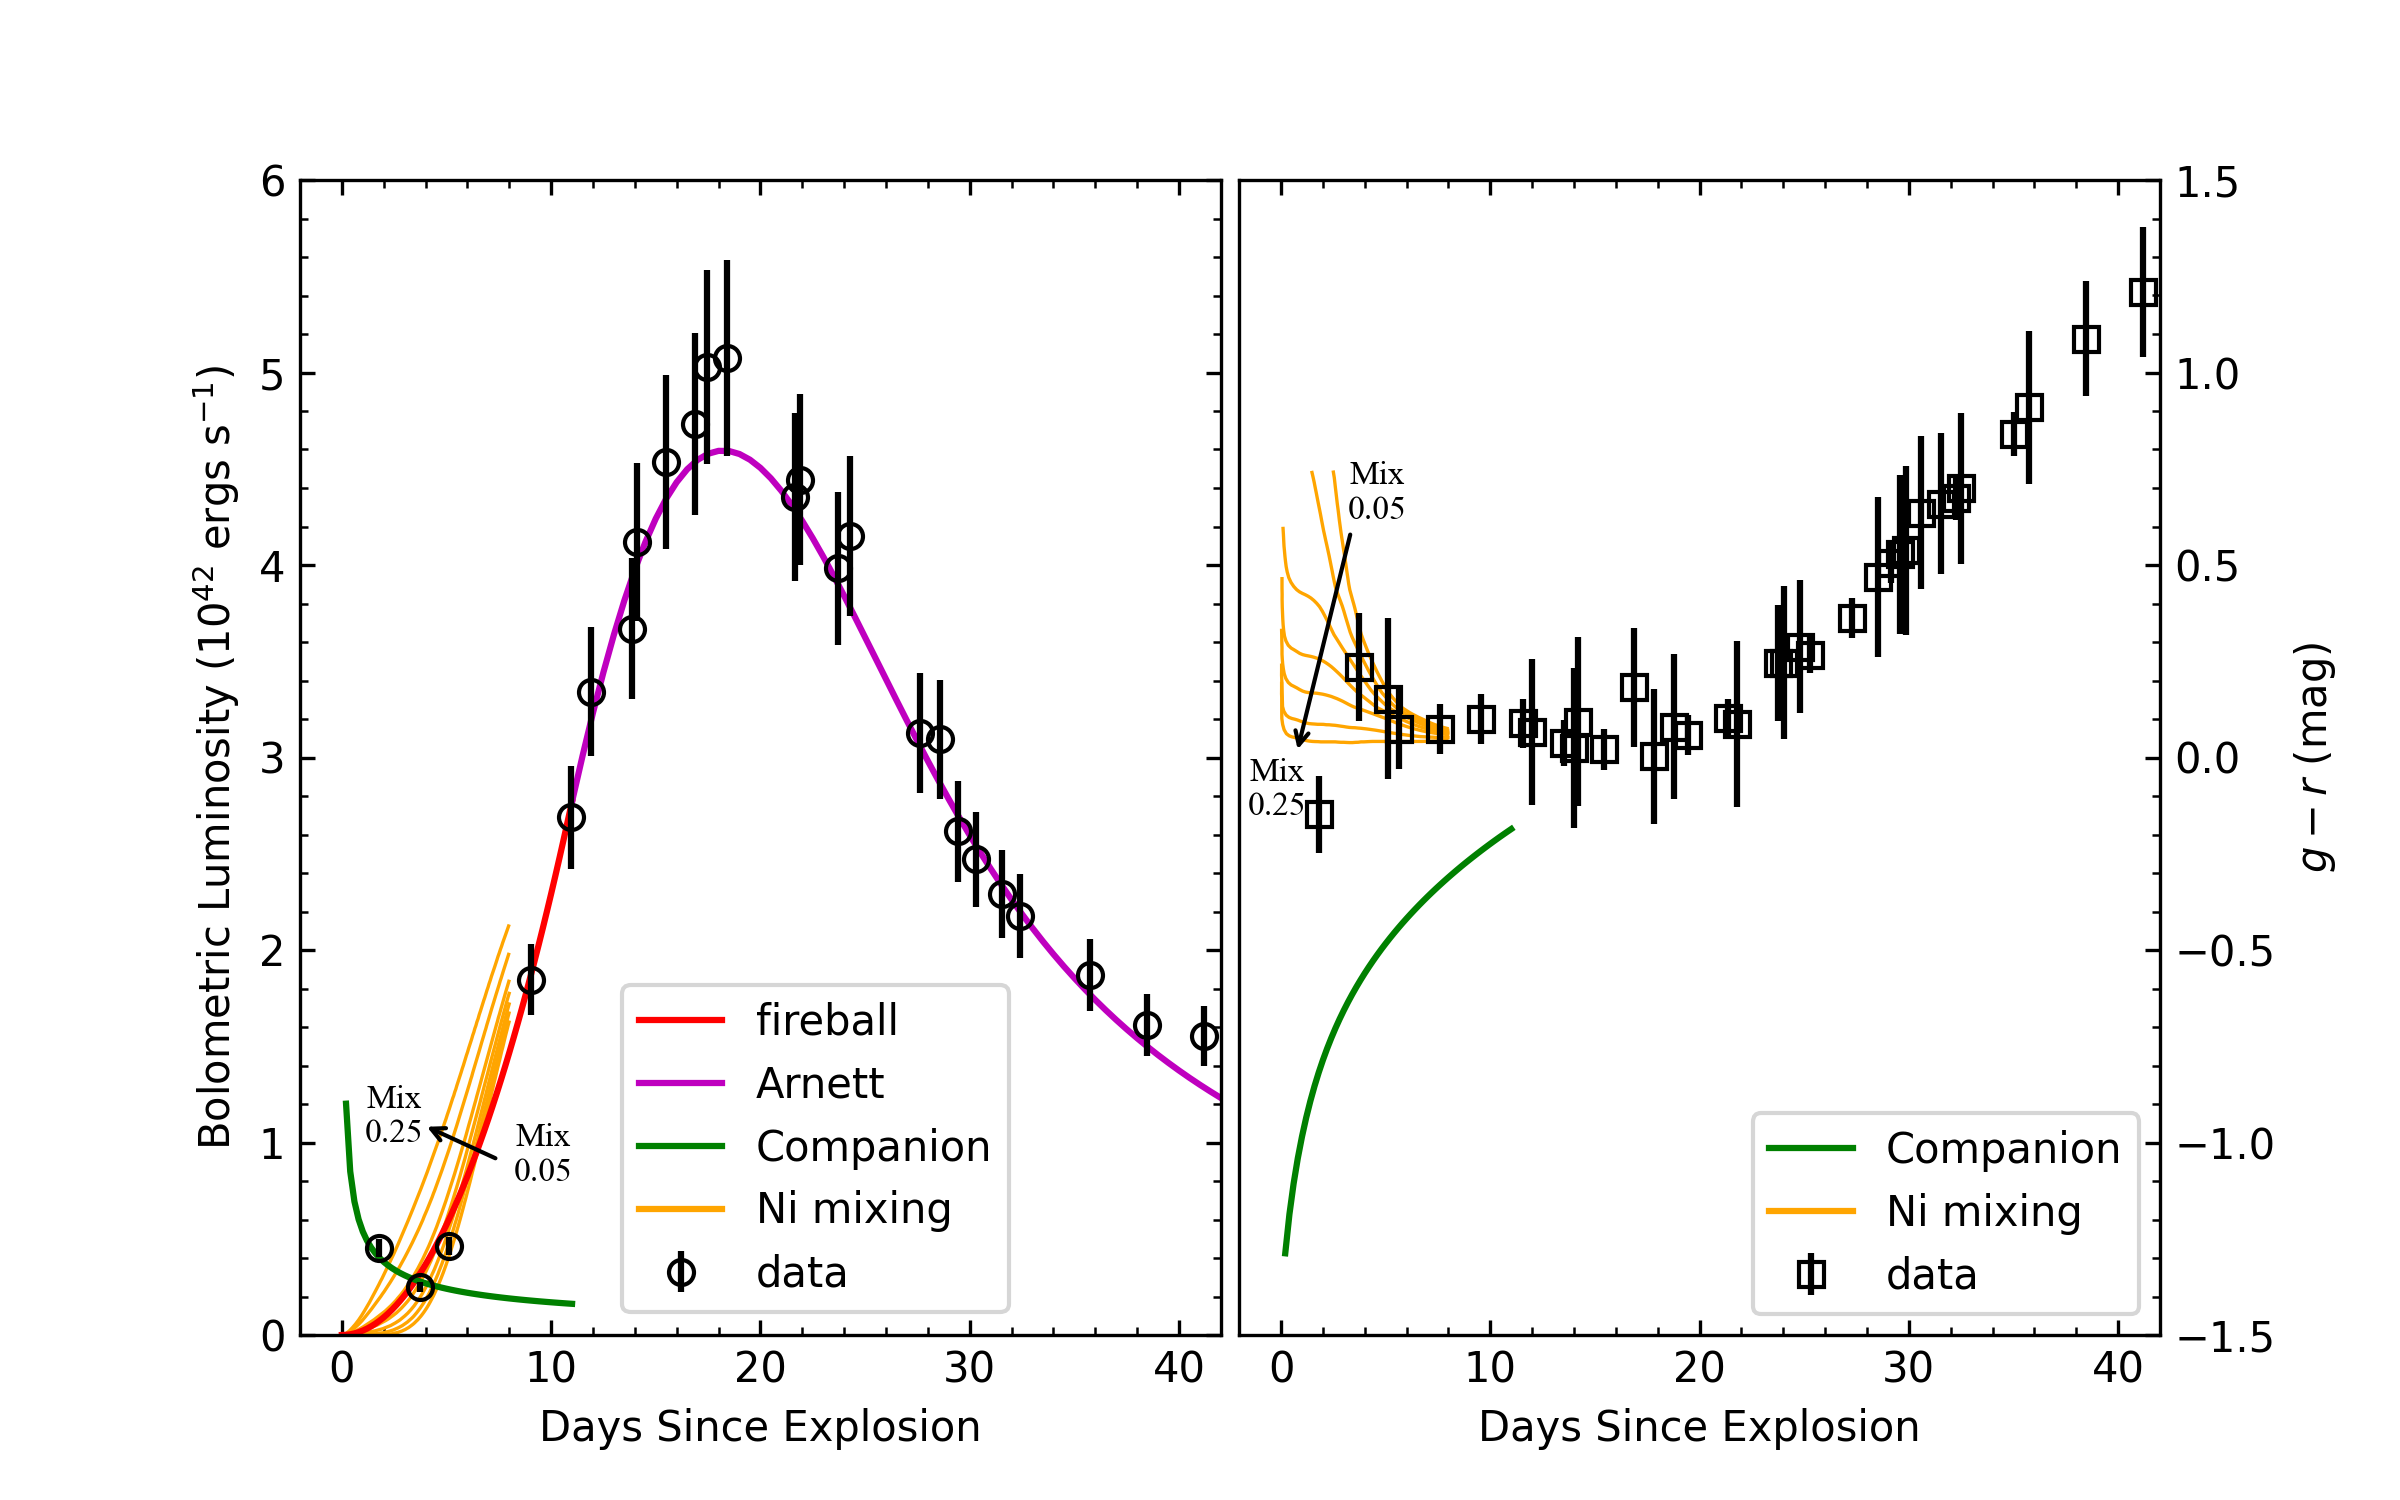
The bolometric light curve is found to reach its peak at on MJD 59863.3. According to Arnett’s rule (Arnett, 1982; Stritzinger & Leibundgut, 2005), the mass of synthesised radioactive 56Ni can be inferred as . A more robust way for Ni mass estimation is to fit the full bolometric light curve using the radiation diffusion model of Arnett (1982) (see also Chatzopoulos et al., 2012, 2013). The best fit yields the explosion time , the initial mass of radioactive nickel , the light-curve timescale , and the gamma-ray leaking timescale as (respectively) MJD , M⊙, days, and days. The explosion time inferred from the bolometric light-curve fit is about 4 days later than that from the early-time light curve, and well positioned at the minimum light between the early and main peaks, indicating a delay between the SN explosion and the emergence of the radioactive nickel-powered light curve. Such a delay was predicted as a “dark phase” (Piro & Nakar, 2013; Piro & Morozova, 2016) caused by the location of the radioactive 56Ni deep within the ejecta. This delay will also result in a shorter rise time, hence a lower 56Ni mass estimation.
The early peak bolometric luminosity was estimated as . However, this value may be inaccurate since it only uses the ZTF -band photometry, and the rest of the flux was extrapolated from the template SED.
4 Spectroscopic Results
4.1 Spectral Evolution
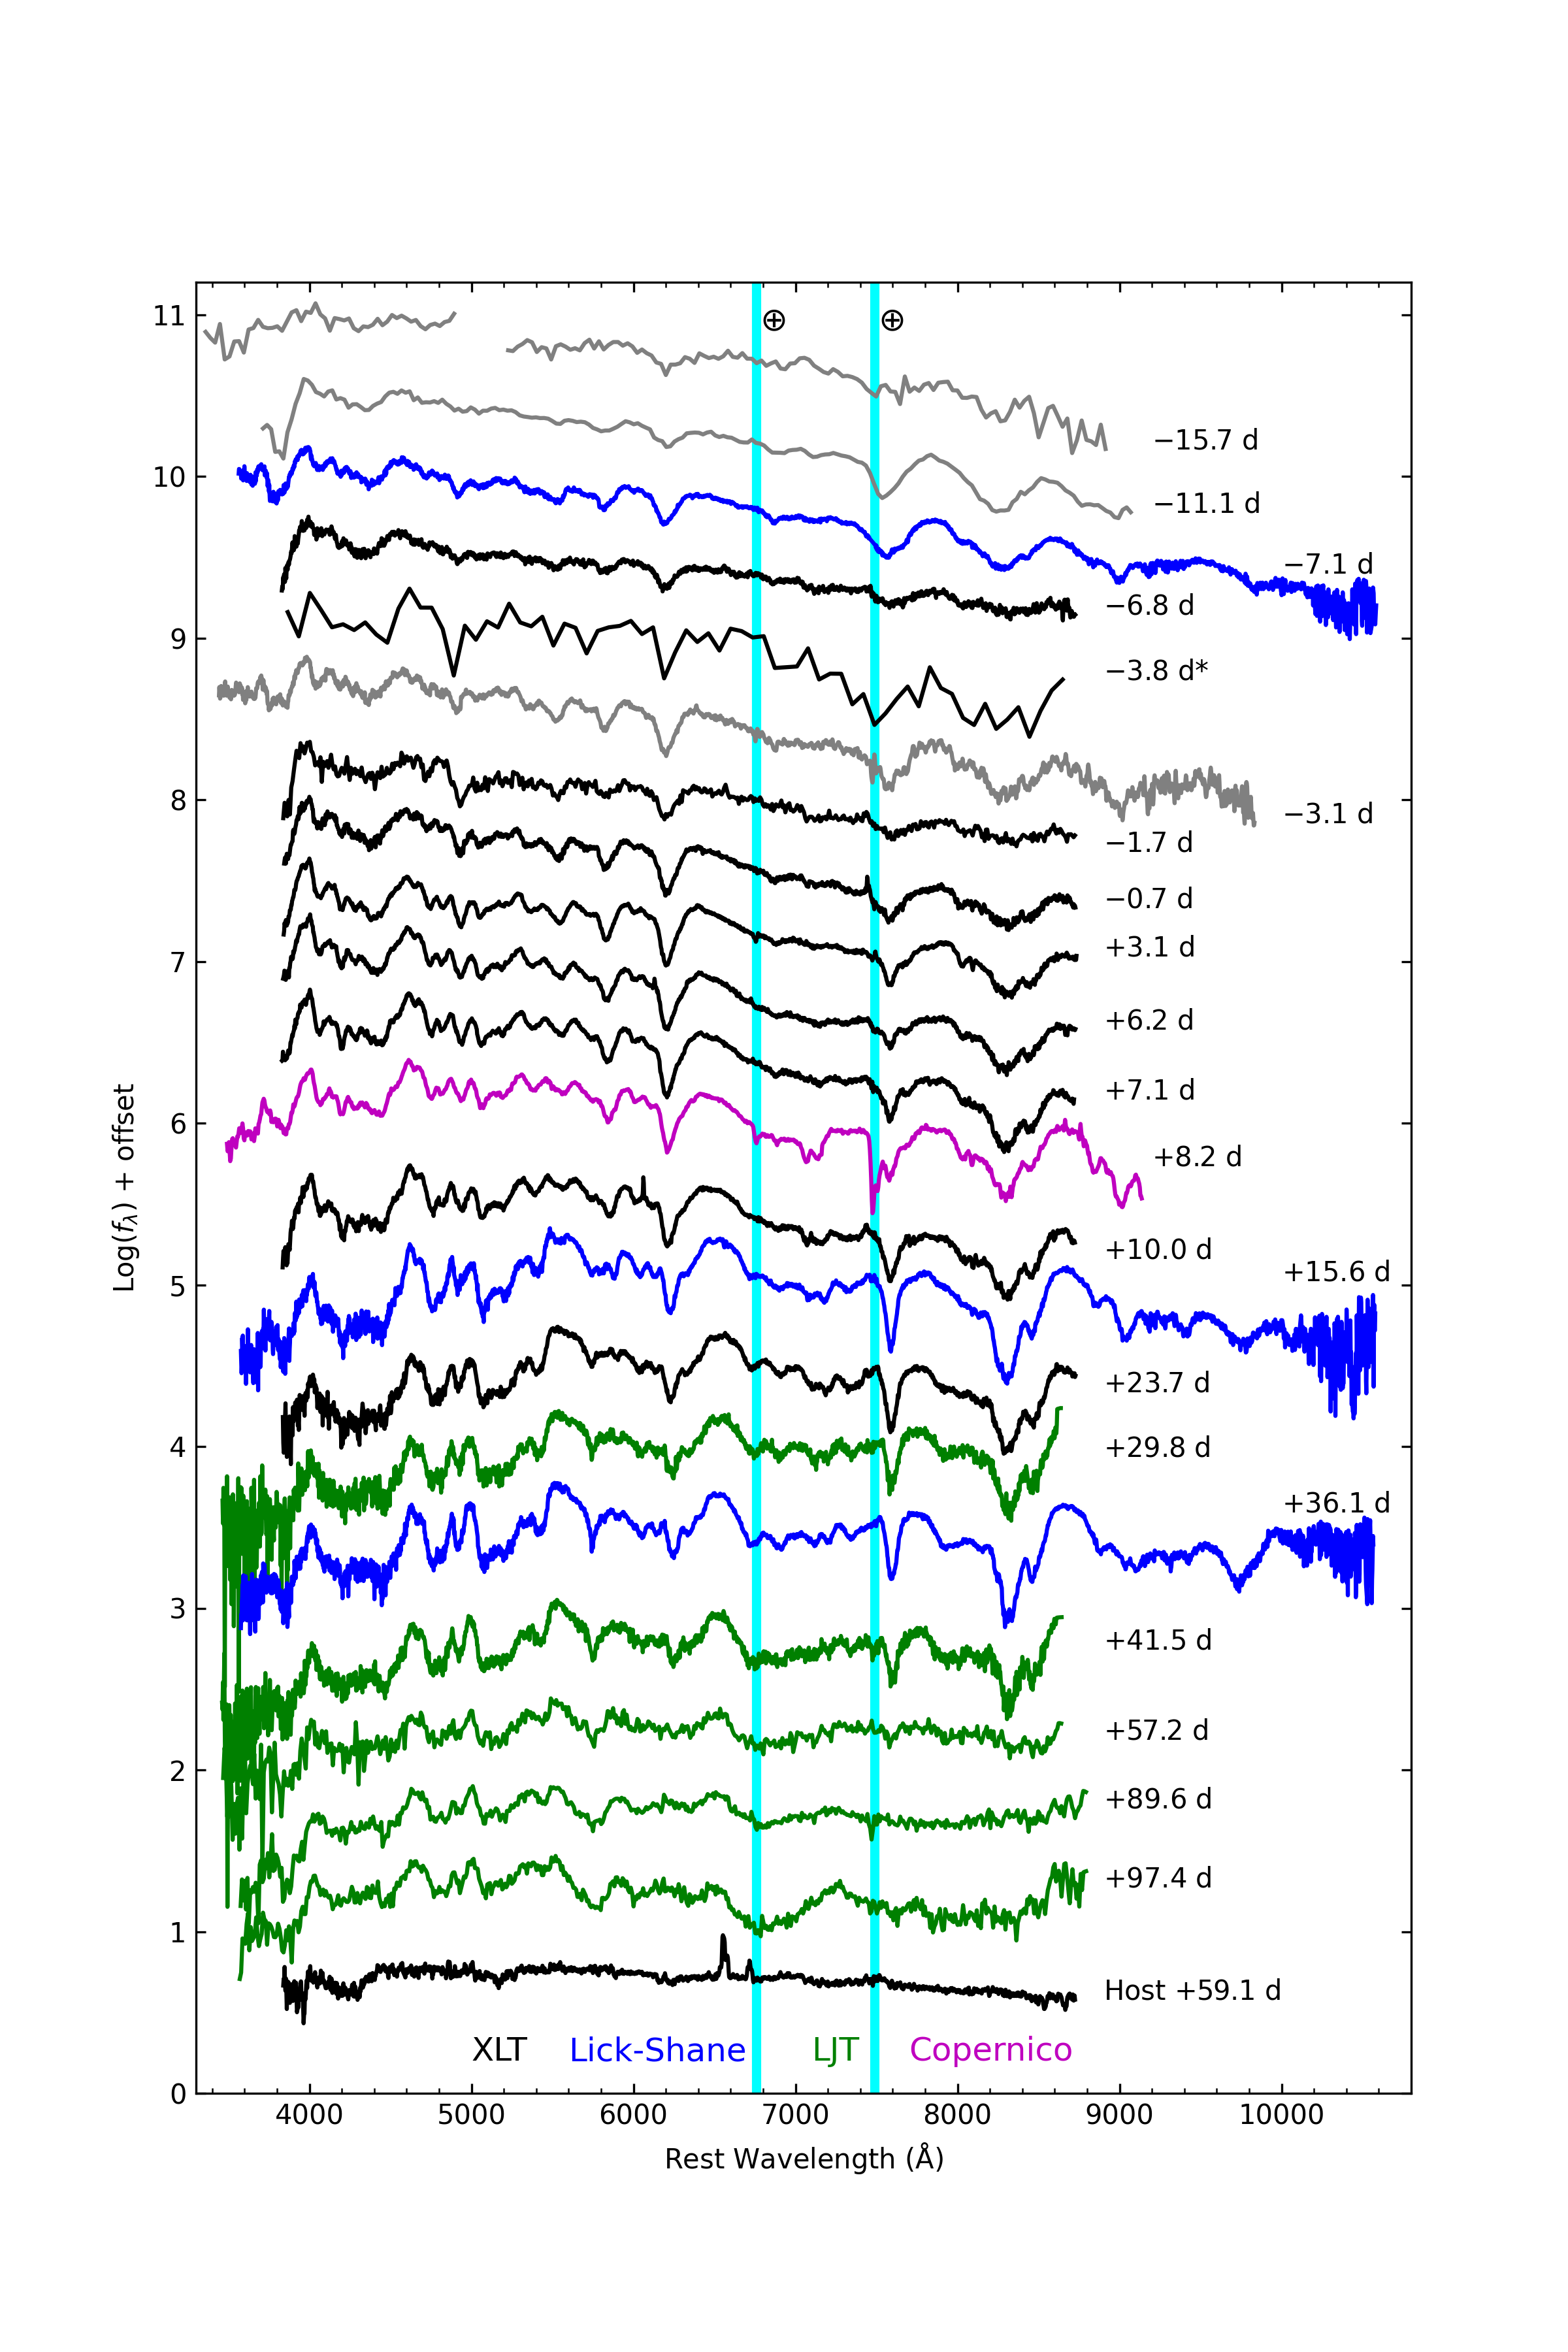
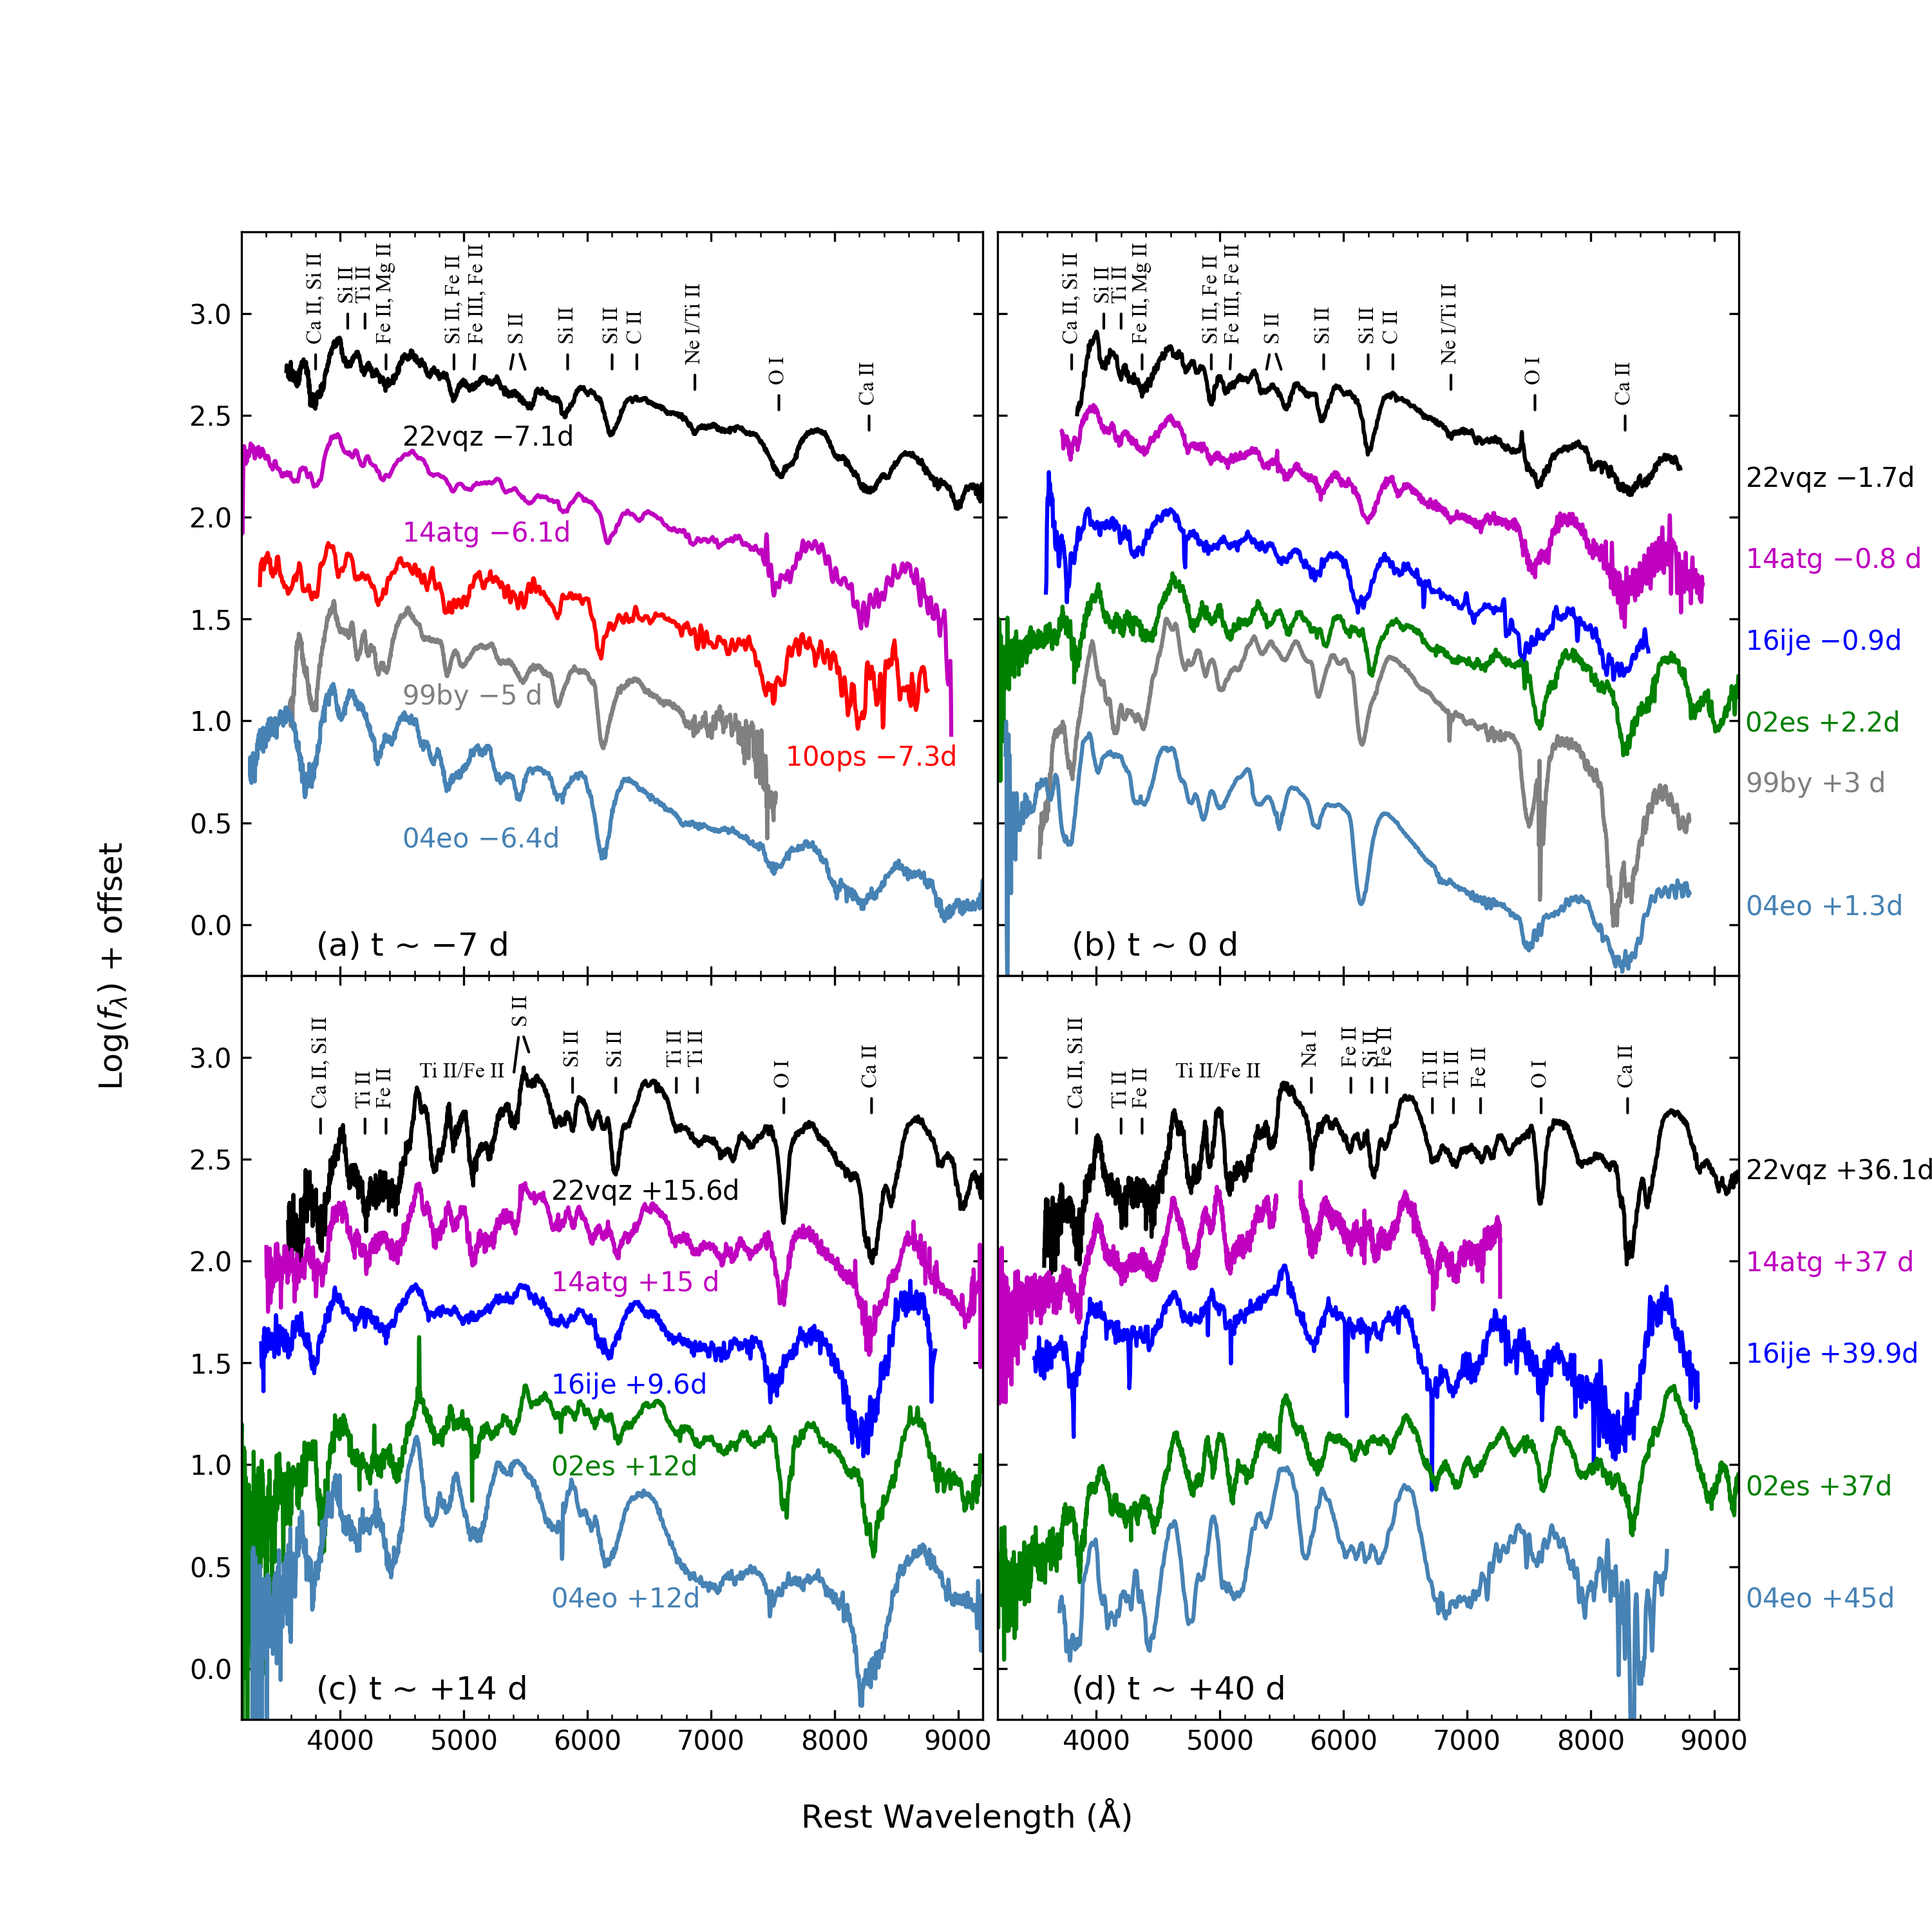
Figure 7 shows the spectral evolution of SN 2022vqz, spanning from days to days relative to maximum, along with a spectrum of the host galaxy. The spectral evolution generally exhibits some common properties of subluminous SNe Ia. The Si II 5972 and O I 7774 absorptions are relatively prominent around maximum light, implying a low ejecta temperature and a significant amount of unburnt materials. We measured the equivalent width () of the Si II 6355 and 5972 features in the day spectrum: Å and Å. These values make SN 2022vqz an extreme object in the “cool” group proposed by Branch et al. (2006). As explained by Branch et al. (2006), there is a temperature threshold of –8000 K (Hoeflich et al., 1993; Höflich et al., 2002), below which the line optical depth will abruptly change owing to variations in key ionisation ratios, so the “cool” objects can be well separated from normal ones in the – plane. The equivalent width of O I 7774 absorption in the same spectrum is measured to be Å, significantly higher than those in normal SNe Ia ( Å; Zhao et al. 2016). In Figure 8, the spectroscopic properties of SN 2022vqz are compared with those of other subluminous SNe Ia, including 02es-like objects iPTF14atg (Cao et al., 2015), PTF10ops (Maguire et al., 2011), SN 2002es (Ganeshalingam et al., 2012), and SN 2016ije (Li et al., 2023). A 91bg-like object SN 1999by (Garnavich et al., 2004) and the normal SN Ia 2004eo (Pastorello et al., 2007) are also included for comparison.
At days (Figure 8a), the spectrum of SN 2022vqz is characterised by broad P Cygni lines of IMEs typical among SNe Ia: the Si II 6355 and 5972 absorptions, the “W"-shaped S II feature around 5400 Å, and deep absorptions of O I 7774 and the Ca II near-infrared (NIR) triplet. The overall morphology is quite similar to that of iPTF14atg. However, no C II 6580 is detectable in SN 2022vqz, while it is strong in iPTF14atg. The weaker features of Si II and Fe II around 5000 Å are narrower and hence less blended compared to PTF10ops or SN 2004eo.
Near maximum light (Figure 8b), all 02es-like objects show an absorption feature of C II 6580, except SN 2022vqz. The IGE lines around 5000 Å are deeper and narrower than in iPTF14atg or SN 2016ije, indicating a more concentrated density distribution of the ejecta. The Ti II feature near 4200 Å, which is characteristic of subluminous SNe Ia, is less developed than those of SN 2002es and 91bg-like SN 1999by at this epoch, and is more similar to iPTF14atg.
By 14 days (Figure 8c), the spectra of SN 2022vqz resemble those of iPTF14atg and SN 2002es. The Ti II lines have developed in the spectrum of SN 2022vqz, notably the deep trough around 4200 Å and the W-shaped feature around 6800 Å. These absorptions are less prominent or absent in SN 2016ije or SN 2004eo. The O I and Ca II lines remain strong, but narrower than those seen near maximum light.
At days after maximum light (Figure 8d), the spectra are dominated by IGE lines. Si II 6355 is still pronounced in SN 2022vqz, while it is contaminated by the Fe II lines and hardly noticeable in other objects of the comparison sample. The Si II 5972 absorption is also replaced by Na I absorption, while the O I and Ca II lines are still persistent in the spectra.
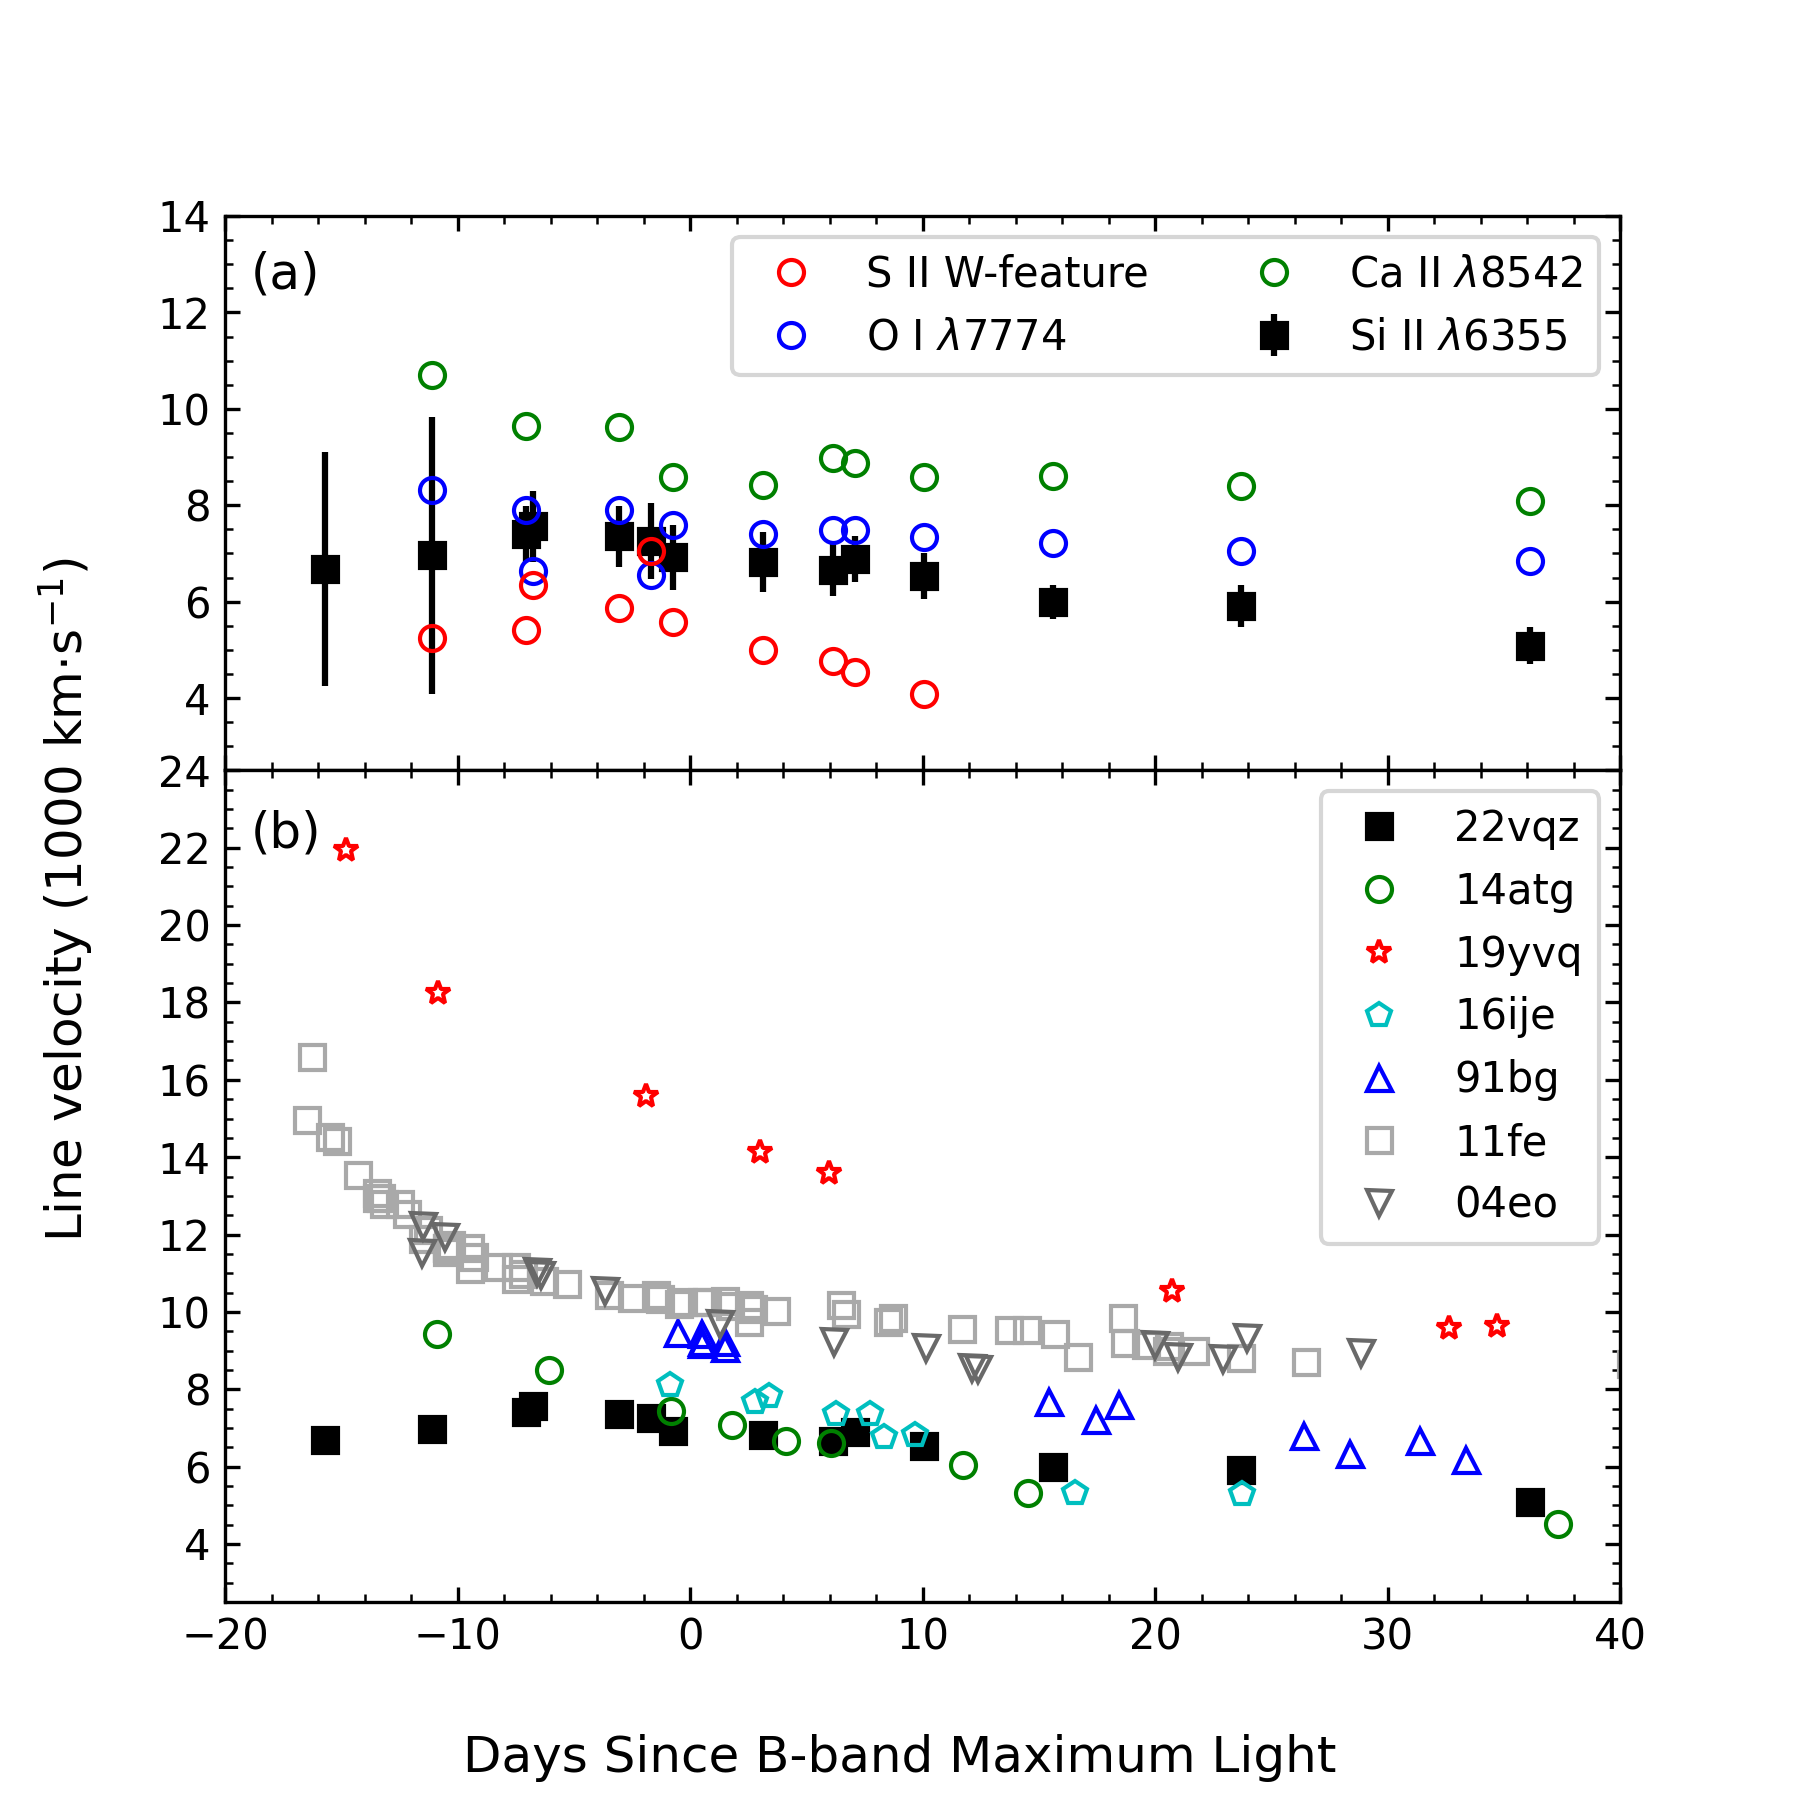
4.2 Ejecta Velocity
The expansion velocity of SN ejecta can be measured from the blueshifted absorption of P Cygni profiles. Differences in line velocities can reveal the element distribution within the ejecta. The velocity evolution measured from absorptions of some IMEs, including S II 5460, 5640, O I 7774, Ca II 8542, and Si II 6355, appear to be exceptionally flat as shown in Figure 9(a). Despite having relatively large uncertainties, the Si II and S II velocities even show a global rise at early phases, conflicting with the trend that the line velocities should decrease rapidly after SN explosion as a result of the receding photosphere. This complex velocity evolution might be related to the double-peaked light curves of SN 2022vqz. Considering energy components, each results in a declining line velocity. When the first peak fades away and the second takes control, the apparent line velocity, as a weighted average of the two components, may show a temporary increase. The Si II velocity measured around the time of maximum light is , which is significantly lower than the typical value of km s-1 for normal SNe Ia, and it is among the lowest values even for subluminous 91bg-like and 02es-like objects. The post-peak velocity decline of SN 2022vqz is , making it a low-velocity-gradient (LVG) object according to the classification scheme proposed by Benetti et al. (2005). We do not find signatures of high-velocity features (HVFs) in SN 2022vqz, while the absence of HVFs seems to be a common property of subluminous SNe.
The velocity evolution of Si II 6355 is further compared to that of some other SNe Ia, including 02es-like iPTF14atg, SN 2019yvq, SN 2016ije, subluminous SN 1991bg (Turatto et al., 1996), normal SN 2004eo (Pastorello et al., 2007), and SN 2011fe (Pereira et al., 2013; Zhang et al., 2016). The latter two are overplotted to visualise the typical velocity evolution of normal SNe Ia. The flat evolution and low velocity make SN 2022vqz stand out in Figure 9(b). We also notice that, although SN 2019yvq was classified as a member of the 02es-like subclass according to its underluminous signatures (Burke et al., 2021), its velocity is extremely high for an 02es-like object, especially when compared with SN 2022vqz. This large diversity in ejecta velocity will be very challenging if a single mechanism is adopted to explain all 02es-like objects.
4.3 Host-Galaxy Parameters
SN 2022vqz is hosted by the face-on lenticular galaxy MCG+05-03-011 with a distance modulus of mag. The resulting -band absolute magnitude is mag and the colour is 1.1 mag (SDSS; Almeida et al. 2023), which are typical for hosts of 02es-like SNe (White et al., 2015). Note that most 02es-like SNe Ia tend to explode in massive, early-type galaxies with little or no star-forming activity, such as SNe 2002es (Ganeshalingam et al., 2012), PTF10bvr, 10acdh, 10ujn (White et al., 2015), and iPTF14atg (Cao et al., 2015). For SN 2022vqz, however, the host spectrum exhibits prominent H emission, indicating relatively active star formation at least near the centre of the host galaxy.
To determine the metallicity of the host galaxy, we measured the intensity ratio of [N II] 6583 and H as , and that of [O III] 5007 and H as . These values can be converted to a metallicity estimate of using an empirical relationship (Kewley & Ellison 2008, Eq. A9). We also used Firefly (Wilkinson et al., 2017) to fit the host spectrum with combinations of single-burst stellar population models, and obtained a stellar mass of , an age of 4.05 Gyr, and a metallicity dex. The metallicities inferred from the two methods are roughly consistent and comparable to the solar metallicity. Thus, we conclude that the host of SN 2022vqz is a medium-mass, solar-metallicity, star-forming galaxy.
5 Discussion
5.1 Double-Detonation Model
Early-time photometry provides a distinct perspective and is crucial for discriminating different explosion mechanisms of SNe Ia (Maeda et al., 2018). Recent statistical studies based on ZTF samples found that –30% of normal SNe Ia show some early-time flux excesses (Deckers et al., 2022; Magee et al., 2022). There is also large diversity in brightness, colours, timescales, and light-curve morphologies of these excesses. Different physical models have been proposed to explain these features, such as interaction with a nondegenerate companion star (Kasen, 2010), outward mixing of radioactive 56Ni (Piro & Nakar, 2013; Piro & Morozova, 2016), detonation of a surface He layer (Polin et al., 2019), and interaction with CSM (Piro & Morozova, 2016; Piro et al., 2021). The rate of early excess in normal SNe Ia is related to the actual population of different physical channels. Even if all the normal SNe Ia are from the SD scenario, an early excess from companion interaction could only be detected in % of the events owing to the viewing-angle effect (Kasen, 2010; Burke et al., 2022).
Obtaining high-quality early-time photometry necessitates early discovery, rapid classification, and high-cadence follow-up photometry of young SNe Ia, which require both extensive efforts and good luck. Early excess emission has been observed in detail only for a handful of normal SNe Ia, such as SN 2017cbv (Hosseinzadeh et al., 2017), SN 2018oh (Dimitriadis et al., 2019; Li et al., 2019; Shappee et al., 2019), SN 2019np (Sai et al., 2022), and SN 2023bee (Wang et al., 2023; Hosseinzadeh et al., 2023). In the future, with specially designed robotic facilities dedicated to high-cadence, multiband observations of young, nearby SNe Ia, we expect more such events to be observed and analysed in detail.
Although early-time flux excesses are relatively rare among normal SNe Ia, a series of recent studies reveals that the 02es-like SNe Ia tend to show them: see iPTF14atg (Cao et al., 2015), iPTF14dpk (Cao et al., 2016; Jiang et al., 2018), SN 2016jhr (Jiang et al., 2017), SN 2019yvq (Miller et al., 2020; Burke et al., 2021), SN 2022ywc (Srivastav et al., 2023), and SN 2022vqz (this work). This generic feature supports the idea that the 02es-like subclass likely originates from a single channel. However, the diversity in other aspects, including ejecta velocity, peak luminosity, and existence of early line blanketing, challenges the potential progenitor scenario and explosion mechanism. One possible scenario is the double-detonation model, in which the ignition of a surface He layer detonates the underlying C-O WD (Polin et al., 2019). The burning of the He layer will leave radioactive IGEs in the outermost ejecta and produce an early-time excess. This model was adopted to explain the early excesses of SNe 2016jhr and 2019yvq.
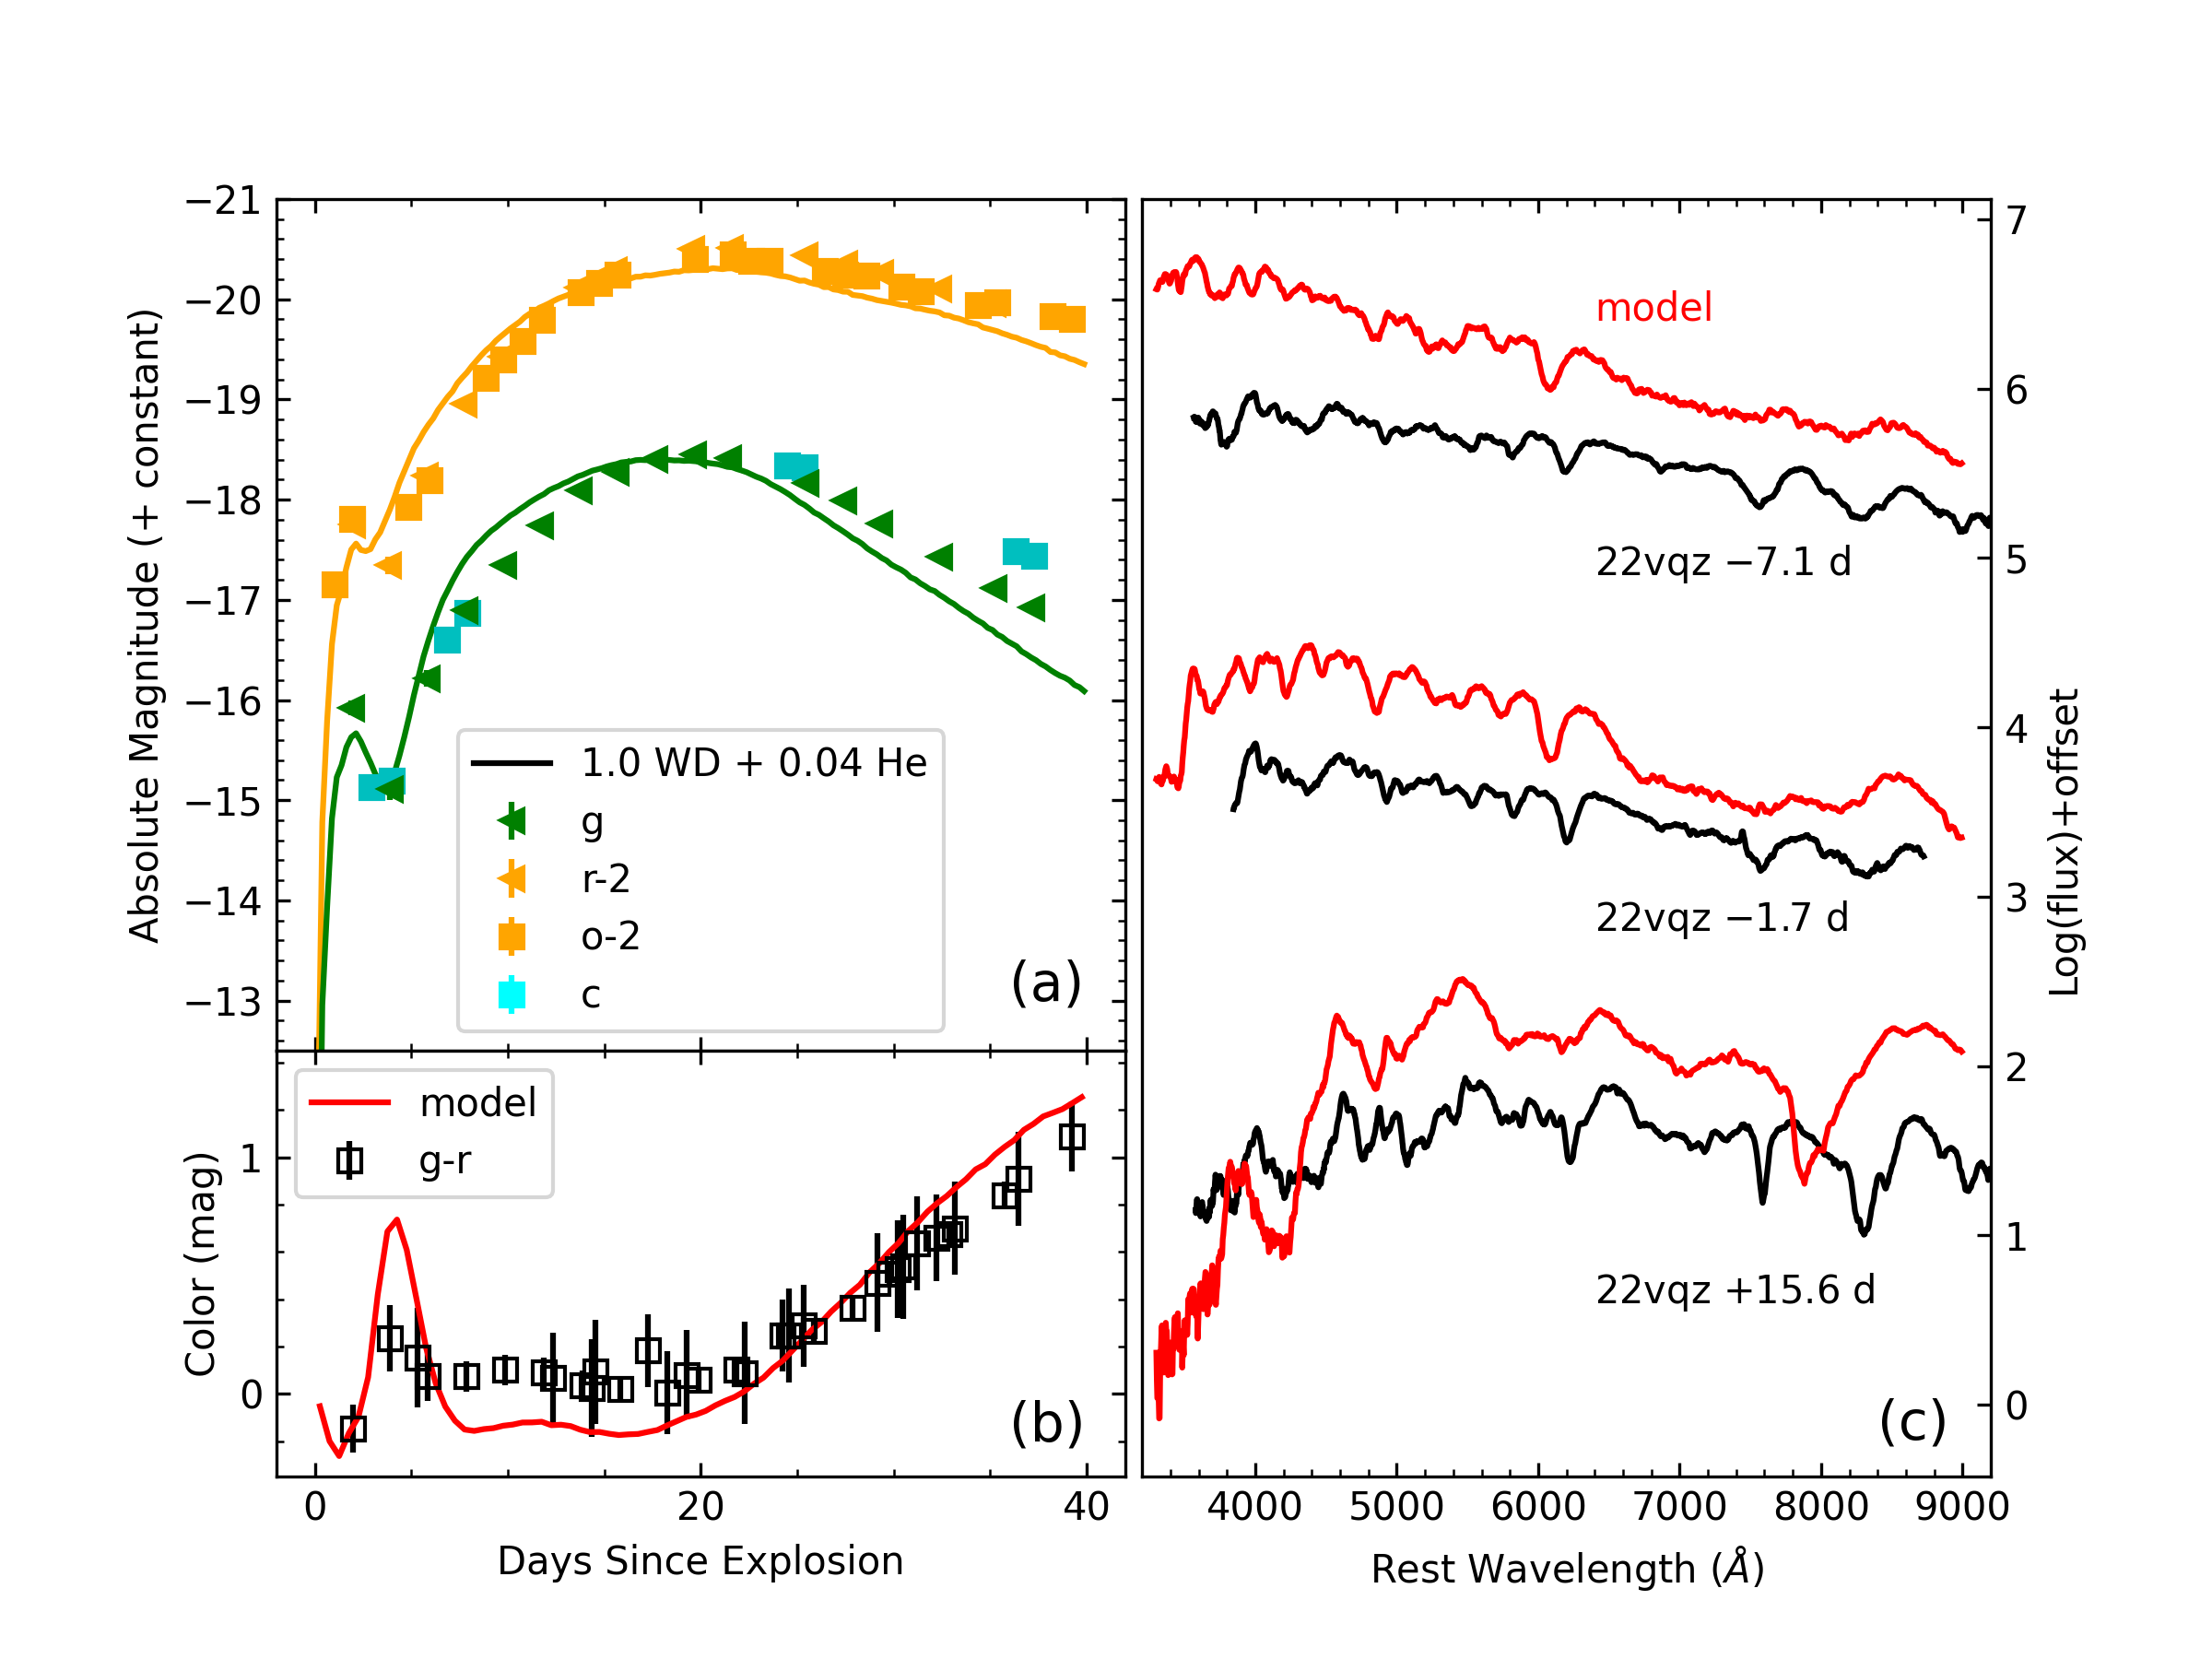
We compared the observations of SN 2022vqz with a grid of double-detonation models (Polin et al., 2019). The grid contains models with WD masses ranging from 0.6 to 1.3 and He-shell masses varying between 0.01 and 0.1 . The explosion epoch is taken as the value inferred in Section 3.3. The best-fit model has a WD mass of 1.0 and a He shell of 0.04 . Comparisons between this model and the observed -band light curves, the colour, and the spectra are shown in Figure 10.
The early peaks of SN 2022vqz appear to be well reproduced, and the relative strengths of the early peak to the main peak is also satisfactory. In particular, the “red bump” in colour days after the explosion is overpredicted by the model. The general trend of the subsequent light-curve evolution is also reproduced, with minor differences. The model light curves are faster, bluer at early epochs and redder at later times, and overluminous by a factor of (0.8 mag). All of this makes the model light curves more consistent with those of fast decliners among normal SNe Ia rather than 02es-like events.
Most spectral features can be reproduced by the double-detonation model, but the predicted velocities are higher than the observed ones by 3000–5000 km s-1. This is not unexpected given that SN 2022vqz is a peculiar object with an extremely low velocity, as described in Section 4.2. No carbon can be detected in the model and the observed spectra. O I 7774 is underpredicted, especially in the day spectrum. Moreover, the model predicts a strong high-velocity Ca II feature, but this is not observed in the day spectrum.
Although the double-detonation model is capable of reproducing the early-time peak, all of the other discrepancies, especially those in spectral velocities, are difficult to reconcile. Reducing the WD mass to 0.9 yields lower luminosity and ejecta velocities, providing a better match with the observations. On the other hand, changing the above parameters would give a worse match with the overall light-curve and colour-curve evolution, and the velocities of Si II and Ca II features would still be unreasonably high.
5.2 O-Ne WD
It is commonly accepted that SNe Ia are explosions of C-O WDs. Assuming the WD is composed of equal parts of C and O, and is fully burnt into iron-peak elements, the released specific energy is erg (Branch, 1992). This energy will be turned into kinetic energy of the ejecta, after compensating the binding energy of the WD. Since heavier WDs are more compact and have a larger specific binding energy, the thermonuclear explosion of a sub- WD is expected to result in an SN with higher ejecta velocity than that of a WD, assuming the same progenitor abundance and burning efficiency. This trend is beneficial in explaining high-velocity SNe like SN 2019ein (Xi et al., 2022) and SN 2019yvq (Burke et al., 2021), but causes problems for the low-velocity SN 2022vqz.
Reducing the burning efficiency will result in lower energy yields and slower ejecta velocities, leaving signatures of unburnt elements in the spectra. Most of the subluminous 02es-like SNe show a noticeable C II 6580 feature around maximum light, indicating low-efficiency burning of C-O WDs. However, the spectra of SN 2022vqz do not reveal any trace of carbon. Thus, we tentatively consider a possibility that the progenitor WD is made of oxygen and neon (O-Ne). By replacing 12C with 20Ne, the specific fusion energy reduces to erg and hence causes a decrease in the ejecta velocity by km s-1, which could potentially explain the low velocity observed in SN 2022vqz.
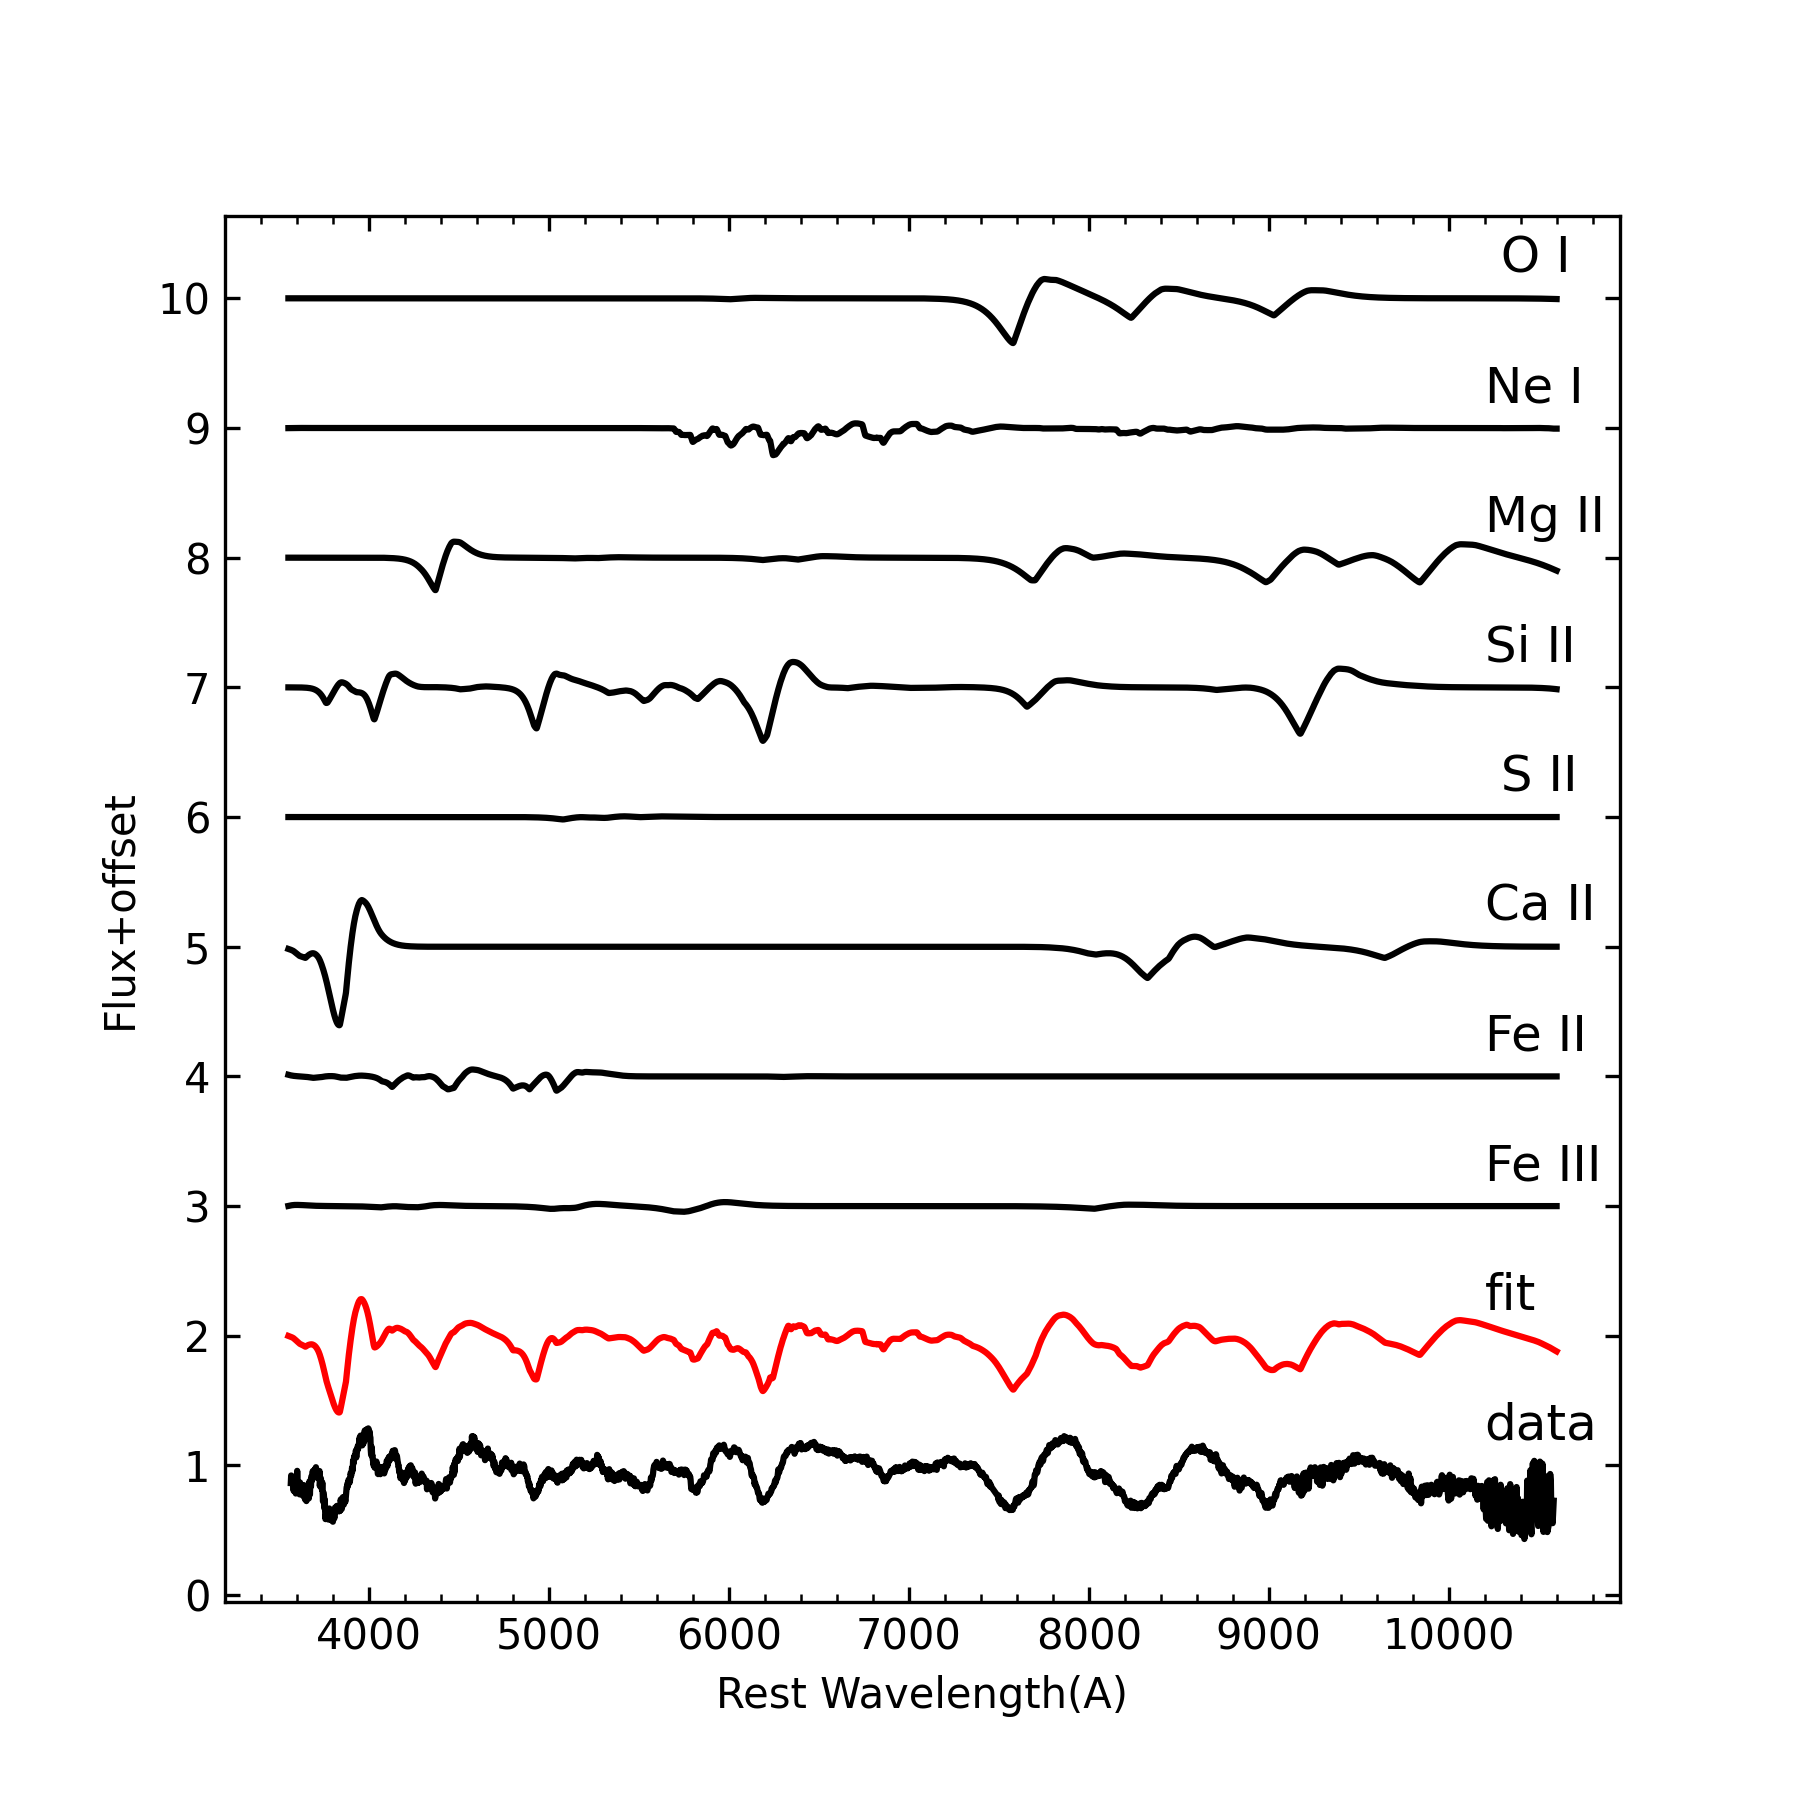
We further use SYNAPPS (Thomas et al., 2011) to identify the potential signatures of unburnt Ne in the spectra of SN 2022vqz. Figure 11 shows the decomposition of the spectrum synthesised by SYNAPPS compared to the day spectrum of SN 2022vqz. We noticed that the shallow absorption features around 6800 Å and 7100 Å could be well fit by Ne I. These features are relatively common in subluminous SNe (see Figure 8). Since burning of a C-O WD may also produce Ne, this cannot be treated as an exclusive signature of an O-Ne WD progenitor. The absorption around 6800 Å might be also attributed to Ti II. However, the 6800 Å Ti II feature usually emerges at later epochs and is accompanied by another Ti II feature at Å which is invisible in this spectrum. Thus, we still identify the 6800 Å absorption feature in the day spectrum as Ne I rather than Ti II.
The electron-degenerate cores made of O-Ne are believed to result from carbon burning in “heavy-weight” intermediate-mass stars (i.e., ), and they are expected to collapse into neutron stars through electron capture (Miyaji et al., 1980). However, O-Ne WDs can be ignited at lower central densities if a tiny amount of carbon (%) exists in their cores (Gutiérrez et al., 2005), leading to thermonuclear SNe Ia. This tiny amount of carbon can be explained as the remnant of an off-centre carbon-burning process which does not propagate all the way to the centre. Bravo et al. (2016) and Willcox et al. (2016) examined the delayed detonation of such hybrid C-O-Ne cores. They found that the produced ejecta are characterised by slightly lower masses of 56Ni and substantially less kinetic energy than those of normal C-O WDs, making this kind of event an interesting candidate for the subluminous class of SNe Ia.
While the C-O-Ne model can simultaneously explain the deficient of C and extremely low velocity of SN 2022vqz, it does not naturally reproduce the early excess emission, unless combined with the double-detonation model (see Section 5.1). Most of the observables can be well reproduced or explained by detonation of a C-O-Ne core triggered by a thick He shell. The companion star could either be a helium star or another degenerate He WD. Marquardt et al. (2015) studied a set of double-detonation models of M⊙ O-Ne WDs. The ejecta structure and spectral morphology of O-Ne models are similar to those of the C-O models of similar WD masses, but the resultant explosions are less energetic with peak luminosity being fainter by mag in B and ejecta velocity slower by km s-1, respectively.
However, it should be noted that the minimal mass of a C-O-Ne core is M⊙, which is the required mass for a C-O core to start off-centre carbon burning to Ne (Hurley et al., 2000; Marquardt et al., 2015). This value is slightly larger than the 1.0 M⊙ inferred from model fitting in Section 5.1 and will predict a brighter peak magnitude. It is not clear whether this mass excess can be compensated by the subluminous nature of O-Ne core explosions compared with C-O cores. Viewing angle may also affect the observed luminosity since double detonation is intrinsically asymmetric. Further analysis requires a more thorough numerical examination of double detonation of C-O-Ne WDs, exploring the full mass range and viewing angle effects of such events.
5.3 CSM Interaction
The early excesses of some 02es-like events are attributed to interaction between ejecta and CSM. Kromer et al. (2016) suggest that interaction with a nonspherical CSM may be able to account for the early UV emission in iPTF14atg. Srivastav et al. (2023) also attribute the strong early-time peak observed in SN 2022ywc to CSM interaction, and rule out other scenarios like surface helium detonation, surface Ni distribution, or companion interaction.
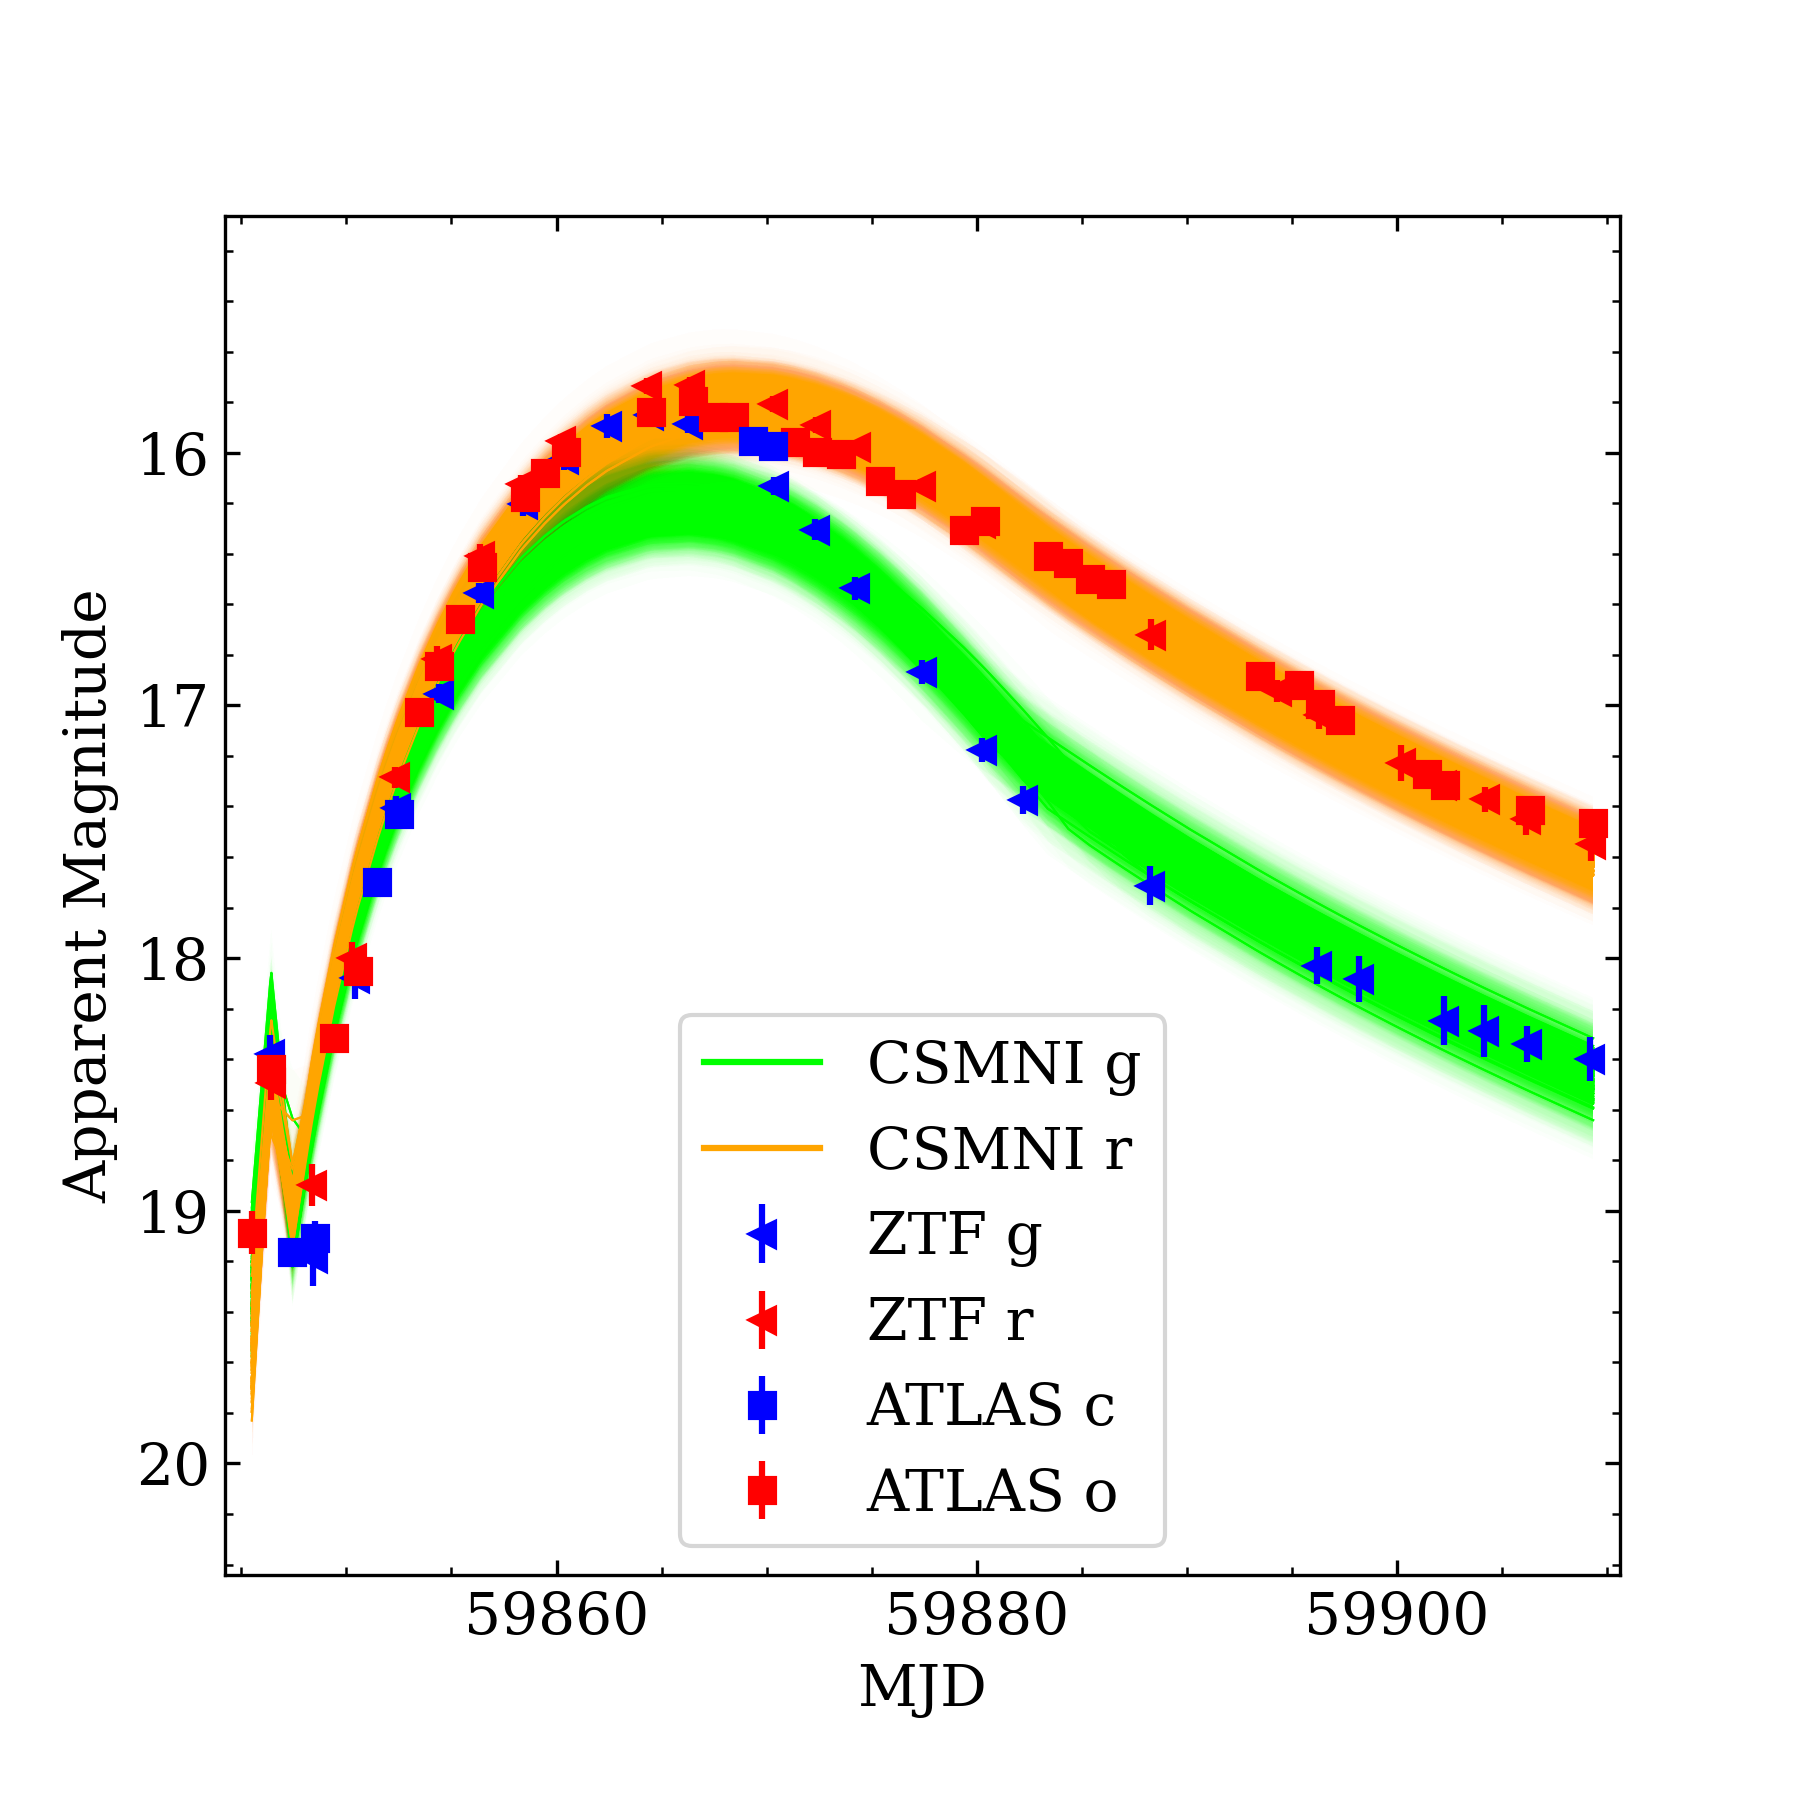
Following the methodology of Srivastav et al. (2023), we use the CSMNI model of Modular Open Source Fitter for Transients (MOSFiT; Guillochon et al. 2018; Nicholl et al. 2017) to fit the -band photometry of SN 2022vqz. The best-fit parameters are erg, , , cm, and , where is the ejecta kinetic energy, is the CSM mass, is the ejecta mass, is the inner radius of the CSM shell, and is the explosion time. Figure 12 shows the -band light curves of SN 2022vqz compared with those from the CSMNI model.
The CSMNI model reproduces the timescale and shape of the early peak very well, and it also provides a good fit to the main bulk of the light curves, with a slightly fainter predicted -band peak. The estimated explosion time is days later than that inferred from the fireball model in Section 3.3, but within the quoted uncertainty. The ejecta mass is significantly less than , making near- models like the delayed detonation unfavourable. This model requires a CSM distribution at cm, similar to that of SN 2022ywc, but with a mass of about one order of magnitude lower (i.e., ).
The CSM could originate from interactions between two merging WDs, specifically the violent merger scenario. This scenario was favoured for multiple 02es-like events, including SNe 2002es, 2010lp, PTF10ops, and iPTF14atg. The secondary WD can be disrupted by the primary, forming a centrifugally supported disc (Yoon et al., 2007; Shen et al., 2012), or eject disc-originated material (DOM; e.g., disk winds or jets) along the polar directions (Levanon et al., 2015). Simulations of WD mergers indicate that the mass of CSM could reach – for discs formed by tidal tails (Raskin & Kasen, 2013; Dan et al., 2014), or – for disc wind-driven DOM (Levanon & Soker, 2019). The nonspherical configuration of CSM may lead to a few 02es-like events that have very bright early excesses, as SN 2022ywc, if the viewing angle aligns with the polar axis (Srivastav et al., 2023). The large parameter space and asymmetry of the violent merger scenario may account for the observed diversity in luminosity and ejecta velocity of 02es-like objects.
5.4 Other Models for the Early Excess
Some other mechanisms could also produce early excess emission in SNe Ia. One is the collision between SN ejecta and a nondegenerate companion star (Kasen, 2010; Dimitriadis et al., 2019); a bright UV/optical excess will be produced when the SN ejecta reach the surface of the companion. The separation between the SN and its companion should be comparable to the Roche-lobe radius of the companion star, –3, where is the separation. For typical velocities of SN and radius of main-sequence stars, the interaction flux should appear a few minutes after the SN explosion, or a couple of hours in the case of a red-giant companion (Kasen, 2010).
Assuming the density profile of the outer SN ejecta follows a power law, , the isotropic equivalent collision-powered luminosity () and effective temperature () can be analytically estimated as:
| (1) |
| (2) |
where is the distance between the WD and its companion, is the ejecta mass, is the ejecta velocity, is the effective opacity in optical, and is the time after explosion, respectively. Assuming the early-time SED can be treated as a black-body radiation, multiband model photometry and colour evolution can be constructed from and .
We fit the observed bolometric light curve and colour evolution to the analytic model. As the early-time bolometric light curve is not sufficiently sampled, to reduce the free parameters in the fitting, the opacity is set to cm2 g-1 according to the assumption made by Kasen (2010), whereas and are fixed to and 7000 km s-1, respectively. Figure 13 shows the best-fit companion-collision model with separation R⊙. While the decreasing part of the early bolometric peak is well fitted, the model curve does not show an initial increase before the early peak as observed in ATLAS and ZTF bands. Moreover, the model colour curve is too blue, and lacks a red bump as seen in the observed data of SN 2022vqz.
Another possible explanation for the early flux excesses is 56Ni mixing to the outermost layers of the SN ejecta (Piro & Nakar, 2013; Sai et al., 2022). The emission from the outer 56Ni can escape earlier than that from the deeper one, and will cause an early excess in first few days after the SN explosion. Piro & Morozova (2016) examined a series of theoretical models with different levels of Ni mixing, measured by the width of a boxcar smoothing routine on the Ni distribution curve (0.05 boxcar 0.25). Their model bolometric and colour curves are also overplotted in Figure 13 for comparison. When the level of mixing increases, the model bolometric light curve shows a more rapid increase at early times, and the colour curve becomes flatter and bluer. However, neither the early bolometric peak nor the red-bump feature of SN 2022vqz can be reproduced by the Ni-mixing models. The absence of a separate early peak is not surprising, since the outer Ni in these models is from mixing of a concentrated distribution, and the mass fraction of Ni still decreases monotonically from centre to the surface. In contrast, the outermost Ni in the double-detonation model is produced by surface He, thus 56Ni can be more congregated in the outermost region of ejecta and produce a clear early peak.
The main strengths and weaknesses of the considered models in this paper are summarised in Table 2.
6 Conclusion
In this paper, we presented extensive photometric and spectroscopic observations of SN 2022vqz, a peculiar SN Ia located in a solar-metallicity, medium-mass, star-forming galaxy. SN 2022vqz has an absolute -band peak magnitude of mag and a post-peak decline rate of mag, which fits well into the subclass of subluminous 02es-like SNe Ia. The bolometric light curve of SN 2022vqz is constructed from multiband photometry and fitted to the radiation diffusion model of Arnett (1982), implying a 56Ni mass of M⊙.
The light curves and spectra of SN 2022vqz resemble those of the classical (i.e., subluminous, low ejecta velocity) 02es-like object iPTF14atg very well. However, while lower ejecta velocity indicates a less energetic explosion and lower burning efficiency, no C is detected in the spectra of SN 2022vqz, in contrast to the prominent C II absorption seen in pre-peak and maximum-light spectra of iPTF14atg.
SN 2022vqz also displays a clear blue early-time peak within days after the explosion, confirming the recently established trend that most, if not all, 02es-like events have early blue/UV excesses. We discussed the possible origin of this early excess. A sub- double-detonation model of – WD + He shell can well reproduce the strength and epoch of the early peak, but it also predicts a “red bump” after the early peak that is significantly stronger than the observed data. Double-detonation models generally leave little or no C in spectra, which is consistent with SN 2022vqz. However, the model spectral features are significantly blueshifted compared to the observed ones, overpredicting the ejecta velocity by 3000–5000 km s-1. This discrepancy may be reconciled by considering a hybrid C-O-Ne WD model, which releases lower specific fusion energy when ignited and produces SN Ia explosions with slightly lower 56Ni masses and substantially slower ejecta velocities.
We also use the code MOSFiT to explore the CSM interaction scenario as an alternative explanation for the early peak. A CSM mass of at cm is required to reproduce the early peak. This amount of CSM could arise from interactions of WDs in a violent merger scenario, which has been proposed for several 02es-like events. The large amount of asymmetry and extent of parameter space may account for the observed diversity in luminosity, ejecta velocity, and strength of the early excess in the 02es-like subclass. However, since the CSM is formed by disruption of a secondary C-O WD, it should be C-O-rich and produce C signatures in spectra of the SN. The lack of a C signature in SN 2022vqz is still a challenge for this model.
Additional models like SN ejecta interaction with a nondegenerate companion and outward Ni mixing are also examined. None can simultaneously reproduce the morphology of the bolometric light curve and colour evolution of the early peak. Moreover, they do not provide additional clues for the cool, subluminous, and slow-expansion nature of the 02es-like SNe Ia; thus, we disfavour these models for SN 2022vqz.
In conclusion, we suggest that double detonation of a low-mass ( M⊙) C-O-Ne WD is the most viable model for SN 2022vqz. However, there are still some tensions in peak luminosity and synthesised 56Ni mass that require further modeling to resolve. SN 2022vqz extends the diversity of the 02es-like subclass with its extremely low ejecta velocity and absence of carbon features. Additional observations of this SN at nebular phases would be important for discriminating between different possible progenitor scenarios. More efforts in exploring the observational properties of progenitors that previously drew less attention, like WDs made of C-O-Ne, will likely help in determining the possible origin of this rare subclass of SNe Ia. Three-dimensional numerical simulations that explore the whole parameter space and viewing angles of double detonation and violent merger models, although challenging, will also help in understanding the diversity in 02es-like events. For now, the sample size of 02es-like SNe Ia is still limited. Future surveys that concentrate on quick response for young transients and early-time multiwavelength photometric observations may greatly enrich the sample, providing better constraints on the origin of the seemingly universal early-time excesses of 02es-like SNe Ia.
Acknowledgements
This work is supported by the National Natural Science Foundation of China (NSFC; grants 12288102, 12033003, and 11633002), the Scholar Program of Beijing Academy of Science and Technology (DZ:BS202002), and the Tencent Xplorer Prize. Y.-Z. Cai and J.-J. Zhang are supported by the International Centre of Supernovae, Yunnan Key Laboratory (No. 202302AN360001). Y.-Z. Cai is supported by NSFC grant 12303054. A.V.F.’s group at U.C. Berkeley received financial support from the Christopher R. Redlich Fund, Briggs and Kathleen Wood (T.G.B. is a Wood Specialist in Astronomy), Alan Eustace (W.Z. is a Eustace Specialist in Astronomy), and many individual donors. A.P., A.R., and L.T. acknowledge support from the PRIN-INAF 2022, “Shedding light on the nature of gap transients: from the observations to the models.”
A major upgrade of the Kast spectrograph on the Shane 3 m telescope at Lick Observatory was made possible through generous gifts from William and Marina Kast as well as the Heising-Simons Foundation. Research at Lick Observatory is partially supported by a generous gift from Google. Observations at AZT-22 of the Maidanak Observatory were supported by Uzbekistan’s Ministry of Innovative Development (grant A-FA-2021-36). This work is partially based on observations collected with the Copernico 1.82 m telescope and the Schmidt 67/92 telescope (Asiago Mount Ekar, Italy) INAF - Osservatorio Astronomico di Padova. The ZTF forced-photometry service was funded under Heising-Simons Foundation grant 12540303 (PI: M. Graham). This work makes use of the NASA/IPAC Extragalactic Database (NED), which is funded by NASA and operated by the California Institute of Technology.
This work has made use of data from the Asteroid Terrestrial-impact Last Alert System (ATLAS) project. The Asteroid Terrestrial-impact Last Alert System (ATLAS) project is primarily funded to search for near-Earth objects through NASA grants NN12AR55G, 80NSSC18K0284, and 80NSSC18K1575; byproducts of the NEO search include images and catalogs from the survey area. This work was partially funded by Kepler/K2 grant J1944/80NSSC19K0112 and HST GO-15889, and by STFC grants ST/T000198/1 and ST/S006109/1. The ATLAS science products have been made possible through the contributions of the University of Hawaii Institute for Astronomy, the Queen’s University Belfast, the Space Telescope Science Institute, the South African Astronomical Observatory, and The Millennium Institute of Astrophysics (MAS), Chile.
Data Availability
The photometric data underlying this article are available in the article, and the spectroscopic data will be available in the Weizmann Interactive Supernova Data Repository (WISeREP) at https://www.wiserep.org/object/21648 .
References
- Almeida et al. (2023) Almeida A., et al., 2023, ApJS, 267, 44
- Arnett (1982) Arnett W. D., 1982, ApJ, 253, 785
- Benetti et al. (2005) Benetti S., et al., 2005, ApJ, 623, 1011
- Bloom et al. (2012) Bloom J. S., et al., 2012, ApJ, 744, L17
- Branch (1992) Branch D., 1992, ApJ, 392, 35
- Branch et al. (1993) Branch D., Fisher A., Nugent P., 1993, AJ, 106, 2383
- Branch et al. (2006) Branch D., et al., 2006, PASP, 118, 560
- Bravo et al. (2016) Bravo E., Gil-Pons P., Gutiérrez J. L., Doherty C. L., 2016, A&A, 589, A38
- Brown et al. (2013) Brown T. M., et al., 2013, PASP, 125, 1031
- Burke et al. (2021) Burke J., et al., 2021, ApJ, 919, 142
- Burke et al. (2022) Burke J., et al., 2022, arXiv e-prints, p. arXiv:2207.07681
- Burns et al. (2011) Burns C. R., et al., 2011, AJ, 141, 19
- Burns et al. (2014) Burns C. R., et al., 2014, ApJ, 789, 32
- Cao et al. (2015) Cao Y., et al., 2015, Nature, 521, 328
- Cao et al. (2016) Cao Y., Kulkarni S. R., Gal-Yam A., Papadogiannakis S., Nugent P. E., Masci F. J., Bue B. D., 2016, ApJ, 832, 86
- Chatzopoulos et al. (2012) Chatzopoulos E., Wheeler J. C., Vinko J., 2012, ApJ, 746, 121
- Chatzopoulos et al. (2013) Chatzopoulos E., Wheeler J. C., Vinko J., Horvath Z. L., Nagy A., 2013, ApJ, 773, 76
- Dan et al. (2014) Dan M., Rosswog S., Brüggen M., Podsiadlowski P., 2014, MNRAS, 438, 14
- Deckers et al. (2022) Deckers M., et al., 2022, MNRAS, 512, 1317
- Dimitriadis et al. (2019) Dimitriadis G., et al., 2019, ApJ, 870, L1
- Ehgamberdiev (2018) Ehgamberdiev S., 2018, Nature Astronomy, 2, 349
- Fan et al. (2015) Fan Y.-F., Bai J.-M., Zhang J.-J., Wang C.-J., Chang L., Xin Y.-X., Zhang R.-L., 2015, Research in Astronomy and Astrophysics, 15, 918
- Filippenko (1982) Filippenko A. V., 1982, PASP, 94, 715
- Filippenko (1997) Filippenko A. V., 1997, ARA&A, 35, 309
- Filippenko et al. (1992) Filippenko A. V., et al., 1992, AJ, 104, 1543
- Foley et al. (2010) Foley R. J., Narayan G., Challis P. J., Filippenko A. V., Kirshner R. P., Silverman J. M., Steele T. N., 2010, ApJ, 708, 1748
- Fremling (2022) Fremling C., 2022, Transient Name Server Discovery Report, 2022-2766, 1
- Ganeshalingam et al. (2012) Ganeshalingam M., et al., 2012, ApJ, 751, 142
- Garnavich et al. (2004) Garnavich P. M., et al., 2004, ApJ, 613, 1120
- Guillochon et al. (2018) Guillochon J., Nicholl M., Villar V. A., Mockler B., Narayan G., Mandel K. S., Berger E., Williams P. K. G., 2018, ApJS, 236, 6
- Gunn et al. (2006) Gunn J. E., et al., 2006, AJ, 131, 2332
- Gutiérrez et al. (2005) Gutiérrez J., Canal R., García-Berro E., 2005, A&A, 435, 231
- Guy et al. (2007) Guy J., et al., 2007, A&A, 466, 11
- Hachinger et al. (2009) Hachinger S., Mazzali P. A., Taubenberger S., Pakmor R., Hillebrandt W., 2009, MNRAS, 399, 1238
- Hoeflich et al. (1993) Hoeflich P., Mueller E., Khokhlov A., 1993, A&A, 268, 570
- Höflich et al. (2002) Höflich P., Gerardy C. L., Fesen R. A., Sakai S., 2002, ApJ, 568, 791
- Hoogendam et al. (2023) Hoogendam W. B., Shappee B. J., Brown P. J., Tucker M. A., Ashall C., Piro A. L., 2023, arXiv e-prints, p. arXiv:2309.11563
- Hosseinzadeh et al. (2017) Hosseinzadeh G., et al., 2017, ApJ, 845, L11
- Hosseinzadeh et al. (2023) Hosseinzadeh G., et al., 2023, ApJ, 953, L15
- Howell et al. (2006) Howell D. A., et al., 2006, Nature, 443, 308
- Hoyle & Fowler (1960) Hoyle F., Fowler W. A., 1960, ApJ, 132, 565
- Huang et al. (2012) Huang F., Li J.-Z., Wang X.-F., Shang R.-C., Zhang T.-M., Hu J.-Y., Qiu Y.-L., Jiang X.-J., 2012, Research in Astronomy and Astrophysics, 12, 1585
- Hurley et al. (2000) Hurley J. R., Pols O. R., Tout C. A., 2000, MNRAS, 315, 543
- Iben & Tutukov (1984) Iben I. J., Tutukov A. V., 1984, ApJS, 54, 335
- Jha et al. (2007) Jha S., Riess A. G., Kirshner R. P., 2007, ApJ, 659, 122
- Jiang et al. (2017) Jiang J.-A., et al., 2017, Nature, 550, 80
- Jiang et al. (2018) Jiang J.-a., Doi M., Maeda K., Shigeyama T., 2018, ApJ, 865, 149
- Kasen (2010) Kasen D., 2010, ApJ, 708, 1025
- Kewley & Ellison (2008) Kewley L. J., Ellison S. L., 2008, ApJ, 681, 1183
- Kromer et al. (2013) Kromer M., et al., 2013, ApJ, 778, L18
- Kromer et al. (2016) Kromer M., et al., 2016, MNRAS, 459, 4428
- Leibundgut et al. (1993) Leibundgut B., et al., 1993, AJ, 105, 301
- Levanon & Soker (2019) Levanon N., Soker N., 2019, ApJ, 872, L7
- Levanon et al. (2015) Levanon N., Soker N., García-Berro E., 2015, MNRAS, 447, 2803
- Li et al. (2019) Li W., et al., 2019, ApJ, 870, 12
- Li et al. (2023) Li Z., et al., 2023, ApJ, 950, 17
- Liu et al. (2023) Liu Z.-W., Röpke F. K., Han Z., 2023, Research in Astronomy and Astrophysics, 23, 082001
- Livio & Mazzali (2018) Livio M., Mazzali P., 2018, Phys. Rep., 736, 1
- Maeda et al. (2018) Maeda K., Jiang J.-a., Shigeyama T., Doi M., 2018, ApJ, 861, 78
- Magee et al. (2022) Magee M. R., et al., 2022, MNRAS, 513, 3035
- Maguire et al. (2011) Maguire K., et al., 2011, MNRAS, 418, 747
- Maguire et al. (2022) Maguire K., Chu M., Dahiwale A., Fremling C., 2022, Transient Name Server Classification Report, 2022-2845, 1
- Marquardt et al. (2015) Marquardt K. S., Sim S. A., Ruiter A. J., Seitenzahl I. R., Ohlmann S. T., Kromer M., Pakmor R., Röpke F. K., 2015, A&A, 580, A118
- Masci et al. (2019) Masci F. J., et al., 2019, PASP, 131, 018003
- Mazzali et al. (1997) Mazzali P. A., Chugai N., Turatto M., Lucy L. B., Danziger I. J., Cappellaro E., della Valle M., Benetti S., 1997, MNRAS, 284, 151
- Miller & Stone (1994) Miller J., Stone R., 1994, The Kast Double Spectograph. Lick Observatory technical reports, University of California Observatories/Lick Observatory, https://mthamilton.ucolick.org/techdocs/instruments/kast/Tech%20Report%2066%20KAST%20Miller%20Stone.pdf
- Miller et al. (2020) Miller A. A., et al., 2020, ApJ, 898, 56
- Miyaji et al. (1980) Miyaji S., Nomoto K., Yokoi K., Sugimoto D., 1980, PASJ, 32, 303
- Nicholl et al. (2017) Nicholl M., Guillochon J., Berger E., 2017, ApJ, 850, 55
- Nugent et al. (2002) Nugent P., Kim A., Perlmutter S., 2002, PASP, 114, 803
- Nugent et al. (2011) Nugent P. E., et al., 2011, Nature, 480, 344
- Pakmor et al. (2010) Pakmor R., Kromer M., Röpke F. K., Sim S. A., Ruiter A. J., Hillebrandt W., 2010, Nature, 463, 61
- Parrent et al. (2014) Parrent J., Friesen B., Parthasarathy M., 2014, Ap&SS, 351, 1
- Pastorello et al. (2007) Pastorello A., et al., 2007, MNRAS, 377, 1531
- Pereira et al. (2013) Pereira R., et al., 2013, A&A, 554, A27
- Perlmutter et al. (1999) Perlmutter S., et al., 1999, ApJ, 517, 565
- Phillips (1993) Phillips M. M., 1993, ApJ, 413, L105
- Phillips et al. (1999) Phillips M. M., Lira P., Suntzeff N. B., Schommer R. A., Hamuy M., Maza J., 1999, AJ, 118, 1766
- Piro & Morozova (2016) Piro A. L., Morozova V. S., 2016, ApJ, 826, 96
- Piro & Nakar (2013) Piro A. L., Nakar E., 2013, ApJ, 769, 67
- Piro et al. (2021) Piro A. L., Haynie A., Yao Y., 2021, ApJ, 909, 209
- Polin et al. (2019) Polin A., Nugent P., Kasen D., 2019, ApJ, 873, 84
- Raskin & Kasen (2013) Raskin C., Kasen D., 2013, ApJ, 772, 1
- Riess et al. (1998) Riess A. G., et al., 1998, AJ, 116, 1009
- Riess et al. (1999) Riess A. G., et al., 1999, AJ, 118, 2675
- Riess et al. (2022) Riess A. G., et al., 2022, ApJ, 934, L7
- Sai et al. (2022) Sai H., et al., 2022, MNRAS, 514, 3541
- Scalzo et al. (2010) Scalzo R. A., et al., 2010, ApJ, 713, 1073
- Schlafly & Finkbeiner (2011) Schlafly E. F., Finkbeiner D. P., 2011, ApJ, 737, 103
- Schmidt et al. (1998) Schmidt B. P., et al., 1998, ApJ, 507, 46
- Scolnic et al. (2018) Scolnic D. M., et al., 2018, ApJ, 859, 101
- Shappee et al. (2019) Shappee B. J., et al., 2019, ApJ, 870, 13
- Shen et al. (2012) Shen K. J., Bildsten L., Kasen D., Quataert E., 2012, ApJ, 748, 35
- Siebert et al. (2020) Siebert M. R., Dimitriadis G., Polin A., Foley R. J., 2020, ApJ, 900, L27
- Smith et al. (2020) Smith K. W., et al., 2020, PASP, 132, 085002
- Srivastav et al. (2023) Srivastav S., et al., 2023, arXiv e-prints, p. arXiv:2308.06019
- Stritzinger & Leibundgut (2005) Stritzinger M., Leibundgut B., 2005, A&A, 431, 423
- Taubenberger (2017) Taubenberger S., 2017, in Alsabti A. W., Murdin P., eds, , Handbook of Supernovae. p. 317, doi:10.1007/978-3-319-21846-5_37
- Taubenberger et al. (2013) Taubenberger S., Kromer M., Pakmor R., Pignata G., Maeda K., Hachinger S., Leibundgut B., Hillebrandt W., 2013, ApJ, 775, L43
- Thomas et al. (2011) Thomas R. C., Nugent P. E., Meza J. C., 2011, PASP, 123, 237
- Tonry et al. (2018) Tonry J. L., et al., 2018, PASP, 130, 064505
- Tucker (2022) Tucker M. A., 2022, Transient Name Server Classification Report, 2022-2778, 1
- Tucker et al. (2021) Tucker M. A., et al., 2021, ApJ, 914, 50
- Tucker et al. (2022) Tucker M. A., et al., 2022, PASP, 134, 124502
- Turatto et al. (1996) Turatto M., Benetti S., Cappellaro E., Danziger I. J., Della Valle M., Gouiffes C., Mazzali P. A., Patat F., 1996, MNRAS, 283, 1
- Wang et al. (2005) Wang X., Wang L., Zhou X., Lou Y.-Q., Li Z., 2005, ApJ, 620, L87
- Wang et al. (2008) Wang X., et al., 2008, ApJ, 675, 626
- Wang et al. (2009) Wang X., et al., 2009, ApJ, 699, L139
- Wang et al. (2013) Wang X., Wang L., Filippenko A. V., Zhang T., Zhao X., 2013, Science, 340, 170
- Wang et al. (2019) Wang X., Chen J., Wang L., Hu M., Xi G., Yang Y., Zhao X., Li W., 2019, ApJ, 882, 120
- Wang et al. (2023) Wang Q., et al., 2023, arXiv e-prints, p. arXiv:2305.03779
- Webbink (1984) Webbink R. F., 1984, ApJ, 277, 355
- Whelan & Iben (1973) Whelan J., Iben Icko J., 1973, ApJ, 186, 1007
- White et al. (2015) White C. J., et al., 2015, ApJ, 799, 52
- Wilkinson et al. (2017) Wilkinson D. M., Maraston C., Goddard D., Thomas D., Parikh T., 2017, MNRAS, 472, 4297
- Willcox et al. (2016) Willcox D. E., Townsley D. M., Calder A. C., Denissenkov P. A., Herwig F., 2016, ApJ, 832, 13
- Xi et al. (2022) Xi G., et al., 2022, MNRAS, 517, 4098
- Yoon et al. (2007) Yoon S. C., Podsiadlowski P., Rosswog S., 2007, MNRAS, 380, 933
- York et al. (2000) York D. G., et al., 2000, AJ, 120, 1579
- Zhang et al. (2004) Zhang T., Wang X., Zhou X., Li W., Ma J., Jiang Z., Li Z., 2004, AJ, 128, 1857
- Zhang et al. (2016) Zhang K., et al., 2016, ApJ, 820, 67
- Zhao et al. (2016) Zhao X., et al., 2016, ApJ, 826, 211
- van Kerkwijk et al. (2010) van Kerkwijk M. H., Chang P., Justham S., 2010, ApJ, 722, L157
[b] UT MJD Epocha Telescope Instrument Range(Å) Resolution(Å) 2022-10-04 59856.25 Lick Kast 3630–10,760 2.0 2022-10-04 59856.54 XLT BFOSC 3900–8870 2.8 2022-10-07 59859.53 XLT BFOSC 3900–8870 2.8 2022-10-09 59861.73 XLT BFOSC 3910–8870 2.8 2022-10-10 59862.70 XLT BFOSC 3910–8870 2.8 2022-10-14 59866.63 XLT BFOSC 3910–8880 2.8 2022-10-17 59869.70 XLT BFOSC 3910–8870 2.8 2022-10-18 59870.63 XLT BFOSC 3900–8860 2.8 2022-10-19 59871.75 Copernico AFOSC 3560–9290 4.0 2022-10-21 59873.65 XLT BFOSC 3900–8870 2.8 2022-10-27 59879.33 Lick Kast 3640–10,750 2.0 2022-11-04 59887.54 XLT BFOSC 3910–8870 2.8 2022-11-10 59893.69 LJT YFOSC 3530–8780 2.8 2022-11-17 59900.18 Lick Kast 3640–10,740 2.0 2022-11-22 59905.67 LJT YFOSC 3520–8780 2.8 2022-12-08 59921.57 LJT YFOSC 3530–8790 2.8 2022-12-10 59923.54 b XLT BFOSC 3910–8870 2.8 2023-01-10 59954.57 LJT YFOSC 3640–8940 2.9 2023-01-18 59962.50 LJT YFOSC 3630–8940 2.9
-
a
Days relative to -band maximum brightness on 2022-10-11.43 (MJD 59863.43), corrected to the rest frame by the factor .
-
b
The spectrum of the host galaxy.
[b] Low Low Early Carbon Luminosity Velocity Excess Evolution Deficiency Double Detonation ✓ ✓ + Hybrid CONe WD ? ✓ ✓ Violent Merger ✓ + CSM Interaction ✓ ✓ Companion Interaction ✓ Ni Mixing
-
✓means strength and means weakness. A question mark denotes an unresolved tension. Detailed reasonings are described in the text.
[b] MJD (mag) (mag) (mag) (mag) (mag) 59849.80 18.813(211) 18.462(165) 18.688(161) 18.479(134) 18.346(119) 59856.81 16.864(183) 16.485(156) 16.617(144) 16.495(124) 16.584(113) 59858.83 16.568(195) 16.204(170) 16.313(160) 16.233(132) 16.351(113) 59861.74 16.262(162) 15.911(115) 16.015(116) 15.777(102) 15.982(094) 59862.73 16.221(180) 15.887(145) 15.976(132) 15.917(116) 16.018(134) 59863.72 16.234(172) 15.853(126) 15.975(136) 15.839(131) 16.078(144) 59866.75 16.322(174) 15.852(142) 16.011(160) 15.868(146) 16.123(116) 59868.73 16.453(161) 15.896(122) 16.137(112) 15.835(100) 16.101(105) 59869.82 16.593(168) 15.950(130) 16.204(127) 15.860(117) - 59873.61 16.945(195) 16.206(145) 16.598(160) 16.073(132) 16.271(116) 59874.67 17.106(188) 16.274(155) 16.696(160) 16.112(131) 16.328(113) 59875.70 17.242(184) 16.336(146) 16.840(150) 16.148(129) 16.353(121) 59876.68 17.362(188) 16.432(147) 16.949(137) 16.234(121) 16.344(120) 59877.65 17.428(172) 16.436(139) 17.039(147) 16.284(130) 16.393(126) 59883.72 18.203(165) 16.920(117) 17.644(115) 16.500(094) 16.538(099) 59884.49 17.959(204) 17.066(167) - - - 59886.49 17.988(171) 17.033(128) 17.823(122) 16.558(116) 16.477(115) 59895.71 18.464(171) 17.314(112) - - - 59897.65 18.694(204) 17.657(163) 18.441(158) 17.363(132) 17.247(116) 59898.67 18.578(175) 17.603(137) 18.138(128) 17.121(111) 17.002(111) 59902.59 18.894(212) 17.705(164) 18.468(161) 17.526(133) 17.413(116) 59906.45 18.969(196) 17.892(163) 18.577(155) 17.686(133) 17.476(132) 59908.56 18.750(186) 18.078(134) 18.719(133) 17.672(119) 17.559(117)
-
Uncertainties, in units of 0.001 mag, are 1.
[b] MJD (mag) (mag) (mag) (mag) (mag) 59853.80 17.145(137) 17.340(044) 16.939(033) 16.667(024) 16.686(025) 59855.73 16.759(130) 16.897(040) 16.561(031) 16.383(022) 16.280(024) 59856.75 16.453(162) 16.770(053) 16.465(040) 16.228(030) 16.131(029) 59858.91 16.134(128) 16.475(041) 16.175(031) 15.977(021) 15.933(024) 59859.93 16.069(144) 16.357(046) 16.045(035) 15.858(026) 15.825(026) 59860.80 16.056(144) 16.289(046) 15.999(035) 15.804(026) 15.760(026) 59861.95 15.947(126) 16.183(040) 15.904(030) 15.725(022) 15.701(024) 59862.88 15.944(126) 16.192(046) 15.862(031) 15.684(022) 15.665(024) 59866.88 16.149(144) 16.265(046) 15.815(035) 15.613(026) 15.628(026) 59868.91 16.433(162) 16.271(053) 15.882(040) 15.693(030) 15.642(029) 59872.82 16.982(162) 16.843(053) 16.091(040) 15.788(030) 15.750(029) 59873.72 17.123(162) 16.968(053) 16.159(040) 15.832(030) 15.775(029) 59892.82 18.016(148) 18.672(047) 17.431(036) 16.789(026) 16.409(025) 59909.66 - 18.870(057) 17.792(072) 17.409(061) - 59910.65 19.321(174) 19.122(054) 17.985(041) 17.521(031) 17.063(029) 59916.71 - 19.605(099) 18.393(046) 17.904(029) 17.468(029) 59923.71 - 19.504(054) 18.460(034) 18.113(025) 17.717(027)
-
Uncertainties, in units of 0.001 mag, are 1.
[b] MJD Telescopea (mag) (mag) (mag) (mag) (mag) 59859.03 S 16.810(198) 16.261(160) 16.112(151) 16.299(155) - 59864.98 S - - - 15.986(152) - 59869.03 S 17.246(203) 16.144(157) 15.842(121) - - 59869.79 C - - - 16.146(113) 16.174(163) 59874.96 S 18.127(209) 16.648(148) 16.054(163) 16.263(150) - 59880.95 S 19.018(211) 17.334(157) 16.369(121) 16.438(121) - 59888.85 S - 17.781(150) 16.755(149) 16.656(145) - 59893.98 S - 18.325(147) 16.979(149) 16.933(139) - 59901.72 C - 18.456(159) 17.383(138) 17.306(113) 17.059(164) 59909.93 S - 18.654(134) 17.852(116) 17.703(127) - 59925.92 C - - - 17.668(126) -
-
a
S: Schmidt 67/92 cm Telescope; C: 1.82 m Copernico Telescope.
-
Uncertainties, in units of 0.001 mag, are 1.
[b] MJD filter mag MJD filter mag MJD filter mag 59846.369 18.379(074) 59866.359 15.731(032) 59902.279 18.247(097) 59846.425 18.493(067) 59870.297 15.808(031) 59904.175 18.288(104) 59848.346 18.898(085) 59870.354 16.133(035) 59904.193 17.372(050) 59848.402 19.187(112) 59872.321 16.305(042) 59906.152 17.451(060) 59850.275 18.001(063) 59872.366 15.891(031) 59906.190 18.339(071) 59850.388 18.080(082) 59874.216 16.536(045) 59909.195 18.400(086) 59852.320 17.284(042) 59874.274 15.979(029) 59909.247 17.550(066) 59852.348 17.406(048) 59877.351 16.133(028) 59911.190 17.521(161) 59854.288 16.817(052) 59877.409 16.867(048) 59914.152 17.732(085) 59854.385 16.953(039) 59880.220 16.280(033) 59914.219 18.401(085) 59856.333 16.556(039) 59880.237 17.177(047) 59923.218 18.603(113) 59856.348 16.409(049) 59882.223 17.374(055) 59928.152 18.197(114) 59858.320 16.123(036) 59888.245 17.713(078) 59928.198 18.747(129) 59858.407 16.204(048) 59888.319 16.721(061) 59932.196 18.833(087) 59860.221 15.955(030) 59894.303 16.942(043) 59932.225 18.302(100) 59860.340 16.023(045) 59896.221 18.031(073) 59934.239 18.350(111) 59862.384 15.894(047) 59896.283 17.036(057) 59936.174 18.769(132) 59864.324 15.736(033) 59898.228 18.082(092) 59936.199 18.409(083) 59864.387 15.850(040) 59900.216 17.228(073) 59866.269 15.886(037) 59902.165 17.316(046)
-
Uncertainties, in units of 0.001 mag, are 1.
[b] MJD filter mag MJD filter mag MJD filter mag 59845.493 19.086(084) 59869.349 15.954(006) 59899.368 17.678(019) 59846.418 18.439(048) 59870.293 15.974(006) 59900.377 17.673(020) 59847.428 19.165(054) 59871.368 15.958(006) 59901.467 17.273(019) 59848.505 19.106(066) 59872.424 15.997(007) 59902.294 17.316(017) 59849.416 18.317(039) 59873.560 16.004(007) 59903.360 17.736(028) 59850.525 18.051(035) 59875.405 16.113(007) 59904.411 17.933(024) 59851.456 17.697(018) 59876.391 16.164(007) 59906.357 17.413(021) 59852.485 17.429(014) 59879.407 16.304(020) 59907.313 17.956(022) 59853.459 17.027(014) 59880.424 16.270(020) 59908.317 18.015(024) 59854.389 16.845(012) 59881.402 16.816(011) 59909.359 17.465(020) 59855.402 16.660(010) 59882.407 16.859(012) 59910.301 17.759(144) 59856.457 16.451(008) 59883.387 16.409(008) 59914.351 17.632(023) 59858.478 16.175(010) 59884.364 16.435(009) 59926.341 18.071(043) 59859.437 16.082(009) 59885.389 16.500(011) 59957.348 18.849(092) 59860.449 15.996(014) 59886.406 16.521(012) 59958.225 18.641(094) 59864.522 15.837(008) 59893.483 16.883(030) 59965.257 19.459(136) 59866.520 15.796(007) 59895.369 16.920(014) 59966.226 19.269(117) 59867.473 15.860(006) 59896.370 16.994(015) 59970.310 19.509(283) 59868.432 15.857(006) 59897.327 17.058(010)
-
Uncertainties, in units of 0.001 mag, are 1.