SN 2021dbg: A Luminous Type IIP-IIL Supernova Exploding from a Massive Star with a Layered Shell
Abstract
We present extensive observations and analysis of supernova (SN) 2021dbg, utilizing optical photometry and spectroscopy. For approximately 385 days following the explosion, SN 2021dbg exhibited remarkable luminosity, surpassing most SNe II. This initial high luminosity is potentially attributed to the interaction between the ejected material and the surrounding circumstellar material (CSM), as evidenced by the pronounced interaction signatures observed in its spectra. The subsequent high luminosity is primarily due to the significant 56Ni ( M⊙) produced in the explosion. Based on the flux of flash emission lines detected in the initial spectra, we estimate that the CSM mass near the progenitor amounted to (1.0–2.0) M⊙, likely resulting from intense stellar wind activity 2–3 yr preceding the explosion. Considering the bolometric light curve, nebular spectrum modeling, and mass-loss rate, we suggest that the progenitor of SN 2021dbg was a red supergiant (RSG) with a mass of M⊙ and a radius of 1200 R⊙. This RSG featured a thick hydrogen shell, which may have contained a region with a sharp decrease in material density, electron density, and temperature, contributing to its layered structure. This object demonstrates mixed features of SNe IIP and SNe IIL, making it as a transitional event linking the above two subclasses of SNe II.
1 Introduction
Type \@slowromancapii@ supernovae (SNe \@slowromancapii@) come from the explosion caused by the gravitational collapse of the dense iron core of hydrogen-rich massive stars at the end of thermonuclear evolution. According to the characteristics of light curves and spectra, they can be divided into SNe \@slowromancapii@P, SNe \@slowromancapii@L, SNe \@slowromancapii@n, and SNe \@slowromancapii@b (e.g., Filippenko, 1997; Arcavi et al., 2012; Gal-Yam et al., 2014; Gal-Yam, 2017; Alsabti & Murdin, 2017). In a volume-limited sample of the contemporary Universe, SNe \@slowromancapii@P account for about half of all core-collapse SNe (Branch & Wheeler, 2017), characterized by a plateau in the light curve lasting for about 3–4 months, followed by a rapid decline to a slower tail phase. The luminosity of the plateau is thought to result from the thermalization of the initial shock wave and the recombination of ionized hydrogen (e.g., Popov, 1993). SNe \@slowromancapii@L do not have the same obvious light-curve plateau characteristics as SNe \@slowromancapii@P, and the apparent magnitude decreases linearly from the peak – that is, exponential decay of the luminosity. The mean maximum brightness of SNe \@slowromancapii@L is mag brighter than that of SNe \@slowromancapii@P (Patat et al., 1993, 1994; Li et al., 2011; Anderson et al., 2014; Faran et al., 2014a, b; Sanders et al., 2015), and limited evidence from archival images and SN rates suggests that the zero age main sequence (ZAMS) mass of SNe \@slowromancapii@L progenitors tends to be M⊙, slightly higher than that of SNe \@slowromancapii@P (Branch & Wheeler, 2017).
Type \@slowromancapii@n SNe are characterized by narrow (tens to hundreds of km s-1) and/or moderately wide ( km s-1) hydrogen emission lines in their optical spectra (Schlegel, 1990). These spectral line features have been attributed to interaction of the ejecta with circumstellar material (CSM; Chugai et al., 2002; Gal-Yam et al., 2014). The brightness rise of SNe \@slowromancapii@n is relatively slow and the time to reach peak brightness is usually more than 20 days, and SNe \@slowromancapii@n have a mean at maximum light (Kiewe et al., 2012). The light curves of SNe \@slowromancapii@n are diverse; some SN \@slowromancapii@n light curves show long and slow decay, while others have a more rapid linear decline, similar to SNe \@slowromancapii@L. The rapid decline rates observed in some SNe IIn range from 0.03 to 0.07 mag d-1, comparable to the steep decline rates seen during the plateau-to-tail transition in SNe IIP.
SNe \@slowromancapii@b are SNe that change from spectral type \@slowromancapii@ to spectral type \@slowromancapi@b (Filippenko, 1988); they are dominated by H lines in early-phase spectra, but the H lines become weak or even disappear at later phases, replaced by P-Cygni profiles of He \@slowromancapi@ lines. The nebular spectra are very similar to those of SNe \@slowromancapi@b/c (and SNe \@slowromancapii@P, except for the absence of H lines). The progenitor systems of SNe \@slowromancapii@b may be a single WN-type star (a WR star with highly ionized nitrogen in its spectra; Crockett et al., 2008), or a binary system in which the progenitor is almost completely stripped of its hydrogen by transfer of matter caused by the wind or companion star. The photosphere thus rapidly recedes to the helium-rich layer below through the small mass of hydrogen-rich ejecta. From then on, SNe \@slowromancapii@b look similar to SNe \@slowromancapi@b.
Some Type II supernovae show narrow emission lines similar to those of Type IIn supernovae in their early stages. However, unlike Type IIn, their narrow emission lines last for a short period. After these narrow emission lines disappear, they are replaced by typical P-Cygni profiles, or the typical P-Cygni profiles appear after a few days of almost featureless continuum spectrum. Gal-Yam et al. (2014) referred to this rapid disappearance of emission lines as “flash spectra”. Exemplars of this flash spectra type include SN 2013cu (Gal-Yam et al., 2014), SN 2013fs (Yaron et al., 2017), SN 2015bf (Lin et al., 2021), SN 2016bkv (Hosseinzadeh et al., 2018; Nakaoka et al., 2018), SN 2018zd (Zhang et al., 2020), SN 2023ixf (Bostroem et al., 2023; Hiramatsu et al., 2023; Smith et al., 2023; Zhang et al., 2023; Zimmerman et al., 2024), SN 2024ggi(Zhang et al., 2024) and so on.
After the flash emission lines disappear in some SNe \@slowromancapii@, their spectral and photometric evolution is strikingly similar to SNe \@slowromancapii@L. For instance, SN 2015bf (Lin et al., 2021) exhibits a prominent and broad P-Cygni emission profile with relatively shallow absorption, accompanied by light curves showing an approximately linear decline. According to Arcavi et al. (2017), the difference between SNe \@slowromancapii@L and SNe \@slowromancapii@P seems to originate more from the cooling properties of the ejecta. However, the influence of CSM may make some SNe \@slowromancapii@P appear like SNe \@slowromancapii@L. Some SNe \@slowromancapii@L have a higher luminosity during the linear decline phase than the plateau phase of SNe \@slowromancapii@P, but their late-time luminosity is consistent with SNe \@slowromancapii@P, such as SN 2018zd, which has a high peak luminosity and a long-term linear decline after the peak, but its late-time luminosity is almost identical to SN 1999em. Zhang et al. (2020) proposed that the higher luminosity of SN 2018zd during the peak and linear decline phases compared to the plateau of SN 1999em is due to CSM interaction, and the early flash features are produced by the recombination of CSM ionized by high-energy photons.
Research conducted by Yoon & Cantiello (2010) indicates that certain SNe \@slowromancapii@P may experience a superwind phase prior to their core collapse. Morozova et al. (2017) have argued for such super-wind phase and proposed that the interaction between the ejecta and wind resulting from it may explain the differences between SNe \@slowromancapii@L and SNe \@slowromancapii@P light curve morphologies. Dessart et al. (2017) pointed out that the phenomena where interaction features briefly appear in the discovery spectra and then fade away within hours or days are actually attributed to the atmosphere or wind closely adjacent to the stellar surface (commonly referred to as the circumstellar envelope), rather than a standard CSM.
Statistical analyses conducted by Khazov et al. (2016) and Bruch et al. (2021) of spectra obtained within 5 days and 2 days post-explosion (respectively) revealed that over and of these early-time spectra exhibited flash features. Attempts were also made to demonstrate that supernovae (SNe) with flash features are more luminous, bluer, or rise more slowly than those without such features, but statistical analyses do not support this conclusion (Bruch et al., 2021, 2023). Bruch et al. (2023) measured the persistence duration of flash-ionization emission and find that most SNe show flash features for 5 days. However, those rarer events, with persistence timescales 10 days, are brighter and rise longer, suggesting these may be intermediate between regular SNe II and strongly interacting SNe \@slowromancapii@n. An accurate estimate of the fraction and confirmation of the above tendency require a sample with observations in the first few hours after explosion when the shock wave breaks out of the stellar envelope(Li et al., 2024).
The origin of flash emission lines is attributed to the CSM surrounding the progenitor star. This CSM undergoes ionization by high-energy photons or shockwaves, followed by a rapid cooling and recombination process, resulting in the generation of these flash emission lines. As demonstrated by Khazov et al. (2016) and Bruch et al. (2021), flash-spectra emission lines are prevalent in the earliest stages of SN explosions. These emission lines offer valuable insights into the composition and structure of the CSM, thereby serving as a valuable tool for understanding the late-stage evolutionary activity of massive stars, mass-loss processes, CSM formation, and the interaction between ejecta and the CSM.
The initial two spectra of SN 2021dbg exhibit prominent flash emission lines that completely disappeared within 5 days, suggesting the possible presence of a certain amount of CSM near its progenitor, but not in the large quantities seen in Type \@slowromancapii@n supernova. SN 2021dbg also stands out among SNe \@slowromancapii@ owing to its exceptional luminosity. Its light curve and spectral features exhibit a blend of SNe \@slowromancapii@P and SNe \@slowromancapii@L characteristics, suggesting that it may occupy a transitional zone between these two SN types. Such SNe, positioned at the boundary of typical classifications, offer unique opportunities to unravel the physical mechanisms underlying the formation of different SN types and the final evolutionary processes of progenitors with varying main-sequence masses.
In this paper, optical photometry and spectra of SN 2021dbg are analyzed comprehensively. Section 2 shows our data sources and processing methods. In Section 3, we give a comprehensive analysis of the light curves and optical spectra, including the comparison with other well-studied SNe \@slowromancapii@. Parameters of SN 2021dbg’s progenitor are discussed in Section 4, such as the mass of the progenitor, 56Ni mass, mass loss, and material distribution structure. In Section 5, the nature of SN 2021dbg and some conclusions are briefly summarized.
2 Observations
2.1 Discovery
SN 2021dbg (ATLAS21gyf) was reported by the Asteroid Terrestrial-impact Last Alert System (ATLAS; Tonry et al., 2018a, b; Heinze et al., 2018) and was first detected at J2000 coordinates , , on 2021-02-15 10:14:52.800 (UTC dates are used throughout this paper). The detected brightness measured with the ATLAS-01 cyan (c) filter was 18.13 (AB magnitude). ATLAS also conducted subsequent observations, acquiring photometric data in the c and o bands. The extended Public European Southern Observatory (ESO) Spectroscopic Survey of Transient Objects (ePESSTO) team (Harvey et al., 2021) observed the initial spectrum using EFOSC2 on the ESO-NTT on 2021-02-16 at 04:05:44. This observation confirmed SN 2021dbg as an SN II. In response, we promptly utilized the 2.4 m Li-Jiang telescope (hereafter referred to as LJT; Fan et al., 2015) at the Li-Jiang Observatory of Yunnan Observatories equipped with the YFOSC (Yunnan Faint Object Spectrograph and Camera; Wang et al., 2019) for continuous photometric and spectral observations.
2.2 Photometry
All images obtained by LJT were processed according to IRAF standard procedures, including template subtraction, background subtraction, flat-fielding, and cosmic ray removal. Instrumental magnitudes were obtained by using the point-spread-function (PSF) fitting method (Stetson, 1987). The instrumental magnitudes were then converted into standard Johnson (Johnson et al., 1966) and standard Sloan (AB magnitude).
SN 2021dbg was observed by the Ultraviolet/Optical Telescope (UVOT) of the Swift Observatory in the , , , , , and bands, but only three images near the luminosity peaks were obtained in each band. Figure 1 displays light curves in all bands we obtained. Table LABEL:tab:A1 presents our all photometric data obtained by LJT, ATLAS and Swift. Figure A1 shows the finder field of SN 2021dbg and local reference stars, whose information is listed in Table A2.
Because of the first detection, we used a simple expanding fireball model, , where and are fitting coefficients, to fit the early detections of SN 2021dbg in the cyan band observed by ATLAS to estimate the explosion epoch. The fitting result is shown with the black dashed curve in Figure 1. We adopt MJD = as our estimated explosion time, which is 1.9 days prior to the first detection.

2.3 Spectroscopy
LJT captured a total of 15 spectra spanning a period of to 81 days post-explosion. The wavelengths and fluxes of these spectra were calibrated according to IRAF standard procedures, telluric absorption was removed by comparison with standard-star spectra, and atmospheric extinction correction was carried out according to the atmospheric extinction information of local stations. Several spectra with large flux-calibration deviations were corrected with multiband photometry. In addition, we used the XingLong 2.16 m telescope (+ BFOSC; at Xing-Long Observatory of the National Astronomical Observatories of China; hereafter referred to as XLT) to take a spectrum days after the explosion. The Low-Resolution Imaging Spectrometer (LRIS; Oke et al., 1995) on the Keck I 10 m telescope was used to take a spectrum of the nebular phase days after the explosion; use of an atmospheric dispersion corrector (ADC) precluded differential slit losses (Filippenko, 1982). Table A3 lists the journal of spectral observations. Figure 2 displays the spectra observed by the LJT+YFOSC, NTT+EFOSC2, XLT+BFOSC, and Keck I+LRIS. From Figure 2, we can see that the first three spectra exhibit weak flash features, followed by a disappearance of the flash features in the next few spectra, forming a blue featureless phase. Then, low-contrast H lines emerge, and it is until about 30 days after the explosion that clear photospheric features (P-Cygni) appear.

3 Analysis and Results
No Cepheid variable distance or rotation velocity have been reported for the host galaxy, precluding a direct estimation of the distance to SN 2021dbg. Instead, we rely on the redshift value of (Harvey et al., 2021; Zhang et al., 2021) and the cosmological parameters from the Nine-year Wilkinson Microwave Anisotropy Probe (WMAP9; Hinshaw et al. 2013) to calculate a distance of 90 Mpc. Limited by our low spectral resolution, we cannot estimate the host-galaxy extinction from the absorption of Na \@slowromancapi@ D , 5896 Å lines. For the Milky Way extinction, we use the extinction data provided by Schlafly & Finkbeiner (2011) in NASA’s Extragalactic Database111https://ned.ipac.caltech.edu/, mag, mag. The light curve and spectrum of SN 2021dbg in this paper are only corrected for Galactic extinction.
3.1 Photometric Analysis
3.1.1 Evolution and comparison of light curves
SN 2021dbg attains its peak luminosity nearly concurrently in all optical bands. The light curve for the and bands exhibits a linear decline from the peak until 50 days post-explosion, subsequently transitioning into a prolonged plateau phase of slower decline. Meanwhile, the , , , , and bands enter this plateau phase earlier, at 43 days. These plateaus persist until days after the explosion. Notably, during the plateau phase, there is a subtle brightening in the , , and bands, with increases of mag in the and bands and a more pronounced brightening of mag in the band, resulting in a distinct bump in the light curve.
SN 2021dbg stands out as a relatively bright object among Type \@slowromancapii@ SNe. Its absolute peak magnitudes exceed in all optical bands and in all UV bands. Table 1 provides peak information and the decline rate from peak to plateau on the optical light curves. The optical and UV bands of SN 2021dbg are brighter than those of typical well-studied Type \@slowromancapii@P SNe, fall within the intermediate level for Type \@slowromancapii@L SNe, and are slightly fainter than the median brightness for Type \@slowromancapii@n SNe. Previously, the optical absolute magnitude range for Type \@slowromancapii@P SNe was reported as mag, while for Type \@slowromancapii@n SNe, it was mag. In UV bands, Type \@slowromancapii@P SNe had an absolute magnitude of mag, and Type \@slowromancapii@n SNe had mag (Pritchard et al., 2014). Richardson et al. (2002) conducted a statistical analysis of the brightness in optical bands for Type \@slowromancapii@P and Type \@slowromancapii@L SNe, finding average peaks of mag for Type \@slowromancapii@P and mag for Type \@slowromancapii@L.
The light curves of SN 2021dbg during the first 50 days resemble those of typical SNe \@slowromancapii@L, characterized by high brightness and a linear decline after the peak. However, after 50 days, the light curves exhibit a prominent plateau, a hallmark feature of SNe \@slowromancapii@P. If Type \@slowromancapii@P and Type \@slowromancapii@L SNe are considered two ends of a continuous family of Type \@slowromancapii@ SNe, SN 2021dbg occupies the brighter end of the transitional zone.
To better analyze the evolution characteristics of the SN 2021dbg light curves, we compared them with those of some other well-studied SNe \@slowromancapii@ after matching the peak values; see Figure 3.
In the band, the decline rate from peak luminosity to 50 days post-explosion is 0.046 mag d-1 for SN 2021dbg. This rate aligns with that observed in SN 2012A (Tomasella et al., 2013), SN 2016X (Huang et al., 2018), and SN 2015bf (Lin et al., 2021), placing it firmly within the mid-range of SNe \@slowromancapii@ samples in Figure 3. However, several SNe, including SN 2004A (Gurugubelli et al., 2008), SN 2004et (Sahu et al., 2006), SN 2017eaw (Van Dyk et al., 2019), SN 2018zd, and SN 2018aoq (Tsvetkov et al., 2021), exhibit a slower decline and transition into a plateau phase sooner than SN 2021dbg. Conversely, SN 1998S (Fassia et al., 2000), SN 2013by (Valenti et al., 2015), and SN 2013ej (Dhungana et al., 2016) decline more rapidly but lack a discernible plateau phase.
In the band, the light curve of SN 2021dbg decreases by 1.19 mag from peak to 50 days, with a decline rate of 0.029 mag d-1, which is the fastest among all SN \@slowromancapii@P samples; only SN 2013by is comparable, but SN 2013by does not have a significant plateau after that. Valenti et al. (2015) classified SN 2013by as a young SN \@slowromancapii@L/\@slowromancapii@n based on early optical and NIR observations. SN 2013ej, SN 2015bf, SN 2016X, and SN 2018zd also do not have a significant plateau, declining linearly nearly from the peak until –110 days, after which, like all SNe \@slowromancapii@P, they rapidly decline to the tail phase. Although an obvious decline before the transition to the 56Ni decay tail phase is the feature of typical SNe \@slowromancapii@P, Anderson et al. (2014) and Valenti et al. (2015) proposed that all SNe \@slowromancapii@L monitored long enough (more than days since discovery) demonstrated this decline.
In both the and bands, from the peak to the plateau period, the brightness declines 0.82 mag, with a decline rate of 0.022 mag d-1. Compared to typical SNe \@slowromancapii@P, such as SN 2012A, SN 2016X, and SN 2017eaw, the SN 2021dbg peak has a larger peak-to-plateau drop, and takes longer to decline from peak to plateau. This behavior can be explained by interactions between ejecta and the CSM. In the plateau and tail phases, SN 2021dbg is consistent with typical SNe \@slowromancapii@P.
Figure 4 shows the position of SN 2021dbg within the SN \@slowromancapii@ population in terms of various photometric indicators. In the left panel, we can see that the brightness of SN 2021dbg is brighter than the SNe \@slowromancapii@P samples in the panel, placing it among the SNe \@slowromancapii@L samples. In the middle and right panels, we can observe that SN 2021dbg is positioned towards the top of the SNe \@slowromancapii@P samples provided by Hamuy (2003). These indicators of SN 2021dbg suggest that it possesses the high brightness of SNe \@slowromancapii@L, yet does not completely deviate from the range of SNe \@slowromancapii@P, implying that SN 2021dbg may be a transitional supernova event between SNe IIP and SNe \@slowromancapii@L.
| Peak Time(d) | 10.93 | 11.69 | 10.82 | 12.97 | 12.70 | 11.86 | 12.22 |
| Peak (mag) | -18.58 | -18.66 | -18.69 | -18.46 | -18.40 | -18.48 | -18.45 |
| M50 (mag) | -16.77 | -17.54 | -17.08 | -17.66 | -17.57 | -17.33 | -17.67 |
| Decline rate (mag/d) | 0.046 | 0.033 | 0.041 | 0.027 | 0.026 | 0.031 | 0.023 |
Note. — M50 is the absolute magnitude in 50 days; the decline rate is calculated from peak to 50 days.
3.1.2 Evolution and comparison of color
Since SN 2021dbg exhibits features of both SNe \@slowromancapii@P and SNe \@slowromancapii@L in its light curves and spectra, we have selected some well-studied and typical SNe \@slowromancapii@P and SNe \@slowromancapii@L as comparison samples. Some of them show flash emission features and CSM interaction. Figure 5 shows SN 2021dbg’s color evolution and color comparison with these SNe \@slowromancapii@ samples.
The color evolution trend of SN 2021dbg is consistent with that of typical SNe \@slowromancapii@P, but bluer, which may be the result of CSM interaction. The color curve of SN 2021dbg is very similar to that of SN 2016X and SN 2018zd, which means that they may have comparable CSM interaction. The color curve of SN 2021dbg is very similar to that of SN 2016X, SN 2018zd, and SN 2018aoq during the first 70 days, but SN 2021dbg and SN 2018zd show a brief bluing feature at 70–80 days and then slowly turn red. Similar to SN 2016X, SN 2013ej, and SN 2012A, the color curve flattens out and slowly turns blue after days, while SN 2004A and SN 2017eaw gradually turn blue after days, and SN 2018aoq continues to turn red linearly until days (Tsvetkov et al., 2021). The color curve of SN 2018zd exhibits a “U-turn” feature at early times, indicating that SN 2018zd had a temperature increase and the dust may be destroyed by shock waves to reduce extinction (Zhang et al., 2020). For the first 40 days, SN 2021dbg’s color is bluer than that of SN 2016X and SN 2018zd, and has been almost always at the bluest end of these SNe II samples in Figure 5.
If such a blue light curve is indeed driven by CSM interaction, it must be exceptionally intense, requiring a significant amount of CSM, similar to the case in SN 2018zd (Zhang et al., 2020). However, this appears to be in contrast with the flash emission lines that disappeared only around five days after the explosion, and the typical rapid cooling observed when CSM interaction alone drives the early light curve. As discussed in Section 4.3, we propose that the prolonged bluer light curve of SN 2021dbg may be associated with the presence of a stratified structure in the progenitor’s envelope.
3.2 Spectral Analysis
3.2.1 Evolution and comparison of early-phase spectra
Early-time spectra, especially those showing flash emission lines (e.g., Gal-Yam et al., 2014), can help us understand the composition and structure of matter near the progenitor. To explore the relationship between flash emission lines in early spectra and matter near the progenitor, Dessart et al. (2017) constructed a generation model of spectra and successfully reproduced the flash emission lines.
Figure 6 shows the early-time spectra of SN 2021dbg and several other SNe \@slowromancapii@, as well as the spectra of the r1w5h and r1w5r models (Dessart et al., 2017). The spectra of SN 2021dbg 2.5 and 3 days after the explosion exhibit narrow H, H, He \@slowromancapii@ Å, N \@slowromancapiii@ , 4641 Å, and weak C \@slowromancapiv@ , 5812 Å and C \@slowromancapiv@ Å. These flash emission lines are the same as those of SN 2013cu, SN 2015bf, SN 2016bkv, and SN 2018zd, and they also agree with the emission lines produced by the r1w5r model. They are thought to result from the recombination of stellar-wind material near the progenitor after being ionized by X-rays from shocked ejecta. SN 2013cu showed narrow and strong H, H, He \@slowromancapi@, He \@slowromancapii@, C \@slowromancapiii@, C \@slowromancapiv@, and N \@slowromancapiv@ emission lines within 15.5 hr after the explosion (Gal-Yam et al., 2014), while by 3 days, He \@slowromancapi@, C \@slowromancapiii@, C \@slowromancapiv@, and N \@slowromancapiv@ emission lines disappeared, leaving only weak H, H, and He \@slowromancapii@ lines. Therefore, SN 2021dbg may have had strong and narrow flash emission lines as did SN 2013cu, although we did not obtain SN 2021dbg’s spectra at sufficiently early times after the explosion. At 6–10 days, the spectra of SN 2021dbg do not exhibit any significant emission lines except for very weak H, consistent with SN 2015bf and also with spectra of the r1w5h and r1w5r models.
In the model by Dessart et al. (2017), w5 represents a mass loss rate of , which indicates that the progenitor of SN 2021dbg may have experienced an enhanced mass loss shortly before the explosion, or undergone a superwind phase proposed by Yoon & Cantiello (2010). We discuss the mass loss of the progenitor in more detail in Section 4.4.


3.2.2 Evolution and comparison of photospheric-phase spectra
Figure 7 shows the evolution and comparison of photospheric spectra of SN 2021dbg with those of other well-studied SNe \@slowromancapii@. The spectral evolution of SN 2021dbg is slower than that of most other SNe \@slowromancapii@, and the characteristic spectral lines appear later. In spectra during the first 48 days, H and H, are relatively wide with no obvious P-Cygni absorption profile, and the absorption of He \@slowromancapi@ Å, Ca \@slowromancapii@ NIR triplet, and Fe \@slowromancapii@ Å are also very shallow. These features are similar to those of SN 2014G (Terreran et al., 2016), SN 2015bf (Lin et al., 2021), and SN 2018hmx (Bracha, 2019).
After 48 days, H, H, and Å begin to appear with obvious P-Cygni profiles, and the absorption components of He \@slowromancapi@ Å, Ca \@slowromancapii@ NIR triplet, and Fe \@slowromancapii@ Å also begin to deepen, but the absorption depth is still shallower than that of a typical SNe \@slowromancapii@P such as SN 2017eaw (Van Dyk et al., 2019). Instead, it is more similar to the line absorption of a typical SNe \@slowromancapii@L such as SN 2014G. The H emission lines of SN 2021dbg, SN 2014G, SN 2015bf, and SN 2018hmx show a large extension on the blue side, and the peaks display a significant blueshift that exceeds 3000 km s-1 at early phases and gradually decreases with time. SN 2017eaw also exhibits such a blueshift, but it is much smaller and decreases rapidly. This behavior has been reported in many SNe \@slowromancapii@ (Chevalier, 1976; Taubenberger et al., 2009). Anderson et al. (2014) proposed that this behavior is a direct consequence of a steep density profile in the ejecta, which translates into more confined line emission and higher occultation of the receding part of the ejecta. The rate of decrease of SN 2021dbg’s H peak blueshift is slower than that of SN 2014G, SN 2015bf, and SN 2018hmx, which indicates that SN 2021dbg may have a thicker ejecta layer with a steep drop in matter density, electron density, and temperature.
3.3 Bolometric luminosity analysis
3.3.1 Construction of bolometric luminosity curve
Within 100 days after the explosion, we obtained good optical photometric data and applied the SuperBol222https://github.com/mnicholl/superbol program (Nicholl, 2018) to calculate the pseudo-bolometric luminosity, temperature, and radius evolution curve in the photosphere phase of SN 2021dbg, as shown in Figure 8. In the UV bands, only three points were obtained by Swift/UVOT. We used them to correct the luminosity at early times, as indicated by the three orange diamond points in Figure 8. Owing to the observation conditions, the photometric data obtained at late times are very limited, and the pseudo-bolometric luminosity cannot be obtained through multiband photometric data.
Valenti et al. (2016) successfully constructed the pseudo-bolometric luminosity curve from the beginning of radioactive decay to late times of 30 SNe \@slowromancapii@ only by using the band. At late times, we obtained the most data in the band, and the evolutionary trend of the -band light curve and the pseudo-bolometric luminosity curve are the most similar during the plateau period. Therefore, we applied the method of Valenti et al. (2016) in the band and multiplied the -band light curve by a coefficient to make it match the pseudo-bolometric luminosity curve during the plateau phase. Then, the pseudo-bolometric luminosity curve of SN 2021dbg in the radioactive-decay phase was effectively constructed by replacing the pseudo-bolometric luminosity curve with the -band light curve, as shown with the red curve in Figure 11.

3.3.2 Evolution and comparison of bolometric curve
In Figure 8, SN 2021dbg reaches its peak luminosity, erg s-1, at days after the explosion in the bolometric light curve derived from the observed photometry. We noted that the spectral energy distribution derived from the photometry at early times was not adequately aligned with the blackbody fitting, resulting in significant errors and potential underestimation of the actual value. To address this issue, we utilized the UV data from Swift in combination with the optical observations for blackbody fitting. The resulting bolometric luminosity value of erg s-1 is significantly higher than that obtained from the optical bands alone, and the associated uncertainty is reduced.
Figure 9 shows the pseudo-bolometric curve comparison of SN 2021dbg with other SNe \@slowromancapii@. The evolution trend of the bolometric luminosity curve of SN 2021dbg is similar to that of SN 1999em, SN 2016X, SN 2017eaw, and other typical SNe \@slowromancapii@P, but SN 2021dbg is brighter; the peak bolometric luminosity of SN 2021dbg is about three times higher than that of SN 2017eaw, five times higher than that of SN 2016X, and about ten times higher than that of SN 1999em. Peaking in the near-UV at the same time as the optical light helps produce the high bolometric luminosity. Since SN 2017eaw showed early and moderate CSM interaction (Szalai et al., 2019; Van Dyk et al., 2019), SN 2021dbg with higher luminosity may have had even stronger early-time CSM interaction, or higher total core energy released by the explosion.
At d, SN 2018zd exhibits the closest luminosity to SN 2021dbg. However, a notable difference lies in the slower decline of SN 2018zd compared to SN 2021dbg, without a pronounced plateau beyond 50 days. At 120 days after the explosion, the bolometric luminosity of SN 2018zd nearly matches that of SN 1999em. Based on this observation, Zhang et al. (2020) postulated that the enhanced luminosity of SN 2018zd relative to SN 1999em within the first 120 days results from the interaction between ejecta and CSM, while the explosion core energy of SN 2018zd remains comparable to that of SN 1999em. Furthermore, the pseudo-bolometric curve of SN 2021dbg displays a more prominent radioactive decay tail than do SN 2017eaw, SN 2018zd, and SN 1999em. This suggests a higher production of 56Ni in SN 2021dbg, as further elaborated in Section 4.2.

4 Discussion
4.1 Ejecta Velocities
The velocities of H, H, Fe \@slowromancapii@ Å, and Ca \@slowromancapii@ Å are measured according to the blueshift of the wavelength of the minimum of the spectral line absorption profile relative to the rest wavelength of the emission line. Minima of H, H, and Fe \@slowromancapii@ Å are obtained by polynomial fitting a P-Cygni profile. The minimum of Ca \@slowromancapii@ Å is obtained by fitting the absorption profile of the Ca\@slowromancapii@ NIR triplet with three Gaussian components. Figure 11 presents the ejecta velocity evolution of SN 2021dbg and compares it with that of SN 2017eaw, SN 2018zd, and SN 2016bkv. These three SNe were chosen as comparison objects because SN 2017eaw has a similar ejecta velocity to SN 2021dbg, while SN 2018zd and SN 2016bkv exhibit hydrogen acceleration behavior in their early stages, similar to what is observed in SN 2021dbg. In Figure 10, those shaded lines are a power-law fitting of the ejecta velocities of SNe \@slowromancapii@P summarized by Faran et al. (2014b).
The velocities of H and H show an acceleration at d and conform to the power law at d. At d, the decline in velocities slows down significantly. However, the velocity of Fe \@slowromancapii@ Å roughly conforms to the power law at d, although it is lower than predicted by the power law at d. The velocity of H is almost equal to that of Ca \@slowromancapii@ Å, while lower than the H velocity by about 2000 km s-1. Therefore, we think H came from the outer layer of the ejecta, while H came from the inner layer of the ejecta near the core.
The early H-acceleration behavior observed in SN 2021dbg exhibits similarities to that of SN 2018zd (Zhang et al., 2020) and SN 2016bkv (Nakaoka et al., 2018). According to Zhang et al. (2020), this accelerated H emission originates from either the wind matter or CSM located above the optically thick photosphere. Initially, these ionized winds or CSM are propelled by the shocked ejecta, resulting in the observed spectral lines and acceleration. Meanwhile, well-developed P-Cygni profiles are shaped within the ejecta. The H P-Cygni profiles of SN 2021dbg have a shallow absorption at d, the absorption of the H P-Cygni profiles thereafter is significantly deepened, and the H velocity accords with the power law at d. These findings align with the hypothesis put forth by Zhang et al. (2020).
SN 2018zd showed a significant heating and accelerating behavior of the photosphere within a week after the explosion, which was explained by the reverse-shock heating of the outer layer of the ejecta (Zhang et al., 2020). SN 2021dbg does not have such a heating and accelerating process of the photosphere at early phases. After the P-Cygni profiles develop well, SN 2016bkv, SN 2018zd, and SN 2017eaw have a power-law velocity evolution of H, while the H velocity of SN 2021dbg declines more slowly and deviates from a power law significantly. A possible explanation for this behavior is that the progenitor of SN 2021dbg may have a thicker H shell, and the shell is likely to be layered because of a steep drop in matter density, electron density, and temperature. As the outermost layers dissipate, deeper H layers become visible.
.
4.2 Estimate of the 56Ni Mass from the Tail Luminosity
In the late-time tail, the bolometric light curve is almost entirely powered by the radioactive decay of 56Co (56Ni 56Co 56Fe), so the bolometric luminosity is a good indication of the 56Ni mass synthesized in the explosion. Based on this theory, many researchers have given different methods or models to estimate the 56Ni mass, such as comparisons made with SN 1987A’s tail luminosity (Elmhamdi et al., 2003), the Hamuy (2003) tail-luminosity method, and the Jerkstrand et al. (2012) tail-luminosity method. By comparing the tail luminosity with that of SN 1987A, the 56Ni mass of SN 2021dbg is found to be 0.17 M⊙. According to the methods of Hamuy (2003) and Jerkstrand et al. (2012) (Eqs. (1) and (2) below, orange and green curves in Figure 11, respectively), the mass of 56Ni is 0.165 M⊙ and 0.173 M⊙, respectively:
| (1) |
| (2) |
These above methods of calculating 56Ni from the tail luminosity assume that the energy released by radioactive decay was completely captured, the deposited energy was instantly re-emitted, and no other energy sources had any effect. Taking into account the case of -photon escape, Wygoda et al. (2019) added a parameter (-photon escape time) to the relationship between the energy of 56Co decay and the bolometric luminosity, constructing a new method for calculating the mass of 56Ni, as shown in Equations (3) and (4) below from Yang & Sollerman (2023):
| (3) |
| (4) |
where erg g s-1 and erg g s-1 are the specific heating rates of Ni and Co decay, respectively, days and days are their corresponding decay timescales, is the total mass of the ejecta, is the kinetic energy of the ejecta, is the gamma-ray opacity, and is a constant. The unit of is gram.
Taking the matching tail luminosity as the standard, we set days and obtained a 56Ni mass of 0.175 M⊙, as seen in the blue curve in Figure 11. Such a large value of indicates that almost no photons emitted by 56Ni decay escaped (as , Eq. (3) is equivalent to Eq. (2), meaning that 56Ni decay photons are completely captured), which implies that SN 2021dbg may have had a thick shell that almost completely captured the gamma-ray photons emitted during the decay of 56Ni. This is in agreement with the previous analysis of the spectra and ejecta velocities.
The values obtained from the above methods are all relatively close, indicating a mass of 56Ni in the range of 0.165 to 0.17 M⊙, which suggests that these methods are reasonable for SN 2021dbg. Since we do not have a more precise and reliable method to determine the mass of 56Ni, by combining the results of the aforementioned methods, we estimate the mass of 56Ni in SN 2021dbg as 0.17 0.05 M⊙.

4.3 Modeling the Bolometric Light Curve and Explosion Parameters
We employ the radiation diffusion model, as outlined by Arnett & Fu (1989) and Fu & Arnett (1989), to reconstruct the explosion parameters of SN 2021dbg. These calculations are facilitated by the LC2 code333Accessible at https://titan.physx.u-szeged.hu/~nagyandi/LC2/, as detailed by Nagy & Vinkó (2016). This model segments the ejecta resulting from the progenitor explosion into two distinct components: a high-mass, high-temperature, and high-density core enriched in He and heavier elements, encircled by a low-mass, low-temperature, and low-density shell predominantly composed of H.
At early phases, the elevated luminosity primarily arises from the interaction between the shell and the CSM, while the thermal radiation emanating from the core predominantly contributes to the luminosity during the plateau. As the SN transitions into the tail phase, the luminosity is almost entirely sustained by the radioactive decay of 56Ni. Notably, the bolometric light curve of SN 2021dbg exhibits a prolonged linear decline at early times, with a delayed plateau appearance. Attempts to fit the pseudo-bolometric light curve with a model featuring a core with a single shell proved unsuccessful.
Combining with the previous analysis, we considered that the progenitor of SN 2021dbg probably had a very thick H shell whose matter density, electron density, and temperature probably dropped steeply. Hence, we tried to fit the pseudo-bolometric light curve with a core and two shells, achieving a successful result. This model finds that the outermost radius of the progenitor is R⊙ and the total mass of the ejecta is 18.4 M⊙; considering a compact remnant, the mass of the progenitor is M⊙.
Figure 12 shows the result of fitting SN 2021dbg’s pseudo-bolometric light curve, and the parameters of the model are presented in Table 2. We divided the shell into inner and outer parts. The thickness of the inner shell is approximately equal to that of the outer shell, but the inner one has a higher mass, temperature, and Thomson scattering coefficient than the outer one. This means that the inner shell is denser and dominated primarily by ionized hydrogen, therefore resulting in a high electron density. The outer shell has a low density and is dominated primarily by neutral hydrogen.
At early times following the explosion, the high-speed shell ejecta collide and interact with the CSM, accelerating the CSM and slowing down the shell ejecta. Much kinetic energy in the shell layer is converted into thermal radiation during this interaction, contributing to the early high luminosity. Most interactions last for days, and the luminosity decreases rapidly, then entering a plateau phase dominated by the core thermal radiation contribution. SN 2021dbg took days, a longer time than most SNe \@slowromancapii@, for the peak to decline to the plateau, likely owing to the thermal radiation contribution of the inner shell. The luminosity of the plateau and tail is mainly contributed by core thermal radiation and 56Ni decay.
Such a layered structure of the shell may be caused by unstable pulsations. This is likely due to the progenitor being in a pulsationally unstable state before the explosion and having entered or being on the verge of entering a phase of enhanced mass loss. Although it still retained a thick hydrogen-rich shell, the shell had already developed a layered structure due to unstable pulsations. Yoon & Cantiello (2010) provided simulation demonstrations showing that stars with initial masses between 17 to 20 M⊙ may experience enhanced mass loss in the form of pulsation-driven superwinds during the late stages of their evolution. Such pulsation-driven superwinds may be the key factor for the transition of supernova explosions from Type \@slowromancapii@P to Type \@slowromancapii@L.

| (M⊙) | ( cm) | (K) | ( erg) | ( erg) | (cm2 g-1) | (M⊙) | |
|---|---|---|---|---|---|---|---|
| Core | 15.8 | 5.5 | 11000 | 1.7 | 1.1 | 0.24 | 0.165 |
| Inner shell | 2.0 | 7.0 | 7000 | 0.91 | 0.13 | 0.36 | 0.0 |
| Outer shell | 0.6 | 8.5 | 3000 | 0.075 | 0.085 | 0.18 | 0.0 |
4.4 Mass Loss of the Progenitor
A large number of observational studies have shown that mass loss occurs at late times in massive stars, but it is still very difficult to directly observe the mass-loss process. The spectral flash emission lines at early phase are closely related to the CSM structure near the SN progenitor, and are thus helpful for us to infer the mass-loss process of the SN progenitor. The early spectra of SN 2021dbg show clear narrow H emission, which allows us to estimate the mass-loss rate of its progenitor via the relationship between and (Ofek et al., 2013):
| (5) |
where is the mass of the proton, is the mean number of nucleons per particle (mean molecular weight), , , cm3 s-1 (Osterbrock & Ferland, 2006). We have
| (6) |
Taking K, which was obtained by blackbody fitting days after the explosion, Eq. (5) can be simplified to Eq. (6). We performed the Lorentzian function fitting of the H line profile in the earliest spectrum obtained by NTT, including a single Lorentzian function, two Lorentzian functions, and three Lorentzian functions.
The single Lorentzian profile fits the H emission line well, indicating that the emission-line broadening is mainly caused by electron scattering rather than the velocity of the wind. The dual Lorentzian fitting aims to identify the narrow-line component within the emission line, but we cannot fit the effective narrow-line profile of the H emission, probably limited by the low spectral resolution. The three-Lorentzian fitting is to consider the flux contribution of the emission lines of the possible host galaxy [N \@slowromancapii@] , 6583 Å, and the results show that this flux contribution can be ignored. The luminosity of the single Lorentzian fitting profile of the H emission line is erg s-1.
Taking the radius of the blackbody photosphere at the time of this earliest spectrum as cm) and the radius of the blackbody photosphere at the beginning of the first plateau ( days after the explosion; see Figure 8) as cm), because we think the first plateau indicates that the plateau phase of the photospheric radius around 18 day is attributed to the fact that the CSM beyond this distance is already very thin, and the collision between ejecta and CSM cannot generate sufficient radiation to expand the photosphere any further, then the photosphere gradually shifts to the inner shell. When the shell ejecta expanded to , their temperature and density were too low to continue expanding the photosphere, until the hotter and denser core ejecta arrived and the photosphere continued expanding. This also explains the temperature exhibiting a slight bump as the photospheric radius expanded 40 days after the explosion.
To estimate the mass loss rate, we also need to obtain the wind velocity. By fitting the H flash emission line profile in the earliest spectrum, we obtain a velocity broadening of km s-1. Such a wind velocity is unusually high for the progenitors of SNe \@slowromancapii@P and SNe \@slowromancapii@L, likely due to the fact that our first spectrum was obtained approximately 2.5 days after the explosion, when the wind material had already been accelerated by the ejecta. We compare an example with strong flash emission line and extremely early spectrum, SN 2013fs (Yaron et al., 2017). Assuming that SN 2021dbg and SN 2013fs have comparable wind speed ( km s-1), we got a mass loss rate of M⊙ yr-1, slightly lower than the mass-loss rate of SN 2013fs ( M⊙ yr-1). According to Eq. (5) of Ofek et al. (2013), the H mass in the CSM is M⊙. If taking the typical wind speed of a red supergiant (RSG; km s-1) as , we obtain M⊙ yr-1, which is a typical mass loss rate of RSGs.
The mass loss rate given by the model of Dessart et al. (2017) is on the surface of the progenitor, while the narrow H emission line we see comes from a farther place. The mass loss rate estimated by the H flux is lower than the surface mass loss rate given by the model, reflecting the density change of CSM in the spatial scale. Zimmerman et al. (2024) demonstrated that there may be a steep decline in the density of CSM within the distance of cm to cm.
4.5 Masses Derived from the Nebular-Phase Spectrum
Jerkstrand et al. (2012) proposed a model for estimating the mass of the progenitor of SNe from spectra in the nebular phase. As shown in Figure 13, the nebular-phase spectrum, obtained days after the explosion using Keck 1, is compared with model spectra corresponding to various progenitor masses. The spectral lines, particularly, Na \@slowromancapi@ D, Mg \@slowromancapi@], and [O \@slowromancapi@], are similar to the model spectra of the progenitor with a mass of 19 M⊙, implying that the progenitor of SN 2021dbg has a mass of M⊙.
In the nebular phase, Jerkstrand et al. (2012) also gave evolution curves of model spectral line luminosity ([O \@slowromancapi@] , 6364 Å, Na \@slowromancapi@ D, Mg \@slowromancapi@] Å, H, [Fe \@slowromancapii@] , 7172 Å, [Ca \@slowromancapii@] , 7323 Å, Ca \@slowromancapii@ NIR triplet) for progenitors with different masses relative to the 56Co decay power over time. For the spectrum obtained at days, the flux ratios of the above spectral lines relative to the 56Co decay power are shown in Table 3. The values of Mg \@slowromancapi@] Å and Na \@slowromancapi@ D are higher, and the values of [Ca \@slowromancapii@] , 7323 Å and Ca \@slowromancapii@ NIR triplet are higher, than the model values of the 19 M⊙ progenitor, while the ratios of [O \@slowromancapi@] , 6364 Å and H are lower by and (respectively) than model values of the 19 M⊙ progenitor. The flux ratios of Na, Mg, and Ca are higher, and of H and O are lower, which means that the progenitor mass of SN 2021dbg may be greater than 19 M⊙.
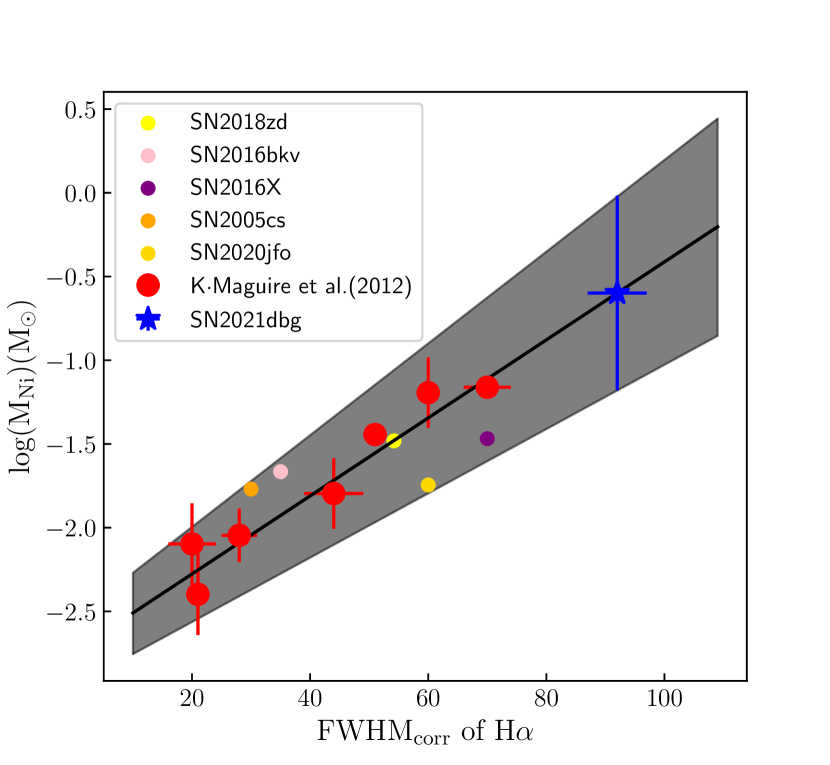
Spectra from the nebular period can also be used to estimate the 56Ni mass produced in the ejecta. Elmhamdi et al. (2003) proposed that the luminosity of the H emission line in the nebular phase is proportional to the mass of 56Ni ejected, and Maguire et al. (2012) obtained the relationship between the FWHMcorr (full width at half-maximum intensity that has been corrected for the instrumental broadening effect) of the nebular H emission and the mass of 56Ni. We obtained FWHM Å for the H emission line in the nebular phase, and according to Eq. (7) below from Maguire et al. (2012), we obtain :
| (7) |
where and .
Figure 14 shows the correlation between the 56Ni mass estimated from the luminosity in the radioactive tail and the FWHMcorr of the nebular H emission line, where the red data points are from Maguire et al. (2012), and the solid black line is the correlation obtained by Maguire et al. (2012). The uncertainty increases as FWHMcorr increases, and when FWHMcorr exceeds 80 Å, the uncertainty is too large. This is likely due to a lack of samples for high 56Ni mass and FWHMcorr. Although the uncertainty is large, this result also supports a high 56Ni mass for SN 2021dbg.

| Lines | H | [O \@slowromancapi@], 6364 | Na \@slowromancapi@ D | Mg \@slowromancapi@] | [Fe \@slowromancapii@], 7172 | [Ca \@slowromancapii@], 7323 | Ca \@slowromancapii@ NIR |
|---|---|---|---|---|---|---|---|
| Line F/56Co power | 0.0534 | 0.0313 | 0.0128 | 0.0045 | 0.0143 | 0.0381 | 0.0267 |
5 Conclusions
We analyzed photometry of SN 2021dbg and found that the light-curve evolution is similar to that of SNe \@slowromancapii@P, but brighter overall than that of all typical SNe \@slowromancapii@P. Its luminosity is comparable to the middle brightness of SNe \@slowromancapii@L and slightly fainter than the median brightness of SNe \@slowromancapii@n. SN 2021dbg is bluer in color than most SNe \@slowromancapii@, because its temperature ( K at peak luminosity) and energy ( erg, total kinetic energy and radiation energy) are higher than those of most SNe \@slowromancapii@. The energy released by SN 2021dbg is large, the ejecta velocity is high, and the spectral features of SN 2021dbg are closer to those of SNe \@slowromancapii@L, suggesting that SN 2021dbg is in the transition zone between SNe \@slowromancapii@P and SNe \@slowromancapii@L.
According to the tail luminosity, we estimate that SN 2021dbg produced about M⊙ of 56Ni. However, such high 56Ni production is rare, according to statistics of Hamuy (2003); only SN 1992am (0.256 M⊙) and SN 1992af (0.156 M⊙) produced similar amounts of 56Ni. Bracha (2019) discovered another one, SN 2018hmx (0.14–0.17 M⊙), and proposed that these high-56Ni-mass SNe \@slowromancapii@ might link to high luminosities and velocities, but not to extreme progenitor parameters, and low metallicity might also play a role.
The early spectra exhibited flash emission lines, which disappeared within approximately 5 days, indicating that there was a small amount of CSM near the progenitor star of SN 2021dbg and it was quickly wiped out by the ejecta. By analyzing the H flash emission line, we estimated that the mass loss rate of the progenitor star was to M⊙ yr-1, and the mass of the CSM was about (1.0–2.0) M⊙, which had been produced about within 2–3 yr before the explosion. This result shows that the progenitor of SN 2021dbg has an enhanced mass loss before the explosion.
The H emission line of SN 2021dbg has a large blue-end broadening and a substantial blueshift at the peak in the photosphere phase, which is interpreted as a direct consequence of a steep density profile of the thick ejecta layer. This peak blueshift decreases at a relatively slower rate, suggesting that the progenitor of SN 2021dbg has a thick hydrogen-rich shell with a steep density profile.
The pseudo-bolometric light curve is well-fitted by the method of the LC2 model with a core plus two shells. The model gives the progenitor a mass of M⊙ and an outermost radius of R⊙, supporting that the progenitor is an RSG. It also suggests that the progenitor had a thick H shell of about 400 R⊙, and the thick H shell is approximately divided into two layers of equal thickness.
The matter density, electron density, and temperature of the outer shell are significantly lower than those of the inner shell, suggesting that steep drops for these parameters exist in the transition region between the inner and outer shells. Such a layered structure of the shell may be caused by unstable pulsations.
Following the model proposed by Jerkstrand et al. (2012), we estimated the mass of the progenitor star to be slightly greater than 19 M⊙ by using the nebular-phase spectrum taken with Keck 1 at days, in agreement with the value given by the LC2 model.
References
- Alsabti & Murdin (2017) Alsabti, A. W., & Murdin, P. 2017, Handbook of Supernovae, doi: 10.1007/978-3-319-21846-5
- Anderson et al. (2014) Anderson, J. P., González-Gaitán, S., Hamuy, M., et al. 2014, ApJ, 786, 67, doi: 10.1088/0004-637X/786/1/67
- Arcavi et al. (2012) Arcavi, I., Gal-Yam, A., Cenko, S. B., et al. 2012, ApJ, 756, L30, doi: 10.1088/2041-8205/756/2/L30
- Arcavi et al. (2017) Arcavi, I., Howell, D. A., Kasen, D., et al. 2017, Nature, 551, 210, doi: 10.1038/nature24030
- Arnett & Fu (1989) Arnett, W. D., & Fu, A. 1989, ApJ, 340, 396, doi: 10.1086/167402
- Bostroem et al. (2023) Bostroem, K. A., Pearson, J., Shrestha, M., et al. 2023, ApJ, 956, L5, doi: 10.3847/2041-8213/acf9a4
- Bracha (2019) Bracha, S. 2019, in The Extragalactic Explosive Universe: the New Era of Transient Surveys and Data-Driven Discovery, 7, doi: 10.5281/zenodo.3478006
- Branch & Wheeler (2017) Branch, D., & Wheeler, J. C. 2017, Supernova Explosions, doi: 10.1007/978-3-662-55054-0
- Bruch et al. (2021) Bruch, R. J., Gal-Yam, A., Schulze, S., et al. 2021, ApJ, 912, 46, doi: 10.3847/1538-4357/abef05
- Bruch et al. (2023) Bruch, R. J., Gal-Yam, A., Yaron, O., et al. 2023, ApJ, 952, 119, doi: 10.3847/1538-4357/acd8be
- Chevalier (1976) Chevalier, R. A. 1976, ApJ, 207, 872, doi: 10.1086/154557
- Chugai et al. (2002) Chugai, N. N., Blinnikov, S. I., Fassia, A., et al. 2002, MNRAS, 330, 473, doi: 10.1046/j.1365-8711.2002.05086.x
- Crockett et al. (2008) Crockett, R. M., Eldridge, J. J., Smartt, S. J., et al. 2008, MNRAS, 391, L5, doi: 10.1111/j.1745-3933.2008.00540.x
- Dessart et al. (2017) Dessart, L., Hillier, D. J., & Audit, E. 2017, A&A, 605, A83, doi: 10.1051/0004-6361/201730942
- Dhungana et al. (2016) Dhungana, G., Kehoe, R., Vinko, J., et al. 2016, ApJ, 822, 6, doi: 10.3847/0004-637X/822/1/6
- Elmhamdi et al. (2003) Elmhamdi, A., Danziger, I. J., Chugai, N., et al. 2003, MNRAS, 338, 939, doi: 10.1046/j.1365-8711.2003.06150.x
- Fan et al. (2015) Fan, Y.-F., Bai, J.-M., Zhang, J.-J., et al. 2015, Research in Astronomy and Astrophysics, 15, 918, doi: 10.1088/1674-4527/15/6/014
- Faran et al. (2014a) Faran, T., Poznanski, D., Filippenko, A. V., et al. 2014a, MNRAS, 442, 844, doi: 10.1093/mnras/stu955
- Faran et al. (2014b) —. 2014b, MNRAS, 445, 554, doi: 10.1093/mnras/stu1760
- Fassia et al. (2000) Fassia, A., Meikle, W. P. S., Vacca, W. D., et al. 2000, MNRAS, 318, 1093, doi: 10.1046/j.1365-8711.2000.03797.x
- Filippenko (1982) Filippenko, A. V. 1982, PASP, 94, 715, doi: 10.1086/131052
- Filippenko (1988) —. 1988, AJ, 96, 1941, doi: 10.1086/114940
- Filippenko (1997) —. 1997, ARA&A, 35, 309, doi: 10.1146/annurev.astro.35.1.309
- Fu & Arnett (1989) Fu, A., & Arnett, W. D. 1989, ApJ, 340, 414, doi: 10.1086/167403
- Gal-Yam (2017) Gal-Yam, A. 2017, in Handbook of Supernovae, ed. A. W. Alsabti & P. Murdin, 195, doi: 10.1007/978-3-319-21846-5_35
- Gal-Yam et al. (2014) Gal-Yam, A., Arcavi, I., Ofek, E. O., et al. 2014, Nature, 509, 471, doi: 10.1038/nature13304
- Gall et al. (2015) Gall, E. E. E., Polshaw, J., Kotak, R., et al. 2015, A&A, 582, A3, doi: 10.1051/0004-6361/201525868
- Gurugubelli et al. (2008) Gurugubelli, U. K., Sahu, D. K., Anupama, G. C., & Chakradhari, N. K. 2008, Bulletin of the Astronomical Society of India, 36, 79
- Hamuy (2003) Hamuy, M. 2003, ApJ, 582, 905, doi: 10.1086/344689
- Harvey et al. (2021) Harvey, L., Magee, M., Prentice, S., Deckers, M., & Zimmerman, E. 2021, Transient Name Server Classification Report, 2021-489, 1
- Heinze et al. (2018) Heinze, A. N., Tonry, J. L., Denneau, L., et al. 2018, AJ, 156, 241, doi: 10.3847/1538-3881/aae47f
- Hinshaw et al. (2013) Hinshaw, G., Larson, D., Komatsu, E., et al. 2013, ApJS, 208, 19, doi: 10.1088/0067-0049/208/2/19
- Hiramatsu et al. (2023) Hiramatsu, D., Tsuna, D., Berger, E., et al. 2023, ApJ, 955, L8, doi: 10.3847/2041-8213/acf299
- Hosseinzadeh et al. (2018) Hosseinzadeh, G., Valenti, S., McCully, C., et al. 2018, ApJ, 861, 63, doi: 10.3847/1538-4357/aac5f6
- Huang et al. (2018) Huang, F., Wang, X. F., Hosseinzadeh, G., et al. 2018, MNRAS, 475, 3959, doi: 10.1093/mnras/sty066
- Jerkstrand et al. (2012) Jerkstrand, A., Fransson, C., Maguire, K., et al. 2012, A&A, 546, A28, doi: 10.1051/0004-6361/201219528
- Johnson et al. (1966) Johnson, H. L., Mitchell, R. I., Iriarte, B., & Wisniewski, W. Z. 1966, Communications of the Lunar and Planetary Laboratory, 4, 99
- Khazov et al. (2016) Khazov, D., Yaron, O., Gal-Yam, A., et al. 2016, ApJ, 818, 3, doi: 10.3847/0004-637X/818/1/3
- Kiewe et al. (2012) Kiewe, M., Gal-Yam, A., Arcavi, I., et al. 2012, ApJ, 744, 10, doi: 10.1088/0004-637X/744/1/10
- Li et al. (2024) Li, G., Hu, M., Li, W., et al. 2024, Nature, 627, 754, doi: 10.1038/s41586-023-06843-6
- Li et al. (2011) Li, W., Leaman, J., Chornock, R., et al. 2011, MNRAS, 412, 1441, doi: 10.1111/j.1365-2966.2011.18160.x
- Lin et al. (2021) Lin, H., Wang, X., Zhang, J., et al. 2021, MNRAS, 505, 4890, doi: 10.1093/mnras/stab1550
- Maguire et al. (2012) Maguire, K., Jerkstrand, A., Smartt, S. J., et al. 2012, MNRAS, 420, 3451, doi: 10.1111/j.1365-2966.2011.20276.x
- Morozova et al. (2017) Morozova, V., Piro, A. L., & Valenti, S. 2017, ApJ, 838, 28, doi: 10.3847/1538-4357/aa6251
- Nagy & Vinkó (2016) Nagy, A. P., & Vinkó, J. 2016, A&A, 589, A53, doi: 10.1051/0004-6361/201527931
- Nakaoka et al. (2018) Nakaoka, T., Kawabata, K. S., Maeda, K., et al. 2018, ApJ, 859, 78, doi: 10.3847/1538-4357/aabee7
- Nicholl (2018) Nicholl, M. 2018, Research Notes of the American Astronomical Society, 2, 230, doi: 10.3847/2515-5172/aaf799
- Ofek et al. (2013) Ofek, E. O., Lin, L., Kouveliotou, C., et al. 2013, ApJ, 768, 47, doi: 10.1088/0004-637X/768/1/47
- Oke et al. (1995) Oke, J. B., Cohen, J. G., Carr, M., et al. 1995, PASP, 107, 375, doi: 10.1086/133562
- Osterbrock & Ferland (2006) Osterbrock, D. E., & Ferland, G. J. 2006, Astrophysics of gaseous nebulae and active galactic nuclei
- Patat et al. (1993) Patat, F., Barbon, R., Cappellaro, E., & Turatto, M. 1993, A&AS, 98, 443
- Patat et al. (1994) —. 1994, A&A, 282, 731
- Popov (1993) Popov, D. V. 1993, ApJ, 414, 712, doi: 10.1086/173117
- Pritchard et al. (2014) Pritchard, T. A., Roming, P. W. A., Brown, P. J., Bayless, A. J., & Frey, L. H. 2014, ApJ, 787, 157, doi: 10.1088/0004-637X/787/2/157
- Richardson et al. (2002) Richardson, D., Branch, D., Casebeer, D., et al. 2002, AJ, 123, 745, doi: 10.1086/338318
- Sahu et al. (2006) Sahu, D. K., Anupama, G. C., Srividya, S., & Muneer, S. 2006, MNRAS, 372, 1315, doi: 10.1111/j.1365-2966.2006.10937.x
- Sanders et al. (2015) Sanders, N. E., Soderberg, A. M., Gezari, S., et al. 2015, ApJ, 799, 208, doi: 10.1088/0004-637X/799/2/208
- Schlafly & Finkbeiner (2011) Schlafly, E. F., & Finkbeiner, D. P. 2011, ApJ, 737, 103, doi: 10.1088/0004-637X/737/2/103
- Schlegel (1990) Schlegel, E. M. 1990, MNRAS, 244, 269
- Smith et al. (2023) Smith, N., Pearson, J., Sand, D. J., et al. 2023, ApJ, 956, 46, doi: 10.3847/1538-4357/acf366
- Spiro et al. (2014) Spiro, S., Pastorello, A., Pumo, M. L., et al. 2014, MNRAS, 439, 2873, doi: 10.1093/mnras/stu156
- Stetson (1987) Stetson, P. B. 1987, PASP, 99, 191, doi: 10.1086/131977
- Szalai et al. (2019) Szalai, T., Vinkó, J., Könyves-Tóth, R., et al. 2019, ApJ, 876, 19, doi: 10.3847/1538-4357/ab12d0
- Taubenberger et al. (2009) Taubenberger, S., Valenti, S., Benetti, S., et al. 2009, MNRAS, 397, 677, doi: 10.1111/j.1365-2966.2009.15003.x
- Terreran et al. (2016) Terreran, G., Jerkstrand, A., Benetti, S., et al. 2016, MNRAS, 462, 137, doi: 10.1093/mnras/stw1591
- Tomasella et al. (2013) Tomasella, L., Cappellaro, E., Fraser, M., et al. 2013, MNRAS, 434, 1636, doi: 10.1093/mnras/stt1130
- Tonry et al. (2018a) Tonry, J. L., Denneau, L., Heinze, A. N., et al. 2018a, PASP, 130, 064505, doi: 10.1088/1538-3873/aabadf
- Tonry et al. (2018b) Tonry, J. L., Denneau, L., Flewelling, H., et al. 2018b, ApJ, 867, 105, doi: 10.3847/1538-4357/aae386
- Tsvetkov et al. (2021) Tsvetkov, D. Y., Pavlyuk, N. N., Vozyakova, O. V., et al. 2021, Astronomy Letters, 47, 291, doi: 10.1134/S1063773721050078
- Valenti et al. (2015) Valenti, S., Sand, D., Stritzinger, M., et al. 2015, MNRAS, 448, 2608, doi: 10.1093/mnras/stv208
- Valenti et al. (2016) Valenti, S., Howell, D. A., Stritzinger, M. D., et al. 2016, MNRAS, 459, 3939, doi: 10.1093/mnras/stw870
- Van Dyk et al. (2019) Van Dyk, S. D., Zheng, W., Maund, J. R., et al. 2019, ApJ, 875, 136, doi: 10.3847/1538-4357/ab1136
- Wang et al. (2019) Wang, C.-J., Bai, J.-M., Fan, Y.-F., et al. 2019, Research in Astronomy and Astrophysics, 19, 149, doi: 10.1088/1674-4527/19/10/149
- Wygoda et al. (2019) Wygoda, N., Elbaz, Y., & Katz, B. 2019, MNRAS, 484, 3941, doi: 10.1093/mnras/stz145
- Yang & Sollerman (2023) Yang, S., & Sollerman, J. 2023, ApJS, 269, 40, doi: 10.3847/1538-4365/acfcb4
- Yaron et al. (2017) Yaron, O., Perley, D. A., Gal-Yam, A., et al. 2017, Nature Physics, 13, 510, doi: 10.1038/nphys4025
- Yoon & Cantiello (2010) Yoon, S.-C., & Cantiello, M. 2010, ApJ, 717, L62, doi: 10.1088/2041-8205/717/1/L62
- Zhang et al. (2021) Zhang, J., Zhai, Q., & Wang, X. 2021, Transient Name Server Classification Report, 2021-501, 1
- Zhang et al. (2020) Zhang, J., Wang, X., József, V., et al. 2020, MNRAS, 498, 84, doi: 10.1093/mnras/staa2273
- Zhang et al. (2023) Zhang, J., Lin, H., Wang, X., et al. 2023, Science Bulletin, 68, 2548, doi: doi.org/10.1016/j.scib.2023.09.015
- Zhang et al. (2024) Zhang, J., Dessart, L., Wang, X., et al. 2024, arXiv e-prints, arXiv:2406.07806. https://arxiv.org/abs/2406.07806
- Zimmerman et al. (2024) Zimmerman, E. A., Irani, I., Chen, P., et al. 2024, Nature, 627, 759, doi: 10.1038/s41586-024-07116-6
Appendix A Photometric and Spectroscopic Data

| MJD | PHASE | TELESCOPE+INSTRUMENT | FILTER | MAG | EMAG |
|---|---|---|---|---|---|
| 59261.67 | 3.17 | LJT | B | 17.04 | 0.01 |
| 59262.66 | 4.16 | LJT | B | 16.73 | 0.01 |
| 59266.72 | 8.22 | LJT | B | 16.34 | 0.01 |
| 59268.77 | 10.27 | LJT | B | 16.26 | 0.02 |
| 59274.74 | 16.24 | LJT | B | 16.5 | 0.02 |
| 59276.67 | 18.17 | LJT | B | 16.56 | 0.03 |
| 59280.66 | 22.16 | LJT | B | 16.87 | 0.01 |
| 59284.77 | 26.27 | LJT | B | 17.13 | 0.01 |
| 59285.67 | 27.17 | LJT | B | 17.19 | 0.01 |
| 59287.71 | 29.21 | LJT | B | 17.26 | 0.01 |
| 59290.68 | 32.18 | LJT | B | 17.46 | 0.01 |
| 59293.73 | 35.23 | LJT | B | 17.59 | 0.06 |
| 59295.75 | 37.25 | LJT | B | 17.64 | 0.04 |
| 59301.68 | 43.18 | LJT | B | 17.78 | 0.1 |
| 59304.65 | 46.15 | LJT | B | 17.95 | 0.1 |
| 59305.68 | 47.18 | LJT | B | 18.11 | 0.04 |
| 59310.70 | 52.2 | LJT | B | 18.15 | 0.03 |
| 59313.70 | 55.2 | LJT | B | 18.25 | 0.03 |
| 59315.70 | 57.2 | LJT | B | 18.35 | 0.02 |
| 59317.56 | 59.06 | LJT | B | 18.37 | 0.04 |
| 59319.64 | 61.14 | LJT | B | 18.31 | 0.02 |
| 59322.68 | 64.18 | LJT | B | 18.37 | 0.04 |
| 59323.70 | 65.2 | LJT | B | 18.49 | 0.04 |
| 59331.53 | 73.03 | LJT | B | 18.46 | 0.1 |
| 59333.53 | 75.03 | LJT | B | 18.47 | 0.06 |
| 59338.62 | 80.12 | LJT | B | 18.55 | 0.09 |
| 59342.54 | 84.04 | LJT | B | 18.62 | 0.05 |
| 59346.61 | 88.11 | LJT | B | 18.67 | 0.02 |
| 59350.56 | 92.06 | LJT | B | 18.71 | 0.02 |
| 59364.54 | 106.04 | LJT | B | 19.03 | 0.14 |
| 59261.67 | 3.17 | LJT | V | 17.11 | 0.01 |
| 59262.66 | 4.16 | LJT | V | 16.79 | 0.01 |
| 59266.72 | 8.22 | LJT | V | 16.21 | 0.01 |
| 59268.77 | 10.27 | LJT | V | 16.15 | 0.01 |
| 59274.74 | 16.24 | LJT | V | 16.25 | 0.02 |
| 59276.67 | 18.17 | LJT | V | 16.34 | 0.04 |
| 59280.66 | 22.16 | LJT | V | 16.54 | 0.01 |
| 59284.77 | 26.27 | LJT | V | 16.7 | 0.01 |
| 59285.67 | 27.17 | LJT | V | 16.69 | 0.01 |
| 59287.71 | 29.21 | LJT | V | 16.79 | 0.01 |
| 59290.68 | 32.18 | LJT | V | 16.88 | 0.01 |
| 59293.73 | 35.23 | LJT | V | 16.94 | 0.03 |
| 59295.75 | 37.25 | LJT | V | 17.06 | 0.03 |
| 59301.68 | 43.18 | LJT | V | 17.15 | 0.04 |
| 59304.65 | 46.15 | LJT | V | 17.17 | 0.03 |
| 59305.68 | 47.18 | LJT | V | 17.2 | 0.02 |
| 59310.7 | 52.2 | LJT | V | 17.25 | 0.01 |
| 59313.7 | 55.2 | LJT | V | 17.29 | 0.01 |
| 59315.7 | 57.2 | LJT | V | 17.29 | 0.01 |
| 59317.56 | 59.06 | LJT | V | 17.31 | 0.02 |
| 59319.64 | 61.14 | LJT | V | 17.3 | 0.01 |
| 59322.68 | 64.18 | LJT | V | 17.33 | 0.02 |
| 59323.7 | 65.2 | LJT | V | 17.38 | 0.02 |
| 59331.53 | 73.03 | LJT | V | 17.4 | 0.03 |
| 59333.53 | 75.03 | LJT | V | 17.43 | 0.02 |
| 59338.62 | 80.12 | LJT | V | 17.51 | 0.06 |
| 59342.54 | 84.04 | LJT | V | 17.53 | 0.02 |
| 59346.61 | 88.11 | LJT | V | 17.55 | 0.01 |
| 59350.56 | 92.06 | LJT | V | 17.59 | 0.01 |
| 59362.55 | 104.05 | LJT | V | 17.73 | 0.02 |
| 59559.73 | 301.23 | LJT | V | 21.45 | 0.21 |
| 59610.95 | 352.45 | LJT | V | 21.79 | 0.15 |
| 59613.68 | 355.18 | LJT | V | 21.79 | 0.14 |
| 59617.7 | 359.2 | LJT | V | 21.83 | 0.2 |
| 59261.67 | 3.17 | LJT | g | 17.02 | 0.01 |
| 59262.66 | 4.16 | LJT | g | 16.64 | 0.01 |
| 59266.72 | 8.22 | LJT | g | 16.16 | 0.01 |
| 59268.77 | 10.27 | LJT | g | 16.13 | 0.01 |
| 59274.74 | 16.24 | LJT | g | 16.37 | 0.07 |
| 59276.67 | 18.17 | LJT | g | 16.45 | 0.01 |
| 59280.66 | 22.16 | LJT | g | 16.68 | 0.01 |
| 59284.77 | 26.27 | LJT | g | 16.88 | 0.01 |
| 59285.67 | 27.17 | LJT | g | 16.94 | 0.01 |
| 59287.71 | 29.21 | LJT | g | 17.05 | 0.01 |
| 59290.68 | 32.18 | LJT | g | 17.1 | 0.01 |
| 59293.73 | 35.23 | LJT | g | 17.31 | 0.05 |
| 59295.75 | 37.25 | LJT | g | 17.33 | 0.03 |
| 59301.68 | 43.18 | LJT | g | 17.58 | 0.08 |
| 59304.65 | 46.15 | LJT | g | 17.64 | 0.03 |
| 59305.68 | 47.18 | LJT | g | 17.68 | 0.13 |
| 59310.7 | 52.2 | LJT | g | 17.75 | 0.01 |
| 59313.7 | 55.2 | LJT | g | 17.73 | 0.01 |
| 59315.7 | 57.2 | LJT | g | 17.78 | 0.01 |
| 59317.56 | 59.06 | LJT | g | 17.8 | 0.02 |
| 59319.64 | 61.14 | LJT | g | 17.79 | 0.02 |
| 59322.68 | 64.18 | LJT | g | 17.81 | 0.02 |
| 59323.7 | 65.2 | LJT | g | 17.83 | 0.02 |
| 59331.53 | 73.03 | LJT | g | 17.89 | 0.02 |
| 59333.53 | 75.03 | LJT | g | 17.87 | 0.02 |
| 59338.62 | 80.12 | LJT | g | 17.91 | 0.04 |
| 59342.54 | 84.04 | LJT | g | 17.97 | 0.02 |
| 59346.61 | 88.11 | LJT | g | 18.04 | 0.01 |
| 59350.56 | 92.06 | LJT | g | 18.08 | 0.01 |
| 59361.57 | 103.07 | LJT | g | 18.21 | 0.15 |
| 59364.54 | 106.04 | LJT | g | 18.26 | 0.04 |
| 59510.93 | 252.43 | LJT | g | 20.77 | 0.13 |
| 59610.95 | 352.45 | LJT | g | 22.21 | 0.15 |
| 59613.68 | 355.18 | LJT | g | 22.21 | 0.08 |
| 59634.76 | 376.26 | LJT | g | 22.55 | 0.14 |
| 59261.67 | 3.17 | LJT | r | 17.38 | 0.01 |
| 59262.66 | 4.16 | LJT | r | 17.03 | 0.02 |
| 59266.72 | 8.22 | LJT | r | 16.48 | 0.01 |
| 59268.77 | 10.27 | LJT | r | 16.33 | 0.01 |
| 59274.74 | 16.24 | LJT | r | 16.37 | 0.01 |
| 59276.67 | 18.17 | LJT | r | 16.42 | 0.00 |
| 59284.77 | 26.27 | LJT | r | 16.71 | 0.01 |
| 59285.67 | 27.17 | LJT | r | 16.75 | 0.01 |
| 59287.71 | 29.21 | LJT | r | 16.79 | 0.01 |
| 59290.68 | 32.18 | LJT | r | 16.85 | 0.01 |
| 59293.73 | 35.23 | LJT | r | 16.99 | 0.06 |
| 59295.75 | 37.25 | LJT | r | 17.05 | 0.03 |
| 59301.68 | 43.18 | LJT | r | 17.1 | 0.07 |
| 59304.65 | 46.15 | LJT | r | 17.09 | 0.05 |
| 59305.68 | 47.18 | LJT | r | 17.08 | 0.03 |
| 59310.7 | 52.2 | LJT | r | 17.13 | 0.01 |
| 59313.7 | 55.2 | LJT | r | 17.09 | 0.01 |
| 59315.7 | 57.2 | LJT | r | 17.1 | 0.01 |
| 59317.56 | 59.06 | LJT | r | 17.12 | 0.01 |
| 59319.64 | 61.14 | LJT | r | 17.12 | 0.02 |
| 59322.68 | 64.18 | LJT | r | 17.1 | 0.01 |
| 59323.7 | 65.2 | LJT | r | 17.14 | 0.02 |
| 59331.53 | 73.03 | LJT | r | 17.11 | 0.02 |
| 59333.53 | 75.03 | LJT | r | 17.12 | 0.01 |
| 59338.62 | 80.12 | LJT | r | 17.13 | 0.04 |
| 59342.54 | 84.04 | LJT | r | 17.18 | 0.01 |
| 59346.61 | 88.11 | LJT | r | 17.22 | 0.01 |
| 59350.56 | 92.06 | LJT | r | 17.29 | 0.01 |
| 59356.55 | 98.05 | LJT | r | 17.31 | 0.02 |
| 59361.57 | 103.07 | LJT | r | 17.29 | 0.05 |
| 59362.55 | 104.05 | LJT | r | 17.35 | 0.01 |
| 59510.93 | 252.43 | LJT | r | 20.12 | 0.06 |
| 59559.73 | 301.23 | LJT | r | 20.34 | 0.06 |
| 59610.95 | 352.45 | LJT | r | 20.95 | 0.13 |
| 59613.68 | 355.18 | LJT | r | 20.82 | 0.14 |
| 59617.7 | 359.2 | LJT | r | 20.93 | 0.11 |
| 59634.76 | 376.26 | LJT | r | 20.98 | 0.12 |
| 59261.67 | 3.17 | LJT | i | 17.57 | 0.01 |
| 59262.66 | 4.16 | LJT | i | 17.13 | 0.05 |
| 59266.72 | 8.22 | LJT | i | 16.55 | 0.01 |
| 59268.77 | 10.27 | LJT | i | 16.37 | 0.01 |
| 59274.74 | 16.24 | LJT | i | 16.39 | 0.01 |
| 59276.67 | 18.17 | LJT | i | 16.47 | 0.01 |
| 59280.66 | 22.16 | LJT | i | 16.67 | 0.01 |
| 59284.77 | 26.27 | LJT | i | 16.77 | 0.01 |
| 59285.67 | 27.17 | LJT | i | 16.79 | 0.01 |
| 59287.71 | 29.21 | LJT | i | 16.85 | 0.01 |
| 59290.68 | 32.18 | LJT | i | 16.89 | 0.01 |
| 59293.73 | 35.23 | LJT | i | 16.96 | 0.02 |
| 59295.75 | 37.25 | LJT | i | 17.01 | 0.02 |
| 59301.68 | 43.18 | LJT | i | 17.11 | 0.05 |
| 59304.65 | 46.15 | LJT | i | 17.12 | 0.12 |
| 59305.68 | 47.18 | LJT | i | 17.15 | 0.04 |
| 59310.7 | 52.2 | LJT | i | 17.17 | 0.01 |
| 59313.7 | 55.2 | LJT | i | 17.18 | 0.01 |
| 59315.7 | 57.2 | LJT | i | 17.15 | 0.01 |
| 59317.56 | 59.06 | LJT | i | 17.17 | 0.01 |
| 59319.64 | 61.14 | LJT | i | 17.15 | 0.02 |
| 59322.68 | 64.18 | LJT | i | 17.14 | 0.01 |
| 59323.7 | 65.2 | LJT | i | 17.12 | 0.01 |
| 59331.53 | 73.03 | LJT | i | 17.11 | 0.02 |
| 59333.53 | 75.03 | LJT | i | 17.1 | 0.01 |
| 59338.62 | 80.12 | LJT | i | 17.15 | 0.04 |
| 59342.54 | 84.04 | LJT | i | 17.17 | 0.01 |
| 59346.61 | 88.11 | LJT | i | 17.21 | 0.01 |
| 59350.56 | 92.06 | LJT | i | 17.24 | 0.01 |
| 59356.55 | 98.05 | LJT | i | 17.28 | 0.02 |
| 59361.57 | 103.07 | LJT | i | 17.29 | 0.06 |
| 59362.55 | 104.05 | LJT | i | 17.31 | 0.01 |
| 59510.93 | 252.43 | LJT | i | 19.62 | 0.08 |
| 59559.73 | 301.23 | LJT | i | 20.12 | 0.08 |
| 59610.95 | 352.45 | LJT | i | 20.88 | 0.15 |
| 59613.68 | 355.18 | LJT | i | 20.72 | 0.12 |
| 59617.7 | 359.2 | LJT | i | 20.89 | 0.12 |
| 59634.76 | 376.26 | LJT | i | 20.93 | 0.11 |
| 59260.45 | 1.95 | ATLAS-01 | c | 18.04 | 0.03 |
| 59261.45 | 2.95 | ATLAS-01 | c | 17.25 | 0.01 |
| 59262.45 | 3.95 | ATLAS-02 | c | 16.84 | 0.01 |
| 59264.44 | 5.94 | ATLAS-01 | c | 16.58 | 0.02 |
| 59264.45 | 5.95 | ATLAS-01 | o | 16.70 | 0.01 |
| 59266.45 | 7.95 | ATLAS-02 | o | 16.42 | 0.01 |
| 59268.38 | 9.88 | ATLAS-01 | o | 16.34 | 0.01 |
| 59270.50 | 12.00 | ATLAS-01 | c | 16.35 | 0.01 |
| 59276.41 | 17.91 | ATLAS-01 | o | 16.45 | 0.01 |
| 59276.55 | 18.05 | ATLAS-01 | c | 16.45 | 0.01 |
| 59278.46 | 19.96 | ATLAS-02 | o | 16.49 | 0.01 |
| 59280.46 | 21.96 | ATLAS-01 | c | 16.58 | 0.01 |
| 59280.40 | 21.90 | ATLAS-01 | o | 16.53 | 0.01 |
| 59288.36 | 29.86 | ATLAS-01 | o | 16.80 | 0.01 |
| 59290.50 | 32.00 | ATLAS-01 | c | 16.91 | 0.02 |
| 59292.34 | 33.84 | ATLAS-01 | o | 16.85 | 0.01 |
| 59294.37 | 35.87 | ATLAS-02 | o | 16.90 | 0.02 |
| 59300.38 | 41.88 | ATLAS-01 | o | 17.02 | 0.05 |
| 59300.50 | 42.00 | ATLAS-01 | c | 17.20 | 0.02 |
| 59304.43 | 45.93 | ATLAS-01 | o | 16.92 | 0.02 |
| 59306.38 | 47.88 | ATLAS-02 | o | 16.99 | 0.01 |
| 59307.41 | 48.91 | ATLAS-01 | c | 17.38 | 0.02 |
| 59308.33 | 49.83 | ATLAS-01 | c | 17.38 | 0.02 |
| 59312.34 | 53.84 | ATLAS-01 | c | 17.40 | 0.02 |
| 59322.32 | 63.82 | ATLAS-02 | o | 17.07 | 0.02 |
| 59324.31 | 65.81 | ATLAS-01 | o | 17.08 | 0.02 |
| 59326.29 | 67.79 | ATLAS-02 | o | 17.01 | 0.02 |
| 59328.33 | 69.83 | ATLAS-01 | o | 17.08 | 0.03 |
| 59331.34 | 72.84 | ATLAS-01 | o | 17.06 | 0.02 |
| 59332.29 | 73.79 | ATLAS-01 | o | 17.11 | 0.02 |
| 59334.30 | 75.80 | ATLAS-02 | o | 17.10 | 0.01 |
| 59336.32 | 77.82 | ATLAS-01 | o | 17.16 | 0.01 |
| 59338.33 | 79.83 | ATLAS-02 | c | 17.55 | 0.04 |
| 59342.29 | 83.79 | ATLAS-02 | c | 17.56 | 0.02 |
| 59344.29 | 85.79 | ATLAS-01 | o | 17.16 | 0.01 |
| 59346.27 | 87.77 | ATLAS-02 | c | 17.63 | 0.02 |
| 59348.26 | 89.76 | ATLAS-01 | o | 17.24 | 0.01 |
| 59350.26 | 91.76 | ATLAS-02 | c | 17.63 | 0.02 |
| 59352.27 | 93.77 | ATLAS-01 | o | 17.25 | 0.02 |
| 59354.30 | 95.80 | ATLAS-02 | o | 17.24 | 0.03 |
| 59358.26 | 99.76 | ATLAS-02 | o | 17.25 | 0.03 |
| 59359.25 | 100.75 | ATLAS-01 | o | 17.25 | 0.02 |
| 59361.26 | 102.76 | ATLAS-02 | o | 17.27 | 0.03 |
| 59368.27 | 109.77 | ATLAS-01 | c | 17.93 | 0.02 |
| 59376.25 | 117.75 | ATLAS-01 | c | 18.07 | 0.05 |
| 59262.41 | 3.91 | SWIFT+UVOT | uw2 | 14.64 | 0.05 |
| 59266.28 | 7.78 | SWIFT+UVOT | uw2 | 15.05 | 0.07 |
| 59272.51 | 14.01 | SWIFT+UVOT | uw2 | 16.3 | 0.08 |
| 59266.28 | 7.78 | SWIFT+UVOT | um2 | 14.81 | 0.07 |
| 59272.51 | 14.01 | SWIFT+UVOT | um2 | 16.22 | 0.08 |
| 59262.41 | 3.91 | SWIFT+UVOT | uw1 | 14.93 | 0.07 |
| 59266.28 | 7.78 | SWIFT+UVOT | uw1 | 14.87 | 0.08 |
| 59272.51 | 14.01 | SWIFT+UVOT | uw1 | 15.89 | 0.09 |
| 59262.41 | 3.91 | SWIFT+UVOT | u | 15.34 | 0.06 |
| 59266.28 | 7.78 | SWIFT+UVOT | u | 15.05 | 0.08 |
| 59272.51 | 14.01 | SWIFT+UVOT | u | 15.42 | 0.07 |
| 59262.41 | 3.91 | SWIFT+UVOT | b | 16.57 | 0.08 |
| 59266.28 | 7.78 | SWIFT+UVOT | b | 16.15 | 0.09 |
| 59272.51 | 14.01 | SWIFT+UVOT | b | 16.3 | 0.08 |
| 59262.41 | 3.91 | SWIFT+UVOT | v | 16.39 | 0.09 |
| 59266.28 | 7.78 | SWIFT+UVOT | v | 16.1 | 0.13 |
| 59272.51 | 14.01 | SWIFT+UVOT | v | 16.06 | 0.11 |
NOTE—Vega magnitude is used in bands and -UVOT, AB magnitude is used in bands and ATLAS bands.
| Star | (J2000) | (J2000) | Pan-STARRS detection | ||||||||||
|---|---|---|---|---|---|---|---|---|---|---|---|---|---|
| 1 | 09:24:41.79 | -06:32:52.45 | 16.90 | 0.02 | 16.08 | 0.01 | 15.77 | 0.01 | 17.40 | 0.02 | 16.41 | 0.01 | 12 |
| 2 | 09:24:32.92 | -06:32:34.25 | 17.58 | 0.02 | 16.53 | 0.02 | 16.09 | 0.01 | 18.17 | 0.03 | 16.96 | 0.01 | 12 |
| 3 | 09:24:18.34 | -06:32:04.92 | 16.08 | 0.01 | 15.66 | 0.01 | 15.53 | 0.02 | 16.44 | 0.01 | 15.83 | 0.01 | 9 |
| 4 | 09:24:14.79 | -06:32:07.26 | 16.96 | 0.03 | 16.24 | 0.01 | 15.94 | 0.01 | 17.43 | 0.02 | 16.53 | 0.01 | 9 |
| 5 | 09:24:40.38 | -06:34:41.14 | 14.31 | 0.01 | 14.07 | 0.01 | 13.99 | 0.01 | 14.61 | 0.01 | 14.16 | 0.00 | 10 |
| 6 | 09:24:37.05 | -06:35:07.05 | 15.89 | 0.01 | 15.54 | 0.01 | 15.43 | 0.02 | 16.23 | 0.01 | 15.68 | 0.01 | 10 |
| 7 | 09:24:32.72 | -06:34:50.41 | 17.24 | 0.02 | 16.69 | 0.01 | 16.49 | 0.01 | 17.65 | 0.01 | 16.91 | 0.01 | 12 |
| 8 | 09:24:40.60 | -06:36:02.30 | 16.35 | 0.02 | 15.92 | 0.01 | 15.78 | 0.02 | 16.72 | 0.01 | 16.09 | 0.01 | 14 |
| 9 | 09:24:36.58 | -06:35:27.53 | 17.12 | 0.02 | 16.63 | 0.01 | 16.47 | 0.01 | 17.51 | 0.01 | 16.83 | 0.01 | 10 |
| 10 | 09:24:17.22 | -06:34:17.96 | 16.73 | 0.02 | 16.01 | 0.01 | 15.75 | 0.01 | 17.20 | 0.02 | 16.30 | 0.01 | 11 |
| 11 | 09:24:29.44 | -06:38:14.73 | 17.07 | 0.02 | 16.64 | 0.01 | 16.47 | 0.02 | 17.44 | 0.01 | 16.81 | 0.01 | 9 |
| 12 | 09:24:21.65 | -06:38:20.25 | 16.10 | 0.01 | 15.73 | 0.01 | 15.61 | 0.01 | 16.45 | 0.01 | 15.88 | 0.01 | 8 |
Note. — Vega magnitude is used in bands and AB magnitude is used in bands.
| UT Date | Phase (d) | Telescope | Instrument | Range (Å) | Rb |
|---|---|---|---|---|---|
| 2021-02-16 a | 2.5 | NTT | EFOSC2 | 3650-8800 | 370 |
| 2021-02-16 | 3 | LJT | YFOSC+G3 | 3505-8765 | 350 |
| 2021-02-18 | 5 | LJT | YFOSC+G14 | 3810-7435 | 580 |
| 2021-02-19 | 6 | LJT | YFOSC+G3 | 3490-8740 | 350 |
| 2021-02-21 | 8 | LJT | YFOSC+G3 | 3485-8740 | 350 |
| 2021-02-23 | 10 | LJT | YFOSC+G3 | 3505-8765 | 350 |
| 2021-03-07 | 22 | LJT | YFOSC+G3 | 3505-8765 | 350 |
| 2021-03-08 | 23 | XLT | BFOSC+G4 | 3875-8825 | 350 |
| 2021-03-11 | 26 | LJT | YFOSC+G3 | 3500-8760 | 350 |
| 2021-03-14 | 29 | LJT | YFOSC+G3 | 3505-8765 | 350 |
| 2021-03-16 | 31 | LJT | YFOSC+G3 | 3500-8760 | 350 |
| 2021-03-24 | 39 | LJT | YFOSC+G3 | 4000-8760 | 350 |
| 2021-04-02 | 48 | LJT | YFOSC+G3 | 3600-8765 | 350 |
| 2021-04-10 | 56 | LJT | YFOSC+G3 | 3700-8765 | 350 |
| 2021-04-15 | 61 | LJT | YFOSC+G3 | 4000-8765 | 350 |
| 2021-04-24 | 70 | LJT | YFOSC+G3 | 4300-8765 | 350 |
| 2021-05-05 | 81 | LJT | YFOSC+G3 | 3800-8760 | 350 |
| 2022-01-31 | 352 | Keck 1 | LRIS | 4270-9000 | 1600 |
aThe classification spectrum obtained by ePESSTO team (Harvey et al., 2021).
bSpectral resolution defined as .
Note. — Phase is relative to the estimated explosion date.