Shapley Effect Estimation using Polynomial Chaos
Abstract
This paper presents an approach for estimating Shapley effects for use as global sensitivity metrics to quantify the relative importance of uncertain model parameters. Polynomial Chaos expansion, a well established approach for developing surrogate models is proposed to be used to estimate Shapley effects. Polynomial Chaos permits the transformation of a stochastic process to a deterministic model which can then be used to efficiently evaluate statistical moments of the quantity of interest. These moments include conditional variances which are algebraically mapped to Shapley effects. The polynomial chaos based estimates of Shapley effects are validated using Monte Carlo simulations and tested on the benchmark Ishigami function and on the dynamic SEIR epidemic model and the Bergman Type 1 diabetes model. The results illustrate the correct ranking of uncertain variables for the Ishigami function in contrast to the Sobol indices and illustrates the time-varying rank ordering of the model parameters for the dynamic models.
keywords:
Uncertainty Quantification , Sensitivity Analysis , Sobol , Shapley , Polynomial Chaos Expansion1 Introduction
Uncertainties are ubiquitous and are broadly classified as Aleatory (irreducible) and Epistemic (reducible). Uncertainty Quantification (UQ) subsumes uncertainty characterization which corresponds to a parametric or non-parametric representation of the uncertainty, and uncertainty propagation which refers to the process of synthesizing the uncertainty in the output due to uncertainties in the input of a model. UQ also includes Global Sensitivity analysis which endeavours to rank the uncertain inputs based on their contributions to the uncertainty in the output.
Quantifying the uncertainty of systems or processes has gained remarkable interest driven by interest in model reduction, decision making under uncertainty, reliability engineering and explainable machine learning [1]. Local sensitivity analysis is a decades-old approach which evaluates the variation in a system’s output to small perturbations about nominal parameters. Meanwhile, Global Sensitivity Analysis (GSA) endeavours to rank the importance of all input variables over their domain of operation. It should be noted that GSA requires prior knowledge about the distribution of the uncertain input variables. GSA began gaining popularity because of the profound growth of computational power during the end of the last century, where the two most common GSA approaches were (1) Morris method [2] and (2) Sobol Analysis [3]. The latter, Sobol analysis, is a variance-based analysis and requires the input variables to be independent. Sobol and Gershman [4] introduced a derivative-based approach which integrated over the uncertain domain served as the global sensitivity metric. This was modified by Kucherenko [5] and called the Derivative-based Global Sensitivity Measures (DGSM). At the same time Sobol’ and Kucherenko revealed a relationship between the Sobol indices and the DGSM[6], which is useful for high dimensional systems [7]. Nandi et al. [8] proposed using a sampling based approach for numerical integration called Conjugate Unscented Transform to more efficiently evaluate Kucherenko’s [5] DGSM metrics.
The global sensitivity indices are generally evaluated via Monte Carlo (MC) sampling or quasi-Monte Carlo sampling, and most recently, via Polynomial Chaos Expansion (PCE). The MC makes use of a “pick-and-freeze” method [3][9] while a PCE surrogate model can be developed using an intrusive or non-intrusive approach. In the intrusive method, one expands the governing equations using separation of variables and applying the Galerkin projection is called the intrusive method. The non-intrusive approach is a sample based approach and being a black-box approach makes coding rather easy [10] [11]. However, for systems with many input variables, it is well know that the PCE can be a computational burden [12]. An even deeper connection between GSA and PCE was made by Sudret [12], who showed that the Sobol indices can be algebraically mapped to the polynomial chaos (PC) -coefficients. Motivated by the computational burden of calculating DGSM measures via MC or quasi MC, Sudret and Mai [13] found a way to compute DGSM measures with PC-coefficients as well.
GSA has been applied in disparate domains since the recognition that it should be an integral part of mathematical modeling [1]. Harman and Johnston [14] described in detail how intrusive PCEs are applied on dynamical system, where they chose the Susceptible-Infected-Recovered (SIR) disease model, and compared it to MC results, while performing a Sobol analysis. A more complex disease model is the Susceptible-Exposed-Infected-Recovered (SEIR) disease model, which was used by Jensen et al. [15]. Based on Danish data for the spread of Covid-19, they performed a Sobol analysis via PCE. To compute Sobol indices faster, Blatman and Sudret [16] proposed a sparse PCE which was used by Lin et al. [17] in a 3D multiphysics model for lithium-ion batteries. In the control engineering field Singh et al. [18] used PCE for the design of robust input shapers. Sobol analysis has also been used in for the analysis of energy consumption of battery electric vehicles [19], Bayesian networks [20], type 1 diabetes modelling [21], state of charge estimation [22] or thermal runaway [23] of lithium-ion batteries [24], underwater gliders [25] or in NOx level sensitivity analysis in premixed burners [26].
Borgonovo [27] introduced a non-moment based global sensitivity measure which compares the distance between two probability density functions (pdf) as the basis of ranking the relative importance of uncertain input variables. Nandi and Singh [28] also introduced a variety of non-moment based global sensitivity measures based on statistical distances including the Wasserstein, Hellinger and Kolmogorov distances. They proposed using polynomial chaos surrogate models to alleviate the computational burden of estimating statistical distances. Both of these papers and one by Chun et al. [29] confirmed the incorrect ranking of the three uncertain variables of the Ishigami function generated by the Sobol indices. The variance based Sobol indices orders the variables in descending order of importance as “1,2,3”, while the non-moment based metrics ranks them as “2,1,3”. This discrepancy can be attributed to the fact that the Ishigami function is characterized by a bi-modal probability density function which the variance based Sobol metrics are unable to rank order correctly.
Shapley value is a concept proposed by Lloyd Shapley in 1953 [30] for a fair distribution of credit amongst players based on their value to the coalition, in a cooperative game setting. The Shapley effect quantifies the average marginal contribution of each player by considering all possible coalitions that the player could be a part of. One of the advantage of using Shapley effects as proxies for global sensitivity measures is that the uncertain input variables can be correlated [31]. The downside of using Shapley effects for a large number of uncertain variables, is the computational cost involved in evaluating the marginal cost of a player in a large selection of coalitions [9] [32] [33] [34] [35].
Owen [36] noted a unique characteristic of the Shapley effects, that is Shapley effects lie between the first-order and total Sobol indices. Iooss and Prieur [35] while investigating dependent input variables found that the “sandwich” effect doesn not always hold true. Owen articulated that Sobol indices are easy to calculate and could be used to bound the Shapley effects for independent variables.
Shapley effects have recently been used in machine learning for feature selection, model interpretability, and model reduction by pruning [37]. The domain of explainable or interpretable Artificial Intelligence is exploiting the use of Shapley effects to help comprehend the decisions of outputs of machine learning models since one of the shortcomings of machine learning based models is their opaqueness due to their black box architecture. A classic example of the use of Shapley effects is to allocate landing fees for a proposed runway; based on aircraft size which correlates to length of required runway [38]. Shapley effects have been used in hydraulic models [39], biomanufacturing process risk [40], power flow models for islanded microgrids [41], drug sensitivity [42], earth fissures [43], and fatigue blade load estimations [44]. Some researchers compared Sobol indices and Shapley effects such as: [45], [46], [47], [35]. Most researchers uses MC sampling to calculate the Shapley effects, such as: [48] [49] [50] [33] [34] [25], to name a few.
Recentely, new ideas have entered the GSA community. One of these new ideas, by Gayrard et al. [51], was to perform stochastic processing with independent increments as inputs. Another, by Song et al. [34], established the connection between the first-order, total, and Shapley effects using the concept of semivalues. Benoumechiara et al. [52] used a Gaussian Process (Kriging model) to calculate Shapley effects faster than with MC, where they presented their findings using violin plots. With a slightly different parametric choice for the Ishigami function than in [29] [27], Benoumechiara et al. [52] and Plischke et al. [32] ranked the order as “2,1,3” derived from Shapley effects. Benoumechiara et al. [52] acknowledged the relationship between Sobol and Shapley for linear Gaussian models and highlighted Sudret’s work [12] on computing Sobol indices from PC-coefficients. Their final remark states: It would be interesting to have such a decomposition for the Shapley effects. because even using Kriging to estimate Shapley effects is computationally expensive, especially in higher dimensions. Our paper is positioned likewise, by establishing a relationship between PC-coefficients and Shapley effects. We will present two static models; which are the Ishigami function in the scheme of [52] [32] and a user-defined function with four uncertain input variables. To illustrate the proposed approach on dynamical models, the SEIR disease model and the Bergman type 1 diabetes model are considered. We highlight that this paper is only focused on independent input variables with a hypercube representing the uncertain domain.
This paper is structured as follows: Section 2 describes the variance-based sensitivity analysis, which includes a description of Sobol analysis, Shapley value theorem, PCE, mapping between PC-coefficients, and Sobol indices, as well as the Borgonovo metric. Section 3 presents the static problems including the Ishigami function and a user-defined function. Section 4 illustrates the GSA on the SEIR disease model and on the Bergman type 1 diabetes model. Our concluding remarks are presented in section 5.
2 Review of Global Sensitivity Metrics
This section reviews well established global sensitivity metrics including Sobol, a variance based metric and the Borgonovo delta metric, a non-moment based metric. It also proposes the use of the Shapley effect as a metric and illustrates how PC-coefficients can algebraically map to Shapley effects.
2.1 Sobol indices
Assume a function is given as:
| (1) |
where is a scalar output and represents the input parameters, presumed to be real numbers. The ANOVA [53] decomposition can be written as [12] :
| (2) |
where is a constant, depends purely on and purely on and . Furthermore, the following condition holds:
| (3) |
which means that the input variables are independent. It can be stated that:
| (4a) | ||||
| (4b) | ||||
| (4c) | ||||
where denotes the integration over all variables except and implies that is a fixed input variable. It is clear that the total variance of can be calculated as follows:
| (5) |
where it is possible to decompose the total variance as:
| (6) |
where we define the set as . Similar to the Eqns. (4a)-(4c) we can represent the variances as:
| (7) | ||||
| (8) |
The Sobol indices can now be calculated as:
| (9) |
where it is known that
| (10) |
The total Sobol indices can be calculated as:
| (11) |
where .
2.2 Shapley value concept
The Shapley effect of each variable is defined as [35]:
| (12) | ||||
| (13) |
where is the number of variables, is the worth or value of the coalition. is a coalition including variable and excluding variable . Shapley effects are shown as importance measures representing the marginal contribution of variable to a coalition . The Shapley value concept has the following features [35]:
-
1.
Relevant when contribution of each player is unequal
-
2.
Cooperation among players is beneficial rather than working independently
-
3.
Shapley effects cannot be negative
-
4.
Shapley effects sum-up to
These features lead to the assertions that:
-
1.
Coalition is at least the empty set
-
2.
Examining Eqn. (13), it is clear that coalition cannot have more than players, because it is already a subset and it is excluding player from the set, so there can be at most coalitions of that type.
Iooss and Prieur [35] proposed a variance based metric for the worth of a coalition:
| (14) |
By assigning uncertain variables as players in a cooperative game setting, Shapley effects could be used as a Global Sensitivity Metric.
2.3 Polynomial Chaos Expansion
A PCE has the form of [10] [18]:
| (15) |
where is the output variable, are the PC-coefficients and are the basis functions. is the degree of the PCE. The orthogonality condition of the basis functions is given by [10]:
| (16) |
where are the coefficients which remain from inner product and is the Kronecker delta. is the pdf of . The Wiener-Askey scheme provides the appropriate polynomial basis functions for standard random variables as illustrated in Table LABEL:table:Wiener_Askey_scheme.
| Distribution of | Polynomial family | Support |
|---|---|---|
| Gaussian | Hermite | |
| gamma | Laguerre | |
| beta | Jacobi | |
| uniform | Legendre |
The PC-coefficients can be determined using an intrusive or non-intrusive approach. The intrusive approach requires evaluation of inner products and might not result in closed form expressions for some nonlinear functions. The non-intrusive approach can be considered a black-box approach which requires solving a least-squares problem to determine the coefficients. In this paper we use the intrusive approach where the coefficients are determined by exploiting Galerkin projections. Consider Eqn. (15) which can be approximated as:
| (17) |
The left-hand side of Eqn. (17) represents the equations which are known and need to be approximated with a order polynomial with coefficients as shown on the right-hand side of Eqn. (17). Assuming is uniformly distributed and selecting for instance results in the PCE:
| (18) |
The Galerkin projection of Eqn. (18) results in:
| (19a) | |||
| (19b) | |||
| (19c) | |||
From Eqns. (19a)-(19c), the PC-coefficients to can be solved by dividing by the constant factors to . For problems with multiple random variable, the basis functions are determined by the tensor product of the one-dimensional basis functions as illustrated in Table LABEL:table:PCE_mixed_variables for two random variables both of which are uniformly distributed.
The polynomial denotes the polynomial basis function, where and are the degrees of the and variables respectively. For this reason, we can write the PCE of the system as:
| (20) |
Multiplying all combinations of with a maximum order of and integrating over and results in equations in 6 unknowns which permit determining the PC-coefficients .
2.4 Mapping between PC-coefficients and Sobol Indices
The mean and variance of the random output expressed via the PCE can be calculated as follows [12]:
| (21) | ||||
| (22) |
Consider a univariate polynomial family and denote it as , where is the polynomial degree. could for instance represent the family of Legendre Polynomials. When more than one variable in a system is uncertain, this idea can be generalized to a multivariate polynomial of order (number of variables) and degree , where the multiplication of univariate polynomials creates the multivariate polynomial of degree . However, the resulting degree must be less or equal than . Therefore, we define:
| (23) |
which introduces a set, where is a natural number and corresponds to the degree of the i-th univariate polynomial with respect to the variable . Then, the multivariate polynomial can be expressed as the multiplication of univariate polynomials:
| (24) |
The number of polynomials satisfying Eqn. (23) is given by [12]:
| (25) |
Let us define which consists of -tuples where corresponds to a set of variables which are chosen. Therefore, certain tuple elements are zero.
| (26) |
where . Eqn. (26) states that any is non-zero if it lies in . Now, the ANOVA decomposition of can be derived as:
| (27) |
Note that each term reads like: The term gets only considered if the tuple purely depends on the variables . Accordingly, the PC based Sobol indices can be calculated as [12]:
| (28) |
Since the PC-coefficients can now be mapped to the Sobol indices, the question arises if the Shapley effects can also be calculated from the PC-coefficients. One could say that we just need to calculate the worth of all coalitions. For a system with unknowns, the Sobol indices can mapped to the worth of all coalitions as follows:
| (29a) | ||||
| (29b) | ||||
| (29c) | ||||
| (29d) | ||||
Note that stands for all possible combinations of proper subsets of whereas stands for the intersecting set of . For a set we can derive proper subsets, because the empty set is a proper subset of every set except for the empty set itself. The worths presented in Eqns. (29a)-(29d) can be directly substituted into Eqn. (12).
If one maps PC-coefficients to Sobol indices, the Shapley effects can be calculated as:
| (30) |
Figure 1 shows the difference between calculating Shapley effects with Eqn. (14) and PC-coefficients. This sheds light on the relation of Sobol indices and Shapley effects. Moreover given all values of , it is possible to map to the corresponding and vice versa.

2.5 Borgonovo metric
The Borgonovo metric [27] is a method which measures the shift between the unconditional and conditional pdfs, which is illustrated in Figure 2.

Assume that a function has uncertain variables. The shift can then be used to provide a ranking order of importance for all uncertain variables. The main idea is that variables with little impact on the output show a small shift and variables with a large impact have a large shift. The definition of a shift, which is noted as , between two pdfs can be written as [27]:
| (31) |
where is the pdf of the output and is the conditional pdf for a given variable . Furthermore, the expected shift between and can be written as:
| (32) |
Finally, the Borgonovo index [27] can be derived from the expected shift, which is:
| (33) |
where is a moment independent sensitivity measurement for an uncertain variable with respect to an output .
3 Algebraic Examples
This section will present two algebraic examples including the Ishigami function and a user-defined function.
3.1 Ishigami function
A benchmark problem for global sensitivity analysis is the Ishigami function, especially because of its bi-modal pdf. The function is given as:
| (34) |
where and are parameters consistent with those used in the literature. , and are uncertain variables, where it is assumed that all variables are uniformly distributed between and . The pdf of the Ishigami function is shown in Figure 3.

The expected value and the total variance can be analytically evaluated by integrating over all three uncertain variables:
| (35) | ||||
| (36) |
To determine the Sobol indices, three first-order, three second-order and one third-order indices need to be computed. For the first-order Sobol index, the conditional variances can be evaluated as:
| (37) | ||||
| (38) | ||||
| (39) |
where means that the integral is calculated for all variables except . For the second-order Sobol indices, the conditional variances can be specifically calculated as:
| (40) | ||||
| (41) | ||||
| (42) |
For the third-order Sobol the conditional variances can be specifically calculated as:
| (43) | ||||
| (44) | ||||
| (45) |
The Sobol indices from the analytical evaluation are presented in Table LABEL:table:Ishigami_Sobol_indices_analytical_and_PC to permit their comparison to those determined using the PCE surrogate model.
| Index | Analytical | PCE order | |||
|---|---|---|---|---|---|
| 0.3139 | 0.6582 | 0.3699 | 0.3166 | 0.3140 | |
| 0.4424 | 0.0540 | 0.3545 | 0.4377 | 0.4423 | |
| 0 | 0 | 0 | 0 | 0 | |
| 0 | 0 | 0 | 0 | 0 | |
| 0.2437 | 0.2878 | 0.2756 | 0.2456 | 0.2437 | |
| 0 | 0 | 0 | 0 | 0 | |
| 0 | 0 | 0 | 0 | 0 | |
| 0.5576 | 0.9460 | 0.6455 | 0.5623 | 0.5577 | |
| 0.4424 | 0.0540 | 0.3545 | 0.4377 | 0.4423 | |
| 0.2437 | 0.2878 | 0.2756 | 0.2456 | 0.2437 | |
Table LABEL:table:Ishigami_Sobol_indices_analytical_and_PC shows that, with increasing PC degree, the Sobol indices converge to the analytical solution. To determine the Shapley effects, the worth of a coalition can also be calculated analytically with Eqn. (14) and is presented in Table LABEL:table:Ishigami_Shapley_values_analytical_and_PC.
| Worth | Analytical | PCE order | |||
|---|---|---|---|---|---|
| 0.3139 | 0.6582 | 0.3699 | 0.3166 | 0.3140 | |
| 0.4424 | 0.0540 | 0.3545 | 0.4377 | 0.4423 | |
| 0 | 0 | 0 | 0 | 0 | |
| 0.7563 | 0.7122 | 0.7244 | 0.7544 | 0.7563 | |
| 0.5576 | 0.9460 | 0.6455 | 0.5623 | 0.5577 | |
| 0.4424 | 0.0540 | 0.3545 | 0.4377 | 0.4423 | |
| 1 | 1 | 1 | 1 | 1 | |
| 0.4357 | 0.8021 | 0.5077 | 0.4395 | 0.4358 | |
| 0.4424 | 0.0540 | 0.3545 | 0.4377 | 0.4423 | |
| 0.1218 | 0.1439 | 0.1378 | 0.1228 | 0.1219 | |
Note that the worth of an empty coalition is . Similar to the Sobol indices in Table LABEL:table:Ishigami_Sobol_indices_analytical_and_PC, Table LABEL:table:Ishigami_Shapley_values_analytical_and_PC illustrates the convergence of the coalitions worth to their analytical values when the PC degree is increased and therefore a convergence of the Shapley effects to the analytical solution can also be noted. The remaining questions is: What exactly makes computing Shapley effects different from the Sobol analysis? Sobol and Shapley can be used to rank the importance of uncertain variables in a system. This means that a higher ranked uncertain variable contributes more to the perturbation of the output variable. Taking the route of computing Shapley effects via the Sobol indices from Figure 1, we can try to look at the weighting of those indices. Table LABEL:table:Ishigami_Sobol_vs_Shapley_analytical_weights is specifically tailored for the Ishigami function and provides a deeper understanding of the weighting.
| Sobol Index | Weight for | Weight for | Analytical |
|---|---|---|---|
| 1 | 1 | 0.3139 | |
| 1 | 1 | 0.4424 | |
| 1 | 1 | 0 | |
| 1 | 1/2 | 0 | |
| 1 | 1/2 | 0.2437 | |
| 1 | 1/2 | 0 | |
| 1 | 1/3 | 0 |
If we use the analytical values from Table LABEL:table:Ishigami_Sobol_vs_Shapley_analytical_weights we can calculate the Shapley effects from the Sobol indices as follows:
| (46a) | |||
| (46b) | |||
| (46c) | |||
Conversely, the total Sobol index can be calculated as follows:
| (47a) | |||
| (47b) | |||
| (47c) | |||
The results from Eqns. (46a)-(46c) compared to Eqns. (47a)-(47c) show that Shapley is weighing the higher order Sobol indices lower compared to Sobol where each index is equally weighted. Evaluating the ranking from a Sobol perspective suggests to order the uncertain variables as , and , while Shapley suggests , and . In fact, we can note if only first-order Sobol indices exist and higher order ones are zero, the total Sobol indices will be identical with the Shapley effects.
As pointed out in [32] and [52], the uncertain variable is more important than . The clearest way of evaluating the ranking of the uncertain variables is to compute the Borgonovo index as described in subsection 2.5 or other statistical distances [28] because they are based on pdfs which can be computational expensive. MC evaluations to calculate the Borgonovo index reveals the uncertain variables are ranked as , and , which is the same rank order which Shapley suggests. Results of all three methods are listed in Table LABEL:table:Ishigami_Sobol_indices_and_Shapley_values_comparision.
| Variable | Total Sobol | Shapley | Borgonovo |
|---|---|---|---|
| 0.5576 | 0.4357 | 0.2392 | |
| 0.4424 | 0.4424 | 0.4222 | |
| 0.2437 | 0.1218 | 0.1957 |
3.2 User-defined function
We consider a polynomial function to illustrate the evaluation of the Shapley effects where:
| (48) |
where it is assumed that to are uniformly distributed and each variable lies between and . Figure 4 illustrates the pdf of the user-defined function.

The Sobol indices are listed in Table LABEL:table:User_defined_Sobol_indices_analytical_and_PC where it is evident that for a PCE order of , we obtain the exact analytical solution. Since the highest order of the user-defined function is , a PCE of order can exactly reproduce the original function. Note that all higher order Sobol indices are except .
| Index | Analytical | PCE order | |||
|---|---|---|---|---|---|
| 0.4169 | 0 | 0.4215 | 0.4215 | 0.4169 | |
| 0.4619 | 0 | 0.4670 | 0.4670 | 0.4169 | |
| 0 | 0 | 0 | 0 | 0 | |
| 0.0530 | 1 | 0.0536 | 0.0536 | 0.0530 | |
| 0 | 0 | 0 | 0 | 0 | |
| 0.0682 | 0 | 0.0579 | 0 | 0.0682 | |
| 0 | 0 | 0 | 0 | 0 | |
| 0 | 0 | 0 | 0 | 0 | |
| 0 | 0 | 0 | 0 | 0 | |
| 0 | 0 | 0 | 0 | 0 | |
| 0 | 0 | 0 | 0 | 0 | |
| 0 | 0 | 0 | 0 | 0 | |
| 0 | 0 | 0 | 0 | 0 | |
| 0 | 0 | 0 | 0 | 0 | |
| 0 | 0 | 0 | 0 | 0 | |
| 0.4851 | 0 | 0.4794 | 0.4794 | 0.4851 | |
| 0.4619 | 0 | 0.4670 | 0.4670 | 0.4619 | |
| 0.0682 | 0 | 0.0579 | 0.0579 | 0.0682 | |
| 0.0530 | 1 | 0.0536 | 0.0536 | 0.0530 | |
Table LABEL:table:User_defined_Shapley_values_analytical_and_PC illustrates the convergence of the coalition worths and Shapley effects when higher order PCE are used. Again, for a PCE order of , we can observe that the PCE approximation is identical to the analytical results.
| Worth | Analytical | PCE order | |||
|---|---|---|---|---|---|
| 0.4169 | 0 | 0.4215 | 0.4215 | 0.4169 | |
| 0.4619 | 0 | 0.4670 | 0.4670 | 0.4619 | |
| 0 | 0 | 0 | 0 | 0 | |
| 0.0530 | 1 | 0.0536 | 0.0536 | 0.0530 | |
| 0.8788 | 0 | 0.8884 | 0.8884 | 0.8788 | |
| 0.4851 | 0 | 0.4794 | 0.4794 | 0.4851 | |
| 0.4699 | 1 | 0.4751 | 0.4751 | 0.4699 | |
| 0.4619 | 0 | 0.4670 | 0.4670 | 0.4619 | |
| 0.5149 | 1 | 0.5206 | 0.5206 | 0.5149 | |
| 0.0530 | 1 | 0.0536 | 0.0536 | 0.0530 | |
| 0.9470 | 0 | 0.9464 | 0.9464 | 0.9470 | |
| 0.9318 | 1 | 0.9421 | 0.9421 | 0.9318 | |
| 0.5381 | 1 | 0.5330 | 0.5330 | 0.5381 | |
| 0.5149 | 1 | 0.5206 | 0.5206 | 0.5149 | |
| 1 | 1 | 1 | 1 | 1 | |
| 0.4510 | 0 | 0.4504 | 0.4504 | 0.4510 | |
| 0.4619 | 0 | 0.4670 | 0.4670 | 0.4619 | |
| 0.0341 | 0 | 0.0290 | 0.0290 | 0.0341 | |
| 0.0530 | 1 | 0.0536 | 0.0536 | 0.0530 | |
Evaluating the ranking from a Sobol perspective suggests to order the uncertain variables as , , and , while Shapley suggests , , and . Table LABEL:table:User_defined_Sobol_indices_and_Shapley_values_comparision provides the Borgonovo indices, where the ranking is identical to the ranking based on the Shapley effects.
| Variable | Total Sobol | Shapley | Borgonovo |
|---|---|---|---|
| 0.4851 | 0.4510 | 0.2734 | |
| 0.4619 | 0.4619 | 0.3309 | |
| 0.0682 | 0.0341 | 0.0178 | |
| 0.0530 | 0.0530 | 0.0800 |
4 Dynamic Systems
Global sensitivity analysis of dynamic models is necessary for control and forecasting problems. Therefore, for illustrative purposes, this section will present two models including a SEIR disease model [15] and the Bergman model, which is used to model Type 1 diabetes.
4.1 SEIR model
The nonlinear SEIR model is presented by the equations:
| (49a) | ||||
| (49b) | ||||
| (49c) | ||||
| (49d) | ||||
where , and are assumed to be uncertain. , , and , stand for the susceptible, exposed, infected and recovered group respectively. Variable is the total population and is set to for simplicity. The uncertain parameters can be interpreted as follows:
-
1.
, where is the time constant of the infectious state
-
2.
, where is the time constant of the exposed state
-
3.
, where is the reproduction number
We assume that they are uniformly distributed as follows [14]:
| (50a) | |||
| (50b) | |||
| (50c) | |||
which can be further rewritten as:
| (51a) | |||
| (51b) | |||
| (51c) | |||
where the subscript is the mean and is used to map the uniform distribution with arbitrary bounds to the interval . PCE of the random SEIR variables are:
| (52a) | ||||
| (52b) | ||||
| (52c) | ||||
| (52d) | ||||
The polynomial consists of all tensor product of Legendre polynomial of , and . The ordinary differential equations can now be expressed as:
| (53a) | |||
| (53b) | |||
| (53c) | |||
| (53d) | |||
To approximate the original system shown in Eqns. (49a)-(49d), the Galerkin projection onto the subspace of the orthogonal basis functions formed by the tensor product of the Weiner-Askey basis functions in each random dimension leads to the equations:
| (54a) | |||
| (54b) | |||
| (54c) | |||
| (54d) | |||
, and are calculated as:
| (55) | |||
| (56) | |||
| (57) |
and , and are the pdfs of , and respectively. Note that is simply a coefficients which is the result of the Galerkin projection of the left-hand side of Eqns. (53a)-(53d) onto the orthogonal basis functions.
4.1.1 Mean and variance
For demonstrative purposes, consider a group of infected people. The mean (expected value) can be calculated as follows:
| (58) |
and the variance as:
| (59) |
Furthermore we can simply calculate the conditional variance as shown in Eqn. (7) and (8) which permit the calculation of the Sobol indices and Shapley effects.
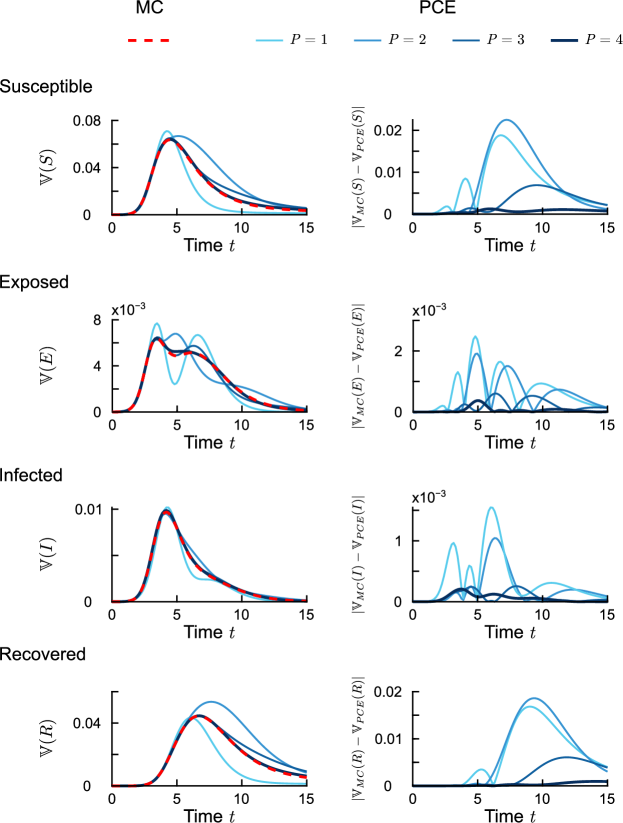
We start by gauging the approximation accuracy in evaluating the GSA metrics using PCE as compared to MC estimates. To compute the sensitivities with a variance-based approach, we only need the expected values and the variances, which is why we compare the MC to the PCE in terms of expected value and total variance. For the MC simulation, samples were chosen and considered sufficient to capture the uncertainties of the system and represent the states behavior. The PCE was computed until a degree of . For the initial conditions it is assumed that , , and . All other polynomial chaos states are . Then we arbitrarily selected a simulation time of days. Figure 5 illustrates the time variation of the expected value. The red dashed line corresponds to results computed with the MC method for the susceptible, exposed, infected and recovered group. The blue lines illustrate the results from the PCE where the increase in order of the PCE expansion corresponds to the increased depth of the blue color of the solid lines. From the left side of Figure 5, it is evident that the PCE approximations are converging to the results of the MC simulation. On the right side of Figure 5 the absolute error over time between the MC and PCE is shown. The absolute error overall is fairly small; however, on average, a higher PCE degree yields a smaller error over time.

Figure 6 illustrates via a red dashed line, the time-variation of the total variance generated by the MC simulations of the susceptible, exposed, infected and recovered group. The blue solid lines represent the simulation results of the PCE, with the higher PCE degrees being denoted by the increasingly darker blue colors. Compared to the expected value, the total variance shows a higher dependence on the degree of the PCE. The left side of Figure 6 clearly illustrates that a low PC degree yields a poor approximation of the MC results; however, a degree of closely matches the MC results. The right side of Figure 6 illustrates the absolute error between the MC and the PCE for all degrees and states.
In disease forecasting, it is important to know when the infected group will peak, and at what magnitude. Given the PC-coefficients and basis functions , we can easily calculate the statistics of , by sampling the variables , and which are uniformly distributed over . The PC-coefficients must be calculated once and, by sampling the random variables, different trajectories of over time can be synthesized. From these simulations, the largest magnitude of and the peak time can be calculated and plotted in a 2D histogram. Figure 7 illustrates a 2D heat-chart of the peak time and the magnitude of the infected group. It should be noted that the PCE is a lot faster in calculating such heat maps than a sample based approach such as classic MC methods. In Figure 7 the peak time is most likely around time unit , with a magnitude of approximately , which matches the observation from the expected value in Figure 5.

The remaining question is: Do Shapley effects differ from Sobol indices for dynamical system as they did for the static equations which are presented in subsection 3.1 and 3.2? Table LABEL:table:Ishigami_Sobol_vs_Shapley_analytical_weights indicates that Shapley is assigning less weight on higher order Sobol indices than when calculating the total Sobol indices. Figure 8 illustrates the importance via Sobol and Shapley of the three uncertain variables , and over time on the infected group. The solid lines represent the Shapley effects while the dashed lines are the total Sobol indices. In subfigure a) initially the variable has a high importance for the infected group. With the given initial conditions and looking at the Eqns. (49a)-(49d), it can be noted the initial high importance of is justified because the infected group reduces its value by to the recovered group. At the initial time the variables and have no impact on the infected group and are therefore ranked very low because the exposed group is initialized with . As time goes on the importance of drops and the importance of and rises, while is higher valued than . This occurs because provides the growth of the exposed group which then goes over to the infected group. Looking back at Figure 5, the expected value peaks at time instant , and from Eqn. (49c), it is obvious that if becomes large, the variable has a large impact. This is captured in Figure 8 a) as well. When the infected group is reduced, the importance of shrinks and and become again more important because they provide the growth of .
Figure 8 illustrates the time-variation of a) the total Sobol indices and Shapley effects are plotted on the same scale, where we note that Shapley effects sum up to for all times while this is not true for the total Sobol indices. However, Figure 8 a) also illustrates the relative importance of all the uncertain variables for both approaches. To answer the question of why the total Sobol indices and Shapley effects differ, we need to look at the higher order Sobol indices, which are shown in Figure 8 b) and c). Their different weighting results in divergence of the Shapley effects from the total Sobol indices. It can be seen that especially when these higher Sobol indices peak that the total Sobol indices don’t coincide with the Shapley effects (for instance around time ) and when they are nearly (around time ) that the Shapley effects and total Sobol indices are almost the same. However, it is rather difficult to conclude a “ranking” order from Figure 8 a).

Therefore, we introduce Figure 9 where the colors blue, red, and green represent the uncertain variables , and respectively. The ranking of each uncertain variables are provided between the initial and final time in an intuitive ranking scheme of st, nd and rd. A significant ranking difference of the uncertain variables can be seen between the times to , which is just before the expected value of the infected group peaks. This information might be very helpful for entities that are trying to take certain measures to slow down the growth of infections in a pandemic. The total Sobol indices rank variable at nd place until almost time instant while Shapley suggests that the rank switch between and is happening earlier (around time ). After the expected value of the infected group peaks, the total Sobol indices and the Shapley effects are similar.

Owen [36] pointed out that the Shapley effect is “sandwiched” in between the first-order Sobol index and the total order Sobol index. This can be seen in Figure 10 for the uncertain variables , and , where the dashed, solid and dotted lines represent the total Sobol indices, Shapley effects, and the first-order Sobol indices respectively. The sandwiching size is particularly large for and around time instant , when the higher order Sobol indices peak as indicated in Figure 8 b) and c). In contrast, the width of the sandwich is negligible around time instant , which is when the higher order Sobol indices are nearly .

4.2 Type 1 diabetes Bergman model
A popular model to study type 1 Diabetes (T1D) is the minimal Bergman model [21]:
| (60a) | ||||
| (60b) | ||||
| (60c) | ||||
where is the blood glucose level, is the intermediate state and is the insulin concentration. The variable is the meal disturbance term and is assumed to be the Fisher model [54]:
| (61) |
where stands for the meal quantity and is assumed to be , calculated from a meal of gm Carbohydrates (CHO) and the meal time is given as min [21]. This simulation considers an insulin bolus at . For the simulation the insulin bolus is represented by the time-varying term in Eqn. (60c). The input is given by:
| (62) |
where is the insulin-to-carb ratio and is the distribution volume-to-insulin. For a gm meal, and , and therefore mU/L. The uncertainties lie in the parameters , , and the initial glucose level . We assume that they are uniformly distributed as follows [21]:
| (63a) | ||||
| (63b) | ||||
| (63c) | ||||
| (63d) | ||||
When applying the PCE it should be noted that initial blood glucose is calculated by the Galerkin projections. Note that the initial blood glucose levels are divided by the coefficient which results from the Galerkin projection on the state equations. For the MC to PCE comparison, samples for the MC are chosen. The system is further initialized with and , while the rest of the expanded states of and are initialized to . Figure 11 illustrates the expected value and total variance of the blood glucose level. A higher PCE degree leads to a smaller error between the MC and PCE approach. On the right side of Figure 11, it appears that even with a higher degree of the PCE, a small error remains.

Figure 12 a) shows the total Sobol indices and Shapley effects over time of , , , and with respect to the blood glucose level. As expected, the initial blood glucose level is the most important, meanwhile, as time progresses, the importance of peaks at approximately minutes, and then falls continuously. This is due to the insulin input in Eqn. (60c) which makes the insulin level rise, and therefore the uncertain parameters in Eqn. (60b) becomes more important. It can be observed that the importance of variable increases over time while the importance of variable is nominally the least important factor over all time. However, Figure 12 a) also shows that, in the end, the Shapley effects and total Sobol indices diverge due to the higher Sobol indices as shown in Figure 12 b), c), and d) which are relatively small except towards the end of the simulation time. The insets in Figure 12 a) illustrate the divergence; however, this does not change the rank order of the system.
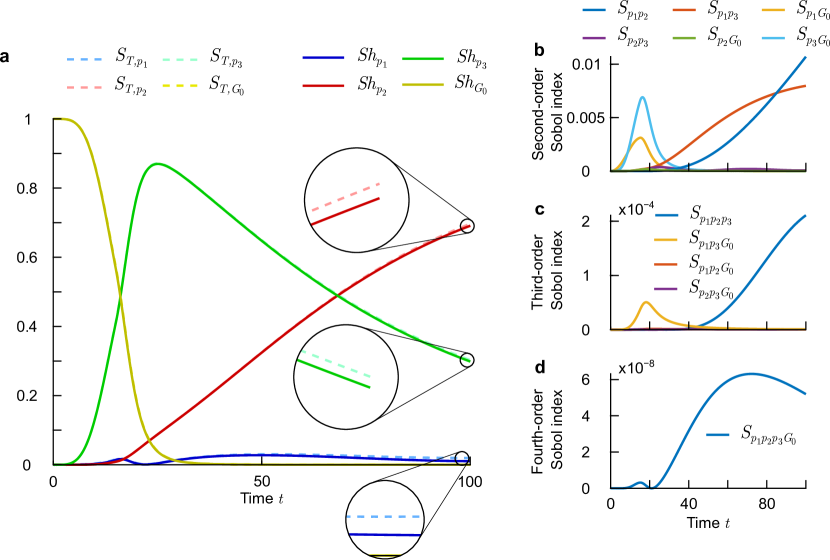
Figure 13 illustrates the time-varying rank order of the uncertain variables with respect to the blood glucose level. The Shapley effects provides exactly the same answer as the total Sobol indices. This is due to the small values of the higher order Sobol indices which means they have a small impact on the calculation of the total Sobol indices and Shapley effects. Hence, both methods provide similar rankings. If we compare the higher order Sobol indices from the SEIR model as shown in Figure 8 with ones in Figure 12 we can see that the magnitude of the second-order Sobol indices in the SEIR model are one order higher than in the Bergman Type 1 Diabetes model. The third-order Sobol indices are even two orders higher.

Figure 14 presents the sandwiching effect of the First and Total Sobol indices on the uncertain variables , , and . As shown in Figure 12, the total Sobol indices do not differ too much from the Shapley effects except for during the end of the simulation time. Therefore, a wide sandwiching effect can be mostly observed over the latter part of the simulation for .

5 Conclusion
This paper proposes to use the Shapley value concept as a variance based global sensitivity metric and compares it to the well established variance based Sobol indices. The Shapley effects are evaluated for the Ishigami benchmark problem in addition to a polynomial model. It is noteworthy that the Shapley effects provide a ranking which is in conflict with the Total Sobol indices for the Ishigami function - a fact which has been illustrated using the Borgonovo delta function and other statistical distances. To address the issue of the computational burden in determining the Shapley effects, a polynomial chaos expansion has been proposed to be used to efficiently evaluate the total and conditional variances which are required to determine both the Sobol indices and Shapley effects. In effect, once a polynomial chaos model has been determined, the Sobol indices and the Shapley effects can be algebraically evaluated. The polynomial chaos approach has been used to illustrate the determination of Shapley effects of uncertain variables for an SEIR model and the Bergman Type 1 diabetes model.
The comparison between the total Sobol indices, Shapley effects and the Borgonovo metric illustrated the potential of ranking uncertain variables using Shapley effects. Apart from diabetes research, we aim to work on controller design techniques where the Shapley value concept could be used to desensitize controllers to uncertainties. In doing so, a mapping from polynomial chaos coefficients to Shapley effects will enable a low computational cost approach for robust controller design.
Acknowledgment
The authors acknowledge the support of this work by the US National Science Foundation through CMMI Award number 2021710.
References
- [1] S. Razavi, A. Jakeman, A. Saltelli, C. Prieur, B. Iooss, E. Borgonovo, E. Plischke, S. Lo Piano, T. Iwanaga, W. Becker, S. Tarantola, J. H. Guillaume, J. Jakeman, H. Gupta, N. Melillo, G. Rabitti, V. Chabridon, Q. Duan, X. Sun, S. Smith, R. Sheikholeslami, N. Hosseini, M. Asadzadeh, A. Puy, S. Kucherenko, H. R. Maier, The future of sensitivity analysis: An essential discipline for systems modeling and policy support, Environmental Modelling & Software 137 (2021) 104954. doi:10.1016/j.envsoft.2020.104954.
- [2] M. D. Morris, Factorial sampling plans for preliminary computational experiments, Technometrics 33 (2) (1991) 161. doi:10.2307/1269043.
-
[3]
I. M. Sobol, Sensitivity
analysis for non-linear mathematical models, Mathematical Modelling and
Computational Experiment 1 (1993) 407–414.
URL https://cir.nii.ac.jp/crid/1570009751284338304 - [4] I. M. Sobol’, A. Gresham, On an alternative global sensitivity estimators, in: 1995 Proceedings of SAMO, 1995, pp. 40–42.
- [5] S. Kucherenko, M. Rodriguez-Fernandez, C. Pantelides, N. Shah, Monte carlo evaluation of derivative-based global sensitivity measures, Reliability Engineering & System Safety 94 (7) (2009) 1135–1148. doi:10.1016/j.ress.2008.05.006.
- [6] I. M. Sobol’, S. Kucherenko, Derivative based global sensitivity measures and their link with global sensitivity indices, Mathematics and Computers in Simulation 79 (10) (2009) 3009–3017. doi:10.1016/j.matcom.2009.01.023.
-
[7]
B. Iooss, P. Lemaître, A review on
global sensitivity analysis methods (2014).
URL http://arxiv.org/pdf/1404.2405v1 - [8] S. Nandi, T. Singh, P. Singla, Derivative based global sensitivity analysis using conjugate unscented transforms, in: 2019 American Control Conference (ACC), IEEE, 2019, pp. 2458–2463. doi:10.23919/ACC.2019.8815110.
- [9] T. A. Mara, W. E. Becker, Polynomial chaos expansion for sensitivity analysis of model output with dependent inputs, Reliability Engineering & System Safety 214 (6) (2021) 107795. doi:10.1016/j.ress.2021.107795.
- [10] K.-K. K. Kim, D. E. Shen, Z. K. Nagy, R. D. Braatz, Wiener’s polynomial chaos for the analysis and control of nonlinear dynamical systems with probabilistic uncertainties [historical perspectives], IEEE Control Systems 33 (5) (2013) 58–67. doi:10.1109/MCS.2013.2270410.
- [11] D. Xiu, G. E. Karniadakis, The wiener–askey polynomial chaos for stochastic differential equations, SIAM Journal on Scientific Computing 24 (2) (2002) 619–644. doi:10.1137/S1064827501387826.
- [12] B. Sudret, Global sensitivity analysis using polynomial chaos expansions, Reliability Engineering & System Safety 93 (7) (2008) 964–979. doi:10.1016/j.ress.2007.04.002.
- [13] B. Sudret, C. V. Mai, Computing derivative-based global sensitivity measures using polynomial chaos expansions, Reliability Engineering & System Safety 134 (3) (2015) 241–250. doi:10.1016/j.ress.2014.07.009.
- [14] D. B. Harman, P. R. Johnston, Applying the stochastic galerkin method to epidemic models with uncertainty in the parameters, Mathematical biosciences 277 (2016) 25–37. doi:10.1016/j.mbs.2016.03.012.
- [15] B. C. Jensen, A. P. Engsig-Karup, K. Knudsen, E. Augeraud, M. Banerjee, J.-S. Dhersin, A. d’Onofrio, T. Lipniacki, S. Petrovskii, C. Tran, A. Veber-Delattre, E. Vergu, V. Volpert, Efficient uncertainty quantification and variance-based sensitivity analysis in epidemic modelling using polynomial chaos, Mathematical Modelling of Natural Phenomena 17 (2022) 8. doi:10.1051/mmnp/2022014.
- [16] G. Blatman, B. Sudret, Efficient computation of global sensitivity indices using sparse polynomial chaos expansions, Reliability Engineering & System Safety 95 (11) (2010) 1216–1229. doi:10.1016/j.ress.2010.06.015.
- [17] N. Lin, X. Xie, R. Schenkendorf, U. Krewer, Efficient global sensitivity analysis of 3d multiphysics model for li-ion batteries, Journal of The Electrochemical Society 165 (7) (2018) A1169–A1183. doi:10.1149/2.1301805jes.
- [18] T. Singh, P. Singla, U. Konda, Polynomial chaos based design of robust input shapers, Journal of Dynamic Systems, Measurement, and Control 132 (5) (2010) 76. doi:10.1115/1.4001793.
- [19] M. Braband, M. Scherer, H. Voos, Global sensitivity analysis of economic model predictive longitudinal motion control of a battery electric vehicle, Electronics 11 (10) (2022) 1574. doi:10.3390/electronics11101574.
-
[20]
R. Ballester-Ripoll, M. Leonelli,
Global sensitivity analysis in
probabilistic graphical models (2021).
URL http://arxiv.org/pdf/2110.03749v1 - [21] S. Nandi, T. Singh, Global sensitivity analysis on the bergman minimal model, IFAC-PapersOnLine 53 (2) (2020) 16112–16118. doi:10.1016/j.ifacol.2020.12.431.
- [22] G. Fan, X. Li, R. Zhang, Global sensitivity analysis on temperature-dependent parameters of a reduced-order electrochemical model and robust state-of-charge estimation at different temperatures, Energy 223 (5) (2021) 120024. doi:10.1016/j.energy.2021.120024.
- [23] A. S. Yeardley, P. J. Bugryniec, R. A. Milton, S. F. Brown, A study of the thermal runaway of lithium-ion batteries: A gaussian process based global sensitivity analysis, Journal of Power Sources 456 (2020) 228001. doi:10.1016/j.jpowsour.2020.228001.
- [24] X. Lai, Z. Meng, S. Wang, X. Han, L. Zhou, T. Sun, X. Li, X. Wang, Y. Ma, Y. Zheng, Global parametric sensitivity analysis of equivalent circuit model based on sobol’ method for lithium-ion batteries in electric vehicles, Journal of Cleaner Production 294 (3) (2021) 126246. doi:10.1016/j.jclepro.2021.126246.
- [25] H. Wu, W. Niu, S. Wang, S. Yan, Sensitivity analysis of control parameters errors and current parameters to motion accuracy of underwater glider using sobol’ method, Applied Ocean Research 110 (1) (2021) 102625. doi:10.1016/j.apor.2021.102625.
- [26] S. Yousefian, G. Bourque, R. F. D. Monaghan, Uncertainty quantification of nox emission due to operating conditions and chemical kinetic parameters in a premixed burner, Journal of Engineering for Gas Turbines and Power 140 (12) (2018) 2721. doi:10.1115/1.4040897.
- [27] E. Borgonovo, A new uncertainty importance measure, Reliability Engineering & System Safety 92 (6) (2007) 771–784. doi:10.1016/j.ress.2006.04.015.
- [28] S. Nandi, T. Singh, Global sensitivity analysis measures based on statistical distances, International Journal for Uncertainty Quantification 11 (6) (2021) 1–30. doi:10.1615/Int.J.UncertaintyQuantification.2021035424.
- [29] M.-H. Chun, S.-J. Han, N.-I. Tak, An uncertainty importance measure using a distance metric for the change in a cumulative distribution function, Reliability Engineering & System Safety 70 (3) (2000) 313–321. doi:10.1016/S0951-8320(00)00068-5.
- [30] L. S. Shapley, 17. a value for n-person games, in: H. W. Kuhn, A. W. Tucker (Eds.), Contributions to the Theory of Games (AM-28), Volume II, Princeton University Press, 1953, pp. 307–318. doi:10.1515/9781400881970-018.
- [31] E. Algaba, V. Fragnelli, J. Sánchez-Soriano, Handbook of the shapley value, 1st Edition, Chapman & Hall/CRC series in operations research, Chapman & Hall/CRC, Boca Raton, 2019. doi:10.1201/9781351241410.
- [32] E. Plischke, G. Rabitti, E. Borgonovo, Computing shapley effects for sensitivity analysis, SIAM/ASA Journal on Uncertainty Quantification 9 (4) (2021) 1411–1437. doi:10.1137/19M1304738.
- [33] M. I. Radaideh, S. Surani, D. O’Grady, T. Kozlowski, Shapley effect application for variance-based sensitivity analysis of the few-group cross-sections, Annals of Nuclear Energy 129 (8) (2019) 264–279. doi:10.1016/j.anucene.2019.02.002.
- [34] E. Song, B. L. Nelson, J. Staum, Shapley effects for global sensitivity analysis: Theory and computation, SIAM/ASA Journal on Uncertainty Quantification 4 (1) (2016) 1060–1083. doi:10.1137/15M1048070.
-
[35]
B. Iooss, C. Prieur, Shapley effects
for sensitivity analysis with correlated inputs: Comparisons with sobol’
indices, numerical estimation and applications (2019).
URL http://arxiv.org/pdf/1707.01334v7 - [36] A. B. Owen, Sobol’ indices and shapley value, SIAM/ASA Journal on Uncertainty Quantification 2 (1) (2014) 245–251. doi:10.1137/130936233.
-
[37]
B. Rozemberczki, L. Watson, P. Bayer, H.-T. Yang, O. Kiss, S. Nilsson,
R. Sarkar, The shapley value in
machine learning (2022).
URL http://arxiv.org/pdf/2202.05594v2 - [38] S. C. Littlechild, G. F. Thompson, Aircraft landing fees: A game theory approach, The Bell Journal of Economics 8 (1) (1977) 186. doi:10.2307/3003493.
- [39] L. Pheulpin, N. Bertrand, V. Bacchi, Uncertainty quantification and global sensitivity analysis with dependent inputs parameters: Application to a basic 2d-hydraulic model, LHB 108 (1) (2022) 221. doi:10.1080/27678490.2021.2015265.
- [40] W. Xie, B. Wang, C. Li, D. Xie, J. Auclair, Interpretable biomanufacturing process risk and sensitivity analyses for quality–by–design and stability control, Naval Research Logistics (NRL) 69 (3) (2022) 461–483. doi:10.1002/nav.22019.
- [41] H. Wang, Z. Yan, X. Xu, K. He, Evaluating influence of variable renewable energy generation on islanded microgrid power flow, IEEE Access 6 (2018) 71339–71349. doi:10.1109/ACCESS.2018.2881189.
- [42] Y. Chen, L. Juan, X. Lv, L. Shi, Bioinformatics research on drug sensitivity prediction, Frontiers in pharmacology 12 (2021) 799712. doi:10.3389/fphar.2021.799712.
- [43] Y. Li, N. Friedman, P. Teatini, A. Benczur, S. Ye, L. Zhu, C. Zoccarato, Sensitivity analysis of factors controlling earth fissures due to excessive groundwater pumping, Stochastic Environmental Research and Risk Assessment 36 (1) (2022) 201. doi:10.1007/s00477-022-02237-8.
- [44] L. Schröder, N. K. Dimitrov, J. Aasted Sørensen, Uncertainty propagation and sensitivity analysis of an artificial neural network used as wind turbine load surrogate model, Journal of Physics: Conference Series 1618 (4) (2020) 042040. doi:10.1088/1742-6596/1618/4/042040.
- [45] J. A. Carta, S. Díaz, A. Castañeda, A global sensitivity analysis method applied to wind farm power output estimation models, Applied Energy 280 (2020) 115968. doi:10.1016/j.apenergy.2020.115968.
- [46] B. Broto, F. Bachoc, M. Depecker, J.-M. Martinez, Sensitivity indices for independent groups of variables, Mathematics and Computers in Simulation 163 (6) (2019) 19–31. doi:10.1016/j.matcom.2019.02.008.
-
[47]
A. B. Owen, C. Prieur, On shapley
value for measuring importance of dependent inputs (2017).
URL http://arxiv.org/pdf/1610.02080v3 - [48] M. Il Idrissi, V. Chabridon, B. Iooss, Developments and applications of shapley effects to reliability-oriented sensitivity analysis with correlated inputs, Environmental Modelling & Software 143 (2021) 105115. doi:10.1016/j.envsoft.2021.105115.
- [49] T. Goda, A simple algorithm for global sensitivity analysis with shapley effects, Reliability Engineering & System Safety 213 (2021) 107702. doi:10.1016/j.ress.2021.107702.
- [50] M. B. Heredia, C. Prieur, N. Eckert, Global sensitivity analysis with aggregated shapley effects, application to avalanche hazard assessment, Reliability Engineering & System Safety 222 (4) (2022) 108420. doi:10.1016/j.ress.2022.108420.
- [51] E. Gayrard, C. Chauvière, H. Djellout, P. Bonnet, D.-P. Zappa, Global sensitivity analysis for stochastic processes with independent increments, Probabilistic Engineering Mechanics 62 (1) (2020) 103098. doi:10.1016/j.probengmech.2020.103098.
- [52] N. Benoumechiara, K. Elie-Dit-Cosaque, B. Bouchard, J.-F. Chassagneux, F. Delarue, E. Gobet, J. Lelong, Shapley effects for sensitivity analysis with dependent inputs: Bootstrap and kriging-based algorithms, ESAIM: Proceedings and Surveys 65 (2019) 266–293. doi:10.1051/proc/201965266.
- [53] S. S. Kucherenko, et al., Global sensitivity indices for nonlinear mathematical models, review, Wilmott Mag 1 (2005) 56–61.
- [54] M. E. Fisher, A semiclosed-loop algorithm for the control of blood glucose levels in diabetics, IEEE transactions on bio-medical engineering 38 (1) (1991) 57–61. doi:10.1109/10.68209.