Searching for nuclear obscuration in the infrared spectra of nearby FR-I radio galaxies
Abstract
How do active galactic nuclei with low optical luminosities produce powerful radio emission? Recent studies of active galactic nuclei with moderate radio and low optical luminosities (Fanaroff & Riley 1974 class I, FR-I) searching for broad nuclear emission lines in polarized light, as predicted by some active galactic nucleus unification models, have found heterogeneous results. These models typically consist of a central engine surrounded by a torus of discrete dusty clouds. These clouds would absorb and scatter optical emission, blocking broad nuclear emission lines, and re-radiate in mid-infrared. Some scattered broad line emission may be observable, depending on geometry, which would be polarized. We present a wide-band infrared spectroscopic analysis of ten nearby FR-I radio galaxies to determine whether there is significant emission from a dusty obscuring structure. We used Markov-chain Monte Carlo algorithms to decompose Spitzer/IRS spectra of our sample. We constrained the wide-band behavior of our models with photometry from 2MASS, Spitzer/IRAC, Spitzer/MIPS, and Herschel/SPIRE. We find one galaxy is best fit by a clumpy torus and three others show some thermal mid-infrared component. This suggests that in those three there is likely some obscuring dust structure that is inconsistent with our torus models and there must be some source of photons heating the dust. We conclude that 40% of our FR-I radio galaxies show evidence of obscuring dusty material, possibly some other form of hidden broad-line nucleus, but only 10% favor the clumpy torus model specifically.
1 Introduction
1.1 AGN unification
Active galactic nuclei (AGN) show an array of different spectra which are usually grouped into broad categories based on their radio luminosities, bolometric luminosities, and the presence or absence of broad optical emission lines. AGN unification models attempt to explain many of these different classes with a single type of object which differs in only a few parameters. Its particular focus is to explain the presence or absence of optical broad lines in objects which are otherwise similar (e.g., similar radio and X-ray profiles). These models consist of a central engine and some anisotropic distribution of gas and dust which scatters or absorbs light from the central engine. The central engine is matter accreting onto a supermassive black hole. Our description of this model follows the one by Antonucci (1993). For further reading see Antonucci (2012); Tadhunter (2016); Padovani et al. (2017).
In these models, material accreting onto the central supermassive black hole forms an optically thick but geometrically thin accretion disk which is obscured from some lines of sight by an optically thick, warm () mass of dusty material with a roughly toroidal geometry. This torus would absorb optical emission from the central engine and re-radiate that energy in infrared. Pier & Krolik (1992, 1993) modelled the torus as a smooth continuous cloud of variable density due to computing constraints but they believed it to be composed of discrete clouds (“clumpy”). The alternative to a torus is that the central engine is intrinsically dim in the optical rather than obscured, resulting in a lower mid-infrared luminosity where warm obscuring dust would radiate. Smooth torus models require fine-tuning in order to match the suppressed low-equivalent-width silicate features observed in infrared spectra (Granato & Danese, 1994; Granato et al., 1997).
Rowan-Robinson (1995) claimed that clumpy torus models can adequately explain silicate feature suppression observed in Seyfert 1 galaxies but, just like Pier & Krolik (1992), lacked a fully 3D radiative transfer code to fully explore it. Nenkova et al. (2002, 2008a, 2008b) formalized the clumpy torus model we consider in our decompositions in Section 5. This model describes an obscuring torus as being composed of small, discrete, optically thick clouds. The inner radius of the torus is determined by the sublimation radius for the component dust grains i.e., the minimum distance from the central engine at which a grain can survive. This sharp boundary is an approximation since larger dust grains can survive significantly closer to the central engine than the inner edge of the main torus (Pier & Krolik, 1993; Schartmann et al., 2005). The remaining parameters that Nenkova et al. (2008a, b) include in their torus model are the optical depth of a single torus clump at 550 nm, (assumed to be the same for all clumps), the mean number of clouds along a radial equatorial line, , the radial extent of the torus in units of the dust sublimation, , the inclination of the torus with respect to the line of sight, (defined such that is pole-on), the angular scale height of the torus (effectively the standard deviation of the normally-distributed clumps around the equator), , and the power law index of the radial distribution of clumps, . From these parameters they show how to calculate the half-opening angle of the torus, the torus height-to-radius ratio , and the photon escape probability.
There are alternatives to the unification model in which the central engines of low-luminosity sources intrinsically differ from those of high-luminosity sources. These are largely beyond the scope of this paper but they often involve an advection dominated accretion flow (ADAF), in which a supermassive black hole is accreting at below 1% of the Eddington rate and the infalling material does not radiate much of its energy away. See e.g., Narayan et al. (1998); Best & Heckman (2012).
1.2 Existing evidence in FR-I radio galaxies
Fanaroff & Riley class I (FR-I, Fanaroff & Riley 1974) radio galaxies are low-luminosity radio galaxies with sub-relativistic jets that are brightest near their cores. FR-I radio galaxies typically do not show significant broad optical line emission though there are exceptions such as 3C 120 (French & Miller, 1980; Leipski et al., 2009; Torrealba et al., 2012). The question of how FR-I radio galaxies fit into AGN models can be reduced to two separate but related parts. These are the nature of the accretion structure that powers the radio jet and the structure of any obscuring material. These are related because if FR-Is are powered by an accretion structure with a high intrinsic optical luminosity such as a Keplerian thin accretion disk then the central engine must be obscured in order to match observations.
Haas et al. (2004) analyzed 5 to 200 m photometry from the photometer on the Infrared Space Observatory, ISOPHOT, of 75 objects in the Revised Third Cambridge Catalog of radio galaxies and quasars (Laing et al., 1983), including 5 FR-I sources (of which three overlap with our sample). They clearly detect a thermal component in the FR-Is despite the lower sensitivity compared to Spitzer (Kessler et al., 1996) but it was too cold to be consistent with the unification models we are considering. Chiaberge et al. (1999) detected the central core component in 85% of Hubble Space Telescope observations of FR-I radio galaxies and so put an upper limit on the covering fraction of any obscuring torus with the caveat that the base of an optical jet may appear as an alternate source of optical continuum emission. Whysong & Antonucci (2004) found that the MIR core component of M 87 is dominated by synchrotron emission from the base of its relativistic jet and Perlman et al. (2007) put further limits on a a warm obscuring torus in M 87. These findings effectively rule out the possibility of a significant amount of obscuring warm dust. van der Wolk et al. (2010a) found no evidence for warm dust tori in any of the eight FR-I sources in their observations from the Very Large Telescope’s (VLT) Imager and Spectrometer for the Mid Infrared. Note that one of the FR-I sources in the van der Wolk et al. (2010a) sample is 3C 270, which is also in our sample. In Hubble Space Telescope (HST) images of the optical nuclei of a sample of 54 FR-I and 55 FR-II radio galaxies at , Kharb & Shastri (2004) found that the optical emission in these sources is primarily non-thermal emission from a relativistic jet. Their fits also showed no significant improvement from including a thermal accretion disk in the FR-II population as a whole but found some improvement from including a disk component in broad-line emitting FR-II. They claim that this is supported by the presence of a “big blue bump” which they attribute to an accretion disk. Kharb & Shastri (2004) additionally found that the luminosity of the optical nuclei in FR-I radio galaxies show strong dependence on the radio core prominence , which is a common statistical indicator of orientation, and from this they conclude that their results are consistent with the lack of a torus in FR-I radio galaxies. In a study conceptually similar to ours, González-Martín et al. (2015) searched for AGN obscuration in Spitzer/IRS (see Section 3) spectra and Chandra photometry of a sample of low-ionization nuclear emission region (LINER) AGN. The dusty torus present in brighter sources disappeared below bolometric luminosities , consistent with Elitzur & Shlosman (2006), and that the MIR spectra of such sources is dominated by host, jet, and/or ADAF emission.
Leipski et al. (2009) found a Spitzer/IRS band thermal excess attributed to warm nuclear dust emission in four of the fifteen galaxies with detected optical compact cores in their sample of 25 FR-I radio galaxies. Six of our ten sources — 3C 31, 3C 66B, NGC 3862, 3C 270, M 84, and M 87 — overlap with their sample. Of those, they only found thermal MIR excess in the nuclei of 3C 270 and M 84, which they tentatively attribute to an obscuring torus and starburst activity respectively. However, Wu & Cao (2006) give a star formation rate estimate of for M 84 which is inconsistent with a starburst. They also found a MIR excess in 3C 66B, which they attribute to non-thermal emission. Leipski et al. (2009) also found a very low ratio between the and PAH lines, which is not typical for starburst galaxies.
In contrast, Bianchi et al. (2019) found red and blue wings on line emission in NGC 3147 consistent with the profile of a mildly relativistic thin Keplerian accretion disk. NGC 3147 is an unobscured AGN with an accretion rate far below the Eddington rate () which lacks a broad line region. The detection of an accretion disk in such an object suggests the possibility that extremely low accretion rates can still support thin accretion disks.
Overall, recent studies favor the two-mode models in which some, but not all, FR-I radio galaxies have some sort of obscuring material around their central engines. The remainder are believed to have central engines that are too dim in infrared (IR) and optical to distinguish from their host galaxies. These dim central engines would still produce jets which may appear in the IR as a synchrotron spectrum. This is likely due to environmental factors such as the source of the accreting material. E.g., cold source material may be more likely to form a disk while hot material may be more likely to form an ADAF. The structure of this obscuring material is, however, not necessarily a torus like that described by Nenkova et al. (2002, 2008a, 2008b).
1.3 Overview
To determine what powers the central engine in FR-I radio galaxies and how they fit into the broader picture of AGN we search for the signature of warm obscuring dust in the infrared spectra of ten nearby FR-I radio galaxies from a well-studied sample (see Section 2). Our primary focus is on continuum emission in the band covered by the Spitzer Space Telescope’s Infrared Spectrograph. We analyse archival spectra using a pair of specialized fitting codes based on Markov chain Monte Carlo techniques. We seek to determine whether there is evidence for obscuration consistent with the clumpy torus model by Nenkova et al. (2002) in a sample of ten nearby low luminosity radio galaxies. We used Markov-chain Monte Carlo fitting algorithms to fit spectral lines and and decompose the underlying spectra to IR observations.
We provide an overview of the concepts involved and previous evidence surrounding the possibility of nucleus obscuration in this section. We then describe our sample of FR-I radio galaxies in Section 2 followed by an overview of the archival data used in this research in Section 3 along with the processing of our broadband ancillary data. In Section 4 we provide our analysis of the narrow spectral features in the Spitzer/IRS spectra for each source, with particular focus on AGN and star formation tracers and the 10 and 18 m silicate features. In Section 5 we show the results of fitting various spectral energy distribution models to our entire broadband data set for each source and provide upper limits on any possible torus component (or equivalent mid-infrared thermal component) in those sources which do not require one. In Section 6 we discuss the implications of the models which best agree with the observations and compare our results to those of previous authors.
2 Sample
Our sample is the subset from a list compiled by Verdoes Kleijn et al. (1999) for which there exists low resolution CASSIS spectra (Lebouteiller et al. 2011, see Section 3). We list basic information about the sample galaxies in Table 1. The Verdoes Kleijn et al. (1999) sample consists of all nearby () radio galaxies in Nilson (1973)’s Uppsala General Catalogue (UGC) with declination that are at in VLA A Array maps (to exclude compact sources) and brighter than 150 mJy at 1400 MHz. This sample was extracted from a catalogue of 176 radio galaxies Condon & Broderick (1988) constructed through position coincidence between their Green Bank 1400 MHz sky maps (Condon & Broderick, 1985, 1986, 1988) and the UGC. Condon & Broderick (1988) distinguished between starburst sources and AGN-powered “monsters” based on radio morphology, infrared-radio parameter , and infrared spectral index. Xu et al. (1999) provides a detailed description of this sample’s radio properties.
| UGC | NGC | Alternate | RA | Dec | Redshift |
|---|---|---|---|---|---|
| Number | Number | Name | (J2000.0) | (J2000.0) | |
| 597 | 315 | 00h 57m 48.9s | +30d 21m 09s | 0.016485 | |
| 689 | 383 | 3C 31 | 01h 07m 24.9s | +32d 24m 45s | 0.017005 |
| 1004 | 541 | 01h 25m 44.3s | -01d 22m 46s | 0.018086 | |
| 1841 | 3C 66B | 02h 23m 11.4s | +42d 59m 31s | 0.021258 | |
| 6635 | 3801 | 11h 40m 16.9s | +17d 43m 41s | 0.011064 | |
| 6723 | 3862 | 3C 264 | 11h 45m 05.0s | +19d 36m 23s | 0.021718 |
| 7360 | 4261 | 3C 270 | 12h 19m 23.2s | +05d 49m 31s | 0.007378 |
| 7494 | 4374 | M 84, 3C 272.1 | 12h 25m 03.7s | +12d 53m 13s | 0.003392 |
| 7654 | 4486 | M 87, 3C 274 | 12h 30m 49.4s | +12d 23m 28s | 0.004283 |
| 11718 | 7052 | 21h 18m 33.0s | +26d 26m 49s | 0.015584 |
| Source | ||||
|---|---|---|---|---|
| NGC 315 | 1.26 | 14.6 | 1.84 | -0.39 |
| 3C 31 | 3.24 | 9.24 | 1.16 | -1.34 |
| NGC 541 | 0.871 | 2.03 | 0.226 | - |
| 3C 66B | 8.71 | 18.6 | 2.34 | -1.29 |
| NGC 3801 | 0.309 | 1.53 | 0.193 | - |
| NGC 3862 | 5.62 | 4.66 | 0.587 | -1.00 |
| 3C 270 | 2.51 | 7.75 | 0.976 | -1.44 |
| M 84 | 0.224 | 7.30 | 0.920 | -1.18 |
| M 87 | 7.94 | 22.5 | 2.84 | -1.24 |
| NGC 7052 | 0.110 | 3.62 | 0.456 | -0.22 |
| Source | Redshift | Luminosity | Scale |
|---|---|---|---|
| Distance (Mpc) | (kpc/arcsec) | ||
| NGC 315 | 0.016485 | 71.50 | 0.3466 |
| 3C 31 | 0.017005 | 73.78 | 0.3577 |
| NGC 541 | 0.018086 | 78.54 | 0.3808 |
| 3C 66B | 0.021258 | 92.53 | 0.4486 |
| NGC 3801 | 0.011064 | 47.79 | 0.2317 |
| NGC 3862 | 0.021718 | 94.57 | 0.4585 |
| 3C 270 | 0.007378 | 31.78 | 0.1541 |
| M 84 | 0.003392 | 14.56 | 0.07059 |
| M 87 | 0.004283 | 18.40 | 0.08921 |
| NGC 7052 | 0.015584 | 76.54 | 0.3711 |
| Source | Angular Extent | Physical Extent | Reference |
|---|---|---|---|
| (Mpc) | |||
| NGC 315 | 52’ | 1.1 | Mack et al. (1997) |
| 3C 31 | 45’ | 0.96 | Laing et al. (2008) |
| NGC 541 | 3’ | 0.068 | Bogdán et al. (2011) |
| 3C 66B | 11.5’ | 0.310 | Hardcastle et al. (1996) |
| NGC 3801 | 40” | 0.0093 | Heesen et al. (2014) |
| NGC 3862 | 8.7’ | 0.239 | Bridle & Vallee (1981) |
| 3C 270 | 7.8’ | 0.072 | Kolokythas et al. (2015) |
| M 84 | 3.142’ | 0.01331 | Laing & Bridle (1987) |
| M 87 | 13.9’ | 0.0744 | Owen et al. (2000) |
| NGC 7052 | 2’ | 0.044 | Morganti et al. (1987) |
The original paper on this sample by Verdoes Kleijn et al. (1999) investigated broad- and narrow-band images of 19 of the 21 radio galaxies in its sample from the Wide-Field Planetary Camera 2 aboard HST. Kleijn et al. (2002) searched the same sample for relations between radio and optical continua and optical H emission. Noel-Storr et al. (2003) analyzed mid-resolution spectra of emission-line-emitting gas in FR-I nuclei from the Space Telescope Imaging Spectrograph aboard HST. Noel-Storr et al. (2007) followed up on this with further analysis of the gas kinematics in the same spectra in order to assess the viability of using gas disk kinematics to estimate central black hole masses. Verdoes Kleijn & de Zeeuw (2005) compared dust distributions and their relation to radio jet orientation in the cores of the UGC FR-I sample to two comparison samples. Capetti et al. (2005) looked at HST optical narrow band images of emission line regions in a sample of 47 galaxies which includes the FR-I UGC sample. The most recent study on the UGC FR-I sample was by Kharb et al. (2012). They examined 1.6 and 5 GHz images of 19 out of the 21 radio galaxies from the Very Large Baseline Array as well as archival Chandra X-ray images of 14 sources and new Chandra X-ray images of UGC 408.
3 Archival data
All data for this analysis are archival observations. The central dataset is a set of ten low-resolution Spitzer/IRS spectra which cover the waveband where a clumpy torus is expected to be the brightest. Since the nucleus is not resolved by Spitzer/IRS, we also need to constrain the contribution from the host galaxy. The stellar population models are constrained by photometry from the Two Micron All Sky Survey and Spitzer/IRAC, which extend the band from the IRS short-wave limit of out to where stellar emission is more prominent. To constrain emission from the interstellar medium we use photometry from Spitzer/MIPS and Herschel/SPIRE (where available) to extend our coverage from the IRS long-wave limit of out to . In this section we describe the processing of each of these datasets in order of increasing wavelength.
The Two Micron All Sky Survey (2MASS), as described by Skrutskie et al. (2006), was a J, H, and K-band survey covering 99.998% of the sky performed between June 1997 and February 2001. Observations were performed by two telescopes in Mount Hopkins, Arizona, USA and in Cerro Tololo, Chile. The point source extractions used an instantaneous point-spread function width of 4” with sky background subtraction in an annulus with inner radius of 14” and an outer radius of 20”. Extended source extractions used a fiducial ellipse determined by the 20 mag/ isophote for each source. We list the semi-major axes for these ellipses in Table 5. Both sets of extractions are described in detail by Cutri et al. (2003).
For 2MASS data we use point source extractions of our target AGN as a lower bound to the estimated flux which would pass through an aperture the size of the Spitzer/IRS SL module’s aperture and extended source extractions as an upper bound. This is because the nucleus itself should be an unresolved point source whereas emission from the host galaxy will dominate on larger scales. 3C 66B is not in the 2MASS Extended Source Catalog so we replaced it with extended source photometry by Lilly et al. (1985).
| Source | Semi-major axis | |||
|---|---|---|---|---|
| (arcsec) | (ap. mag) | (ap. mag) | (ap. mag) | |
| NGC 315 | 65.6 | |||
| 3C 31 | 49.9 | |||
| NGC 541 | 37.8 | |||
| 3C 66B* | - | - | - | - |
| NGC 3801 | 49.9 | |||
| NGC 3862 | 30.7 | |||
| 3C 270 | 79.9 | |||
| M 84 | 115.0 | |||
| NGC 7052 | 61.9 |
Our Spitzer/IRAC data are archival images from the Spitzer Heritage Archive. We list the astronomical observation request key (AORKEY) for each source in Table 7. For each source we performed a point-spread function fit to provide a lower bound to the flux and an aperture extraction with the same 4” aperture as 2MASS as an upper bound. Both extractions were centered on the CASSIS source centroid. For this purpose we used the Overlap, Mosaicking, and Multiframe aperture extraction of the Mosaicking and Point Source Extraction (MOPEX) software by Makovoz & Marleau (2005) to combine the IRAC frames (and later MIPS frames) into one mosaic and perform aperture photometry on the result. All ten sources had usable images for channel 2 (effective wavelength m) and all but M 84 had usable images for channel 1 (m). We list the IRAC photometry in Table 10.
| Channel | Isophotal wavelength* | Bandpass | Mean FWHM |
|---|---|---|---|
| (m) | (m) | (arcsec) | |
| 1 | 3.550 | 3.19-3.94 | 1.66 |
| 2 | 4.493 | 4.00-5.02 | 1.72 |
| 3 | 5.731 | 4.98-6.41 | 1.88 |
| 4 | 7.872 | 6.45-9.34 | 1.98 |
| Source | IRAC AOR | MIPS AOR |
|---|---|---|
| NGC 315 | 19169024 | 4427776 |
| 3C 31 | 14805760 | 21681920/4691968* |
| NGC 541 | 19170048 | 4345088 |
| 3C 66B | 14806016 | 10927360 |
| NGC 3801 | 19170304 | 19168512 |
| NGC 3862 | 14807552 | 4692480 |
| 3C 270 | 14807808 | 4692736 |
| M 84 | 4671744 | 4692992 |
| NGC 7052 | 18257664 | 19168768 |
| Wavelength | Flux | Aperture | Limit | Reference |
|---|---|---|---|---|
| (m) | (mJy) | (arcsec) | ||
| 14 | Upper | Skrutskie et al. (2006) | ||
| 7.5 | Lower | Frogel et al. (1978) | ||
| 14 | Upper | Skrutskie et al. (2006) | ||
| 7.5 | Lower | Frogel et al. (1978) | ||
| 14 | Upper | Skrutskie et al. (2006) | ||
| 7.5 | Lower | Frogel et al. (1978) | ||
| 5.8 | Lower | Teplitz et al. (2012) | ||
| 18 | Upper | Temi et al. (2009) | ||
| 40 | Upper | Shi et al. (2007) | ||
| 18 | Upper | Baes et al. (2010) | ||
| 25 | Upper | Baes et al. (2010) | ||
| 36 | Upper | Baes et al. (2010) |
| Source | Channel | Limit | IRAC flux | MIPS flux | SPIRE flux |
|---|---|---|---|---|---|
| (mJy) | (mJy) | (mJy) | |||
| NGC 315 | 1 | Upper | - | - | |
| Lower | - | - | |||
| 2 | Upper | - | |||
| Lower | - | - | |||
| 3 | Upper | - | - | ||
| 3C 31 | 1 | Upper | - | ||
| Lower | - | - | |||
| 2 | Upper | ||||
| Lower | 5.046 | - | - | ||
| 3 | Upper | - | |||
| NGC 541 | 1 | Upper | - | ||
| Lower | - | - | |||
| 2 | Upper | ||||
| Lower | - | - | |||
| 3 | Upper | - | |||
| 3C 66B | 1 | Upper | - | - | |
| Lower | - | - | |||
| 2 | Upper | - | - | ||
| Lower | - | - | |||
| NGC 3801 | 1 | Upper | - | - | |
| Lower | - | - | |||
| 2 | Upper | - | - | ||
| Lower | - | - | |||
| 3 | Upper | - | - |
| Source | Channel | Limit | IRAC | MIPS | SPIRE |
|---|---|---|---|---|---|
| (mJy) | (mJy) | (mJy) | |||
| NGC 3862 | 1 | Upper | - | - | |
| Lower | - | - | |||
| 2 | Upper | - | |||
| Lower | - | - | |||
| 3 | Upper | - | - | ||
| 3C 270 | 1 | Upper | - | ||
| Lower | - | - | |||
| 2 | Upper | ||||
| Lower | - | - | |||
| 3 | Upper | - | |||
| M 84 | 1 | Upper | - | - | |
| 2 | Upper | - | |||
| Lower | - | - | |||
| 3 | Upper | - | - | ||
| NGC 7052 | 1 | Upper | - | - | |
| Lower | - | - | |||
| 2 | Upper | - | |||
| Lower | - | - | |||
| 3 | Upper | - | - |
All of our IRS spectra, which cover a total wavelength coverage from 5.3-38 m, are tapered column extractions from the low-resolution catalog of the Combined Atlas of Sources with Spitzer/IRS Spectra (CASSIS, formerly the Cornell Atlas of Spitzer/IRS Sources) by Lebouteiller et al. (2011).
Similar to our Spitzer/IRAC data, our Spitzer/MIPS data are archival images from the Spitzer Heritage Archive for which we list the AORKEY in Table 7. The photometry extraction pipeline for MIPS in MOPEX is also similar to that for IRAC. However, the aperture extraction module in MOPEX failed so we used the point-source flux only. The point-spread function for the 70 and 160 m bands is wider than for IRS so the point source flux provided an upper bound on the far-infrared flux of our fits. Only M 84 had no usable MIPS photometry and NGC 3801 had no usable 70 m data. Unfortunately, although MIPS had spectroscopic capabilities, there were no MIPS spectra for the galaxies in our sample.
The Spectral and Photometric Imaging Receiver (SPIRE) aboard Herschel has imaging bands at wavelengths of 250, 350, and 500 m with full width at half maximum (FWHM) beam widths of 18”, 25”, and 36” respectively. SPIRE also has an imaging Fourier transform spectrometer but, as with Spitzer/MIPS, only photometry observations are available of any of our sample galaxies.
We used archival Herschel/SPIRE point source extractions from the SPIRE Point Source Catalog by Marton et al. (2016). We list the observation identification number (obsid) for the two sources in Table 7. The SPIRE Point Source Catalog reports fluxes and not magnitudes so no further processing is necessary.
4 Spectral feature fitting
We have developed a modified version of PAHFIT (Smith et al., 2007), pahfitMCMC, to measure narrow spectral features and subtract them from Spitzer/IRS spectra. These narrow line features include mainly fine structure lines and ro-vibrational transitions of H2. The challenge is that narrow lines are undersampled in low-resolution IRS spectra and may sit atop broad spectral features such as PAH emission or silicate (10 and 18 m) absorption or emission, which makes continuum subtraction difficult. PAHFIT uses well-established models for PAH and silicate features, in addition to models for starlight and thermal dust continuum, to provide an estimate of the spectral baseline for narrow line features.
In pahfitMCMC, there are two primary modifications over the original PAHFIT. Firstly, we include additional spectral features that may contribute to the infrared spectra of AGN, namely, high-ionization fine structure lines and a simple model for optically thin, warm silicate emission (Gallimore et al., 2010). Secondly, we adopted a Markov Chain Monte Carlo (MCMC) approach to parameter estimation. Fitting and Spitzer/IRS spectrum involves allowing the code to take random steps through parameter space; for this purpose, we used the DREAM(Z) algorithm of ter Braak & Vrugt (2008), which efficiently samples high-dimensional parameter spaces. Solutions were accepted or rejected using the Metropolis algorithm (Metropolis et al., 1953). Initial, out-of-equilibrium solutions were identified by inspection of posterior log-likelihood chains and discarded. The best fit solutions for parameters such as line strength and equivalent width are determined by averages and standard deviations of the posterior chains.
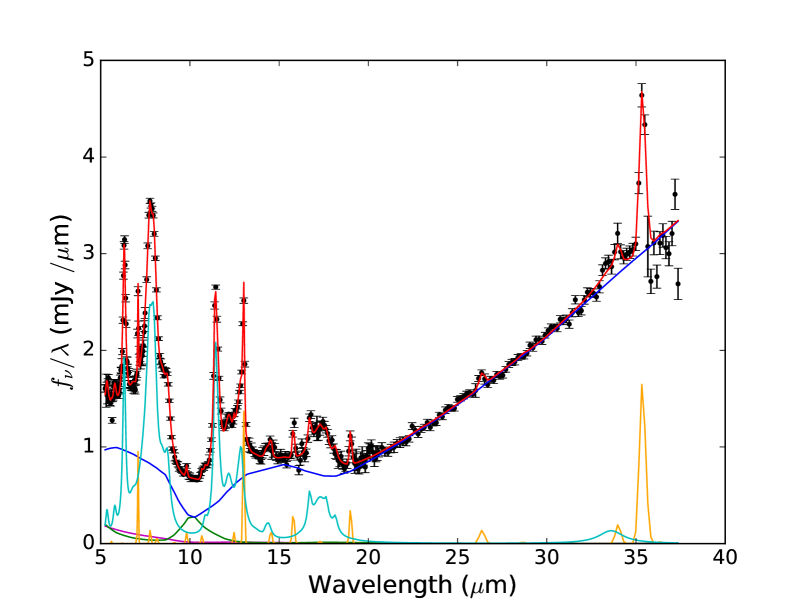
In summary, pahfitMCMC reports fitted line strengths and equivalent widths for narrow emission lines, fitted line strengths and equivalent widths for PAH and silicate features, a line-subtracted spectrum for each source (to which we fit continuum models in Section 5, the simple continuum models at this step are not diagnostic), and Bayesian marginalized error estimates for all fits. We show pahfitMCMC fits for our sample in Figure 10 and then discuss important diagnostics.


4.1 Star formation rate estimates
We use and , the luminosities [Ne II] and [Ne III] lines respectively, to estimate the star formation rate (SFR) in each sample galaxy. This estimate by Ho & Keto (2007), , is given as
| (1) |
Similarly, we use the combined luminosity of the 6.2 and 11.3 m PAH lines, to get a second independent estimate of the SFR in each source. This estimate by Farrah et al. (2007), , is given by
| (2) |
Finally, we also show SFR estimates using scalings by Roussel et al. (2001) using () and () “photometry” measurements created by integrating the Spitzer/IRS spectra over 16.18 THz and 6.75 THz bandpasses respectively to approximate the bandpasses of the relevant Infrared Space Observatory filters. These scalings are given by
| (3) |
and
| (4) |
with approximately calibration uncertainties. Farrah et al. (2007) showed that Equations 1 and 2 give equivalent results in their Figure 15; this is also supported by Willett et al. (2010). However, Jensen et al. (2017) found that AGN activity can dominate PAH emission in Seyfert galaxies and it is currently unknown whether this finding will generalize to include low-luminosity radio galaxies. Despite the different estimates, they are consistently below a few solar masses per year so we do not expect star formation to contribute a large thermal component in the MIR which could be mistaken for warm nuclear obscuring material.
The high estimates in 3C 31 and NGC 3862 are consistent with the high PAH emission Leipski et al. (2009) found in these objects. Our relatively low estimates in 3C 66B and 3C 270 are also consistent with their findings of no PAH features in 3C 66B and weak PAH features in 3C 270. However, Leipski et al. (2009) found significant 11.3m PAH emission in M 84 which is inconsistent with our results.
| Source | ||||
|---|---|---|---|---|
| () | () | () | () | |
| NGC 315 | ||||
| 3C 31 | ||||
| NGC 541 | ||||
| 3C 66B | ||||
| NGC 3801 | ||||
| NGC 3862 | ||||
| 3C 270 | ||||
| M 84 | ||||
| M 87* | ||||
| NGC 7052 |
4.2 High ionization lines
Significant emission lines from ionization states with a high ionization potential require a large source of high energy photons. These photons can come from massive stars but the central engine itself is the obvious photon source candidate. Indeed, Spinoglio & Malkan (1992) showed that you can distinguish star formation from accretion based on which lines are excited; AGN produce photons that can ionize atoms with a higher ionization potential. We list the luminosities of 4 high-ionization lines which are accretion tracers in Table 12: 8 m, 14 m, 24 m, and 26 m. High-energy ionizing photons from an accretion disk should be unable to penetrate a dusty obscuring torus, so the detection of infrared spectral lines from highly-ionized species suggests that we are seeing unobscured or minimally-obscured (in infrared) emission from clouds near the central engine. Note that the presence of these lines does not completely prohibit an obscuring torus, since these lines are infrared radiation which can pass through dust clouds better than UV or optical photons from the central engine. Still, they suggest some other explanation may be preferable.
| Source | 8 m | 14 m | 24 m | 26 m |
|---|---|---|---|---|
| () | () | () | () | |
| NGC 315 | ||||
| 3C 31 | ||||
| NGC 541 | ||||
| 3C 66B | ||||
| NGC 3801 | ||||
| NGC 3862 | ||||
| 3C 270 | ||||
| M 84 | ||||
| M 87 | ||||
| NGC 7052 |
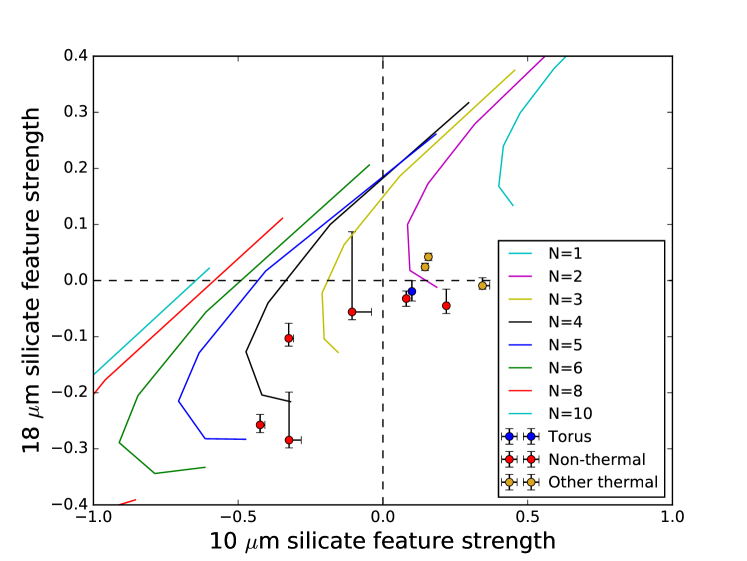
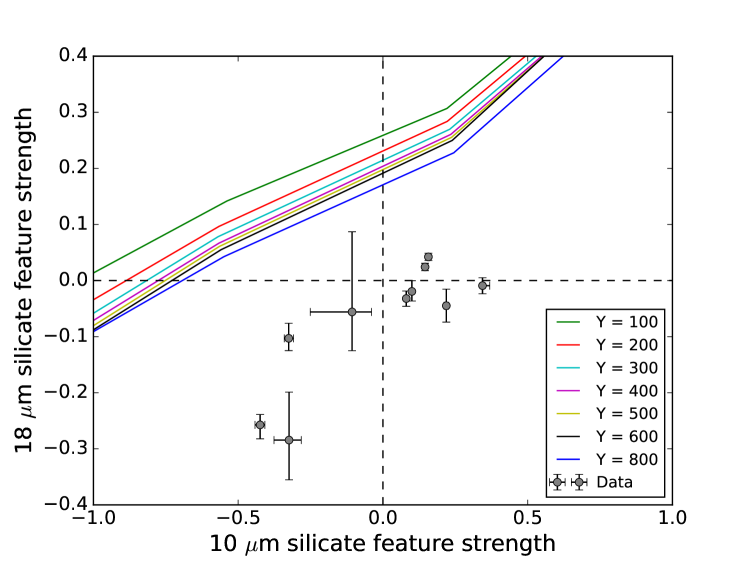
4.3 Silicate constraints on torus models
We compare our 10 and 18 m silicate feature observations to model sets by Sirocky et al. (2008) to test whether our results are consistent with clumpy torus models, as this is an important diagnostic of the clumpiness of an obscuring torus. We show this comparison in Figure 18, where we compare our best-fit silicate line strengths , defined as
| (5) |
in terms of the observed flux of the feature and the interpolated continuum flux at the peak wavelength) that we found in our line fits to the various Sirocky et al. (2008) clumpy torus and smooth shell models.
Nenkova et al. (2008b) model the radial distribution of the clumpy torus as the power law distribution
| (6) |
Figures 12-14 show the comparison to model sets, each with various numbers of clouds along the line of sight, by Sirocky et al. (2008) with power law index of 0-2 respectively.
Similarly, the mass distribution of the single continuous cloud in the smooth shell model also follows a power law,
| (7) |
still described by the power law index, , and dependent on the radial extent of the cloud, (given in units of the dust sublimation radius).
We find that the silicate line strengths are inconsistent with smooth shell models of AGN obscuration and with clumpy models with power law indices and are consistent with clumpy models with and although a few are also consistent with the complete absence of any silicate feature. Note that in Section 5 we find that only four of our ten sources show a significant thermal component in their continua, which we denote with blue and yellow markers in Figures 12-14.


5 Continuum fitting
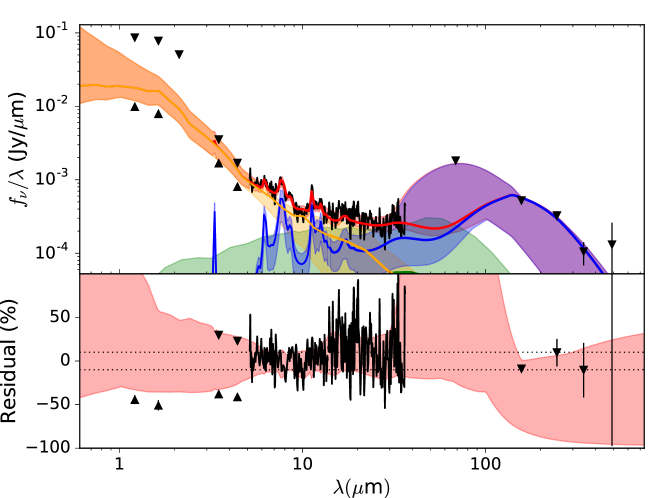
The infrared spectra, including low-resolution, narrow-line-subtracted IRS spectra, were decomposed using clumpyDREAM (Sales et al., 2015). This software assumes that the infrared spectra of active galaxies include contributions from starlight, dusty star-forming regions, obscuring molecular clouds near the AGN, etc. (see, e.g., Genzel & Cesarsky 2000). To decompose the observed infrared spectrum, clumpyDREAM simultaneously fits models for these different infrared sources. During the fit, gridded model parameters are allowed to vary smoothly over the range allowed by the model grid, and a model spectrum is extracted from the model grid by -dimensional spline interpolation, where is the number of parameters defining the model grid.
clumpyDREAM uses a custom implementation of the DREAM(ZS) MCMC stepper algorithm (ter Braak & Vrugt, 2008) to fit models to the observed spectra. The DREAM(ZS) stepper uses differential evolution, as described by Storn & Price (1997), to determine most of its steps in parameter space but it uses the snooker updater described by ter Braak & Vrugt (2008) for every tenth iteration. It uses walkers randomly initialized with uniform priors (Sales et al., 2015). For further details on clumpyDREAM and futher overview of DREAM(ZS) see the appendix of Sales et al. (2015).
Fitting a spectrum was performed in two stages. First, we used a modified version of clumpyDREAM, clumpyDREAMBIC, to determine which model components are likely needed to best fit the observed spectrum. To this end, clumpyDREAMBIC searches for best-fit model combinations with different model components (e.g., starlight, star-forming regions, etc.) toggled off or on. A given model combination is evaluated for goodness-of-fit using the Bayes Information Criterion (BIC; Schwarz 1978),
| (8) |
where is the likelihood function, is the number of parameters in the trial set of model components, and is the number of data points in the observed spectrum. By searching for model combinations that minimize the BIC, the result is a model that maximizes the likelihood function while penalizing model combinations that over-fit the observed spectrum (i.e., too large ). After clumpyDREAMBIC estimates the BIC for different combinations of model components, the fit is repeated with for fixed sets of model components in clumpyDREAM. A typical run for a single spectrum involves first running clumpyDREAMBIC with three parallel chains for iterations with chains thinned by a factor of ten (i.e., parameter values are stored to the Markov chains every ten iterations). Then, based on the output of clumpyDREAMBIC, clumpyDREAM is run on fixed model combinations, again with three parallel chains, iterations, and factor of ten thinning.
In this Section we describe each of the model components we try to fit with clumpyDREAM except the clumpy torus model itself which we describe in Section 1.1. For quick reference we list all of these and their source papers in Table 13.
These targets are galaxies so we force the model to include a simple stellar population for every source as well as a diffuse interstellar medium (ISM). We use the GRASIL stellar population model for elliptical galaxies developed by Silva et al. (1998) and the diffuse ISM model described by Draine & Li (2007). The GRASIL models simulate a 1 Gyr burst of star formation followed by passive evolution and so are described solely by the age and scaling of the stellar population. The stellar population models are not expected to contribute significantly in the IRS band but that they should dominate the NIR and so should be well constrained by our 2MASS and IRAC photometry. Our results in some cases favor models in which stars contribute significantly to the IRS band, particularly at the short-wavelength end, but this is not surprising due to the dim nucleus. In this section, however, there is significant contribution from the stellar population model through the short-wave end of the IRS band in several of our sources which is likely due to the low overall IRS band luminosity of those sources.
The diffuse ISM model by Draine & Li (2007) has three main parameters: the mass fraction of polycyclic aromatic hydrocarbons relative to the total dust mass, the lower limit of the interstellar radiation field as a scaling of that in the solar neighborhood , and photo-dissociation regions exposed to which are characterized by their relative contribution to the spectrum.
We use a narrow-line region (NLR) model, based on the DUSTY continuum radiative transfer code by Nenkova et al. (1999), together with a blackbody hot dust model. This approach is similar to the one taken by Mor et al. (2009) in order to fit IRS spectra of quasi-stellar objects (QSOs). Mor et al. (2009) also attempted torus models and models with both a torus and an NLR and found that neither were adequate. Since we are extending our dataset beyond the IRS band into the far-infrared/sub-mm we consider a cold dust component as well. All three components are described in our models by two parameters each — their temperature and their luminosity. Note that the NLR clouds and hot dust are optically thin.
We also try a foreground extinction component, as described by Fischera et al. (2003), on the torus in 3C 31, NGC 3801, and M 84. These sources appear to have regions with decreased brightness compared to adjacent regions at the same radius which could be foreground dust in SDSS images by Blanton et al. (2017) although it is only obvious in NGC 3801. On a similar note we only tested power-law synchrotron spectra in sources with known optical/IR jets. These are 3C 31 (Lanz et al., 2011), 3C 66B (Tansley et al., 2000), NGC 3862 (Crane et al., 1993), and M 87 (Perlman et al., 2001). We constrain the power law indices to the widest ranges given in the cited papers. We list these model components in Table 13 for reference.
| Component | Plotting colour | Reference |
|---|---|---|
| Clumpy torus | Green | Nenkova et al. (2008b) |
| Hot dust | Pink | - |
| Cold dust | - | - |
| Diffuse ISM | Blue | Draine & Li (2007) |
| Simple stellar population | Yellow | Silva et al. (1998) |
| Foreground extinction on torus | - | Fischera et al. (2003) |
| Power law | Purple | - |
| Narrow line region | Cyan | Nenkova et al. (1999) |
| Aperture correction | - | - |
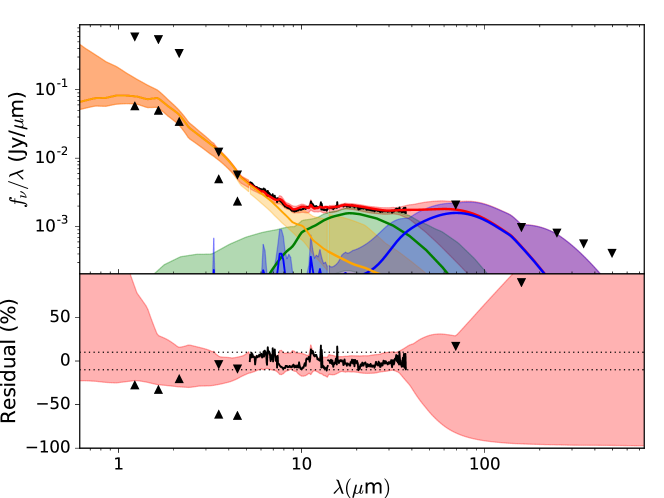
In this section we present the best fit models for the continuum emission from each of our sample galaxies. Additionally, we present the results of forcing a torus component and suppressing all other IR-peaked thermal components (i.e., requiring that the software include a clumpy torus component and not include any other thermal components which peak in IR) in order to establish a firm upper limit on the contribution to the total flux from a possible torus component. Low contributions from a compact clumpy torus may otherwise be hidden by fitting degeneracies between thermal model components; removing the possibility of such fitting degeneracies allows us to determine the highest contribution from a torus component to the overall spectrum which would still be consistent with observations. Finally, we present an overview of the results for the entire sample at the end of this section.
5.1 NGC 315
This source favors a torus component and that torus component is a significant part of the best fit, contributing of the flux at 15 and 30 m and at 60 m. There is possible degeneracy between the torus component and NLR component but we doubt that this is a significant concern in this case due to the fact that the BIC will penalize the torus model more harshly due to its higher number of parameters. We therefore see no particular reason to doubt the presence of an obscuring warm torus-like structure in this AGN.
The presence of a torus component in the spectral energy distribution of NGC 315 is consistent with the discovery of broad polarized H emission in this source by Barth et al. (1999). Which may indicate the presence of a Thomson-scattered hidden broad line region.
Similarly, Gu et al. (2007) detected a low-luminosity compact AGN in IRAC and MIPS images of NGC 315 after removal of stellar IR emission and accounting for emission from a central dusty disk. They make no claims about the nature of this AGN however its presence is consistent with our result that the IR spectrum of NGC 315 is not entirely dominated by emission from the host galaxy.

| Component | Wavelength | Best fit | Minimum | Maximum |
|---|---|---|---|---|
| (m) | (%) | (%) | (%) | |
| Torus | 5.0 | 1.4 | 0.8 | 33.5 |
| 15.0 | 69.0 | 59.4 | 97.8 | |
| 30.0 | 69.9 | 40.8 | 100 | |
| 60.0 | 47.8 | 13.5 | 91.9 | |
| Diffuse ISM | 5.0 | 1.8 | 0.2 | 2.9 |
| 15.0 | 10.4 | 1.7 | 20.1 | |
| 30.0 | 24.7 | 1.7 | 64.9 | |
| 60.0 | 50.1 | 4.2 | 100 | |
| Stars | 5.0 | 96.8 | 58.8 | 100 |
| 15.0 | 20.6 | 2.1 | 22.8 | |
| 30.0 | 5.4 | 0.2 | 6.0 | |
| 60.0 | 2.0 | 0.0 | 2.2 |
5.2 3C 31
This source appears to be dominated by emission from the host galaxy in the IRS band. This source contains an optical jet, first noticed by Butcher et al. (1980), and a radio jet which Croston et al. (2003) identifies as the same structure as in the optical. The optical jet does not contribute substantially to the IR core flux. It is worth noting, however, that Lanz et al. (2011) detect extended NIR emission from the jet at kpc scales in Spitzer/IRAC images. As shown in Figure 21 and in Table 16, when a torus component is forced it contributes a significant amount of flux at and with best fit fractional contributions of 34.2% and 18.7% respectively. However, as shown in Table 40, the BIC difference between galaxy models with a forced torus and galaxy-only models is non-negligable (the BIC of the forced-torus model is , or , higher) and we notice no obviously unphysical best fit model parameters, therefore we conclude that we do not find evidence for a warm obscuring torus in the infrared spectra of 3C 31. We note, however, that Constantin et al. (2015) detected broad H emission with a FWHM of , contributing 86% of the combined narrow+broad H flux. This broad H is consistent with the presence of a broad line region and therefore possibly an accretion disk.

| Component | Wavelength | Best fit | Minimum | Maximum |
| (m) | (%) | (%) | (%) | |
| Diffuse ISM | 5.0 | 4.2 | 3.0 | 5.0 |
| 15.0 | 57.0 | 43.2 | 64.4 | |
| 30.0 | 83.6 | 65.7 | 100 | |
| 60.0 | 99.1 | 18.7 | 100 | |
| Stars | 5.0 | 95.8 | 83.0 | 100 |
| 15.0 | 43.0 | 27.2 | 64.6 | |
| 30.0 | 16.4 | 5.6 | 25.0 | |
| 60.0 | 0.9 | 0.2 | 1.2 |

| Component | Wavelength | Best fit | Minimum | Maximum |
|---|---|---|---|---|
| (m) | (%) | (%) | (%) | |
| Torus | 5.0 | 8.0 | 0.0 | 13.6 |
| 15.0 | 34.2 | 0.0 | 48.7 | |
| 30.0 | 18.7 | 0.0 | 54.2 | |
| 60.0 | 0.4 | 0.0 | 11.2 | |
| Diffuse ISM | 5.0 | 3.6 | 2.8 | 4.4 |
| 15.0 | 51.1 | 39.6 | 59.3 | |
| 30.0 | 77.9 | 45.2 | 98.4 | |
| 60.0 | 99.4 | 19.9 | 100 | |
| Stars | 5.0 | 88.4 | 73.5 | 98.9 |
| 15.0 | 14.8 | 8.0 | 59.3 | |
| 30.0 | 3.4 | 1.2 | 24.7 | |
| 60.0 | 0.2 | 0.0 | 1.3 |
5.3 NGC 541
Not only does the best fit to the continuum emission in this source not require a torus component but the best fit contribution from a forced torus component is not significant, contributing only at its brightest. The largest difference between the best fit model and the data is the 70m but that point is an upper limit and the best fit model is within the uncertainty of the data point. We therefore conclude that we can explain all the emission with only contributions from the host galaxy and none from the nucleus and so rule out any significant MIR-bright obscuration.

| Component | Wavelength | Best fit | Minimum | Maximum |
| (m) | (%) | (%) | (%) | |
| Diffuse ISM | 5.0 | 2.0 | 0.9 | 2.5 |
| 15.0 | 43.8 | 21.1 | 52.1 | |
| 30.0 | 82.1 | 36.3 | 100 | |
| 60.0 | 94.7 | 79.0 | 100 | |
| Stars | 5.0 | 98.0 | 80.3 | 100 |
| 15.0 | 56.2 | 33.0 | 100 | |
| 30.0 | 17.9 | 6.2 | 35.4 | |
| 60.0 | 5.3 | 1.3 | 10.1 |
| Component | Wavelength | Best fit | Minimum | Maximum |
| (m) | (%) | (%) | (%) | |
| Torus | 5.0 | 0.0 | 0.0 | 13.9 |
| 15.0 | 4.3 | 0.0 | 78.8 | |
| 30.0 | 20.7 | 0.0 | 81.4 | |
| 60.0 | 15.7 | 0.0 | 100 | |
| Diffuse ISM | 5.0 | 1.8 | 0.8 | 2.4 |
| 15.0 | 36.8 | 20.2 | 51.4 | |
| 30.0 | 57.4 | 23.3 | 100 | |
| 60.0 | 78.6 | 39.9 | 100 | |
| Stars | 5.0 | 98.1 | 74.6 | 100 |
| 15.0 | 58.9 | 11.9 | 99.6 | |
| 30.0 | 21.9 | 1.7 | 40.1 | |
| 60.0 | 5.7 | 0.2 | 10.1 |
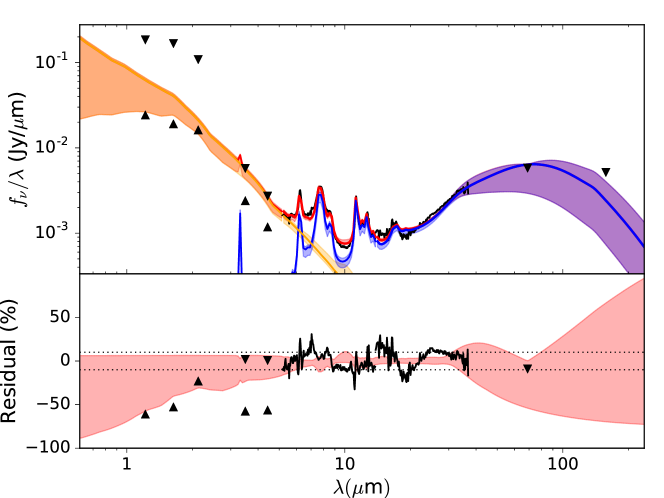
5.4 3C 66B
The best fit for this source requires a prominent hot dust component and a significant NLR model component. The best fit to the diffuse ISM component is unusually dim but the uncertainties are wide.
The upper limit provided by the fit with a forced torus component is a significant fraction of the total flux but the forced torus is unusually cold, suppresses the diffuse ISM component, and those two fits have a large BIC difference (best: 472.3, forced torus: 506.8) of 34.5. We note that the BIC difference may be primarily due to the removal of the hot dust component since we expect the most degeneracy between the NLR and torus components as they are both MIR thermal components. Overall, we cannot rule out the possibility of a torus, especially given the presence of another MIR thermal component, but we also do not favor the presence of a torus so we consider our results inconclusive with regard to the presence of a clumpy torus but our results quite strongly indicate the presence of some MIR thermal component.

| Component | Wavelength | Best fit | Minimum | Maximum |
| (m) | (%) | (%) | (%) | |
| Diffuse ISM | 5.0 | 0.1 | 0.0 | 0.5 |
| 15.0 | 5.9 | 0.1 | 11.8 | |
| 30.0 | 35.1 | 0.5 | 58.9 | |
| 60.0 | 66.7 | 1.1 | 100 | |
| Stars | 5.0 | 64.0 | 31.4 | 83.2 |
| 15.0 | 59.5 | 13.2 | 80.3 | |
| 30.0 | 28.7 | 3.1 | 38.6 | |
| 60.0 | 19.6 | 1.6 | 26.1 | |
| NLR | 5.0 | 0.0 | 0.0 | 0.1 |
| 15.0 | 26.1 | 11.6 | 49.2 | |
| 30.0 | 34.6 | 13.0 | 70.6 | |
| 60.0 | 12.9 | 4.4 | 48.2 | |
| Hot dust | 5.0 | 35.9 | 8.8 | 84.5 |
| 15.0 | 8.5 | 2.3 | 24.1 | |
| 30.0 | 1.7 | 0.4 | 5.1 | |
| 60.0 | 0.7 | 0.2 | 2.2 |

| Component | Wavelength | Best fit | Minimum | Maximum |
| (m) | (%) | (%) | (%) | |
| Torus | 5.0 | 0.2 | 0.0 | 7.2 |
| 15.0 | 26.7 | 11.4 | 50.0 | |
| 30.0 | 65.1 | 20.7 | 81.9 | |
| 60.0 | 78.7 | 17.2 | 100 | |
| Diffuse ISM | 5.0 | 0.0 | 0.0 | 0.3 |
| 15.0 | 0.0 | 0.0 | 7.7 | |
| 30.0 | 0.0 | 0.0 | 42.6 | |
| 60.0 | 0.1 | 0.0 | 100 | |
| Stars | 5.0 | 99.8 | 90.9 | 100 |
| 15.0 | 73.2 | 48.2 | 88.3 | |
| 30.0 | 34.9 | 22.5 | 41.8 | |
| 60.0 | 21.3 | 14.3 | 25.1 |
5.5 NGC 3801
The best fit for NGC 3801 requires a NLR component, however it is very dim so we suspect it is likely either a fitting artifact or possibly associated with a large-scale structure in the host galaxy. A likely candidate for this component from the host is the large dust lane visible near the AGN in HST images by Verdoes Kleijn et al. (1999). The forced-torus fit is significantly worse, with a BIC of 453.7 compared to the best-fit BIC of 423.5. We also show an extincted galaxy-only fit with a BIC of 437.3 in Figure 27 as a comparison since the dust lane which is a candidate thermal source would also provide foreground extinction on the core. Overall, we do not find evidence for nuclear obscuration in the form of a clumpy torus and our results are ambiguous for any other warm thermal component in the nucleus itself due to likely emission from the host galaxy.
Das et al. (2005) detected a flat-spectrum non-thermal core in NGC 3801 in images from the Berkeley-Illinois-Maryland Association millimeter-wave array. This does not appear to contribute significantly to the IRS band and we have too little far-infrared photometry to properly compare. They also detected carbon monoxide CO(1-0) emission from the dust disk seen in HST images (Verdoes Kleijn et al., 1999) with a velocity gradient indicating a rotating disk of molecular gas and dust with an inferred of molecular hydrogen. They also detected a infalling molecular gas clump which they attribute to a recent merger.
Hota et al. (2012) found evidence in GALEX images of a kinematically decoupled core in NGC 3801 in which star formation has recently declined following a post-merger burst but the jet-driven shock has not yet triggered a burst of star formation in the outer regions to the galaxy. In comparison, our SFR estimates based on PAH fit results in Section 4 are higher than average for our sample and our SFR estimates based on narrow Neon lines are typical for the sample. Our continuum models have a bright diffuse ISM which may be associated with the large-scale gas Hota et al. (2012) predict will begin to form stars within the next 10 Myr. Our stellar population models show a high stellar age of 9.4 Gyr but as mentioned earlier our model only accounts for one burst of star formation followed by passive evolution so our results only suggest that the population of low-mass stars is still dominated by the older sub-population.


| Component | Wavelength | Best fit | Minimum | Maximum |
| (m) | (%) | (%) | (%) | |
| Diffuse ISM | 5.0 | 7.0 | 5.7 | 8.0 |
| 15.0 | 79.6 | 64.2 | 88.2 | |
| 30.0 | 96.4 | 74.9 | 100 | |
| 60.0 | 99.9 | 19.7 | 100 | |
| Stars | 5.0 | 85.9 | 69.5 | 99.6 |
| 15.0 | 16.1 | 6.7 | 44.6 | |
| 30.0 | 2.8 | 1.0 | 17.8 | |
| 60.0 | 0.1 | 0.0 | 0.7 | |
| NLR | 5.0 | 7.1 | 0.0 | 14.3 |
| 15.0 | 4.3 | 0.0 | 21.3 | |
| 30.0 | 0.8 | 0.0 | 14.8 | |
| 60.0 | 0.0 | 0.0 | 10.5 |

| Component | Wavelength | Best fit | Minimum | Maximum |
|---|---|---|---|---|
| (m) | (%) | (%) | (%) | |
| Torus | 5.0 | 23.0 | 0.0 | 30.0 |
| 15.0 | 13.0 | 0.0 | 34.2 | |
| 30.0 | 3.8 | 0.0 | 34.3 | |
| 60.0 | 0.0 | 0.0 | 13.1 | |
| Diffuse ISM | 5.0 | 6.6 | 5.5 | 8.1 |
| 15.0 | 76.7 | 61.2 | 87.2 | |
| 30.0 | 93.7 | 61.5 | 100 | |
| 60.0 | 99.9 | 18.2 | 100 | |
| Stars | 5.0 | 70.4 | 58.6 | 100 |
| 15.0 | 10.3 | 5.3 | 45.3 | |
| 30.0 | 2.5 | 0.8 | 18.7 | |
| 60.0 | 0.1 | 0.0 | 0.9 |
5.6 NGC 3862
The best fit model for this source requires only components from the host galaxy suggesting that the AGN does not contribute significantly to the IR flux. The largest difference between the best fit model and the data is the 70m but that point is an upper limit and within the uncertainty on the best fit model spectrum.
The forced torus model in this source is quite reasonable albeit rather warm with a peak around , providing a firm upper limit on any possible torus component of of the flux at , of the flux at , and of the flux at . However, it is also unnecessary to explain the infrared spectrum as the best fit has a BIC of and the forced-torus fit has a BIC of . Therefore, we see no evidence for a warm IR-bright obscuring structure in NGC 3862.

| Component | Wavelength | Best fit | Minimum | Maximum |
| (m) | (%) | (%) | (%) | |
| Diffuse ISM | 5.0 | 1.5 | 0.8 | 2.0 |
| 15.0 | 30.1 | 21.2 | 37.6 | |
| 30.0 | 77.4 | 63.5 | 95.7 | |
| 60.0 | 93.3 | 54.8 | 100 | |
| Stars | 5.0 | 98.5 | 89.2 | 100 |
| 15.0 | 69.9 | 54.9 | 81.6 | |
| 30.0 | 22.6 | 10.2 | 26.1 | |
| 60.0 | 6.7 | 2.5 | 7.6 |

| Component | Wavelength | Best fit | Minimum | Maximum |
| (m) | (%) | (%) | (%) | |
| Torus | 5.0 | 16.7 | 0.0 | 27.3 |
| 15.0 | 49.7 | 0.0 | 69.6 | |
| 30.0 | 13.0 | 0.0 | 68.5 | |
| 60.0 | 1.9 | 0.0 | 100 | |
| Diffuse ISM | 5.0 | 1.3 | 0.5 | 2.0 |
| 15.0 | 27.1 | 13.4 | 36.1 | |
| 30.0 | 78.1 | 12.4 | 87.6 | |
| 60.0 | 92.6 | 37.9 | 100 | |
| Stars | 5.0 | 82.0 | 63.6 | 100 |
| 15.0 | 23.2 | 8.1 | 82.4 | |
| 30.0 | 9.0 | 0.9 | 25.1 | |
| 60.0 | 5.5 | 0.2 | 12.1 |
5.7 3C 270
We show our best fit for 3C 270 in Figure 31, the best fit with a forced torus component in Figure 32, and the fractional contributions to the flux in each of the two models in Tables 25 and 26 respectively. We suspect that the preference for a narrow-line region model in this source is due to a bias in our analysis since BIC favors models with fewer parameters and the NLR model has fewer parameters than a clumpy torus model. Therefore we cannot rule out a torus in this source. The presence of a torus in 3C 270 would be consistent with results by Antonucci (private communication) who detected broad polarized H emission. This is potentially indicative of a Thomson-scattered hidden broad line region such as that expected in a high-excitation AGN, however Antonucci (private communication) caution that it could instead be due to narrow lines in the complex. Additionally, although van der Wolk et al. (2010a) ultimately do not conclude the existence of a warm MIR thermal component in any of the eight FR-I radio galaxies in their sample they list 3C 270 as a possible exception due to a weak MIR consistent with 200 K dust. Jaffe et al. (1993) note a disk of cold dust in HST images of 3C 270 surrounding its unresolved nucleus, the inner regions of which may be heated by the AGN (or star formation but our SFR estimates are too low for that) to produce the MIR excess detected.

| Component | Wavelength | Best fit | Minimum | Maximum |
|---|---|---|---|---|
| (m) | (%) | (%) | (%) | |
| Diffuse ISM | 5.0 | 0.2 | 0.1 | 0.9 |
| 15.0 | 5.0 | 2.9 | 17.2 | |
| 30.0 | 23.5 | 5.7 | 80.4 | |
| 60.0 | 90.3 | 7.7 | 94.5 | |
| Stars | 5.0 | 99.8 | 93.1 | 100 |
| 15.0 | 72.4 | 46.7 | 90.2 | |
| 30.0 | 29.8 | 18.1 | 37.0 | |
| 60.0 | 4.5 | 2.5 | 5.6 | |
| NLR | 5.0 | 0.0 | 0.0 | 0.1 |
| 15.0 | 22.6 | 3.1 | 37.4 | |
| 30.0 | 46.7 | 1.8 | 78.0 | |
| 60.0 | 5.2 | 0.1 | 15.6 |
| Component | Wavelength | Best fit | Minimum | Maximum |
|---|---|---|---|---|
| (m) | (%) | (%) | (%) | |
| Torus | 5.0 | 1.5 | 0.1 | 15.6 |
| 15.0 | 73.6 | 10.6 | 86.7 | |
| 30.0 | 63.8 | 8.6 | 100.0 | |
| 60.0 | 13.0 | 1.6 | 44.0 | |
| Diffuse ISM | 5.0 | 0.3 | 0.0 | 0.7 |
| 15.0 | 6.5 | 0.9 | 13.9 | |
| 30.0 | 25.8 | 1.4 | 63.7 | |
| 60.0 | 84.0 | 4.5 | 100 | |
| Stars | 5.0 | 98.2 | 75.7 | 100 |
| 15.0 | 20.0 | 9.2 | 74.7 | |
| 30.0 | 10.4 | 1.3 | 30.7 | |
| 60.0 | 3.0 | 0.2 | 6.6 |
5.8 M 84
The best fit model for this source requires two AGN components: a hot dust component and an NLR. Unfortunately, we have no MIPS photometry and only one IRAC channel for M 84.
The forced torus component in the forced-torus fit to M 84 is quite reasonable albeit unusually dim with a best-fit AGN luminosity of (see Table 38 and discussion in Section 6). However, it has the largest difference in goodness-of-fit out of any of our pairs of models with the best fit having a BIC of compared to for the forced-torus fit. At least part of that is likely due to forced suppression of the hot dust component. Recall that the purpose of the forced-torus fits was to provide an upper limit on any potential torus contribution. Overall, we conclude that there is likely an optically thin thermal hot dust component and that the bumps in the spectrum toward the MIR are probably a thermal component although likely not in the form of a Nenkova et al. (2002) clumpy torus.

| Component | Wavelength | Best fit | Minimum | Maximum |
| (m) | (%) | (%) | (%) | |
| Diffuse ISM | 5.0 | 0.5 | 0.1 | 1.3 |
| 15.0 | 19.9 | 8.8 | 35.7 | |
| 30.0 | 71.5 | 51.2 | 94.5 | |
| 60.0 | 99.3 | 40.3 | 100 | |
| Stars | 5.0 | 37.6 | 27.4 | 77.4 |
| 15.0 | 37.7 | 9.3 | 86.9 | |
| 30.0 | 11.3 | 1.8 | 35.0 | |
| 60.0 | 0.4 | 0.0 | 1.4 | |
| NLR | 5.0 | 0.1 | 0.0 | 2.8 |
| 15.0 | 13.2 | 0.0 | 27.6 | |
| 30.0 | 10.7 | 0.0 | 26.6 | |
| 60.0 | 0.2 | 0.0 | 8.4 | |
| Hot dust | 5.0 | 61.8 | 17.0 | 73.1 |
| 15.0 | 29.2 | 5.8 | 43.5 | |
| 30.0 | 6.6 | 1.2 | 10.7 | |
| 60.0 | 0.2 | 0.0 | 0.3 |

| Component | Wavelength | Best fit | Minimum | Maximum |
|---|---|---|---|---|
| (m) | (%) | (%) | (%) | |
| Torus | 5.0 | 9.5 | 0.0 | 17.2 |
| 15.0 | 33.6 | 0.0 | 67.4 | |
| 30.0 | 14.1 | 0.0 | 46.5 | |
| 60.0 | 0.2 | 0.0 | 3.0 | |
| Diffuse ISM | 5.0 | 0.3 | 0.1 | 0.8 |
| 15.0 | 16.0 | 7.0 | 21.4 | |
| 30.0 | 65.7 | 45.1 | 80.8 | |
| 60.0 | 98.9 | 46.1 | 100 | |
| Stars | 5.0 | 90.2 | 82.5 | 100 |
| 15.0 | 50.4 | 21.0 | 95.1 | |
| 30.0 | 20.3 | 3.7 | 46.6 | |
| 60.0 | 0.9 | 0.1 | 2.2 |
5.9 M 87
Although every source in our sample has a radio jet and a couple have large scale optical jets, M 87 is the only source in which the red power-law synchrotron spectrum of the inner jet provides a significant contribution to the IR flux. This power law has a best-fit index of (recall that we use the convention) which is consistent with the optical spectral indices of Perlman et al. (2001) found for inter-knot regions of the inner jet. The model with a “forced” torus component, shown in Figure 36, actually has a marginally lower BIC (392.0) than the otherwise “best” fit (398.7), shown in Figure 35, but this must be a fitting artifact as it contributes no flux. This lack of a torus and strong power law spectrum is consistent with findings by Whysong & Antonucci (2004), previously mentioned in Section 1.2, that M 87 is weak in IR and that its nuclear IR emission is consistent with a synchrotron spectrum from the base of its jet. Similarly, the absence of a torus is consistent with the upper limits on MIR thermal emission established by Perlman et al. (2007).

| Component | Wavelength | Best fit | Minimum | Maximum |
|---|---|---|---|---|
| (m) | (%) | (%) | (%) | |
| Diffuse ISM | 5.0 | 0.0 | 0.0 | 0.4 |
| 15.0 | 1.3 | 0.0 | 8.2 | |
| 30.0 | 4.5 | 0.0 | 45.1 | |
| 60.0 | 26.1 | 0.0 | 89.5 | |
| Stars | 5.0 | 90.3 | 41.5 | 98.4 |
| 15.0 | 65.1 | 12.8 | 84.2 | |
| 30.0 | 36.4 | 7.2 | 46.5 | |
| 60.0 | 8.1 | 1.6 | 10.0 |

| Component | Wavelength | Best fit | Minimum | Maximum |
|---|---|---|---|---|
| (m) | (%) | (%) | (%) | |
| Torus | 5.0 | 0.0 | 0.0 | 1.0 |
| 15.0 | 0.0 | 0.0 | 5.7 | |
| 30.0 | 0.2 | 0.0 | 31.8 | |
| 60.0 | 0.4 | 0.0 | 46.2 | |
| Diffuse ISM | 5.0 | 0.0 | 0.0 | 0.4 |
| 15.0 | 0.9 | 0.6 | 7.4 | |
| 30.0 | 3.2 | 2.0 | 23.4 | |
| 60.0 | 7.3 | 4.2 | 25.6 | |
| Stars | 5.0 | 89.0 | 63.0 | 100 |
| 15.0 | 64.4 | 37.8 | 83.3 | |
| 30.0 | 36.7 | 19.9 | 47.0 | |
| 60.0 | 10.3 | 4.8 | 12.9 |
5.10 NGC 7052
The model of NGC 7052 with the lowest BIC and the model with a forced torus have very similar goodness-of-fit with the best fit having a BIC of 425.7 and the forced-torus fit having a BIC of 429.8. However, inspection of the forced torus fit shows that it is unusually cold for a circumnuclear torus. Indeed, HST images of NGC 7052 by Verdoes Kleijn et al. (1999) show a promising candidate for such a cold thermal source in the form of a kpc-scale dust disk which crosses the core region just off to the side of our line-of-sight into the nucleus. Overall, we conclude that a warm thermal component, such as a torus, is unnecessary to explain the IRS flux.
| Component | Wavelength | Best fit | Minimum | Maximum |
| (m) | (%) | (%) | (%) | |
| Diffuse ISM | 5.0 | 5.3 | 4.3 | 5.7 |
| 15.0 | 90.8 | 79.3 | 92.6 | |
| 30.0 | 99.6 | 92.4 | 100 | |
| 60.0 | 100.0 | 50.8 | 100 | |
| Stars | 5.0 | 94.7 | 77.6 | 100 |
| 15.0 | 9.2 | 8.5 | 21.9 | |
| 30.0 | 0.4 | 0.4 | 3.9 | |
| 60.0 | 0.0 | 0.0 | 0.5 |

| Component | Wavelength | Best fit | Minimum | Maximum |
|---|---|---|---|---|
| (m) | (%) | (%) | (%) | |
| Torus | 5.0 | 3.9 | 0.0 | 9.5 |
| 15.0 | 33.0 | 5.1 | 52.3 | |
| 30.0 | 60.9 | 14.8 | 92.4 | |
| 60.0 | 32.3 | 3.0 | 79.2 | |
| Diffuse ISM | 5.0 | 5.3 | 4.1 | 6.3 |
| 15.0 | 52.4 | 42.5 | 73.6 | |
| 30.0 | 35.8 | 14.6 | 83.8 | |
| 60.0 | 67.2 | 8.9 | 100 | |
| Stars | 5.0 | 90.9 | 87.2 | 100 |
| 15.0 | 14.6 | 7.2 | 26.1 | |
| 30.0 | 3.3 | 0.4 | 4.2 | |
| 60.0 | 0.5 | 0.0 | 0.6 |
5.11 Continuum fitting summary
Some of the stellar age parameters for the best fits, shown in Table 33, are unusually low for the various SFR estimates. This could be explained by those sources having recently quieted after a starburst, indeed Das et al. (2005) claim something similar for NGC 3801, but it seems improbable that so many of such a small sample would be within 2 Gyr of the end of a starburst and NGC 3801 is not one of the sources with these low stellar ages. The fits with a forced torus, shown in Table 34, are better in this regard with only 3C 66B and M 87 having this unusual combination. We do not put much stock in this result because stellar ages are generally poorly constrained by infrared data since young stars are brightest at shorter wavelengths and, as mentioned earlier, the GRASIL stellar population model assumes a single Gyr-long starburst followed by passive evolution which may not be a good approximation in these galaxies. This would likely be clearer with more NIR spectrometry and optical spectroscopy (especially in blue) would help characterize the population of young stars.
| Source | Stellar Age | SFR |
|---|---|---|
| (Gyr) | () | |
| NGC 315 | ||
| 3C 31 | ||
| NGC 541 | ||
| 3C 66B | ||
| NGC 3801 | ||
| NGC 3862 | ||
| 3C 270 | ||
| M 84 | ||
| M 87 | ||
| NGC 7052 |
| Source | Stellar Age | SFR |
|---|---|---|
| (Gyr) | () | |
| 3C 31 | ||
| NGC 541 | ||
| 3C 66B | ||
| NGC 3801 | ||
| NGC 3862 | ||
| 3C 270 | ||
| M 84 | ||
| M 87 | ||
| NGC 7052 |
The diffuse ISM components of the two model sets, the best fit models shown in Table 35 and the forced-torus models shown in Table 36, show lower limits on their interstellar radiation fields, PAH fractions, and ISM luminosities which are generally consistent between the two sets with the exception of M 87 which shows an improbably weak radiation field and significantly higher ISM luminosity in the forced-torus model.
| Source | ISM Luminosity | ||
|---|---|---|---|
| (%) | () | ||
| NGC 315 | |||
| 3C 31 | |||
| NGC 541 | |||
| 3C 66B | |||
| NGC 3801 | |||
| NGC 3862 | |||
| 3C 270 | |||
| M 84 | |||
| M 87 | |||
| NGC 7052 |
| Source | ISM Luminosity | ||
|---|---|---|---|
| (%) | () | ||
| 3C 31 | |||
| NGC 541 | |||
| 3C 66B | |||
| NGC 3801 | |||
| NGC 3862 | |||
| 3C 270 | |||
| M 84 | |||
| M 87 | |||
| NGC 7052 |
The fit parameters for the torus, when present (forced-torus models and NGC 315) are shown in Tables 37 and 38. Of particular interest is the low inclination of NGC 3801, the large half-opening angle and high escape probability of NGC 3801, NGC 3862, and M 84. These are unusual for sources in which we can’t see broad lines from the central engine. The masses of obscuring material in the forced-torus fits to NGC 3801 and M 84 are remarkably small compared to the others with both being . And finally the power law indices of the cloud distributions in the forced-torus models are inconsistent with the silicate line ratios in several sources, especially three previously mentioned in this paragraph: NGC 3801, NGC 3862, and M 84. When considered together these issues suggest that the forced-torus fits to NGC 3801, NGC 3862, and M 84 are inconsistent with independent observations.
| Source | Inclination | |||||
|---|---|---|---|---|---|---|
| (deg) | (deg) | |||||
| NGC 315* | ||||||
| 3C 31 | ||||||
| NGC 541 | ||||||
| 3C 66B | ||||||
| NGC 3801 | ||||||
| NGC 3862 | ||||||
| 3C 270 | ||||||
| M 84 | ||||||
| M 87 | ||||||
| NGC 7052 |
| Half- | Escape | AGN | |||
|---|---|---|---|---|---|
| Source | Opening Angle | Probability | Mass | Radius | Luminosity |
| (deg) | (%) | () | (pc) | () | |
| NGC 315* | |||||
| 3C 31 | |||||
| NGC 541 | |||||
| 3C 66B | |||||
| NGC 3801 | |||||
| NGC 3862 | |||||
| 3C 270 | |||||
| M 84 | |||||
| M 87 | |||||
| NGC 7052 |
Overall, we find no evidence for a warm obscuring torus in six of our ten sources and we find convincing evidence for a torus in one of the ten (NGC 315). We have three more sources in which we find strong evidence for some warm MIR structure but cannot conclude that said structure is consistent with the Nenkova et al. (2002) clumpy torus model. We summarize our conclusions as to the presence or absence of each of our model components for each source in Table 39 and we compare the BIC of the best-fit models to those with a forced torus component in Table 40. The main reason for inconclusive results is the fitting degeneracy between torus, NLR, and hot dust.
| Source | Evidence | Evidence | Evidence | Evidence | Warm |
|---|---|---|---|---|---|
| for torus | for power law | for NLR | for hot dust | Component? | |
| NGC 315 | Y | N | N | N | Y |
| 3C 31 | N | N* | N | N | N |
| NGC 541 | N | N | N | N | N |
| 3C 66B | I | N* | I | I | Y |
| NGC 3801 | N | N | I | N | I |
| NGC 3862 | N | N* | N | N | N |
| 3C 270 | I/Y | N | I/N | N | Y |
| M 84 | I | N | I | I | Y |
| M 87 | N | Y* | N | N | N |
| NGC 7052 | N | N | N | N | N |
| Source | Best fit | Forced torus |
|---|---|---|
| BIC | BIC | |
| NGC 315 | 420.3 | - |
| 3C 31 | 403.5 | 425.7 |
| NGC 541 | 380.5 | 408.7 |
| 3C 66B | 472.3 | 506.8 |
| NGC 3801 | 423.5 | 453.7 |
| NGC 3862 | 391.9 | 420.3 |
| 3C 270 | 410.7 | 424.9 |
| M 84 | 386.9 | 444.4 |
| M 87 | 398.7 | 392.0 |
| NGC 7052 | 425.7 | 429.8 |
6 Discussion
Our results support the existence of a warm dusty structure in NGC 315, 3C 66B, 3C 270, and M 84. Of those, only NGC 315 is clearly consistent a clumpy obscuring torus. One more source, NGC 3801, benefits from the inclusion of a warm component. However, the best fit to the warm component in NGC 3801 is unusually dim relative to the ISM and stellar population compared to the other sources with a warm component.
A few of the sources in which we find no thermal component show significant silicate absorption which may be due to larger-scale dust structures which would be too cool to appear in our continuum spectra. All of the thermal sources produce some silicate emission, as do two non-thermal sources. The silicate emission from non-thermal sources is harder to reconcile, though. Perhaps those sources may be consistent with silicate emission from ADAF models or other non-torus possibilities which we have not explored because modelling those is beyond the scope of this paper.
We find that the thermal MIR excess Leipski et al. (2009) found in 3C 270 is better described by a NLR component. However, due to the bias in which the relative simplicity of the NLR component compared to the torus component biases the BIC against a torus component, this disagreement is quite minor. They also found a MIR excess in other sources in which we find a warm thermal component, 3C 66B and M 84, however they attribute these excesses to other effects, non-thermal emission in 3C 66B and starburst activity in M 84. We rule out a starburst origin for the MIR excess in M 84 because all our estimates of the SFR in M 84 agree that (see Tables 11 and 33). Recall that Wu & Cao (2006) give a star formation rate estimate of for M 84 which is higher than our estimates but is still inconsistent with a starburst. Leipski et al. (2009) found a small MIR excess in 3C 31 as well, which they attribute to star formation. We don’t find any of our thermal model components in 3C 31 but we believe that our star formation rates listed in Tables 11 and 33 are sufficient to be loosely consistent with their results. Thus, the results of Leipski et al. (2009) seem consistent with our detection of a warm thermal component in 3C 270 and M 84 but not 3C 66B and our overall conclusion is similar to theirs despite some different conclusions regarding individual objects. We believe our analysis is more effective at differentiating between MIR thermal than that performed by Leipski et al. (2009) because MCMC is known for its efficiency at exhaustive searches through large and complex parameter spaces (see Sales et al. 2015) but our more specific results rest on the validity of the Nenkova et al. (2008a, b) torus models which are not unique.
Since the luminosity of a given high-ionization line will be dependent on both the degree of ionization and the overall abundance of the element in question (see Spinoglio & Malkan (1992)), we show the line ratio of our fitted luminosities to archival luminosities for each of our sample galaxies in Table 41. This ratio is independent of the oxygen abundance in the line-emitting gas and as such provides a better indication of the ionization state of the gas at the cost of greater sensitivity to reddening than line rations with more similar wavelengths e.g., H. However, most of the ratios for our sample are upper limits because no was detected in those sources. The two FR-I sources in which we detected emission are inconsistent with broad-line radio galaxies and quasars in the Haas et al. (2005) sample and consistent with obscured sources (e.g., Seyfert 2) in the Baum et al. (2010) Seyfert sample.
| Source | 26 m | [O III] reference | ||
|---|---|---|---|---|
| () | ||||
| NGC 315 | Balmaverde et al. (2016) | |||
| 3C 31 | Buttiglione et al. (2010) | |||
| NGC 541 | Constantin et al. (2015) | |||
| 3C 66B | Buttiglione et al. (2010) | |||
| NGC 3801 | Sikora et al. (2013) | |||
| NGC 3862 | Buttiglione et al. (2010) | |||
| 3C 270 | van der Wolk et al. (2010b) | |||
| M 84* | Richings et al. (2011) | |||
| M 87 | Balmaverde et al. (2016) | |||
| NGC 7052 | Baldi & Capetti (2009) |
To put together all our lines of evidence we summarize in Table 42 all our results and those we found in the literature. We note that most sources which show at least one test with an inconclusive or positive result also show inconclusive or positive results on other tests. In particular, all sources which show evidence of a warm component are backed up by at least one additional line of evidence.
| Source | Warm component | Warm component | Broad polarized | High |
| (ours) | (others) | H | [OIV]/[OIII] | |
| NGC 315 | Y | - | Y | N |
| 3C 31 | N | N | Y | Y |
| NGC 541 | N | - | N | N |
| 3C 66B | Y | I | Y | N |
| NGC 3801 | I | - | N | N |
| NGC 3862 | N | N | N | N |
| 3C 270 | Y | Y | I | N |
| M 84 | Y | Y | N | Y |
| M 87 | N | N | N | N |
| NGC 7052 | N | - | N | N |
Recall the suggestion by Elitzur & Shlosman (2006) that hydromagnetic disk winds off sources with bolometric luminosities could not sustain a clumpy obscuring torus. In the torus model parameters continuum fits with a forced torus component, shown in Table 38, NGC 315, NGC 3862, and NGC 7052 have best-fit AGN luminosities and 3C 31, 3C 66B, and 3C 270 come in just under that at . If Elitzur & Shlosman (2006) are correct, this suggests that the other four sources which all have bolometric luminosities significantly below , including M 84 which we previously considered inconclusive, are not likely to host a clumpy AGN-wind-driven torus. Note, however, that this does not necessarily prohibit other obscuring structures.
Buttiglione et al. (2010) proposed various line ratios with which to distinguish between low-excitation and high-excitation sources. The measure with the clearest distinction betwen the two populations was the Excitation Index (EI), defined as
| (9) |
For low-excitation sources and for high excitation sources . Hu et al. (2016) calculated excitation indices for the 3C catalog using line fluxes measured by Buttiglione et al. (2009) and we include those 3C sources which are also in our sample in Table 43 and find that all but NGC 315 and NGC 541 are low-excitation sources. We classify those remaining two as extremely low excitation radio galaxies (ELERGs) based on their unusually low of 0.57 and 0.67, respectively, which is consistent with the indicative of extremely low-excitation sources. Capetti et al. (2011) describe extremely low-excitation galaxies as “radio relics” i.e., sources which recently experienced a drop in nuclear activity — perhaps this is the case in NGC 315 and NGC 541. We see no issues with this interpretation for NGC 541 but NGC 315 shows a warm thermal MIR component. This warm thermal component in NGC 315 is well fit by a clumpy torus, and is thus indicative of a high-excitation galaxy, yet its optical emission line ratios are those of an extremely low-excitation galaxy. We hypothesize that the warm dust cooling is occurring on a longer time-scale than [OIII] recombination, perhaps because the warm dust structure is much larger than the emission-line nucleus.
| Source | EI | Class | |||||
|---|---|---|---|---|---|---|---|
| NGC 315* | 4.19 | 4.80 | 7.70 | 2.12 | 2.46 | -0.154 | ELERG |
| 3C 31 | 6.76 | 1.01 | 6.69 | 4.66 | 0.946 | 0.797 | LERG |
| NGC 541 | 4.58 | 1.32 | 2.97 | 0.57 | 1.10 | -0.484 | ELERG |
| 3C 66B | 12.88 | 1.54 | 31.16 | 7.21 | 3.35 | 0.746 | LERG |
| NGC 3801 | 0.98 | 0.06 | 0.96 | 0.57 | 0.17 | 0.721 | LERG |
| NGC 3862 | 4.79 | 1.29 | 6.94 | 3.16 | 1.05 | 0.313 | LERG |
| 3C 270† | 0.14 | 0.10 | 0.07 | 0.048 | LERG | ||
| M 84 | 0.83 | 0.08 | 1.06 | 0.72 | 0.19 | 0.478 | LERG |
| M 87 | 3.16 | 0.54 | 7.34 | 4.58 | 1.14 | 0.233 | LERG |
| NGC 7052 | 7.62 | 1.65 | 8.86 | 3.62 | 0.93 | 0.612 | LERG |
We compare our continuum fitting results to radio luminosity density , estimated black hole mass , Eddington luminosity , and core-extended brightness ratio in Table 44. is a indicator for AGN orientation based on relativistic beaming of the radio jet (Orr & Browne, 1982; Zirbel & Baum, 1995). The presence or absence of a MIR thermal component appears to be independent of , as well as redshift but there may be some dependence on black hole mass. No source in the sample with an estimated black hole mass below has a MIR thermal component and only two sources (3C 31 and M 87) without a MIR thermal component have black hole masses above that. However, this should be viewed with caution due to the small sample size.
| Source | ||||
| NGC 315 | 1.26 | 14.6 | 1.84 | -0.39 |
| 3C 66B | 8.71 | 18.6 | 2.34 | -1.29 |
| M 84 | 0.224 | 7.30 | 0.920 | -1.18 |
| 3C 270 | 2.51 | 7.75 | 0.976 | -1.44 |
| 3C 31 | 3.24 | 9.24 | 1.16 | -1.34 |
| NGC 541 | 0.871 | 2.03 | 0.226 | - |
| NGC 3801 | 0.309 | 1.53 | 0.193 | - |
| NGC 3862 | 5.62 | 4.66 | 0.587 | -1.00 |
| M 87 | 7.94 | 22.5 | 2.84 | -1.24 |
| NGC 7052 | 0.110 | 3.62 | 0.456 | -0.22 |
We also compare the best-fit AGN bolometric luminosity output by the forced-torus clumpyDREAM runs (and NGC 315, see Table 38) to bolometric luminosity estimates based on archival luminosities (see Table 41) using a calibration of
| (10) |
by Heckman et al. (2004). This calibration was developed for type 1 AGN so is likely to be underestimated in type 2 AGN due to extinction by dust. We show the comparison in Table 45 and note we only find in NGC 315. Even considering the large uncertainties on the bolometric luminosity estimate from [O III] emission only NGC 315, NGC 3801, and NGC 3862 are consistent with assuming the Heckman et al. (2004) calibration holds. This is consistent with our finding that NGC 315 has the best fit of a clumpy torus to its continuum infrared spectral energy distribution. All sources except NGC 315 have lower emission in the IR than would be expected given their [O III] luminosity. This is consistent with a lack of dusty circumnuclear gas in these LERG FR-Is. Dicken et al. (2010) note that low-redshift broad-line radio galaxies show enhanced [O III] emission and warmer mid- and far-infrared colors than narrow-line radio galaxies at similar redshift but that compares broad-line objects to hidden broad-line objects and therefore says little about narrow-line objects without a hidden broad-line region.
| Source | ||||
|---|---|---|---|---|
| () | ||||
| NGC 315* | ||||
| 3C 31 | ||||
| NGC 541 | ||||
| 3C 66B | ||||
| NGC 3801 | ||||
| NGC 3862 | ||||
| 3C 270 | ||||
| M 84 | ||||
| M 87 | ||||
| NGC 7052 |
In Table 46 we show estimates of the Eddington ration using black hole mass estimates by Noel-Storr et al. (2007) and our two bolometric luminosity estimates. All of these sources are extremely sub-Eddington with ratios of . We do not see a clear distinction between sources with warm thermal components in their best clumpyDREAM fits and those without. This suggests that Eddington ratio is not the driving factor separating the two modes.
| Source | ||
|---|---|---|
| NGC 315 | ||
| 3C 31 | ||
| NGC 541 | ||
| 3C 66B | ||
| NGC 3801 | ||
| NGC 3862 | ||
| 3C 270 | ||
| M 84 | ||
| M 87 | ||
| NGC 7052 |
7 Conclusion
We used fitting codes based on MCMC algorithms to examine the IR spectra, primarily from Spitzer/IRS, of ten nearby FR-I radio galaxies (NGC 315, 3C 31, NGC 541, 3C 66B, NGC 3801, NGC 3862, 3C 270, M 84, M 87, and NGC 7052) in order to determine whether there is significant contribution in the MIR from warm dust. This dust would serve to obscure the central engine and thus explain why AGN with high radio luminosities can resemble quiescent galaxies in optical wavelengths. The leading alternative model for a FR-I is powered by a ADAF which puts the vast majority of its output power into a radio jet.
We see evidence for the IR signature of a warm dusty structure in only four of these ten LERGs. The fact that we do not see evidence for a clumpy torus in six of the LERGs suggests that not only is the central engine different at these low luminosities (e.g., an ADAF), but the circumnuclear absorbing material is also different than in high excitation sources. This difference in nuclear environment is consistent with previous results obtained using different methods (e.g., Capetti et al. 2005; Leipski et al. 2009; van der Wolk et al. 2010a). All sources except NGC 315 have lower emission in the IR than would be expected given the observed [O III] luminosity using the calibration of Heckman et al. (2004). This is also consistent with a lack of dusty circumnuclear gas. The accretion rates onto the central black holes in LERGs are thought to be much less that those in the high excitation sources (e.g., Baum et al. (1995); Hardcastle et al. (2009); Buttiglione et al. (2010); Best & Heckman (2012)). The difference in circumnuclear environment is thought to be related to the much lower accretion rates in the LERGs. Our Eddington ratio estimates do not support this as they are all quite low including the one in which we find evidence of an obscuring torus and all the ones where we found some thermal component.
However, four of the LERGs (NGC 315, 3C 66B, 3C 270, and M 84) have infrared spectral energy distributions consistent with the presence of a significant amount of warm dust (one of which is consistent with a Nenkova et al. (2008a, b) clumpy torus), and three of the four (NGC 315, 3C 66B, 3C 270) show evidence for polarized H emission consistent with a hidden Type 1 nucleus. This is puzzling. Perhaps these are objects in transition, possibly with either growing or declining accretion rate or possibly in a semi-stable intermediate state in a more complex transition. In any case, this suggests that the central engines in LERGs are not yet understood and further work is needed.
Appendix A Acknowledgements
This research has made use of the NASA/IPAC Extragalactic Database (NED), which is operated by the Jet Propulsion Laboratory, California Institute of Technology, under contract with the National Aeronautics and Space Administration.
SB and CO acknowledge support from the Natural Sciences and Engineering Research Council of Canada (NSERC) grant 318679-352700-2000.
This work is based in part on observations made with the Spitzer Space Telescope, which is operated by the Jet Propulsion Laboratory, California Institute of Technology under a contract with NASA.
SPIRE has been developed by a consortium of institutes led by Cardiff University (UK) and including Univ. Lethbridge (Canada); NAOC (China); CEA, LAM (France); IFSI, Univ. Padua (Italy); IAC (Spain); Stockholm Observatory (Sweden); Imperial College London, RAL, UCL-MSSL, UKATC, Univ. Sussex (UK); and Caltech, JPL, NHSC, Univ. Colorado (USA). This development has been supported by national funding agencies: CSA (Canada); NAOC (China); CEA, CNES, CNRS (France); ASI (Italy); MCINN (Spain); SNSB (Sweden); STFC, UKSA (UK); and NASA (USA).
Herschel is an ESA space observatory with science instruments provided by European-led Principal Investigator consortia and with important participation from NASA.
References
- Anderson & Ulvestad (2005) Anderson, J. M., & Ulvestad, J. S. 2005, ApJ, 627, 674
- Antonucci (1993) Antonucci, R. 1993, ARA&A, 31, 473
- Antonucci (2012) —. 2012, Astronomical and Astrophysical Transactions, 27, 557
- Astropy Collaboration et al. (2013) Astropy Collaboration, Robitaille, T. P., Tollerud, E. J., et al. 2013, A&A, 558, A33
- Baes et al. (2010) Baes, M., Clemens, M., Xilouris, E. M., et al. 2010, A&A, 518, L53
- Baldi & Capetti (2009) Baldi, R. D., & Capetti, A. 2009, A&A, 508, 603
- Balmaverde et al. (2016) Balmaverde, B., Capetti, A., Moisio, D., Baldi, R. D., & Marconi, A. 2016, A&A, 586, A48
- Barth et al. (1999) Barth, A. J., Filippenko, A. V., & Moran, E. C. 1999, ApJ, 525, 673
- Baum et al. (1995) Baum, S. A., Zirbel, E. L., & O’Dea, C. P. 1995, ApJ, 451, 88
- Baum et al. (2010) Baum, S. A., Gallimore, J. F., O’Dea, C. P., et al. 2010, ApJ, 710, 289
- Best & Heckman (2012) Best, P. N., & Heckman, T. M. 2012, MNRAS, 421, 1569
- Bianchi et al. (2019) Bianchi, S., Antonucci, R., Capetti, A., et al. 2019, MNRAS, 488, L1
- Blanton et al. (2017) Blanton, M. R., Bershady, M. A., Abolfathi, B., et al. 2017, AJ, 154, 28
- Bogdán et al. (2011) Bogdán, Á., Kraft, R. P., Forman, W. R., et al. 2011, ApJ, 743, 59
- Bridle & Vallee (1981) Bridle, A. H., & Vallee, J. P. 1981, AJ, 86, 1165
- Butcher et al. (1980) Butcher, H. R., van Breugel, W., & Miley, G. K. 1980, ApJ, 235, 749
- Buttiglione et al. (2009) Buttiglione, S., Capetti, A., Celotti, A., et al. 2009, A&A, 495, 1033
- Buttiglione et al. (2010) —. 2010, A&A, 509, A6
- Capetti et al. (2005) Capetti, A., Verdoes Kleijn, G., & Chiaberge, M. 2005, A&A, 439, 935
- Capetti et al. (2011) Capetti, A., Buttiglione, S., Axon, D. J., et al. 2011, A&A, 527, L2
- Chiaberge et al. (1999) Chiaberge, M., Capetti, A., & Celotti, A. 1999, A&A, 349, 77
- Cid Fernandes et al. (2004) Cid Fernandes, R., González Delgado, R. M., Schmitt, H., et al. 2004, ApJ, 605, 105
- Condon & Broderick (1985) Condon, J. J., & Broderick, J. J. 1985, AJ, 90, 2540
- Condon & Broderick (1986) —. 1986, AJ, 91, 1051
- Condon & Broderick (1988) —. 1988, AJ, 96, 30
- Constantin et al. (2015) Constantin, A., Shields, J. C., Ho, L. C., et al. 2015, ApJ, 814, 149
- Crane et al. (1993) Crane, P., Peletier, R., Baxter, D., et al. 1993, ApJ, 402, L37
- Croston et al. (2003) Croston, J. H., Birkinshaw, M., Conway, E., & Davies, R. L. 2003, MNRAS, 339, 82
- Cutri et al. (2003) Cutri, R. M., Skrutskie, M. F., van Dyk, S., et al. 2003, 2MASS All Sky Catalog of point sources.
- Das et al. (2005) Das, M., Vogel, S. N., Verdoes Kleijn, G. A., O’Dea, C. P., & Baum, S. A. 2005, ApJ, 629, 757
- Dicken et al. (2010) Dicken, D., Tadhunter, C., Axon, D., et al. 2010, ApJ, 722, 1333
- Donahue et al. (2011) Donahue, M., de Messières, G. E., O’Connell, R. W., et al. 2011, ApJ, 732, 40
- Draine & Li (2007) Draine, B. T., & Li, A. 2007, ApJ, 657, 810
- Elitzur & Shlosman (2006) Elitzur, M., & Shlosman, I. 2006, ApJ, 648, L101
- Fanaroff & Riley (1974) Fanaroff, B. L., & Riley, J. M. 1974, MNRAS, 167, 31P
- Farrah et al. (2007) Farrah, D., Bernard-Salas, J., Spoon, H. W. W., et al. 2007, ApJ, 667, 149
- Fazio et al. (2004) Fazio, G. G., Hora, J. L., Allen, L. E., et al. 2004, ApJS, 154, 10
- Fischera et al. (2003) Fischera, J., Dopita, M. A., & Sutherland, R. S. 2003, ApJ, 599, L21
- French & Miller (1980) French, H. B., & Miller, J. S. 1980, PASP, 92, 753
- Frogel et al. (1978) Frogel, J. A., Persson, S. E., Matthews, K., & Aaronson, M. 1978, ApJ, 220, 75
- Gallimore et al. (2010) Gallimore, J. F., Yzaguirre, A., Jakoboski, J., et al. 2010, ApJS, 187, 172
- Genzel & Cesarsky (2000) Genzel, R., & Cesarsky, C. J. 2000, ARA&A, 38, 761
- González-Martín et al. (2015) González-Martín, O., Masegosa, J., Márquez, I., et al. 2015, A&A, 578, A74
- Granato & Danese (1994) Granato, G. L., & Danese, L. 1994, MNRAS, 268, 235
- Granato et al. (1997) Granato, G. L., Danese, L., & Franceschini, A. 1997, ApJ, 486, 147
- Gu et al. (2007) Gu, Q.-S., Huang, J.-S., Wilson, G., & Fazio, G. G. 2007, ApJ, 671, L105
- Haas et al. (2005) Haas, M., Siebenmorgen, R., Schulz, B., Krügel, E., & Chini, R. 2005, A&A, 442, L39
- Haas et al. (2004) Haas, M., Müller, S. A. H., Bertoldi, F., et al. 2004, A&A, 424, 531
- Hardcastle et al. (1996) Hardcastle, M. J., Alexander, P., Pooley, G. G., & Riley, J. M. 1996, MNRAS, 278, 273
- Hardcastle et al. (2009) Hardcastle, M. J., Evans, D. A., & Croston, J. H. 2009, MNRAS, 396, 1929
- Heckman et al. (2004) Heckman, T. M., Kauffmann, G., Brinchmann, J., et al. 2004, ApJ, 613, 109
- Heesen et al. (2014) Heesen, V., Croston, J. H., Harwood, J. J., Hardcastle, M. J., & Hota, A. 2014, MNRAS, 439, 1364
- Ho & Keto (2007) Ho, L. C., & Keto, E. 2007, ApJ, 658, 314
- Hota et al. (2012) Hota, A., Rey, S.-C., Kang, Y., et al. 2012, MNRAS, 422, L38
- Hu et al. (2016) Hu, J.-F., Cao, X.-W., Chen, L., & You, B. 2016, Research in Astronomy and Astrophysics, 16, 136
- Jaffe et al. (1993) Jaffe, W., Ford, H. C., Ferrarese, L., van den Bosch, F., & O’Connell, R. W. 1993, Nature, 364, 213
- Jensen et al. (2017) Jensen, J. J., Hönig, S. F., Rakshit, S., et al. 2017, ArXiv e-prints, arXiv:1706.04811
- Kennicutt (1998) Kennicutt, Robert C., J. 1998, ARA&A, 36, 189
- Kessler et al. (1996) Kessler, M. F., Steinz, J. A., Anderegg, M. E., et al. 1996, A&A, 500, 493
- Kharb et al. (2012) Kharb, P., O’Dea, C. P., Tilak, A., et al. 2012, ApJ, 754, 1
- Kharb & Shastri (2004) Kharb, P., & Shastri, P. 2004, A&A, 425, 825
- Kleijn et al. (2002) Kleijn, G. A. V., Baum, S. A., de Zeeuw, P. T., & O’Dea, C. P. 2002, The Astronomical Journal, 123, 1334
- Kolokythas et al. (2015) Kolokythas, K., O’Sullivan, E., Giacintucci, S., et al. 2015, MNRAS, 450, 1732
- Laing & Bridle (1987) Laing, R. A., & Bridle, A. H. 1987, MNRAS, 228, 557
- Laing et al. (2008) Laing, R. A., Bridle, A. H., Cotton, W. D., Worrall, D. M., & Birkinshaw, M. 2008, Astronomical Society of the Pacific Conference Series, Vol. 386, Jet Spectra in FRI Radio Galaxies: Implications for Particle Acceleration, ed. T. A. Rector & D. S. De Young, 110
- Laing et al. (1983) Laing, R. A., Riley, J. M., & Longair, M. S. 1983, MNRAS, 204, 151
- Lanz et al. (2011) Lanz, L., Bliss, A., Kraft, R. P., et al. 2011, ApJ, 731, 52
- Lebouteiller et al. (2011) Lebouteiller, V., Barry, D. J., Spoon, H. W. W., et al. 2011, ApJS, 196, 8
- Leipski et al. (2009) Leipski, C., Antonucci, R., Ogle, P., & Whysong, D. 2009, ApJ, 701, 891
- Lilly et al. (1985) Lilly, S. J., Longair, M. S., & Miller, L. 1985, MNRAS, 214, 109
- Mack et al. (1997) Mack, K. H., Klein, U., O’Dea, C. P., & Willis, A. G. 1997, A&AS, 123, 423
- Makovoz & Marleau (2005) Makovoz, D., & Marleau, F. R. 2005, PASP, 117, 1113
- Marton et al. (2016) Marton, G., Schulz, B., Altieri, B., et al. 2016, in IAU Symposium, Vol. 315, From Interstellar Clouds to Star-Forming Galaxies: Universal Processes?, ed. P. Jablonka, P. André, & F. van der Tak, E53
- Merritt & Ferrarese (2001) Merritt, D., & Ferrarese, L. 2001, ApJ, 547, 140
- Metropolis et al. (1953) Metropolis, N., Rosenbluth, A. W., Rosenbluth, M. N., Teller, A. H., & Teller, E. 1953, J. Chem. Phys., 21, 1087
- Mor et al. (2009) Mor, R., Netzer, H., & Elitzur, M. 2009, ApJ, 705, 298
- Morganti et al. (1987) Morganti, R., Fanti, C., Fanti, R., Parma, P., & de Ruiter, H. R. 1987, A&A, 183, 203
- Narayan et al. (1998) Narayan, R., Mahadevan, R., & Quataert, E. 1998, in Theory of Black Hole Accretion Disks, ed. M. A. Abramowicz, G. Björnsson, & J. E. Pringle, 148–182
- Nenkova et al. (1999) Nenkova, M., Ivezic, Z., & Elitzur, M. 1999, in LPI Contributions, Vol. 969, Thermal Emission Spectroscopy and Analysis of Dust, Disks, and Regoliths, ed. A. Sprague, D. K. Lynch, & M. Sitko, 20
- Nenkova et al. (2002) Nenkova, M., Ivezić, Ž., & Elitzur, M. 2002, ApJ, 570, L9
- Nenkova et al. (2008a) Nenkova, M., Sirocky, M. M., Ivezić, Ž., & Elitzur, M. 2008a, ApJ, 685, 147
- Nenkova et al. (2008b) Nenkova, M., Sirocky, M. M., Nikutta, R., Ivezić, Ž., & Elitzur, M. 2008b, ApJ, 685, 160
- Nilson (1973) Nilson, P. 1973, Uppsala general catalogue of galaxies
- Noel-Storr et al. (2007) Noel-Storr, J., Baum, S. A., & O’Dea, C. P. 2007, ApJ, 663, 71
- Noel-Storr et al. (2003) Noel-Storr, J., Baum, S. A., Verdoes Kleijn, G., et al. 2003, ApJS, 148, 419
- Orr & Browne (1982) Orr, M. J. L., & Browne, I. W. A. 1982, MNRAS, 200, 1067
- Owen et al. (2000) Owen, F. N., Eilek, J. A., & Kassim, N. E. 2000, ApJ, 543, 611
- Padovani et al. (2017) Padovani, P., Alexander, D. M., Assef, R. J., et al. 2017, A&A Rev., 25, 2
- Perlman et al. (2001) Perlman, E. S., Biretta, J. A., Sparks, W. B., Macchetto, F. D., & Leahy, J. P. 2001, ApJ, 551, 206
- Perlman et al. (2007) Perlman, E. S., Mason, R. E., Packham, C., et al. 2007, ApJ, 663, 808
- Pier & Krolik (1992) Pier, E. A., & Krolik, J. H. 1992, ApJ, 401, 99
- Pier & Krolik (1993) —. 1993, ApJ, 418, 673
- Richings et al. (2011) Richings, A. J., Uttley, P., & Körding, E. 2011, MNRAS, 415, 2158
- Roussel et al. (2001) Roussel, H., Sauvage, M., Vigroux, L., & Bosma, A. 2001, A&A, 372, 427
- Rowan-Robinson (1995) Rowan-Robinson, M. 1995, MNRAS, 272, 737
- Sales et al. (2015) Sales, D. A., Robinson, A., Axon, D. J., et al. 2015, ApJ, 799, 25
- Schartmann et al. (2005) Schartmann, M., Meisenheimer, K., Camenzind, M., Wolf, S., & Henning, T. 2005, A&A, 437, 861
- Schwarz (1978) Schwarz, G. 1978, Ann. Statist., 6, 461
- Shi et al. (2007) Shi, Y., Rieke, G. H., Hines, D. C., Gordon, K. D., & Egami, E. 2007, ApJ, 655, 781
- Sikora et al. (2013) Sikora, M., Stasińska, G., Kozieł-Wierzbowska, D., Madejski, G. M., & Asari, N. V. 2013, ApJ, 765, 62
- Silva et al. (1998) Silva, L., Granato, G. L., Bressan, A., & Danese, L. 1998, ApJ, 509, 103
- Sirocky et al. (2008) Sirocky, M. M., Levenson, N. A., Elitzur, M., Spoon, H. W. W., & Armus, L. 2008, ApJ, 678, 729
- Skrutskie et al. (2006) Skrutskie, M. F., Cutri, R. M., Stiening, R., et al. 2006, AJ, 131, 1163
- Smith et al. (2007) Smith, J. D. T., Draine, B. T., Dale, D. A., et al. 2007, ApJ, 656, 770
- Spinoglio & Malkan (1992) Spinoglio, L., & Malkan, M. A. 1992, ApJ, 399, 504
- Storn & Price (1997) Storn, R., & Price, K. 1997, Journal of Global Optimization, 11, 341
- Tadhunter (2016) Tadhunter, C. 2016, A&A Rev., 24, 10
- Tansley et al. (2000) Tansley, D., Birkinshaw, M., Hardcastle, M. J., & Worrall, D. M. 2000, MNRAS, 317, 623
- Temi et al. (2009) Temi, P., Brighenti, F., & Mathews, W. G. 2009, ApJ, 707, 890
- Teplitz et al. (2012) Teplitz, H. I., Capak, P., Hanish, D., et al. 2012, in American Astronomical Society Meeting Abstracts, Vol. 219, American Astronomical Society Meeting Abstracts #219, 428.06
- ter Braak & Vrugt (2008) ter Braak, C. J. F., & Vrugt, J. A. 2008, Statistics and Computing, 18, 435
- Torrealba et al. (2012) Torrealba, J., Chavushyan, V., Cruz-González, I., et al. 2012, Rev. Mexicana Astron. Astrofis., 48, 9
- van der Wolk et al. (2010a) van der Wolk, G., Barthel, P. D., Peletier, R. F., & Pel, J. W. 2010a, A&A, 511, A64
- van der Wolk et al. (2010b) —. 2010b, A&A, 511, A64
- Verdoes Kleijn et al. (1999) Verdoes Kleijn, G. A., Baum, S. A., de Zeeuw, P. T., & O’Dea, C. P. 1999, AJ, 118, 2592
- Verdoes Kleijn & de Zeeuw (2005) Verdoes Kleijn, G. A., & de Zeeuw, P. T. 2005, A&A, 435, 43
- Werner et al. (2004) Werner, M. W., Roellig, T. L., Low, F. J., et al. 2004, ApJS, 154, 1
- Whysong & Antonucci (2004) Whysong, D., & Antonucci, R. 2004, ApJ, 602, 116
- Willett et al. (2010) Willett, K. W., Stocke, J. T., Darling, J., & Perlman, E. S. 2010, ApJ, 713, 1393
- Wu & Cao (2006) Wu, Q., & Cao, X. 2006, PASP, 118, 1098
- Xu et al. (1999) Xu, C., Livio, M., & Baum, S. 1999, AJ, 118, 1169
- Zirbel & Baum (1995) Zirbel, E. L., & Baum, S. A. 1995, ApJ, 448, 521