Rydberg electromagnetically induced transparency based laser lock to Zeeman sublevels with 0.6 GHz scanning range
Abstract
We propose a technique for frequency locking a laser to the Zeeman sublevel transitions between the intermediate and Rydberg states in . This method allows for continuous frequency tuning over 0.6 GHz by varying an applied external magnetic field. In the presence of the applied field, the electromagnetically induced transparency (EIT) spectrum of an atomic vapor splits via the Zeeman effect according to the strength of the magnetic field and the polarization of the pump and probe lasers. We show that the 480 nm pump laser, responsible for transitions between the Zeeman sublevels of the intermediate state and the Rydberg state, can be locked to the Zeeman-split EIT peaks. The short-term frequency stability of the laser lock is 0.15 MHz and the long-term stability is within 0.5 MHz. The linewidth of the laser lock is 0.8 MHz and 1.8 MHz in the presence and in the absence of the external magnetic field, respectively. In addition, we show that in the absence of an applied magnetic field and adequate shielding, the frequency shift of the lock point has a peak-to-peak variation of 1.6 MHz depending on the polarization of the pump field, while when locked to Zeeman sublevels this variation is reduced to 0.6 MHz. The proposed technique is useful for research involving Rydberg atoms, where large continuous tuning of the laser frequency with stable locking is required.
I Introduction
Many present-day atomic, molecular or precision spectroscopy experiments require a frequency-stabilized laser source, engineered to some extent via the frequency and the linewidth to address a particular atomic or molecular transition[1, 2, 3]. Frequently, optical absorption [4], optical cavities[5, 2], or frequency combs[6] are used as a frequency reference to stabilize the laser. Some of the most common techniques for frequency locking include saturated absorption spectroscopy (SAS) [7], Pound-Drever-Hall (PDH) locking [8], modulation transfer spectroscopy (MTS) [9], fluorescence spectroscopy [10], and dichroic atomic vapor laser locking (DAVLL) [11]. Another technique, electromagnetically induced transparency (EIT) locking [12, 13, 14, 15], can be exploited to lock the relative frequency of two or more lasers. This method is useful if one needs to access a narrow transition when a direct absorption signal is not feasible, for example, in the excitation of neutral atoms to Rydberg states [16, 17, 18, 19, 20, 21, 22]. The particular interest in Rydberg atoms lies in their potential as a platform for quantum computation [23, 24, 25, 26], quantum simulation [27, 28], and quantum repeater [29] technologies, due to their particular properties, such as the long lifetime of Rydberg states, strong dipole-dipole interactions, and the Rydberg blockade phenomenon [30, 31, 32, 33]. In most related experiments, reliable laser locking and frequency scanning techniques are needed to precisely control optical transitions to the Rydberg states, as well as between Zeeman sublevels for the purpose of state preparation.
Some experiments require trapped Rydberg atoms and most demonstrated traps rely on a magnetic potential [34, 35, 36], the shape and depth of which strongly depends on the quantum number, where represents the Zeeman sublevels, each requiring a different transition wavelength. Hence, having control over Rydberg-state Zeeman sublevels, and, therefore, any associated magnetic potential, requires a reference transition frequency for each of the sublevels. Rydberg atoms are also viewed as excellent tools for microwave sensing applications [37, 38, 39, 40] due to their high sensitivity to electric fields. Controlling the microwave frequency detection range necessitates managing the optical transitions to Rydberg states as well as the separation between different Rydberg states or the various Zeeman sublevels within a particular Rydberg state [41].
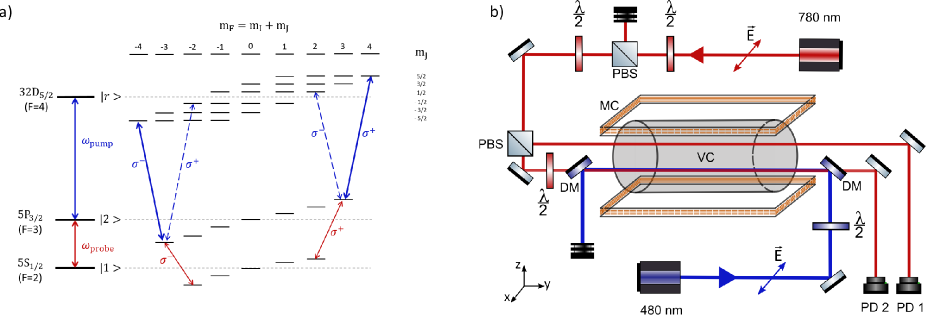
In this work, we demonstrated laser locking to Zeeman sublevel EIT peaks in a three-level, cascaded Rydberg system, in the presence of an applied magnetic field (see Fig. 1(a)), in a manner analogous to the work by Bao et al. [42] for Cs atoms. Our method allowed us to continuously shift the frequency of the 480 nm pump laser () by up to by up to 300 MHz either side of the locking position with zero applied magnetic field. We also demonstrated that, when the Earth’s and stray magnetic fields were not shielded from the system, the reference, single-peak, EIT signal experienced a frequency shift due to the difference in the energy shift between two neighboring states. The nondegenerate Zeeman sublevels were indistinguishable on the observed EIT signal. However, depending on the polarization of the 480 nm pump, the locking position shifted according to the most dominant transition. This introduced a frequency uncertainty of 1.6 MHz between the extreme locking points which could be detrimental for spectroscopy or precision measurement experiments.
II Experimental setup
The experimental setup is shown in Fig. 1(b). We used a room-temperature -enriched vapor cell (TT-RB87-75-V-P, TRIAD Technology Inc.) of diameter mm and length mm. An applied DC magnetic field was produced along the -axis, transverse to the light beam propagation axis, by a pair of rectangular coils with dimensions and turns connected in series. Each coil was approximately from the center of the cell. The magnetic field was measured at the center of the cell by a gaussmeter (HIRST Magnetic Instruments Ltd., GM08) for currents varying from 2.0 to 6.0 A with 0.1 Gauss precision. The 780 nm laser (DL pro, Toptica), used as the probe in the two-photon EIT scheme (see Fig.1(a)) was locked via SAS to the crossover peak. It was then shifted by 1.0662 GHz using an electro-optic modulator (EOM, NIR-NPX800 LN-10, Photline Technologies) to be resonant with the transition. For the purposes of this work, the EOM was not used to tune the lock, and was driven with a fixed frequency of 1.0662 GHz. The 480 nm pump light was derived from a frequency-doubled, high power 960 nm laser (TA-SHG pro, Toptica). Approximately 1 W of the 960 nm seed light was collected prior to the doubling cavity and was sent via an optical fiber to a wavemeter (HighFinesse Ångstrom WS-6/600) to measure the laser wavelength. Each wavelength measurement was obtained by taking an average of at least 200 values and then converted into frequency for the 480 nm light.
The power of the 780 nm laser was set to 300 W and that of the 480 nm laser was 300 mW. The 780 nm beam was split with a polarizing beam splitter, with one part sent through the vapor cell as a reference and the other counter-propagated with the 480 nm pump through the cell, thereby coupling the ground, intermediate, and Rydberg states. In the presence of the applied magnetic field, the Zeeman sublevels were nondegenerate and are shown as for the ground and intermediate states, and as for the Rydberg state (see Fig.1(a)). A waveplate in the beam of the 480 nm laser controlled its polarization to satisfy the momentum conservation requirement, , for transitions to various levels of the Rydberg state. When the polarization was aligned along the -axis, i.e., orthogonal to the applied magnetic field, the atoms experienced a linear combination of and fields. When the polarization was aligned along the -axis, i.e., parallel to the applied magnetic field, the atoms experienced polarized light. The 780 nm laser light polarization was set orthogonal to the applied magnetic field, optically pumping the atoms to the Zeeman sublevels [18]. The two 780 nm beams were incident on a dual photodetector (Thorlabs PDB210A/M), where the reference, incident on PD1, was subtracted from the probe, incident on PD2, to get the EIT signal. The processed signal from the photodetectors was transmitted to the Toptica Digilock 110 module and monitored using the DigiLock software. As the 480 nm laser frequency was scanned, a spectrum was obtained. When the 480 nm laser was resonant with the Rydberg transition in the absence of the applied magnetic field, a single EIT peak was visible, as shown on the measured spectrum in Fig. 2(a).

III Results

In the initial set of experiments no magnetic field was applied to the system, and the 480 nm laser was locked to the EIT signal recorded from the photodetector, as shown in Fig. 2(a). In this case, the Zeeman shifts from the Earth’s magnetic field and any additional stray magnetic fields were not enough for individual Zeeman levels to be distinguishable. We then rotated the 480 nm waveplate in steps of to change the polarization and recorded the wavelength, which we subsequently converted to frequency values (see Fig. 2(b)). We observed a polarization-dependent frequency shift of the lock position with a peak-to-peak variation of 1.6 MHz. As we adjusted the 480 nm polarization, the dominant Rydberg level also changed according to the angular momentum conservation selection rules for and polarization respectively, , thereby changing the weighting of the transitions that determined the lock point. From these measurements it can be seen that, in an environment with no magnetic shielding and zero applied magnetic field, the locking frequency can vary quite significantly depending on the laser polarization.
We next applied a magnetic field of 26 G to the system using the same laser conditions as before. We observed a splitting of the EIT peak (see Fig. 3(a)) corresponding to the different levels. Depending on the polarization of the 480 nm laser, we observed different combinations of the peaks with different amplitudes. We locked the 480 nm laser to the transition and varied its polarization by rotating the waveplate, see Fig. 3(b). One can see that the relative shift of the locking frequency is within MHz, which is almost three times less than when no magnetic field is applied (Fig. 2(b)). The variation arose from the fact that, when the polarization was changed, the amplitude of the transition peak changed [43]. At the same time, the neighboring transition peak appeared and its tail overlapped with the locking transition peak. This affects the locking frequency. If the scan of the waveplate angle, , were outside the range of 290∘ to 340∘ the EIT peak signal disappeared and the lock was no longer possible. For the specific case where the 480 nm polarization was set such that the atoms experienced a linear combination of and circular polarizations, a suppression of the transitions to the sublevels was observed (see Fig. 3(a)) and the laser could be locked precisely to the transition frequency.

We also used the applied magnetic field to control the 480 nm laser frequency similar to the work by Bao et al. for Cs atoms [42]. By continuously adjusting the applied magnetic field, we could measure the change in the locking frequency of the peak due to the Zeeman shift. The applied magnetic field affected the ground state, the intermediate state, and the Rydberg state energy levels in the following way
| (1) |
where is the Bohr magneton, is the magnetic field amplitude, and , and are the Landé-factors for the Rydberg, the intermediate, and the ground states, respectively. For each transition path the EIT window should appear for a particular pump laser detuning, which depends on the energy shifts of all the three states [43]
| (2) |
where and are the frequencies of the probe and the pump fields, respectively. For the transition the pump field detuning, , is equal to MHz/G. We were able to frequency tune the 480 nm laser by MHz ( MHz) as shown on the Fig. 4(a), when locked to the ( ) peak, see Fig. 4(b). The maximum magnetic field used was 73.1 G when a current of 10 A was driven through the coils.
The frequency stability of the 480 nm laser when locked to the transition was determined by recording its value for 70 minutes, see Fig. 5(a). The frequency separation between the most distant mean frequency values gave an estimation of the long-term laser lock drift. Thence, we plotted a histogram of the frequency drift over a 10-minute recording, see Fig. 5(b). We fitted the histogram with a Gaussian function and extracted the full-width-at-half maximum (FWHM) to estimate the short-term lock stability. The long-term frequency drift was MHz, while the short-term lock stability was MHz, an improvement over that previously reported in the work of Rajasree et al. [15], where the long-term drift was MHz and the short-term stability was MHz. We also characterized the frequency stability by means of Allan variance [44], defined by , where is the time series of the wavemeter frequency measurement spaced by the integration interval . We observed a minimum Allan deviation, , on the order of for an integration time of 7 s, see Fig. 5(c). To address the stability change for different detunings of the 480 nm laser we measured the lock frequency using the wavemeter at two different magnetic field strengths and observed no change in the frequency drift. This could be explained by examining the amplitudes of the photodiode (PD) signal from the Zeeman-split EIT measurement. Once the and peaks become distinguishable in the signal, their amplitudes show minimal variation as the magnetic field is increased, see Fig. 4(b). In addition, we performed a heterodyne measurement by overlapping spatial modes of the target seed laser and a local oscillator via an optical fiber splitter. The local oscillator electric field was provided by a continuous wave (CW) Ti:Sapphire laser (MSquared), locked to a reference cavity yielding a spectral linewidth of 100 kHz. We introduced a frequency difference between the two lasers to observe a beat note signal. By performing a Fourier transform of the signal from the time to the frequency domain, we extracted a combined linewidth. Knowing the estimated linewidth of the local oscillator allowed us to calculate the linewidth of the target laser. When locking was performed in the absence of the external magnetic field, the linewidth was approximately 1.8 MHz. In contrast, applying the external magnetic field for the locking reduced the linewidth to about 0.8 MHz.
The EOM scan technique, reported in the work of Rajasree et al. [15], was limited in range by the Doppler width of the absorption spectrum of where one could still observe the EIT signal. Therefore, the detuning of the probe laser could not exceed 450 MHz, or 0.8 GHz for the 480 nm laser. For the Zeeman level locking technique, the detuning of the probe field, , came from the energy shifts of the ground and intermediate state Zeeman levels and still had to be within the Doppler width. By inserting the Doppler limit of 450 MHz for the maximum probe frequency detuning into the following expression obtained from the eq.1:
| (3) |
we calculated the limit of the external magnetic field to be 324 G. By substituting this magnetic field into eq. 2 we estimated the limit for the pump field frequency detuning to be 1.17 GHz each side of the reference frequency. Hence the range of the scan could be extended to 2.3 GHz, one and half times larger than what was previously reported in the work of Rajasree et al. [15]. However, using the EOM to tune the probe laser frequency to match the Zeeman shift when increasing the magnetic field, ensures that the frequency remains within the Doppler-broadened absorption of the target Zeeman level. This, in principle, allows for arbitrary frequency scanning of the pump laser; however, in large magnetic fields (more than 500 G) the Paschen-Back effect should be considered [45].

IV Conclusion
In conclusion, we have demonstrated a method to directly lock a 480 nm laser to the Zeeman sublevels of a Rydberg state, using the transition as an example. This locking technique allows one to continuously tune the laser frequency over a range from -280 MHz to +280 MHz by controlling the strength of a transverse applied magnetic field. The scanning range could be increased further by increasing the maximum value of the applied magnetic field; however, in this case, care must be taken to avoid the quadratic Zeeman effect as the field gets larger [18]. In the absence of an applied magnetic field, we have shown that the background magnetic fields introduce a polarization-dependent locking uncertainty due to the small Zeeman shift. The described technique is relatively low-cost and is useful for studies with Rydberg atoms where large continuous tuning of the laser frequency is required. The lock stability is comparable to or better than similar locking methods, with a short-term frequency stability of MHz and a long-term frequency drift of MHz recorded. We have also demonstrated that using the Rydberg Zeeman level reduces the lock linewidth by a factor of two. The limit of the 480 nm pump laser scanning range using the Rydberg Zeeman level, while the probe laser is locked to the 5SP3/2 transition, is one and half times larger than that of a single-peak EIT locking scheme. The scanning range could be extended by heating the vapor cell to increase the Doppler width of the absorption spectrum for the 5SP3/2 transition. In addition, the probe laser frequency can be matched with the Zeeman shift of a target laser via an EOM, in which case an arbitrary scanning range of the pump laser should be achievable.
Acknowledgements
This work was supported by funding from the Okinawa Institute of Science and Technology Graduate University. D.J.B. and S.N.C. acknowledge support from the Japan Society for the Promotion of Science (JSPS) Grant-in-Aid No. 22K13986 (Early Career) and No. 24K08289, respectively.
Data Availability Statement
The data is available from the corresponding authors upon reasonable request
References
- Bendkowsky et al. [2009] V. Bendkowsky, B. Butscher, J. Nipper, J. P. Shaffer, R. Löw, and T. Pfau, “Observation of ultralong-range Rydberg molecules,” Nature 458, 1005–1008 (2009).
- Jiang et al. [2011] Y. Jiang, A. Ludlow, N. D. Lemke, R. W. Fox, J. A. Sherman, L.-S. Ma, and C. W. Oates, “Making optical atomic clocks more stable with -level laser stabilization,” Nat. Photonics 5, 158–161 (2011).
- McGrew et al. [2018] W. McGrew, X. Zhang, R. Fasano, S. Schäffer, K. Beloy, D. Nicolodi, R. Brown, N. Hinkley, G. Milani, M. Schioppo, et al., “Atomic clock performance enabling geodesy below the centimetre level,” Nature 564, 87–90 (2018).
- Pearman et al. [2002] C. Pearman, C. Adams, S. Cox, P. Griffin, D. Smith, and I. Hughes, “Polarization spectroscopy of a closed atomic transition: applications to laser frequency locking,” J. Phys. B: At. Mol. Opt. Phys. 35, 5141 (2002).
- Drever et al. [1983] R. W. Drever, J. L. Hall, F. V. Kowalski, J. Hough, G. Ford, A. Munley, and H. Ward, “Laser phase and frequency stabilization using an optical resonator,” Appl. Phys. B 31, 97–105 (1983).
- Picqué and Hänsch [2019] N. Picqué and T. W. Hänsch, “Frequency comb spectroscopy,” Nat. Photonics 13, 146–157 (2019).
- Schmidt et al. [1994] O. Schmidt, K. M. Knaak, R. Wynands, and D. Meschede, “Cesium saturation spectroscopy revisited: How to reverse peaks and observe narrow resonances,” Appl. Phys. B 59, 167–178 (1994).
- Black [2001] E. D. Black, “An introduction to Pound–Drever–Hall laser frequency stabilization,” Am. J. Phys. 69, 79–87 (2001).
- McCarron, King, and Cornish [2008] D. McCarron, S. King, and S. Cornish, “Modulation transfer spectroscopy in atomic rubidium,” Meas. Sci. Technol. 19, 105601 (2008).
- Nieddu et al. [2019] T. Nieddu, T. Ray, K. S. Rajasree, R. Roy, and S. Nic Chormaic, “Simple, narrow, and robust atomic frequency reference at 993 nm exploiting the rubidium (Rb) 5S 1/2 to 6S 1/2 transition using one-color two-photon excitation,” Opt. Express 27, 6528–6535 (2019).
- Corwin et al. [1998] K. L. Corwin, Z.-T. Lu, C. F. Hand, R. J. Epstein, and C. E. Wieman, “Frequency-stabilized diode laser with the Zeeman shift in an atomic vapor,” Appl. Opt. 37, 3295–3298 (1998).
- Boller, Imamoğlu, and Harris [1991] K.-J. Boller, A. Imamoğlu, and S. E. Harris, “Observation of electromagnetically induced transparency,” Phys. Rev. Lett. 66, 2593 (1991).
- Lukin et al. [1998] M. D. Lukin, M. Fleischhauer, M. O. Scully, and V. L. Velichansky, “Intracavity electromagnetically induced transparency,” Opt. Lett. 23, 295–297 (1998).
- Fleischhauer [1999] M. Fleischhauer, “Electromagnetically induced transparency and coherent-state preparation in optically thick media,” Opt. Express 4, 107–112 (1999).
- Rajasree et al. [2021] K. S. Rajasree, K. Karlsson, T. Ray, and S. Nic Chormaic, “1.6 GHz frequency scanning of a 482 nm laser stabilized using electromagnetically induced transparency,” IEEE Photonics Technol. Lett. 33, 780–783 (2021).
- Mohapatra, Jackson, and Adams [2007] A. Mohapatra, T. Jackson, and C. Adams, “Coherent optical detection of highly excited Rydberg states using electromagnetically induced transparency,” Phys. Rev. Lett. 98, 113003–113003 (2007).
- Naber et al. [2017] J. Naber, A. Tauschinsky, B. van Linden van den Heuvell, and R. Spreeuw, “Electromagnetically induced transparency with Rydberg atoms across the Breit-Rabi regime,” SciPost Phys. 2, 015 (2017).
- Zhang et al. [2018] L. Zhang, S. Bao, H. Zhang, G. Raithel, J. Zhao, L. Xiao, and S. Jia, “Interplay between optical pumping and Rydberg EIT in magnetic fields,” Opt. Express 26, 29931–29944 (2018).
- Jia et al. [2020] F. Jia, J. Zhang, L. Zhang, F. Wang, J. Mei, Y. Yu, Z. Zhong, and F. Xie, “Frequency stabilization method for transition to a Rydberg state using Zeeman modulation,” Appl. Opt. 59, 2108–2113 (2020).
- Rajasree et al. [2020] K. S. Rajasree, T. Ray, K. Karlsson, J. L. Everett, and S. Nic Chormaic, “Generation of cold Rydberg atoms at submicron distances from an optical nanofiber,” Phys. Rev. Res. 2, 012038 (2020).
- Su et al. [2022] H.-J. Su, J.-Y. Liou, I.-C. Lin, and Y.-H. Chen, “Optimizing the Rydberg EIT spectrum in a thermal vapor,” Opt. Express 30, 1499–1510 (2022).
- Vylegzhanin et al. [2023] A. Vylegzhanin, D. J. Brown, A. Raj, D. F. Kornovan, J. L. Everett, E. Brion, J. Robert, and S. Nic Chormaic, “Excitation of 87 Rb Rydberg atoms to nS and nD states (n 68) via an optical nanofiber,” Opt. Quantum 1, 6–13 (2023).
- Isenhower et al. [2010] L. Isenhower, E. Urban, X. Zhang, A. Gill, T. Henage, T. A. Johnson, T. Walker, and M. Saffman, “Demonstration of a neutral atom controlled-NOT quantum gate,” Phys. Rev. Lett. 104, 010503 (2010).
- Saffman, Walker, and Mølmer [2010] M. Saffman, T. G. Walker, and K. Mølmer, “Quantum information with Rydberg atoms,” Rev. Mod. Phys. 82, 2313 (2010).
- Adams, Pritchard, and Shaffer [2019] C. S. Adams, J. D. Pritchard, and J. P. Shaffer, “Rydberg atom quantum technologies,” J. Phys. B: At. Mol. Opt. Phys. 53, 012002 (2019).
- Chew et al. [2022] Y. Chew, T. Tomita, T. P. Mahesh, S. Sugawa, S. de Léséleuc, and K. Ohmori, “Ultrafast energy exchange between two single Rydberg atoms on a nanosecond timescale,” Nat. Photonics 16, 724–729 (2022).
- Weimer et al. [2010] H. Weimer, M. Müller, I. Lesanovsky, P. Zoller, and H. P. Büchler, “A Rydberg quantum simulator,” Nat. Phys. 6, 382–388 (2010).
- Bharti et al. [2022] V. Bharti, S. Sugawa, M. Mizoguchi, M. Kunimi, Y. Zhang, S. de Léséleuc, T. Tomita, T. Franz, M. Weidemüller, and K. Ohmori, “Ultrafast many-body dynamics in an ultracold Rydberg-excited atomic Mott insulator,” arXiv preprint arXiv:2201.09590 (2022).
- Zhao et al. [2010] B. Zhao, M. Müller, K. Hammerer, and P. Zoller, “Efficient quantum repeater based on deterministic Rydberg gates,” Phys. Rev. A 81, 052329 (2010).
- Jaksch et al. [2000] D. Jaksch, J. I. Cirac, P. Zoller, S. L. Rolston, R. Côté, and M. D. Lukin, “Fast quantum gates for neutral atoms,” Phys. Rev. Lett 85, 2208 (2000).
- Gaëtan et al. [2009] A. Gaëtan, Y. Miroshnychenko, T. Wilk, A. Chotia, M. Viteau, D. Comparat, P. Pillet, A. Browaeys, and P. Grangier, “Observation of collective excitation of two individual atoms in the Rydberg blockade regime,” Nat. Phys. 5, 115–118 (2009).
- Pritchard et al. [2010] J. D. Pritchard, D. Maxwell, A. Gauguet, K. J. Weatherill, M. Jones, and C. S. Adams, “Cooperative atom-light interaction in a blockaded Rydberg ensemble,” Phys. Rev. Lett. 105, 193603 (2010).
- Petrosyan, Otterbach, and Fleischhauer [2011] D. Petrosyan, J. Otterbach, and M. Fleischhauer, “Electromagnetically induced transparency with Rydberg atoms,” Phys. Rev. Lett. 107, 213601 (2011).
- Choi et al. [2005] J.-H. Choi, J. Guest, A. Povilus, E. Hansis, and G. Raithel, “Magnetic trapping of long-lived cold Rydberg atoms,” Phys. Rev. Lett 95, 243001 (2005).
- Anderson et al. [2013] D. Anderson, A. Schwarzkopf, R. Sapiro, and G. Raithel, “Production and trapping of cold circular Rydberg atoms,” Phys. Rev. A 88, 031401 (2013).
- Hermann-Avigliano et al. [2014] C. Hermann-Avigliano, R. C. Teixeira, T. Nguyen, T. Cantat-Moltrecht, G. Nogues, I. Dotsenko, S. Gleyzes, J. Raimond, S. Haroche, and M. Brune, “Long coherence times for Rydberg qubits on a superconducting atom chip,” Phys. Rev. A 90, 040502 (2014).
- Kumar et al. [2017] S. Kumar, H. Fan, H. Kübler, A. J. Jahangiri, and J. P. Shaffer, “Rydberg-atom based radio-frequency electrometry using frequency modulation spectroscopy in room temperature vapor cells,” Opt. Express 25, 8625–8637 (2017).
- Robinson et al. [2021] A. K. Robinson, N. Prajapati, D. Senic, M. T. Simons, and C. L. Holloway, “Determining the angle-of-arrival of a radio-frequency source with a Rydberg atom-based sensor,” Appl. Phys. Lett. 118 (2021).
- Menchetti et al. [2023] M. Menchetti, L. W. Bussey, D. Gilks, T. Whitley, C. Constantinou, and K. Bongs, “Digitally encoded RF to optical data transfer using excited Rb without the use of a local oscillator,” J. Appl. Phys. 133 (2023).
- Li et al. [2023] X. Li, Y. Cui, J. Hao, F. Zhou, Y. Wang, F. Jia, J. Zhang, F. Xie, and Z. Zhong, “Magnetic-field-induced splitting of Rydberg electromagnetically induced transparency and Autler-Townes spectra in 87 Rb vapor cell,” Opt. Express 31, 38165–38178 (2023).
- Shi et al. [2023] Y. Shi, C. Li, K. Ouyang, W. Ren, W. Li, M. Cao, Z. Xue, and M. Shi, “Tunable frequency of a microwave mixed receiver based on Rydberg atoms under the Zeeman effect,” Opt. Express 31, 36255–36262 (2023).
- Bao et al. [2016] S. Bao, H. Zhang, J. Zhou, L. Zhang, J. Zhao, L. Xiao, and S. Jia, “Tunable frequency stabilization to Zeeman sublevel transitions between an intermediate state and Rydberg states,” Laser Phys. 27, 015701 (2016).
- Schlossberger et al. [2024] N. Schlossberger, A. P. Rotunno, A. B. Artusio-Glimpse, N. Prajapati, S. Berweger, D. Shylla, M. T. Simons, and C. L. Holloway, “Zeeman-resolved Autler-Townes splitting in Rydberg atoms with tunable resonances and a single transition dipole moment,” Phys. Rev. A 109, L021702 (2024).
- Riley and Howe [2008] W. J. Riley and D. A. Howe, Handbook of frequency stability analysis (US Department of Commerce, National Institute of Standards and Technology, 2008).
- Ma, Anderson, and Raithel [2017] L. Ma, D. Anderson, and G. Raithel, “Paschen-Back effects and Rydberg-state diamagnetism in vapor-cell electromagnetically induced transparency,” Physical Review A 95, 061804 (2017).