Roughness and scaling properties of oxide glass surfaces at the nanoscale
Abstract
Using atomistic computer simulations we determine the roughness and topographical features of melt-formed (MS) and fracture surfaces (FS) of oxide glasses. We find that the topography of the MS is described well by the frozen capillary wave theory. The FS are significant rougher than the MS and depend strongly on glass composition. The height-height correlation function for the FS shows an unexpected logarithmic dependence on distance, in contrast to the power-law found in experiments. We thus conclude that on length scales less than 10 nm FS are not self-affine fractals.
Surface roughness plays a crucial role for the functional properties of a material, including friction Persson et al. (2005); Urbakh et al. (2004), adhesion Pastewka and Robbins (2014) and transport properties Gotsmann and Lantz (2013). Understanding the nature and modifying this roughness is thus of great practical importance. In comparison with the surfaces of crystalline materials, the surfaces of amorphous materials such as glasses has received much less attention since the disorder renders the probing and characterization of such systems difficult Hench and Clark (1978); Pantano (1989); Bach (1997); Bocko et al. (1991); Dey and Naughton (2016); Zheng et al. (2019). Since a glass is an out of equilibrium system, the properties of its surface depends on the process by which it has been produced. Usually one considers two types of pristine (i.e., without post-processing) glass surfaces: i) Melt-formed surfaces (MS) which result from cooling a liquid with a free surface to the solid state and ii) Fracture surfaces (FS) resulting from a mechanical failure.
The topography of a MS is often described using the concept of a frozen liquid interface Jäckle and Kawasaki (1995); Seydel et al. (2002), i.e., upon cooling the sample, the capillary waves at the surface freeze at a temperature . Thus the roughness of a pristine MS is predicted to be , where is the standard deviation of the surface height fluctuation, is Boltzmann’s constant, and is the surface tension at . Atomic force microscope (AFM) experiments on oxide glass surfaces have shown that this prediction works well if one uses for the glass transition temperature Sarlat et al. (2006); Gupta et al. (2000); Roberts et al. (2005). This theoretical framework also predicts that the height-height correlation function
| (1) |
which gives the height difference between two points separated by a distance along a direction , increases like ln . This logarithmic dependence was validated experimentally with ranging from around 10 nm to 1000 nm Sarlat et al. (2006). However, for nm the dependence on is basically unknown.
Describing the topography of the FS is more difficult than that for the MS since the former results from a highly non-linear process which involves a complex interplay between heterogeneities in the composition, microstructure, and mechanical properties present in a glass (see, e.g. Bouchaud (1997); Ciccotti (2009); Bonamy and Bouchaud (2011) for reviews). Experimental studies of oxide glasses have shown that the roughness of the FS depends strongly on the composition Gupta et al. (2000); Wiederhorn et al. (2007); Pallares et al. (2018) and is larger than the one found in MS Gupta et al. (2000). AFM measurements have given evidence that the FS of various materials can be described as self-affine fractals Mandelbrot et al. (1984), i.e., the height-height correlation function scales like . Here is the roughness (or Hurst) exponent which was found to depend on the fracture mode, the length scale considered, and the material Milman et al. (1994); Bonamy et al. (2006); Ponson et al. (2006); Pallares et al. (2018); Wiederhorn et al. (2007). However, whether this self-affine description for the FS holds also down to the nanometer scale is still an open question since at such small scales the finite size of the probing tip severely restricts the spatial resolution Lechenault et al. (2010); Mazeran et al. (2005); Schmittbuhl et al. (1995).
Here, using large scale atomistic simulations, we provide quantitative insight into the topographical features of oxide glasses for the length scales ranging from a few Angströms to several tens of nanometers. In particular we analyze the morphology, roughness, symmetry, and statistical scaling of the MS and FS, i.e., surfaces which have very distinct manufacturing histories.
We investigate two archetypical compositions for oxide glasses, namely pure SiO2 and binary Na2O-SiO2, with and 20. The atomic interactions are described by a two-body effective potential (SHIK) Sundararaman et al. (2018, 2019) which has been shown to give a reliable description of the structural, mechanical and surface properties of sodium silicate glasses Zhang et al. (2020a, b). Our samples contain typically atoms, corresponding to box sizes of around 20 nm30 nm50 nm (in the , , and directions, respectively). Periodic boundary conditions were applied in the and directions while in the -direction we introduced (in the melt) two free surfaces. The samples were melted and equilibrated at a high temperature (composition dependent) and then cooled down to 300 K under zero pressure. In the following we will refer to these two surfaces, generated by the melt-quench procedure, as MS. The glass samples were then subjected to an uniaxial tension with a strain rate of 0.5 ns-1 in the -direction until complete fracture occurred, creating thus two FS. The surface atoms were identified by using a well-established geometric method Edelsbrunner and Mücke (1994) which allows thus to study the topographical features of the surfaces. More details on the sample preparation and surface construction are given in the Supplemental Material (SM).
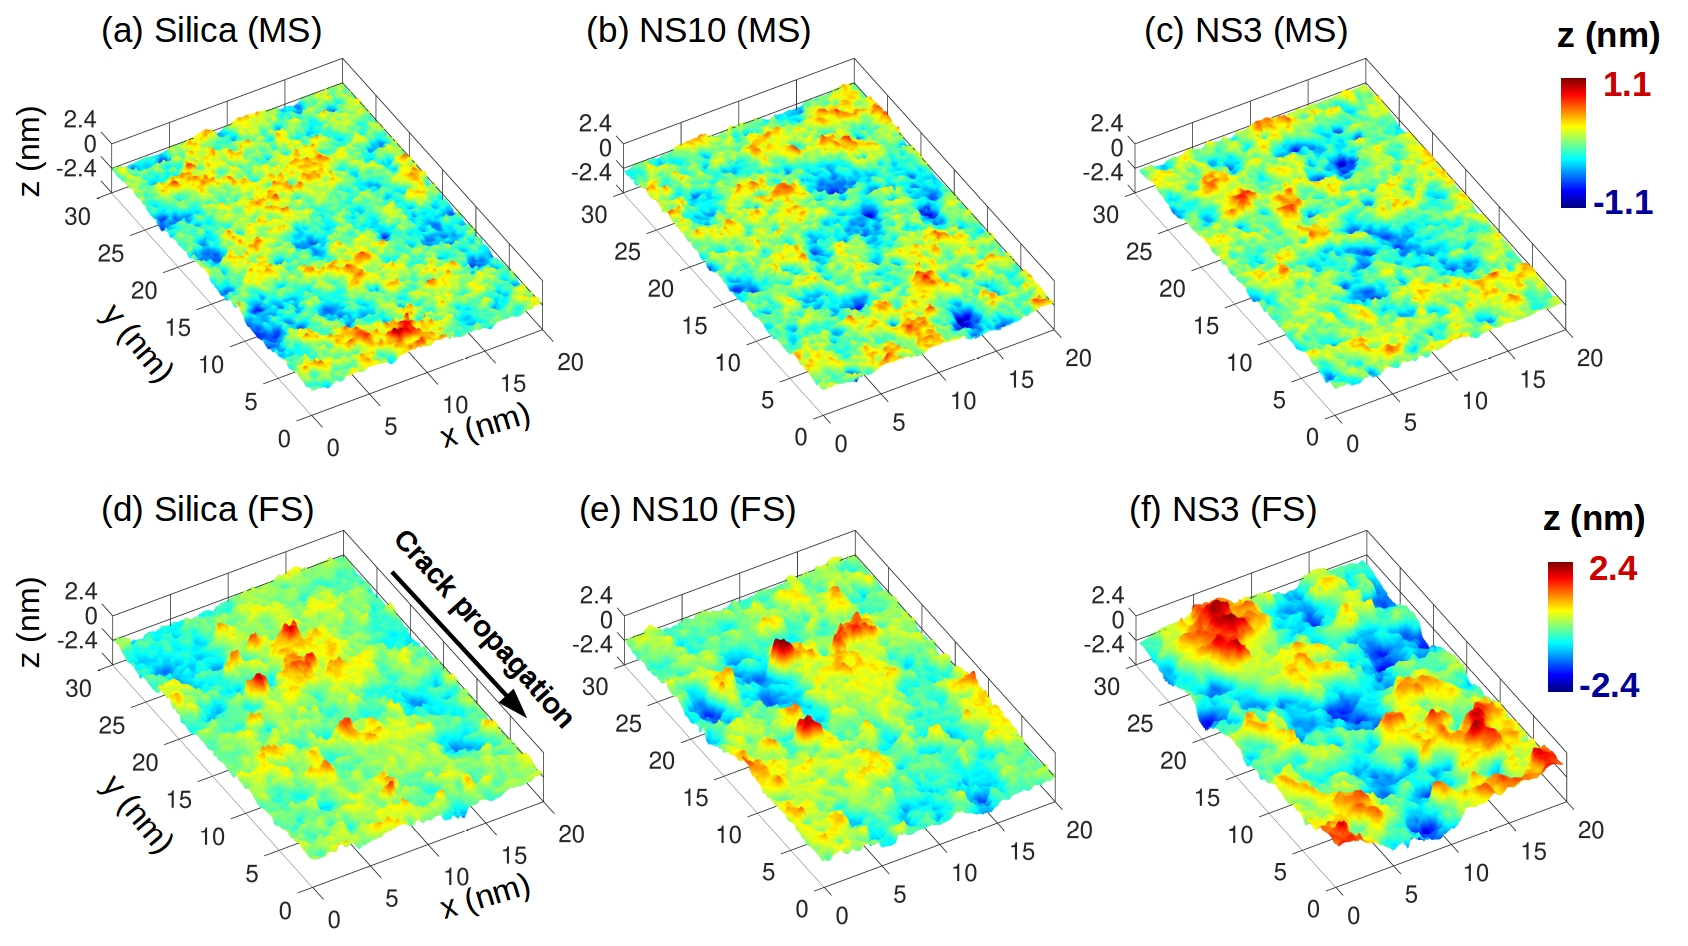
Figure 1 shows the (color coded) height fluctuations of the surfaces for three representatives compositions: Silica, NS10 (9% Na2O), and NS3 (25% Na2O). The top and bottom panels are for the MS and FS, respectively and the level has been determined such that the mean of the fluctuations is zero. For the MS, panels (a-c), one recognizes that the amplitude of these height fluctuations seems to be independent of the composition, and that also the spatial extent of the structures are independent of the Na2O content. In contrast to this, the FS, panels (d-f), show height fluctuations that are larger than the ones for the MS and clearly grow in amplitude and extent if the concentration of Na2O increases. Also one recognizes that the surfaces seem to be anisotropic and in the following we will quantify these observations.
Figures 2(a) and (b) show the distribution of the surface height for different glass compositions. For the MS, panel (a), we find that this distribution is basically independent of the composition, in agreement with the snapshots shown in Fig. 1. In contrast to this, the distribution for the FS shows a clear dependence on the composition in that it becomes wider with increasing Na2O concentration (i.e., smaller ). The change of the surface height distribution is directly related to the surface roughness , which is defined as the standard deviation of height fluctuations. (Note that of the FS is basically independent of the distance from the fracture origin, see Fig. S1.) Figure 2(c) shows as a function of the mole concentration of Na2O. For the MS, is around 0.25 nm for silica and 0.23 nm for NS3, thus showing indeed a very mild dependence on the composition. This observation is likely related to the fact that the MS are rich in Na Zhang et al. (2020b), i.e. a species that plastifies the glass, thus allowing to smooth out even small irregularities. Using the capillary wave theory mentioned above it is possible to estimate the roughness of the MS from the surface tension, and for the case of silica one finds nm (data point labelled “intrinsic”) Gupta et al. (2000), in very good agreement with our simulation result.
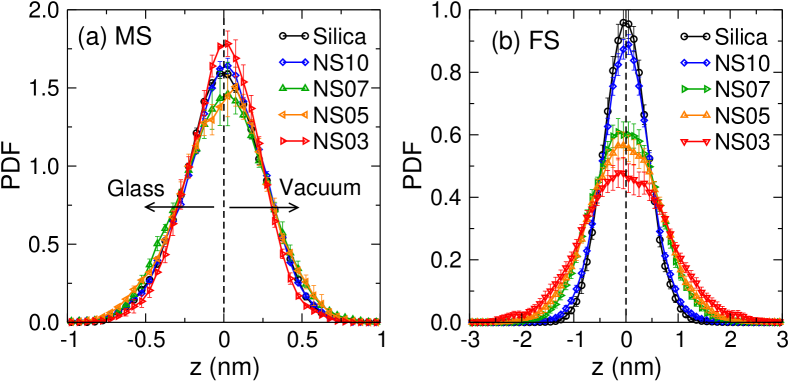
The roughness of the FS is higher than the one for the MS, in agreement with the qualitative impression given by Fig. 1, and shows a clear dependence on the Na2O content in that it increases from nm for silica to nm for NS3. The increase of with Na2O concentration can be rationalized by the fact that, with the addition of Na, the glass becomes increasing ductile when subjected to mechanical loading Wang et al. (2015); Pedone et al. (2015); Zhang et al. (2020a). This increase of ductility originates from the enhanced heterogeneities in the micro-structure and the local plasticity of the glass, leading to a rougher fracture surface Wang et al. (2016); Zhang (2020). (See Fig. S2(a) for the dependence of on the strain rate.)
Also included in the graph are the experimental values of the roughness for silica glass surfaces as obtained from AFM measurements Gupta et al. (2000). One observes that these experimental data are somewhat below our simulation values and the theoretical prediction (for the MS). This discrepancy might be due to the insufficient spatial resolution of this experimental technique (see also the discussion below).
A further property of interest is the symmetry of the surfaces, which can be quantified by the skewness of the surface height distribution. The question of interest is whether or not the two sides of the surface (facing the vacuum/facing the glass) are statistically equivalent. Figure 2(d) shows that the MS have a negative , i.e. there are more deep holes than high protrusions, while for the FS is positive, i.e. there are more high protrusions than deep holes. The result for the FS is coherent with the view that during the fracture process the breaking of bridges or chain-like structures gives rise to a spiky surface. Note that a non-vanishing indicates that the capillary wave theory cannot be strictly valid since this approach predicts . (See Fig. S3 for the surface properties at elevated temperatures.)
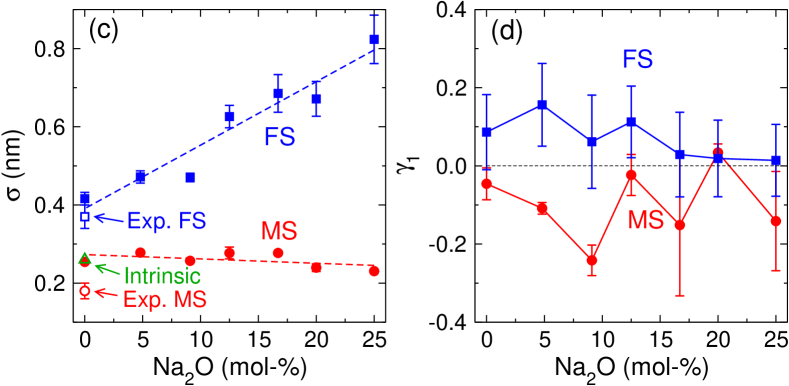
To characterize the structure of the surfaces on larger scales it is useful to look at the height-height correlation function defined in Eq. (1). Figure 3(a) shows as a function of for the MS of silica and NS3. Two (orthogonal) directions are considered and, as expected, they give the same result, indicating that the MS is isotropic. Moreover, we note that the curves for silica are slightly above the ones for NS3, indicating that the MS of silica is a bit rougher than the one of NS3, in agreement with Fig. 2(c). One also observes that increases logarithmically with , in agreement with the prediction of the frozen capillary wave approach Jäckle and Kawasaki (1995). Since AFM experiments on MS have found the same -dependence for nm Sarlat et al. (2006), we can conclude that this theory gives a reliable description for length scales that range from the atomic (sub-nanometer) to the micrometer scale.
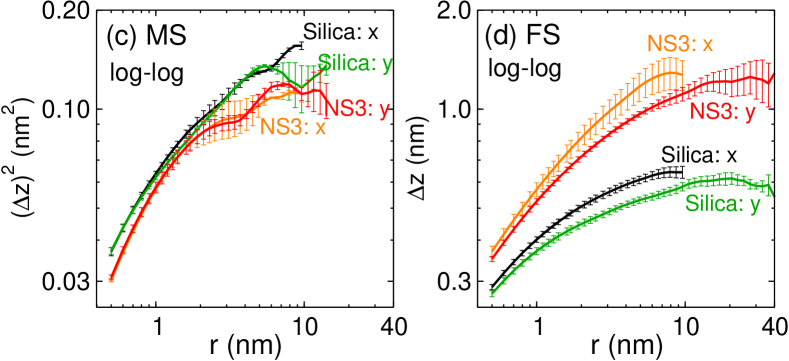
For the FS, Fig. 3(b), we find that (no square!) shows a linear increase with , thus a dependence that is very different from the one found for the MS. In this case the roughness depends on the direction in which it is measured. The curve for the -direction (parallel to the crack front) is about 15% higher than the one for the -direction (orthogonal to the crack front), irrespective of glass composition. In addition, the slope of the linear regime depends not only on the composition but also on the probing direction. This results indicate that the FS is anisotropic, and its roughness depends on the composition, in agreement the experimental findings on the FS of oxide glasses Ponson et al. (2006); Pallares et al. (2018); Wiederhorn et al. (2007). Note that at large all of the curves tend to saturate, a behavior that is most likely related to the fact that the sample is finite and hence fluctuations are bounded. The parameters obtained from a logarithmic fit to the small data in panels (a) and (b), as well as for other compositions, are shown in Fig. S4. We also confirmed that the strain rate used for the fracture simulation has only a weak effect on these parameters [Fig. S2(b)].
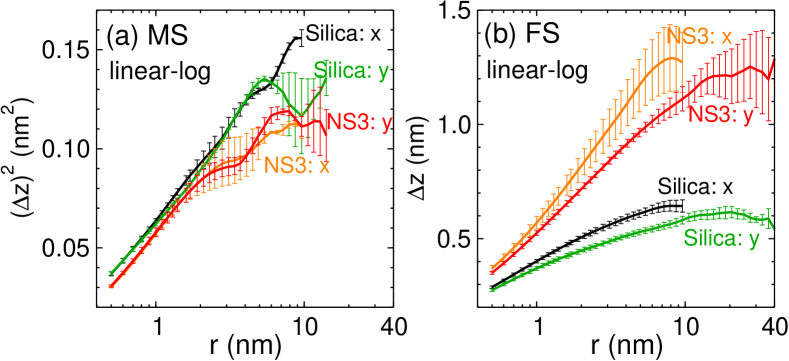
In Fig. 3(c) and (d) we show on log-log scale the same data as plotted in Fig. 3(a) and (b), respectively. It is evident that this type of presentation of the data does not rectify it, demonstrating that on the length scales we have explored the height-height correlation is not given by a power-law, i.e. neither surface has the characteristics of a fractal. Instead, the -dependence we find for the FS is in qualitative agreement with theoretical and numerical studies on the fracture surface of heterogeneous materials (mode I fracture, i.e. tensile loading) Ramanathan et al. (1997); Barés et al. (2014).
Our finding that the FS cannot be described as a self-affine fractal on the length scales we have considered is at odds with AFM measurements that have reported a power-law dependence of down to the scale of 1 nm Ponson et al. (2006); Pallares et al. (2018). To elucidate the origin of this discrepancy one has to recall that the size of an AFM tip is finite which limits the lateral resolution of the measurements Lechenault et al. (2010); Mazeran et al. (2005) and can induces biases in the characterization of the surface Schmittbuhl et al. (1995).
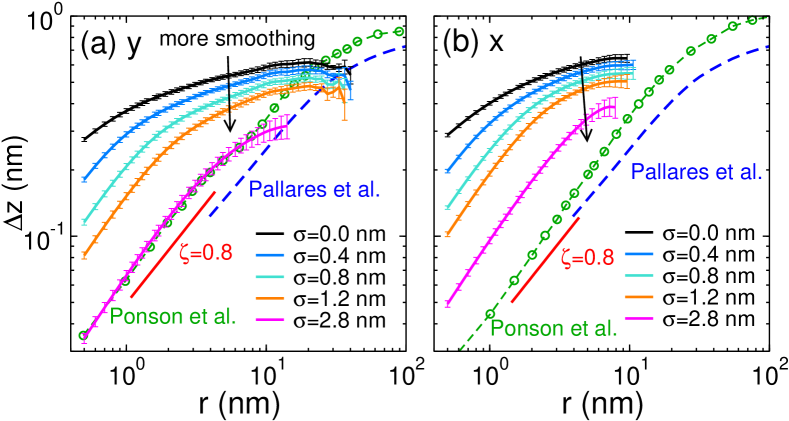
In order to investigate the effect of spatial resolution we have convoluted our FS with a two-dimensional Gaussian filter Pitas (2000) of width (see SM) and then recalculated the height-height correlation function for this smoothed surface. In Fig. 4 we show for the case of the FS of silica the resulting correlation functions for different values of . The curve corresponds to the original (non-smoothed) data. We find that with increasing the value of decreases significantly since the convolution irons out the deep holes/high spikes. Surprisingly, we note that at small the convoluted signal can be described well with a power-law, and that the -range in which this functional form is observed increases with while the exponent is independent of . For nm, the correlation function of the convoluted surface in the -direction [Fig. 4(a)] matches very well the AFM data by Ponson et al. Ponson et al. (2006). The exponent of the power-law is , i.e. the claimed “universal” roughness exponent found in previous experimental studies Ponson et al. (2006); Pallares et al. (2018); Bonamy et al. (2006); Bouchaud (1997). The data in the direction, panel (b), shows qualitatively the same variation as the ones in the direction. However, we find that one needs to apply stronger smoothing to match quantitatively the convoluted surfaces with the experimental ones, a result that is related to the fact that the FS is anisotropic and the surface profile in the direction parallel to the crack front is rougher than the one in the direction. These results indicate that the power-law observed in experiments on the scale of a few nanometers might be an artifact of insufficient resolution of the surface measurements and that in reality the correlation function takes higher values than that extracted from AFM studies.
In conclusion, the results of this work reveal how the topographical features of glass surfaces reflect the way they have been produced. While melt-formed surfaces can be described in a satisfactory manner by means of frozen capillary waves, surfaces originating from a fracture process exhibit a logarithmic growth of the height-height correlation, a result that so far has not been obtained from microscopic calculations. A recent atomistic simulation study of metal-based materials (in both crystalline and amorphous forms) has found that compression-induced rough surfaces are self-affine on the length scale of 1-100 nm, a result that was attributed to atomic-scale fluctuations in plastic flow Hinkle et al. (2020). Together with our simulation results one thus can conclude that, for amorphous solids, the surface topography on small length scales depends strongly on the manufacturing history and the type of material considered. Further research exploring how material composition and deformation mode affects the surface topography will thus be very valuable.
We thank D. Bonamy for useful discussions. Z.Z. acknowledges financial support by China Scholarship Council (NO. 201606050112). W.K. is member of the Institut Universitaire de France. This work was granted access to the HPC resources of CINES under the allocation A0050907572 and A0070907572 attributed by GENCI (Grand Equipement National de Calcul Intensif).
References
- Persson et al. (2005) B. N. J. Persson, O. Albohr, U. Tartaglino, A. I. Volokitin, and E. Tosatti, J. Phys. Condens. Matter 17, R1 (2005).
- Urbakh et al. (2004) M. Urbakh, J. Klafter, D. Gourdon, and J. Israelachvili, Nature 430, 525 (2004).
- Pastewka and Robbins (2014) L. Pastewka and M. O. Robbins, Proceedings of the National Academy of Sciences 111, 3298 (2014).
- Gotsmann and Lantz (2013) B. Gotsmann and M. Lantz, Nature materials 12, 59 (2013).
- Hench and Clark (1978) L. Hench and D. E. Clark, J. Non-Cryst. Solids 28, 83 (1978).
- Pantano (1989) C. G. Pantano, Rev. Solid State Sci. 3, 379 (1989).
- Bach (1997) H. Bach, J. Non-Cryst. Solids 209, 1 (1997).
- Bocko et al. (1991) P. Bocko, P. Fenn, L. Morse, and F. Okamoto, SID 91 Digest 675 (1991).
- Dey and Naughton (2016) T. Dey and D. Naughton, J. Sol-Gel Sci. Technol. 77, 1 (2016).
- Zheng et al. (2019) K. Zheng, M. Kapp, and A. R. Boccaccini, Appl. Mater. Today 15, 350 (2019).
- Jäckle and Kawasaki (1995) J. Jäckle and K. Kawasaki, J. Phys. Condens. Matter 7, 4351 (1995).
- Seydel et al. (2002) T. Seydel, M. Tolan, B. M. Ocko, O. H. Seeck, R. Weber, E. DiMasi, and W. Press, Phys. Rev. B 65, 184207 (2002).
- Sarlat et al. (2006) T. Sarlat, A. Lelarge, E. Søndergård, and D. Vandembroucq, Eur. Phys. J. B 54, 121 (2006).
- Gupta et al. (2000) P. K. Gupta, D. Inniss, C. R. Kurkjian, and Q. Zhong, J. Non-Cryst. Solids 262, 200 (2000).
- Roberts et al. (2005) P. Roberts, F. Couny, H. Sabert, B. Mangan, D. Williams, L. Farr, M. Mason, A. Tomlinson, T. Birks, J. Knight, et al., Optics express 13, 236 (2005).
- Bouchaud (1997) E. Bouchaud, J. Phys. Condens. Matter 9, 4319 (1997).
- Ciccotti (2009) M. Ciccotti, J. Phys. D 42, 214006 (2009).
- Bonamy and Bouchaud (2011) D. Bonamy and E. Bouchaud, Physics Reports 498, 1 (2011).
- Wiederhorn et al. (2007) S. M. Wiederhorn, J. M. López-Cepero, J. Wallace, J.-P. Guin, and T. Fett, J. Non-Cryst. Solids 353, 1582 (2007).
- Pallares et al. (2018) G. Pallares, F. Lechenault, M. George, E. Bouchaud, C. Ottina, C. L. Rountree, and M. Ciccotti, J. Am. Ceram. Soc. 101, 1279 (2018).
- Mandelbrot et al. (1984) B. B. Mandelbrot, D. E. Passoja, and A. J. Paullay, Nature 308, 721 (1984).
- Milman et al. (1994) V. Milman, N. Stelmashenko, and R. Blumenfeld, Progress in Materials Science 38, 425 (1994).
- Bonamy et al. (2006) D. Bonamy, L. Ponson, S. Prades, E. Bouchaud, and C. Guillot, Phys. Rev. Lett. 97 (2006).
- Ponson et al. (2006) L. Ponson, D. Bonamy, and E. Bouchaud, Phys. Rev. Lett. 96, 035506 (2006).
- Lechenault et al. (2010) F. Lechenault, G. Pallares, M. George, C. Rountree, E. Bouchaud, and M. Ciccotti, Phys. Rev. Lett. 104, 025502 (2010).
- Mazeran et al. (2005) P.-E. Mazeran, L. Odoni, and J.-L. Loubet, Surface science 585, 25 (2005).
- Schmittbuhl et al. (1995) J. Schmittbuhl, J.-P. Vilotte, and S. Roux, Physical Review E 51, 131 (1995).
- Sundararaman et al. (2018) S. Sundararaman, L. Huang, S. Ispas, and W. Kob, J. Chem. Phys. 148, 194504 (2018).
- Sundararaman et al. (2019) S. Sundararaman, L. Huang, S. Ispas, and W. Kob, J. Chem. Phys. 150, 154505 (2019).
- Zhang et al. (2020a) Z. Zhang, S. Ispas, and W. Kob, J. Non-Cryst. Solids 632, 119895 (2020a).
- Zhang et al. (2020b) Z. Zhang, S. Ispas, and W. Kob, “Structure and vibrational properties of sodium silicate glass surfaces,” (2020b).
- Edelsbrunner and Mücke (1994) H. Edelsbrunner and E. P. Mücke, ACM Trans. Graph. 13, 43 (1994).
- Wang et al. (2015) B. Wang, Y. Yu, Y. J. Lee, and M. Bauchy, Frontiers in Materials 2, 11 (2015).
- Pedone et al. (2015) A. Pedone, M. C. Menziani, and A. N. Cormack, J. Phys. Chem. C 119, 25499 (2015).
- Wang et al. (2016) B. Wang, Y. Yu, M. Wang, J. C. Mauro, and M. Bauchy, Phys. Rev. B 93, 064202 (2016).
- Zhang (2020) Z. Zhang, Fracture, surface, and structure of silicate glasses: Insights from atomistic computer simulations, Doctoral dissertation, University of Montpellier (2020).
- Ramanathan et al. (1997) S. Ramanathan, D. Ertaş, and D. S. Fisher, Phys. Rev. Lett. 79, 873 (1997).
- Barés et al. (2014) J. Barés, M. Barlet, C. L. Rountree, L. Barbier, and D. Bonamy, Frontiers in Physics 2, 70 (2014).
- Pitas (2000) I. Pitas, Digital image processing algorithms and applications (John Wiley & Sons, 2000).
- Hinkle et al. (2020) A. R. Hinkle, W. G. Nöhring, R. Leute, T. Junge, and L. Pastewka, Science advances 6, eaax0847 (2020).
- Bansal and Doremus (1986) N. P. Bansal and R. H. Doremus, Handbook of glass properties (Orlando: Academic Press, 1986).
- Nosé (1984) S. Nosé, J. Chem. Phys. 81, 511 (1984).
- Hoover (1985) W. G. Hoover, Phys. Rev. A 31, 1695 (1985).
- Hoover (1986) W. G. Hoover, Phys. Rev. A 34, 2499 (1986).
- Plimpton (1995) S. Plimpton, J. Comput. Phys. 117, 1 (1995).
- Stukowski (2014) A. Stukowski, JOM 66, 399 (2014).
- Binder and Kob (2011) K. Binder and W. Kob, Glassy materials and disordered solids: An introduction to their statistical mechanics (World Scientific, 2011).
- Greaves (1985) G. N. Greaves, J. Non-Cryst. Solids 71, 203 (1985).
- Horbach et al. (2002) J. Horbach, W. Kob, and K. Binder, Phys. Rev. Lett. 88, 125502 (2002).
- Meyer et al. (2004) A. Meyer, J. Horbach, W. Kob, F. Kargl, and H. Schober, Phys. Rev. Lett. 93, 027801 (2004).
Supplemental Material:
Roughness and scaling properties of oxide glass surfaces at the nanoscale
Zhen Zhang1, Simona Ispas1, and Walter Kob1
1Laboratoire Charles Coulomb (L2C), University of Montpellier and CNRS, F-34095 Montpellier, France
In this Supplemental Material, we provide information regarding the
following points: 1) Details of the simulation and sample preparation, 2)
Details of the procedure used for constructing the surfaces, 3) Test
whether roughness depends on the distance to origin of the fracture,
4) Influence of strain rate and temperature on surface topography, 5)
Extracted parameters from the height-height correlation function, 6)
Details on the surface smoothing.
1. Simulation details and sample preparation
We consider glasses with the composition SiO2 and Na2O-SiO2, NSx, with and 20. Approximately atoms were placed randomly in the simulation box which had a fixed volume determined by the experimental value of glass density at room temperature Bansal and Doremus (1986). Using periodic boundary conditions in three dimensions these samples were first melted and equilibrated at 6000 K for 80 ps in the canonical ensemble () and then cooled and equilibrated at a lower temperature (still in liquid state) for another 160 ps. The temperature ranges from 3000 K for SiO2 to 2000 K for NS3 (25 mole% Na2O), see Ref. Zhang et al. (2020b); Zhang (2020) for details. Subsequently we cut the sample orthogonal to the axis, and added an empty space, thus creating two free surfaces i.e. the sample had the geometry of a slab. Periodic boundary conditions were applied in all three directions. In order to ensure that the two free surfaces do not interact with each other, the thickness of the vacuum layer varied from 6 nm for silica to 14 nm for NS3. These samples were then equilibrated at for 1.6 ns, a time span that is sufficient to allow the reconstruction of the surfaces and the equilibration of the interior of the samples. Subsequently the liquid samples were cooled via a two-stage quenching: A cooling rate of K/ps was used to quench the samples from to a temperature and a faster cooling rate K/ps to cool them from to 300 K. Finally, the samples were annealed at 300 K for 800 ps. The temperature at which the cooling rate changes was chosen to be at least 200 K below the simulation glass transition temperature , i.e., depending on composition, 1500 K K, see Refs. Zhang et al. (2020b); Zhang (2020) for details. At , we also switched the simulation ensemble from to (at zero pressure) so that the generated glass samples were not under macroscopic stress at room temperature.
After the glass samples were prepared we introduced on one of its free surfaces a “scratch” in the form of a triangular notch spanning the sample in the -direction of width and depth of 3 nm and 2 nm, respectively. Subsequently we applied to the sample a strain, with a constant rate=0.5 ns-1, until it broke. Due to the presence of the notch, the place at which the fracture initiated could be changed at will. More details can be found in Ref. Zhang (2020).
The interaction between the atoms are given by a pairwise effective potential proposed by Sundararaman et al. (SHIK) Sundararaman et al. (2018, 2019), which has been found to give a good quantitative description of the bulk and surface properties of sodo-silicate glasses Zhang et al. (2020a, b). Its functional form is given by
| (2) |
where is the distance between two atoms of species and . This potential uses partial charges for different atomic species: The charges for Si and Na are, respectively, fixed at 1.7755 and 0.5497, while the charge of O depends on composition and is given by requesting charge neutrality of the sample, i.e.,
| (3) |
where is the molar concentration of Na2O, i.e., . The other parameters of the potential, , and , occurring in Eq. (2) are given in Refs. Sundararaman et al. (2018, 2019). Note that, following Ref. Sundararaman et al. (2018), the Coulombic part in Eq. (2) was treated via the Wolf method.
Temperature and pressure were controlled using a Nosé-Hoover thermostat and barostat Nosé (1984); Hoover (1985, 1986). All simulations were carried out using the Large-scale Atomic/Molecular Massively Parallel Simulator software (LAMMPS) Plimpton (1995) with a time step of 1.6 fs.
The results presented in this manuscript correspond to one melt-quench sample
for each composition. However, we emphasize that the system sizes considered in this study are sufficiently large to make sample-to-sample fluctuations negligible. For the MS, the results for the two surfaces on the top and bottom sides of the glass sample were averaged. For the FS, twelve surfaces, resulting from six independent fracture (by changing the location of the notch), were averaged. The error bars were estimated as the standard error of the mean of the samples.
2. Identifying the surface
In order to have a reliable description of the surface one needs a method that allows to map the positions of the atoms onto a well-defined mathematical surface. The algorithm that we use for constructing this surface mesh is based on the alpha-shape method of Edelsbrunner and Mücke Edelsbrunner and Mücke (1994). It starts with the Delaunay tetrahedrization of the input point set, i.e. the atoms in the sample. From the resulting tetrahedra, all tessellation elements are then evaluated by comparing their circumspheres to a reference probe sphere that has a radius . The elements (with circumsphere radius ) which satisfy are classified as solid, and the union of all solid Delaunay elements defines the geometric shape of the atomistic solid. A robust realization of this algorithm is implemented in OVITO Stukowski (2014).
It is important to mention that the probe sphere radius is the length scale which determines how many details and small features of the solid’s geometric shape are resolved. To construct the geometric surfaces for the glass samples, we use Å , i.e., the typical distance between neighboring Si atoms. This choice allows to resolve fine surface features and avoids artificial holes in the constructed surfaces. We note, however, that a small change of (e.g. Å) will not alter significantly the results presented in the manuscript, see Refs. Zhang et al. (2020b); Zhang (2020) for details. Finally, we mention that for the FS we have not used for the analysis the parts of the surface that are closer than nm to the top/bottom MS in order to avoid the influence of these surfaces onto the properties of the FS.
Once the geometric surface is constructed, i.e., the mesh points of
the surface are identified, we first fit a plane to the set of mesh points
using a least squares fitting procedure. Finally, a linear interpolation
is applied to the triangular mesh to obtain a uniform quadratic grid
which is subsequently used to determine the morphology and roughness of
the surface.
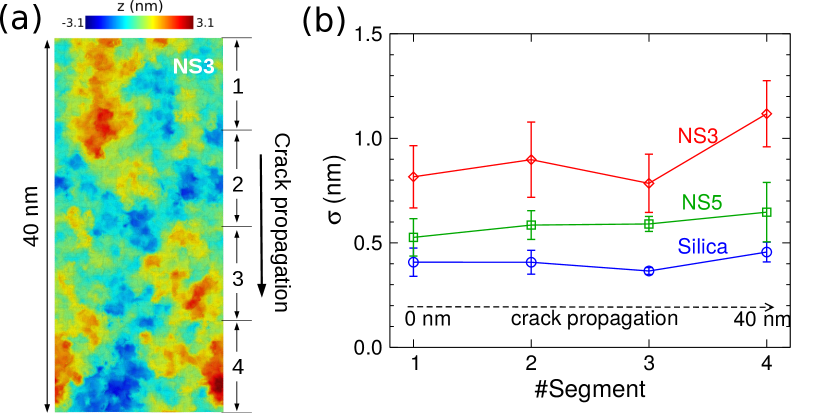
3. Dependence of roughness on the distance from the fracture origin
Since the formation of the FS is a strongly out-of-equilibirum
process it could be that the roughness depends on the distance
the crack has propagated from its origin, i.e., the notch. To test for this
possibility we have divided the surface into four segments along
the -direction, i.e., in the direction the crack propagated,
see Fig. S1(a). For each
of these segments we have determined the roughness and in
Fig. S1(b) we show for selected
glass compositions the value of in these segments. The graph shows
that within the accuracy of the data there is no dependence on the segment
number, i.e., on the distance from the fracture origin.
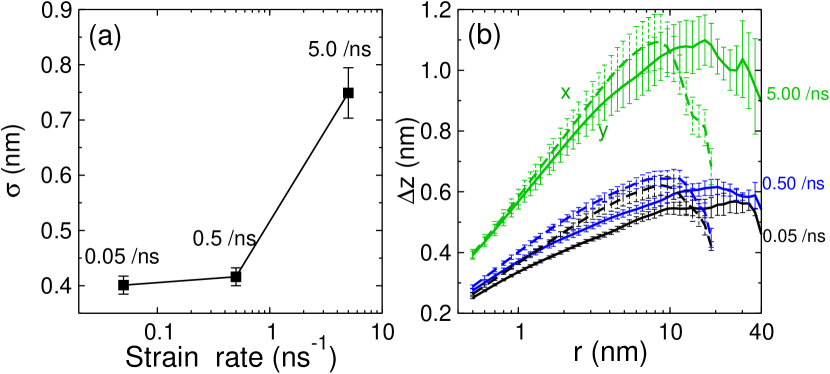
4. Dependence of roughness and topography on strain rate and temperature
The results in the main text have been obtained for a strain rate of 0.5 ns-1. Since it is well known that the properties of glasses depend on the production history Binder and Kob (2011), it can be expected that also the properties of the fracture surface will depend on these details. One key parameter for the fracture process is the strain rate, , used to deform the sample and in Fig. S2(a) we show for the case of silica the roughness as a function of this parameter. One sees that for high rates the roughness is about a factor of two higher than the we obtain for ns-1. This result is reasonable since a high rate will not allow the crack to find energetically favorable pathways and hence results in a surface that is rough. However, once is lowered to 0.5 ns-1, is basically independent of the strain rate and hence we can conclude that the roughness we present in the main text should correspond to the case of real experiments on dynamic fracture.
A similar conclusion can be reached for the topography of the surface since, see Fig. S2(b), the height-height correlation functions for the intermediate and low strain rates are basically identical.
A further important parameter that influences the topography of a surface is the temperature. The results presented in the main text are for the temperature K. In Fig. S3 we show how the roughness and the skewness depend on the temperature at which the surfaces are probed. To get this data for the MS we used the configurations obtained during the quench procedure. For the FS we annealed the samples at 600-800 K (NS3-silica) for 160 ps before we cooled them down in a step-wise manner to the temperatures of interest. At each we annealed the samples for 160 ps before starting to strain them until fracture occurred.
The figure shows that for the case of the MS, panel (a), the roughness of the silica surface is basically independent of , i.e. increasing temperature does not allow the surface to fluctuate with significantly larger amplitudes. This result is reasonable in view of the strong bonds present in this kind of glass. In contrast to this we find for NS3 a significant dependence in the roughness, although the absolute change is small (10%). This result is likely related to the fact that the mobility of the Na atoms depends strongly on , thus allowing for a significant softening of the network structure.
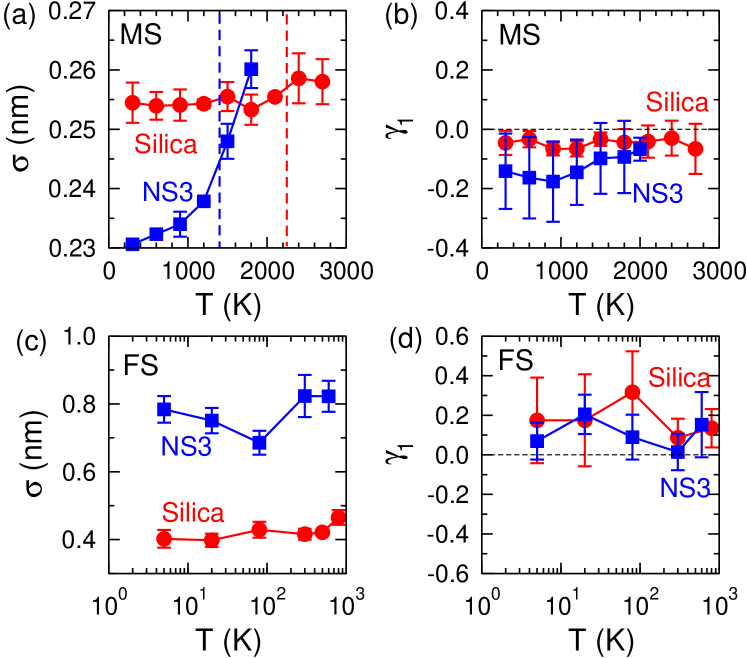
Also included in the graph are the estimated values for the glass transition temperature (vertical dashed lines). Naively one can expect that below the topography of the surface is given by the thermal (harmonic) fluctuation of the atoms around their average positions, i.e., a dependence. The NS3 data clearly shows that this view is too simplistic since, as mentioned above, a change of leads to a modification of the local elastic constants and as a consequence the dependence of is much stronger than expected for a purely harmonic system.
Panel (b) shows that temperature does not really affect the skewness of the distribution, i.e. the fact that the surface has more deep cavities than high peaks is independent of . Only for the case of NS3 we find at intermediate and high a slight increase of , i.e., at these high temperatures the system becomes sufficiently soft that the distribution of the fluctuation becomes symmetric since the sample starts to liquify.
For the case of the FS, panel (c), we see that neither silica nor NS3
show a significant -dependence of . This observation is
coherent with the observation, Ref. Zhang (2020), that during the fracture process the local temperature of the system close to the
crack front is so high (because of the breaking of the bonds) that for
the resulting surface it is irrelevant at which temperature the fracture
happens. In agreement with this argument we find that also the skewness
of the height distribution, panel (d), is independent of .
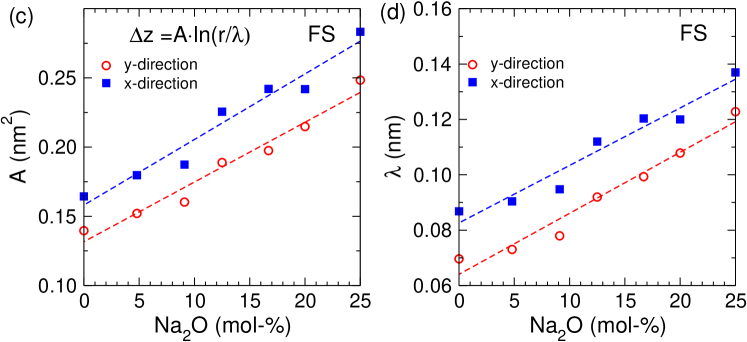
5. Parameters describing the height-height correlation function
In the main text we have shown that the functional form describing the height-height correlation function depends on the type of surface considered: for the MS and for the FS, see Fig. 3. In Fig. S4 we show how the prefactor and the length scale depend on the composition of the glass. Panel (a) shows the prefactor of the logarithmic dependence for the case of the MS. Although the scattering of the data is substantial, there is good evidence that has a maximum at intermediate concentrations of Na. One possibility to rationalize this observation is to recall that within the frozen capillary wave theory this prefactor is given by Sarlat et al. (2006)
| (4) |
where is the surface tension. The freezing temperature decreases with increasing Na concentration, and it can be expected that the surface tension does the same. Hence is an increasing function of the Na2O concentration and thus it is not unreasonable (although not guaranteed) that the product of these two factors give a maximum at intermediate values of the Na2O content.
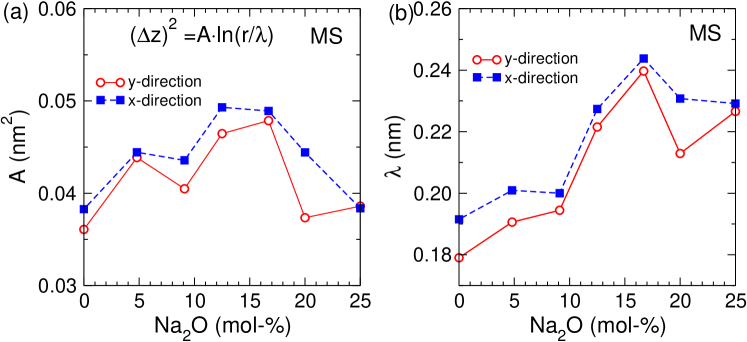
Panel (b) shows the compositional dependence of the length scale and we see that with increasing Na2O the length scale increases weakly. This observation agrees with the idea of the capillary wave theory which identifies as the smallest length scales over which one can use this approach. Since it is well known that systems containing Na have a more complex structure than pure silica, because of the presence of ion-conducting channels Greaves (1985); Horbach et al. (2002); Meyer et al. (2004), we can expect that this minimum wave-length is larger for NS3 than for silica, rationalizing the observed trend in panel (b).
For the case of the FS, panels (c) and (d), we find that the prefactor as well as
the length scale increase significantly (by more than 50%) in
the -range considered. Although we have no explanation why, for
both quantities, this dependence is linear in the Na concentration,
this qualitative trend is reasonable since an increasing Na content
will increase the plasticity of the system and hence allow for a
height-height correlation that has a larger amplitude and extents to
larger distances.
6. Smoothing of the surface
In the main text we have presented the results on the height-height correlation function once the surface fluctuations were smoothed by convoluting them with a 2D Gaussian. To do this smoothing of the surface defined by points that are on the quadratic grid we proceeded as follows: The weight function is given by
| (5) |
where is the in-plane distance from a given grid point to the reference grid point , and controls the shape of the weight function. We consider only the grid points with . Thus the smoothed surface height is given by
| (6) |
where is the number of grid points that satisfy . By varying the value of , different levels of smoothing can be applied to the original surface and thus the influence of spatial resolution on the surface properties can be investigated.