Robust Non-adaptive Group Testing under Errors in Group Membership Specifications
Abstract
Given samples, each of which may or may not be defective, group testing aims to determine their defect status indirectly by performing tests on ‘groups’ (also called ‘pools’), where a group is formed by mixing a subset of the samples. Under the assumption that the number of defective samples is very small compared to , group testing algorithms have provided excellent recovery of the status of all samples with even a small number of groups. Most existing methods, however, assume that the group memberships are accurately specified. This assumption may not always be true in all applications, due to various resource constraints. For example, such errors could occur when a technician, preparing the groups in a laboratory, unknowingly mixes together an incorrect subset of samples as compared to what was specified. We develop a new group testing method, the Debiased Robust Lasso Test Method (Drlt), that handles such group membership specification errors. The proposed Drlt method is based on an approach to debias, or reduce the inherent bias in, estimates produced by Lasso, a popular and effective sparse regression technique. We also provide theoretical upper bounds on the reconstruction error produced by our estimator. Our approach is then combined with two carefully designed hypothesis tests respectively for (i) the identification of defective samples in the presence of errors in group membership specifications, and (ii) the identification of groups with erroneous membership specifications. The Drlt approach extends the literature on bias mitigation of statistical estimators such as the Lasso, to handle the important case when some of the measurements contain outliers, due to factors such as group membership specification errors. We present several numerical results which show that our approach outperforms several intuitive baselines and robust regression techniques for identification of defective samples as well as erroneously specified groups.
Index Terms:
Group testing, debiasing, Lasso, non-adaptive group testing, hypothesis testing, compressed sensingI Introduction
Group testing is a well-studied area of data science, information theory and signal processing, dating back to the classical work of Dorfman in [14]. Consider samples, one per subject, where each sample is either defective or non-defective. In the case of defective samples, additional quantitative information regarding the extent or severity of the defect in the sample may be available. Group testing typically replaces individual testing of these samples by testing of ‘groups’ of samples, thereby saving on the number of tests. Each group (also called a ‘pool’) consists of a mixture of small, equal portions taken from a subset of the samples. Let the (perhaps noisy) test results on the groups be arranged in an -dimensional vector . Let the true status of each of the samples be arranged in a -dimensional vector . The aim of group testing is to infer from given accurate knowledge of the group memberships. We encode group memberships in an -dimensional binary matrix (called the ‘pooling matrix’) where if the sample is a member of the group, and otherwise. If the overall status of a group is the sum of the status values of each of the samples that participated in the group, we have:
| (1) |
where is a noise vector. In a large body of the literature on group testing (e.g., [5, 10, 14]), and are modeled as binary vectors, leading to the forward model , where the matrix-vector ‘multiplication’ involves binary OR, AND operations instead of sums and products, and is a noise operator that could at random flip some of the bits in . In this work, however, we consider and to be vectors in and respectively, as also done in [23, 19, 47], and adopt the linear model (1). This enables encoding of quantitative information in , and now involves the usual matrix-vector multiplication.
In commonly considered situations, the number of non-zero samples, i.e., defective samples, is much less than , and indicates that the sample is non-defective where . In such cases, group testing algorithms have shown excellent results for the recovery of from . These algorithms are surveyed in detail in [3] and can be classified into two broad categories: adaptive and non-adaptive. Adaptive algorithms [14, 23, 25] process the measurements (i.e., the results of pooled tests available in ) in two or more stages of testing, where the output of each stage determines the choice of pools in the subsequent testing stage. Non-adaptive algorithms [47, 19, 20, 6], on the other hand, process the measurements with only a single stage of testing. Non-adaptive algorithms are known to be more efficient in terms of time as well as the number of tests required, at the cost of somewhat higher recovery errors, as compared to adaptive algorithms [30, 19]. In this work, we focus on non-adaptive algorithms.
Problem Motivation: In the recent COVID-19 pandemic, RT-PCR (reverse transcription polymerase chain reaction) has been the primary method of testing a person for this disease. Due to widespread shortage of various resources for testing, group testing algorithms were widely employed in many countries [1]. Many of these approaches used Dorfman testing [14] (an adaptive algorithm), but non-adaptive algorithms have also been recommended or used for this task [19, 47, 6]. In this application, the vectors and refer to the real-valued viral loads in the individual samples and the pools respectively, and is again a binary pooling matrix. In a pandemic situation, there is heavy demand on testing labs. This leads to practical challenges for the technicians to implement pooling due to factors such as (i) a heavy workload, (ii) differences in pooling protocols across different labs, and (iii) the fact that pooling is inherently more complicated than individual sample testing [50],[15, ‘Results’]. Due to this, there is the possibility of a small number of inadvertent errors in creating the pools. This causes a difference between a few entries of the pre-specified matrix and the actual matrix used for pooling. Note that is known whereas as is unknown in practice. The sparsity of the difference between and is a reasonable assumption, if the technicians are competent. Hence only a small number of group membership specifications contain errors. This issue of errors during pool creation is well documented in several independent sources such as [50],[15, ‘Results’], [13, Page 2], [44], [51, Sec. 3.1], [12, ‘Discussion’], [21, ‘Specific consideration related to SARS-CoV-2’] and [2, ‘Laboratory infrastructure’]. However the vast majority of group testing algorithms — adaptive as well as non-adaptive — do not account for these errors. To the best of our knowledge, this is the first piece of work on the problem of a mismatched pooling matrix (i.e., a pooling matrix that contains errors in group membership specifications) for non-adaptive group testing with real-valued and (possibly) noisy . We emphasize that besides pooled RT-PCR testing, faulty specification of pooling matrices may also naturally occur in group testing in many other scenarios, for example when applied to verification of electronic circuits [29]. Another scenario is in epidemiology [11], for identifying infected individuals who come in contact with agents who are sent to mix with individuals in the population. The health status of various individuals is inferred from the health status of the agents. However, sometimes an agent may remain uninfected even upon coming in contact with an infected individual, which can be interpreted as an error in the pooling matrix.
Related Work: We now comment on two related pieces of work which deal with group testing with errors in pooling matrices via non-adaptive techniques. The work in [11] considers probabilistic and structured errors in the pooling matrix, where an entry with a value of 1 could flip to 0 with a probability , but not vice versa, i.e., a genuinely zero-valued never flips to 1. The work in [35] considers a small number of ‘pretenders’ in the unknown binary vector , i.e., there exist elements in which flip from 1 to 0 with probability , but not vice versa. Both these techniques consider binary valued vectors and , unlike real-valued vectors as considered in this work. They also do not consider noise in in addition to the errors in . Furrthemore, we also present a method to identify the errors in , unlike the techniques in [11, 35]. Due to these differences between our work and [11, 35], a direct numerical comparison between our results and theirs will not be meaningful.
Sensing Matrix Perturbation in Compressed Sensing: There exists a nice relationship between the group testing problem and the problem of signal reconstruction in compressed sensing (CS), as explored in [19, 20]. Likewise, there is literature in the CS community which deals with perturbations in sensing matrices [39, 40, 53, 27, 4, 24, 18]. However, these works either consider dense random perturbations (i.e., perturbations in every entry) [53, 27, 40, 4, 24, 18] or perturbations in specifications of Fourier frequencies [39, 26]. These perturbation models are vastly different from the sparse set of errors in binary matrices as considered in this work. Furthermore, apart from [39, 26], these techniques just perform robust signal estimation, without any attempt to identify rows of the sensing matrix which contained those errors.
Overview of contributions: In this paper, we present a robust approach for recovering from noisy when , given a (known) pre-specified pooling matrix , but where the measurements in have been generated with another unknown pooling matrix , i.e., .
The approach, which we call the Debiased Robust Lasso Test Method or Drlt, extends existing work on ‘debiasing’ the well-known Lasso estimator in statistics [28], to also handle errors in . In this approach, we present a principled method to identify which measurements in correspond to rows with errors in , using hypothesis testing. We also present an algorithm for direct estimation of and a hypothesis test for identification of the defective samples in , given errors in . We establish the desirable properties of these statistical tests such as consistency. Though our approach was initially motivated by pooling errors during preparation of pools of COVID-19 samples, it is broadly applicable to any group-testing problem where the pool membership specifications contain errors.
Notations: Throughout this paper, denotes the identity matrix of size . We use the notation for . Given a matrix , its row is denoted as , its column is denoted as and the element is denoted by . The column of the identity matrix will be denoted as . For any vector and index set , we define such that and . denotes the complement of set . We define the entrywise norm of a matrix as .
Consider two real-valued random sequences and . Then, we say that is if in probability, i.e., for any . Also, we say that is if is bounded in probability, i.e., for any there exist , such that for all .
Organization of the paper: The noise model involving measurement noise and errors in the pooling matrix is presented in Sec. II. Our core technique, Drlt, is presented in Sec. III, with essential background literature summarized in Sec. III-B, and our key innovations presented in Sec. III-C as well as Sec. IV. Detailed experimental results are given in Sec. V. We conclude in Sec. VI. Proofs of all theorems and lemmas are provided in Appendices A,B and C.
II Problem formulation
II-A Basic Noise Model
We now formally describe the model setup used in this paper. Suppose and that the elements of the pooling matrix are independently drawn from in (1). Additionally, let be sparse with at most non-zero elements. Assume that the elements of the noise vector in (1) are independent and identically distributed (i.i.d.) Gaussian random variables with mean and variance . Note that, throughout this work, we assume to be known. The Lasso estimator , used to estimate , is defined as
| (2) |
Given a sufficient number of measurements, the Lasso is known to be consistent for sparse [22, Chapter 11] if the penalty parameter is chosen appropriately and if satisfies the Restricted Eigenvalue Condition (REC)111Restricted Eigenvalue Condition: For some constant and , let . We say that a matrix satisfies the REC if for a constant , we have for every , being the RE constant.. Certain deterministic binary pooling matrices can also be used as in [19, 47] for a consistent estimator of . However, we focus on the chosen random pooling matrix in this paper.
It is more convenient for analysis via the REC, and more closely related to the theory in [28], if the elements of the pooling matrix have mean . Since the elements of are drawn independently from Bernoulli, it does not obey the mean-zero property. Hence, we transform the random binary matrix to a random Rademacher matrix , which is a simple one-one transformation similar to that adopted in [42] for Poisson compressive measurements. (Note that refers to a matrix of size containing all ones.) We also transform the measurements in to equivalent measurements associated with Rademacher matrix .
The expression for each measurement in is now given by:
| (3) |
where . We will henceforth consider for the Lasso estimates in the following manner: The Lasso estimator , used to estimate , is now defined as
| (4) |
II-B Model Mismatch Errors
Consider the measurement model defined in (3). We now examine the effect of mis-specification of samples in a pool. That is, we consider the case where due to errors in mixing of the samples, the pools are generated using an unknown matrix (say) instead of the pre-specified matrix . Note that and are respectively obtained from and . The elements of matrix and are equal everywhere except for the misspecified samples in each pool. We refer to these errors in group membership specifications as ‘bit-flips’. For example, suppose that the pool is specified to consist of samples . But due to errors during pool creation, the pool is generated using samples . In this specific instance, and .
In practice, note that is known whereas is unknown. Moreover, the locations of bit-flips are unknown. Hence they induce signal-dependent and possibly large ‘model mismatch errors’ in the measurement. In the presence of bit-flips, the model in (3) can be expressed as:
| (5) |
We assume , which we call the ‘model mismatch error’ (MME) vector in , to be sparse, and . This implies that at least rows in have bit-flips. The sparsity assumption is reasonable in many applications (e.g., given a competent technician performing pooling).
Suppose for a fixed , contains a bit-flip at index . However, if is then would remain 0 despite the presence of a bit-flip in . Furthermore, such a bit-flip has no effect on the measurements and is not identifiable from the measurements. However, if is non-zero then is also non-zero. Such a bit-flip adversely affects the measurement and we henceforth refer to it as an effective bit-flip or effective MME.
III Debiased Robust Lasso Test (Drlt) Method
We now present our proposed approach, named the ‘Debiased Robust Lasso Test Method’ (Drlt), for recovering the signal given measurements obtained from the erroneous, unknown matrix which is different from the pre-specified, known sensing matrix . The main objectives of this work are:
-
Aim (i):
Estimation of under model mismatch and development of a statistical test to determine whether or not the sample, , is defective/diseased.
-
Aim (ii):
Development of a statistical test to determine whether or not , , contains effective MMEs.
A measurement containing an effective MME will appear like an outlier in comparison to other measurements due to the non-zero values in . Therefore identification of measurements containing MMEs is equivalent to determining the non-zero entries of . This idea is inspired by the concept of ‘Studentised residuals’ which is widely used in the statistics literature to identify outliers in full-rank regression models [36]. Since our model operates in a compressive regime where , the distributional property of studentized residuals may not hold. Therefore, we develop our Drlt method which is tailored for the compressive regime.
Our basic estimator for and from and is given as
| (6) |
where are appropriately chosen regularization parameters. This estimator is a robust version of the Lasso regression [38]. The robust Lasso, just like the Lasso, will incur a bias due to the penalty terms.
The work in [28] provides a method to mitigate the bias in the Lasso estimate and produces a ‘debiased’ signal estimate whose distribution turns out to be approximately Gaussian with specific observable parameters in the compressive regime (for details, see [28] and Sec. III-B below). However, the work in [28] does not take into account errors in sensing matrix specification. We non-trivially adapt the techniques of [28] to our specific application which considers MMEs in the pooling matrix, and we also develop novel procedures to realize Aims (i) and (ii) mentioned above.
We now first review important concepts which are used to develop our method for the specified aims. We subsequently develop our method in the rest of this section. However, before that, we present error bounds on the estimates and from (6), which are non-trivial extensions of results in [38]. These bounds will be essential in developing hypothesis tests to achieve Aims (i) and (ii).
III-A Bounds on the Robust Lasso Estimate
When the sensing matrix is iid Gaussian, upper bounds on and have been presented in [38]. In our case, is i.i.d. Rademacher, and hence some modifications to the results from [38] are required. We now state a theorem for the upper bound on the reconstruction error of both and for a random Rademacher pooling matrix . We further use the so called ‘cone constraint’ to derive separate bounds on the estimates of both and . These bounds will be very useful in deriving theoretical results for debiasing.
Theorem 1
In Lemma. 1 of Sec.A, we show that the chosen random Rademacher pooling matrix satisfies the EREC with if and are chosen as in Theorem 1. Furthermore, .
Remarks on Theorem 1:
-
1.
From part (1), we see that = .
-
2.
From part (2), we see that = .
-
3.
The upper bounds of errors given in Theorem 1 increase with , as well as and , which is quite intuitive. They also decrease with .
III-B A note on the Debiased Lasso
Let us consider the measurement vector from (5), momentarily setting , i.e., we have . Let be the minimizer of the following Lasso problem
| (9) |
for a given value of . Though Lasso provides excellent theoretical guarantees [22, Chapter 11], it is well known that it produces biased estimates, i.e., where the expectation is over different instances of . The work in [28] replaces by a ‘debiased’ estimate given by:
| (10) |
where is an approximate inverse (defined as in Alg. 1) of . Substituting into (10) and treating as approximately equal to the identity matrix, yields:
| (11) |
which is referred to as a debiased estimate, as . Note that is not an invertible matrix as , and hence, the approximate inverse is obtained by solving a convex optimization problem as given by Alg. 1, where the minimization of the diagonal elements of is motivated by minimizing the variance of , as proved in [28, Sec. 2.1]. Furthermore, as proved in [28, Theorem 7], the convex problem in Alg. 1 is feasible with high probability if (where the expectation is taken over the rows of ) obeys some specific statistical properties (see later in this section).
| (12) |
The debiased estimate in (10) obtained via an approximate inverse of using has the following statistical properties [28, Theorem 8]:
| (13) |
Here the second term on the RHS is referred to as the bias vector. Moreover it is proved in [28, Theorem 8] that for sufficiently large , an appropriate choice of in (9) and appropriate statistical assumptions on , the maximum absolute value of the bias vector is . Thus, if , the largest absolute value of the bias vector will be negligible, and thus the debiasing effect is achieved since .
III-C Debiasing in the Presence of MMEs
In the presence of MMEs, the design matrix from (5) plays the role of in Alg. 1. However is partly random and partly deterministic, whereas the theory in [28] applies to either purely random (Theorem 8 of [28]) or purely deterministic (Theorem 6 of [28]) matrices, but not a combination of both. Hence, the theoretical results of [28] do not apply for the approximate inverse of obtained using Alg. 1. Numerical results for the poor performance of ‘debiasing’ (as in (10)) with such an approximate inverse are demonstrated in Sec. V-A.
To produce a debiased estimate of in the presence of MMEs in the pooling matrix, we adopt a different approach than the one in [28]. We define a linear combination of the residual error vectors obtained by running the robust Lasso estimator from (6) via a carefully chosen set of weights, in order to debias the robust Lasso estimates . The weights of the linear combination are represented in the form of an appropriately designed matrix for debiasing and a derived weights matrix for debiasing . We later provide a procedure to design an optimal , as given in Alg. 1.
Given weight matrix , we define a set of modified debiased Lasso estimates for and as follows:
| (14) | |||||
| (15) |
In our work, the matrix does not play the role of from Alg. 1, but instead plays the role of (comparing (14) and (10)). In Theorem 2 below, we show that these estimates are debiased in nature for the choice . Thereafter, in Sec. IV and Theorem 5, using a different choice for via Alg. 2, we show that the resultant tests are superior in comparison to .
Theorem 2
Let be as in (6), , be as in (14), (15) respectively and set . If is , then given that is a random Rademacher matrix and using , we have the following:
-
(1)
Additionally, if , then for any ,
(16) -
(2)
Additionally, if is , then for any ,
(17) where is defined as follows:
(18)
Here denotes the convergence in law/distribution.
Remarks on Theorem 2
- 1.
-
2.
Theorem 2 provides the key result to develop a testing procedure corresponding to Aims (i) and (ii).
-
3.
If is then Lemma 1 implies that the Rademacher matrix satisfies EREC.
-
4.
The condition in Result (1) emerges from (142) and (143), which are based on probabilistic bounds on the singular values of random Rademacher matrices [37]. For the special case where (which is no longer a compressive regime), these bounds are no longer applicable, and instead results such as [45, Thm. 1.2] can be used.
Drlt for : In Aim (i), we intended to develop a statistical test to determine whether a sample in defective or not. Given the significance level , for each , we reject the null hypothesis in favor of when
| (19) |
where is the upper quantile of a standard normal random variable.
Drlt for : In Aim (ii), we intended to develop a statistical test to determine whether or not a pooled measurement is affected by MMEs.
Given the significance level , for each , we reject the null hypothesis in favor of when
| (20) |
A desirable property of a statistical test is that probability of rejecting the null hypothesis when the alternate is true converges to (referred to as a consistent test). Theorem 2 ensures that the proposed Drlts are consistent. In other words, the sensitivity and specificity (as described in Sec. V) of both these tests approach as .
IV Optimal Debiased Lasso Test
It is well known that a statistical test based on a statistic with smaller variance is generally more powerful than that based on a statistic with higher variance [9]. Therefore, we wish to design a weight matrix that reduces the variance of the debiased robust Lasso estimate to construct an ‘optimal’ debiased robust Lasso test. Hence we choose so as to minimize the sum of the asymptotic variances of the debiased estimates . The procedure for the design of is presented in Alg. 2.
Rearranging (14) and (15) followed by some algebra, we obtain the following expressions:
| (21) | |||||
| (22) |
Note that the first term on the RHS of both (21) and (22) is zero-mean Gaussian. The remaining two terms in both equations are bias terms. In order to develop an optimal hypothesis test for the debiased robust Lasso, we show that (i) the variances of the first term on the RHS of (21) and (22) are bounded with appropriate scaling as ; and (ii) the two bias terms in (21) and (22) go to in probability as . In such a situation, the sum of the asymptotic variance of the elements of will be .
| subject to | ||||
Theorem 3 (given below) establishes that the second and third term on the RHS of both (21) and (22) go to in probability. We design which minimizes the
expression subject to constraints on which are summarized in Alg. 2.
The values of are selected in such a way that each of the constraints in Alg. 2 holds with high probability for the choice , as will be formally established in Lemma 5. These constraints are derived from Theorem 3 and ensure that the bias terms go to . In particular, the constraint ( via ) controls the rate of convergence of bias terms on the RHS of (21), whereas the constraint (via ) controls the rate of convergence of bias terms on RHS of (22). Furthermore, the constraint ensures that the asymptotic variance of the first term on RHS of (22) converges. Essentially, the choice helps us establish that the set of all possible matrices which satisfy the constraints in Alg. 2 is non-empty with high probability. Finally, Theorem 4 establishes that the variances of the first term on the RHS of (21) and (22) converge. These theorems play a vital role in deriving Theorem 5 that leads to developing the optimal debiased robust Lasso tests.
Theorem 3
Now, note that the variance-covariance matrix of the first terms of the RHSs of (22) and (21), respectively, are
| (27) | |||||
| (28) |
Theorem 4 shows that when is chosen as per Alg. 2, the element-wise variances of the first term of the RHS of (21) (diagonal elements of ) approach in probability. The constraints and of Alg. 2 are mainly used to establish this theorem. Further, for the optimal choice of as in Alg. 2, we show that the element-wise variances of the first term of the RHS of (22) (diagonal elements of ) goes to in probability. To establish this, we use the constraint of Alg. 2.
Theorem 4
When we choose an optimal as per the Alg. 2, the equations (21) and (22) along with Theorem 3 and Theorem 4 can be used to derive the asymptotic distribution of and . This is accomplished in Theorem 5, which can be viewed as a non-trivial extension of Theorem 2 for such an optimal choice of .
Theorem 5
Theorem 5 paves a way to develop an optimal Drlt for Aim (i) and (ii) of this work along a similar line of development as the Drlt.
Optimal Drlt for :
As in Drlt for , we now present a hypothesis testing procedure for an optimally designed to determine defective samples based on Theorem 5. As before, given we reject the null hypothesis in favor of , for each
when
| (33) |
where is as in (19).
Optimal Drlt for : As in Drlt for , we develop a hypothesis testing procedure corresponding to optimal to determine whether or not a measurement in is affected by effective MMEs based on Theorem 5. As before, given , for , we reject the null hypothesis in favor of when
| (34) |
Similar to the Drlts in (19) and (20), Theorem 5 ensures that the proposed Optimal Drlts are consistent size tests. This implies that the sensitivity and specificity of both these tests approach as . In Section V, we show that the Optimal Drlt is superior to Drlt in finite sample scenarios.
V Experimental Results
Data Generation: We now describe the method of data generation for our simulation study. We synthetically generated signals (i.e., ) with elements in each. For the non-zero values of , 40 were drawn i.i.d. from and the remaining 60 were drawn i.i.d. from , and were placed at randomly chosen indices. The elements of the pooling matrix were drawn i.i.d. from , thereby producing where is Rademacher distributed. In order to generate effective bit-flips, sign changes were induced in an adversarial manner in randomly chosen rows of and at column indices corresponding to the non-zero locations of . This yielded the perturbed matrix , produced via an adversarial form of the model mismatch error (MMEs) for bit-flips which will be described in the following paragraph.
Define the fractions , . We chose the noise standard deviation to be a fraction
of the mean absolute value of the noiseless measurements, i.e., we set where . For different simulation scenarios, different values of (via ), (via ), noise standard deviation (via ) and number of measurements were chosen, as will be described in the following paragraphs.
Choice of Model Mismatch Error:
In our work, all MMEs were generated in the following manner. A bit-flipped pool (measurement as described in (5)) contains exactly one bit-flip at a randomly chosen index. Suppose that the pool (measurement) contains a bit-flip. Then exactly one of the following two can happen: (1) some sample that was intended to be in the pool (as defined in ) is excluded, or (2) some sample that was not intended to be part of the pool (as defined in ) is included. These two cases lead to the following changes in the row of (as compared to the row of ), and in both cases the choice of is random uniform: Case 1: but , Case 2: but . Note that under this scheme, the generated bit-flips may not be effective. Hence MMEs need to be applied in adversarial setting by inducing bit-flips only at those entries in any row of corresponding to column indices with non-zero values of .
Choice of Regularization Parameters: The regularization parameters and were chosen such that and was from the range in the following manner: We first identified values of and such that the Lilliefors test [32] confirmed the Gaussian distribution for both and (see Odrlt as in (33) and (34)) at the 1% significance level, for at least 70% of (coordinates of ) and (coordinates of ). Out of these chosen values, we determined the value of that minimized the average cross-validation error over 10 folds. In each fold, 90% of the measurements (denoted by a sub-vector corresponding to sub-matrix ) were used to obtain () via the robust Lasso, and the remaining 10% of the measurements (denoted by a sub-vector corresponding to measurements generated by the sub-matrix ) were used to estimate the cross-validation error . Note that is a sub-matrix of the identity matrix which samples only some elements of and hence of . The cross-validation error is known to be an estimable quantity for the mean-squared error [52], which justifies its choice as a method for parameter selection.
Evaluation Measures of Hypothesis Tests: Many different variants of the Lasso estimator were compared empirically against each other as will be described in subsequent subsections. Each of them were modeled and solved using the CVX package in MATLAB.
Results for the hypothesis tests (given in (19),(20),(33) and (34)) are reported in terms of sensitivity and specificity (defined below). The significance level of these tests is chosen at . Consider a binary signal with elements. In our simulations, a sample at index in is declared to be defective if the hypothesis test is rejected, in which case we set . In all other cases, we set . We declare an element to be a true defective if and , and a false defective if but . We declare it to be a false non-defective if but , and a true non-defective if and . The sensitivity for is defined as ( true defectives)/( true defectives + false non-defectives) and
specificity for is defined as ( true non-defectives)/( true non-defectives + false defectives). We report the results of testing for the debiased tests using: (i) corresponding to Drlt (see (19) and (20)), and (ii) the optimal using Alg. 2 corresponding to Odrlt (see (33) and (34)).
V-A Results with Baseline Debiasing Techniques in the Presence of MMEs
We now describe the results of an experiment to show the impact of Odrlt (33) in the presence of MMEs induced in . We compare Odrlt with the baseline hypothesis test for as defined by [28], which is equivalent to ignoring MMEs (i.e., setting in (5)). Considering the presence of MMEs, we further compare Odrlt with the baseline test defined in [28] which would use the approximate inverse of the augmented sensing matrix as obtained from Alg. 1 with . Moreover, the theoretical results established in [28] hold for completely random or purely deterministic sensing matrices, whereas the sensing matrix corresponding to the MME model, i.e., , is partly random and partly deterministic. We now describe these two chosen baseline hypothesis tests for in more detail.
- 1.
-
2.
Baseline considering MMEs: (Baseline-2) In this approach, we consider the MMEs which is equivalent to the sensing matrix as and signal vector . The ‘debiased’ estimate of in this approach is given as:
(36) where and is the approximate inverse of obtained from Alg. 1. Then is obtained by extracting the first elements of . In this approach, we reject the null hypothesis in favor of , for each when .
For these baseline approaches, the regularization parameter was chosen using cross validation. We chose the value which minimized the validation error with of the measurements used for reconstruction and the remaining used for cross-validation.
| Sensitivity - Baseline-1 | Sensitivity-Baseline-2 | Sensitivity-Odrlt | Specificity-Baseline-1 | Specificity-Baseline-2 | Specificity-Odrlt | |
| 100 | 0.522 | 0.602 | 0.647 | 0.678 | 0.702 | 0.771 |
| 200 | 0.597 | 0.682 | 0.704 | 0.832 | 0.895 | 0.931 |
| 300 | 0.698 | 0.802 | 0.878 | 0.884 | 0.915 | 0.963 |
| 400 | 0.791 | 0.834 | 0.951 | 0.902 | 0.927 | 0.999 |
| 500 | 0.858 | 0.894 | 0.984 | 0.923 | 0.956 | 1 |
In Table I, we compare the average values (over instances of measurement noise) of Sensitivity and Specificity of Baseline-1, Baseline-2 and Odrlt for different values of varying in and . It is clear from Table I, that for all the values of , the Sensitivity and Specificity value of Odrlt is higher as compared to that of Baseline-1 and Baseline-2. The performance of Baseline-2 dominates Baseline-1 which indicates that ignoring MMEs may lead to misleading inferences in small sample scenario. Furthermore, the Sensitivity and Specificity of Odrlt approaches 1 as increases. This highlights the superiority of our proposed technique and its associated hypothesis tests over two carefully chosen baselines. Note that there is no prior literature on debiasing in the presence of MMEs, and hence these two baselines are the only possible competitors for our technique.
V-B Empirical verification of asymptotic results of Theorem. 5
In this subsection, we compare the empirical distribution of and , for the optimal weight matrix , with its asymptotic distribution as derived in Theorem. 5. We chose , , and . The measurement vector was generated with a perturbed matrix containing effective bit-flips generated using MMEs as described above. Here, and were computed for runs across different noise instances in .
The left sub-figure of Fig. 1 shows plots of the quantiles of a standard normal random variable versus the quantiles of based on runs for each in different colors. A straight line passing through the origin is also plotted (black solid line) as a reference. These different quantile-quantile (QQ) plots corresponding to , all super-imposed on one another, indicate that the quantiles of the are close to that of standard normal distribution in the range of (thus covering range of the area under the standard bell curve) for defective as well as non-defective samples. This confirms that the distribution of the are each approximately even in this chosen finite sample scenario. Similarly, the right sub-figure of Fig. 1 shows the QQ-plot corresponding to for each in different colors. As before, these different QQ-plots, one for each , all super-imposed on one another, indicate that the are also each approximately standard normal, with or without MMEs.


V-C Sensitivity and Specificity of Odrlt and Drlt for
We performed experiments to study sensitivity and specificity of Drlt and Odrlt for . In experimental setup E1, we varied with fixed values . In E2, we varied from 200 to 500 in steps of 50 with . In E3, we varied with . In E4, we varied with . The experiments were run 100 times across different noise instances in , for the same signal (in E1, E2 and E3) and sensing matrix (in E1, E3 and E4). In E4, the sparsity of the signal varies, therefore, the signal vector also varies. Similarly, in E2 as varies, the sensing matrix also varies.
The empirical sensitivity and specificity of a test was computed as follows. The estimate was binarized to create a vector such that for all , the value of was set to 1 if Drlt or Odrlt rejected the hypothesis , and was set to 0 otherwise. Likewise, a ground truth binary vector was created which satisfied at all locations where and otherwise. Sensitivity and specificity values were computed by comparing corresponding entries of and . The sensitivity of Drlt and Odrlt test for averaged over 100 runs of different instances is reported in Fig. 2 for the different experimental settings E1, E2, E3, E4. Under setup E2, the sensitivity plot indicates that the sensitivity of Drlt and Odrlt increases as increases. Under setups E1, E3, and E4, the sensitivity of both Drlt and Odrlt is reasonable even with larger values of , , and (which are difficult regimes). In Fig. 2, we compare the sensitivity of Drlt and Odrlt to that of Robust Lasso from (6) without any debiasing step, which is abbreviated as Rl. To determine defectives and non-defectives for the Rl method, we adopted a thresholding strategy where an estimated element was considered defective (resp. non-defective) if its value was greater than or equal to (resp. less than) a threshold . The optimal value of was chosen clairvoyantly (i.e., assuming knowledge of the ground truth signal vector ) using Youden’s index which is the value that maximises . Furthermore, Fig. 2 indicates that the sensitivity of Odrlt is superior to that of Rl and Drlt with Drlt also slightly better than Rl. Note that, in practice, a choice of the threshold for Rl would be challenging and require a representative training set, whereas Drlt and Odrlt do not require any training set for the choice of such a threshold.


V-D Identification of Defective Samples in
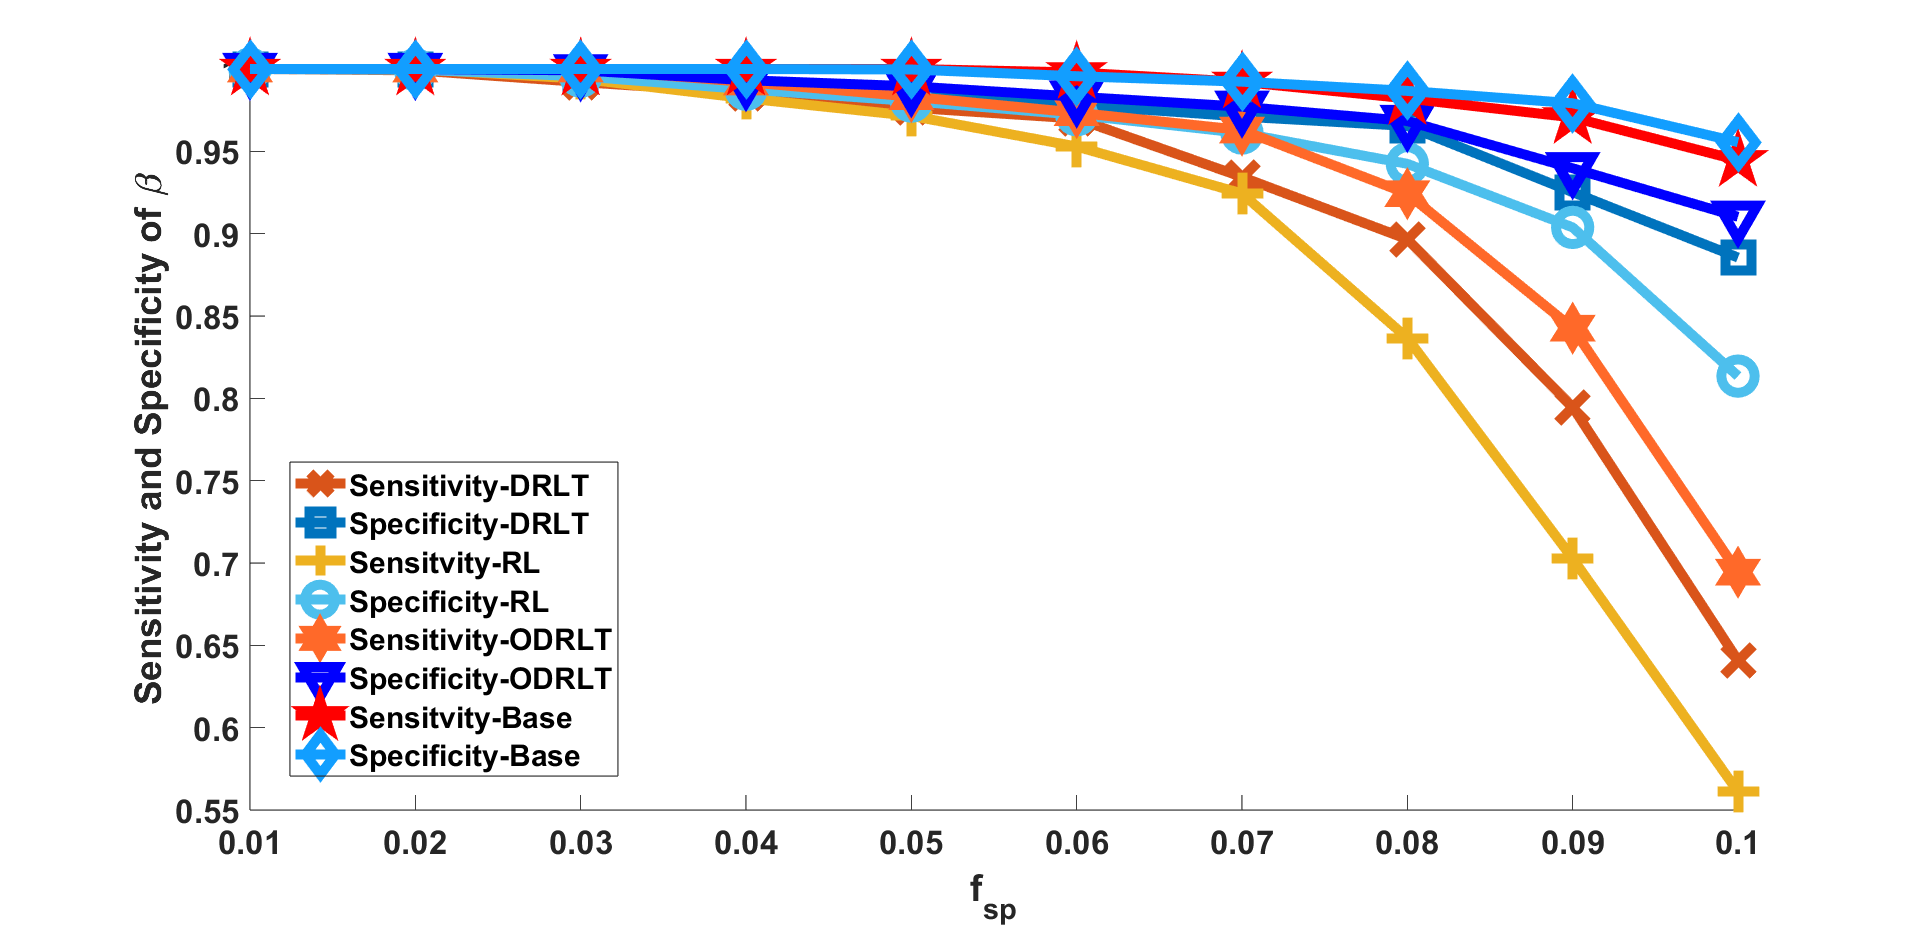
In the next set of experimental results, we first examined the effectiveness of Drlt and Odrlt to detect defective samples in in the presence of bit-flips in induced as per adversarial MMEs. We compared the performance of Drlt and Odrlt to two other closely related algorithms to enable performance calibration: (1) Robust Lasso (Rl) from (6) without debiasing; (2) A hypothesis testing mechanism on a pooling matrix without model mismatch, which we refer to as Baseline-3. In Baseline-3, we generated measurements with the correct pooling matrix (i.e., ) and obtained a debiased Lasso estimate as given by (11). (Note that Baseline-3 is very different from Baseline-1 and Baseline-2 from Sec. V-A as in this approach .) Using this debiased estimate, we obtained a hypothesis test similar to Odrlt. In the case of Rl, the decision regarding whether a sample is defective or not was taken based on a threshold that was chosen as the Youden’s index on a training set of signals from the same distribution. The regularization parameters were chosen separately for every choice of parameters and .
We examined the variation in sensitivity and specificity with regard to change in the following parameters, keeping all other parameters fixed: (EA) the number of bit-flips in the matrix expressed as a fraction of ; (EB) number of pools ; (EC) noise standard deviation expressed as a fraction of the quantity defined in Sec. V-B; (ED) sparsity ( norm) of vector expressed as fraction of signal dimension . For the bit-flips experiment i.e., (EA), was varied in with . For the measurements experiment (EB), was varied over with . For the noise experiment (i.e., (EC), we varied in with . For the sparsity experiment (i.e., (ED), was varied in with .
The Sensitivity and Specificity values, averaged over 100 noise instances, for all four experiments are plotted in Fig. 3. The plots demonstrate the superior performance of Odrlt over Rl and Drlt. Furthermore, the performance of Drlt is also superior to Rl. In all regimes, Baseline performs best as it uses an error-free sensing matrix. We also see that for higher , lower and lower , the sensitivity and specificity for Odrlt comes very close to that of Baseline.


V-E RRMSE Comparison of Debiased Robust Lasso Techniques to Baseline Algorithms


We computed estimates of using the debiased robust Lasso technique in two ways: (i) with the weights matrix , and (ii) the optimal as obtained using Alg. 2. We henceforth refer to these estimators as Debiased Robust Lasso (Drl) and Optimal Debiased Robust Lasso (Odrl) respectively.
We computed the relative root mean squared error (RRMSE) for Drl and Odrl as follows: First, the pooled measurements with MMEs were identified as described in Sec. V-C and then discarded. From the remaining measurements, an estimate of was obtained using robust Lasso with the optimal chosen by cross-validation. Given the resultant estimate , the RRMSE was computed as .
We compared the RRMSE of Drl and Odrl to that of the following algorithms:
-
1.
Robust Lasso or Rl from (6).
-
2.
Lasso (referred to as L2) based on minimizing with respect to . Note that this ignores MMEs.
-
3.
An inherently outlier-resistant version of Lasso which uses the data fidelity (referred to as L1), based on minimizing with respect to .
-
4.
Variants of L1 and L2 combined with the well-known Ransac (Random Sample Consensus) framework [16] (described below in more detail). The combined estimators are referred to as Rl1 and Rl2 respectively.
Ransac is a popular randomized robust regression algorithm, widely used in computer vision [17, Chap. 10]. We apply here to the signal reconstruction problem considered in this paper. In Ransac, multiple small subsets of measurements from are randomly chosen. Let the total number of subsets be . Let the set of the chosen subsets be denoted by . From each subset , the vector is estimated, using either L2 or L1. Every measurement is made to ‘cast a vote’ for one of the models from the set . We say that measurement (where ) casts a vote for model (where ) if for . Let the model which garners the largest number of votes be denoted by , where . The set of measurements which voted for this model is called the consensus set. Ransac when combined with L2 and L1 is respectively called Rl2 and Rl1. In Rl2, the estimator L2 is used to determine using measurements only from the consensus set. Likewise, in Rl1, the estimator L1 is used to determine using measurements only from the consensus set.
Our experiments in this section were performed for signal and sensing matrix settings identical to those described in Sec. V-D. The performance in all experiments was measured using RRMSE, averaged over reconstructions from 100 independent noise runs. For all techniques, the regularization parameters were chosen using cross-validation following the procedure in [52]. The maximum number of subsets for finding the consensus set in Ransac was set to with measurements in each subset. RRMSE plots for all competing algorithms are presented in Fig. 4, where we see that Odrl and Drl outperformed all other algorithms for all parameter ranges considered here. We also observe that Odrl produces lower RRMSE than Drl, particularly in the regime involving higher .
VI Conclusion
We have presented a technique for determining the sparse vector of health status values from noisy pooled measurements in , with the additional feature that our technique is designed to handle bit-flip errors in the pooling matrix. These bit-flip errors can occur at a small number of unknown locations, due to which the pre-specified matrix (known) and the actual pooling matrix (unknown) via which pooled measurements are acquired, differ from each other. We use the theory of Lasso debiasing as our basic scaffolding to identify the defective samples in , but with extensive and non-trivial theoretical and algorithmic innovations to (i) make the debiasing robust to model mismatch errors (MMEs), and also to (ii) enable identification of the pooled measurements that were affected by the MMEs. Our approach is also validated by an extensive set of simulation results, where the proposed method outperforms intuitive baseline techniques. To our best knowledge, there is no prior literature on using Lasso debiasing to identify measurements with MMEs.
There are several interesting avenues for future work:
-
1.
Currently the optimal weights matrix is designed to minimize the variance of the debiased estimates of and not necessarily those of . Our technique could in principle be extended to derive another weights matrix to minimize the variance of the debiased estimates of .
-
2.
A specific form of MMEs consists of unknown permutations in the pooling matrix (also called ‘permutation noise’ [51]) where the pooled results are swapped with one another. The techniques in this paper can be extended to identify pooled measurements that suffer from permutation noise, and potentially correct them. These results, which will be reported elsewhere, are an interesting contribution to the growing sub-area of ‘unlabelled sensing’ [41].
-
3.
Our technique is based on work in [28], which requires that . This is a stronger condition that which is common in sparse regression. However in the literature on Lasso debiasing, there exist techniques such as [7] which relax the condition on to allow for , with the caveat that a priori knowledge of is (provably) essential. Incorporating these results within the current framework is another avenue for future research. It is also of interest to combine our results with those on in situ estimation of from pooled or compressed measurements as in [43, 33].
Appendix A Proofs of Theorems and Lemmas on Robust Lasso
We extend Theorem 1 and Lemma 1 of [38] to prove our Theorem 1. We re-parameterize model (5) and the robust Lasso optimisation problem (6) to match those in [38], i.e.,
| (37) |
where . Note that the optimization problem (6) is
where . The equivalent robust Lasso optimization problem for the model (37) is given by:
| (38) |
where . In order to prove Theorem 1, we first recall the Extended Restricted Eigenvalue Condition (EREC) for a sensing matrix from [38]. Given and , let us define sets
| (39) |
Note that .
Definition 1
Extended Restricted Eigenvalue Condition (EREC) [38]: Given as defined in (39), and , an matrix is said to satisfy the EREC if there exists a such that
| (40) |
for all with and where is defined as follows:
| (41) |
Here, and are and dimensional vectors extracted from and respectively, restricted to the set and as defined in (39).
In Lemma. 1, we extend Lemma 1 from [38] to random Rademacher matrices. In this lemma we show that a random Rademacher matrix satisfies EREC with high probability for .
Lemma 1
Let be an matrix with i.i.d. Rademacher entries. There exist positive constants such that if and then
where and as in (41).
Proof of Lemma 1: Using a similar line of argument as in the proof of Lemma 1 of [38], it is enough to show the following two properties of the sensing matrix to complete the proof.
-
1.
Lower bound on . For some with high probability,
(42) -
2.
Mutual Incoherence: The column space of the matrix is incoherent with the column space of the identity matrix. For some with high probability,
(43)
By using (42) and (43), we have, with high probability,
The proof is completed if . We now show that (42) and (43) hold together with for a Rademacher sensing matrix .
We now state two important facts on the Rademacher matrix which will be used in proving (42) and (43) respectively.
-
(1)
We use a result following Lemma 1 [31] (see the equation immediately following Lemma 1 in [31], and set in that equation to the identity matrix, since we are concerned with signals that are sparse in the canonical basis). Using this result, there exist positive constants , such that with probability at least :
(44) -
(2)
From Theorem 4.4.5 of [49], for a dimensional Rademacher matrix , there exists a constant such that, for any , with probability at least we have
(45)
Throughout this proof, we take the constants and , where are as defined in (44) and (45) respectively.
Proof of (42): We first obtain a lower bound on using (44). For every , we have:
| (46) |
Substituting (46) in (44), we obtain that, with probability at least , for every :
| (47) |
Under the assumption , the first term in the brackets of (47) is greater than . Again, under the assumption , the second term is greater than . Thus we have, . Squaring both sides, we have, . Using the fact that for any vectors , we have, . Hence we have with probability at least , for every
| (48) |
Therefore, we have completing the proof of (42).
Proof of (43): This part of the proof directly follows the proof of Lemma 2 in [38], with a few minor differences in constant factors. Nevertheless, we are including it here to make the paper self-contained.
Divide the set into subsets of size each, such that the first set contains largest absolute value entries of indexed by , the set contains largest absolute value entries of the vector , contains the second largest absolute value entries of , and so on. By the same strategy, we also divide the set into subsets such that the first set contains entries of indexed by and sets are of size . We have for every ,
| (49) | ||||
| (50) |
Note that (a submatrix of containing rows belonging to and columns belonging to ) is itself a Rademacher matrix with i.i.d. entries. Taking the union bound over all possible values of and , we have that the inequality in (45) holds with probability at least . If we obtain, . Furthermore, if we assume, , we have . Later we will give a choice of which ensures that these conditions are satisfied. Therefore, we obtain with probability at least ,
| (51) |
Using the first inequality in the last equation of Section 2.1 of [8] we obtain . Furthermore, for every , we have . Hence,
Following a similar process we obtain . Furthermore, for every , we have . Since ,
Hence, joining (51) , (45) into (49), we obtain with probability at least , for every
| (52) |
Recall that , by assumption. Taking leads to and . Thus, we obtain with probability at least for every ,
| (53) |
Let . Recall that, . Then implies . Furthermore,
| (54) |
Therefore, we have with probability at least , for every
| (55) |
This completes the proof of (43).
Now, from (48) and (55), using a union bound, we obtain with probability at least ,
| (56) |
Taking and , we have .
Note that, we have, . Taking the root over (56), we obtain with probability at least ,
This completes the proof of the lemma.
A-A Proof of Theorem 1
Proof of (7): We now derive the bound for the norm of the robust lasso estimate of the error given by the optimisation problem (6). Recall that, we have and . We choose . We use to define the cone constraint in (41). Note that, in the proof of Theorem 1 of [38], it is shown that and satisfies the cone constraint given in (41). Therefore, we have
| (57) |
Now by using Eqn. (57), we have
| (58) |
Here, the last inequality of Eqn.(58) holds since and . Note that, . Based on the values of , we have since . Hence, by using Eqn.(58), we have
| (59) |
Recall that, and in Theorem 1 of [38]. Therefore, by the equivalence of the model given in (37) and the optimisation problem in (6) with that of [38], we have
| (60) |
as long as
| (61) |
Therefore when (61) holds, then by using (59) (recall ) and (60), we have
| (62) |
We will now bound the probability that and using the fact that is Gaussian. By using Lemma 7 in Appendix C which describes the tail bounds of the Gaussian vector, we have
| (63) | |||
| (64) |
Using (63),(64) with Bonferroni’s inequality in (62), we have:
| (65) |
This completes the proof of (7).
Proof of (8):
We now derive an upper bound of . We approach this by showing that given the optimal estimate of , we can obtain a unique estimate of using (67). We then derive the upper bound on using the Lasso bounds given in [22].
Expanding the terms in (5), we obtain:
| (66) |
Given the optimal solutions and of (6), can also be viewed as
| (67) |
Thus (67) can also be viewed as Lasso estimator for , where and with being -sparse. By using Theorem 11.1(b) of [22] , we have if ,
| (68) |
where is the Restricted eigenvalue constant of order which equals one for . Now using the result in Lemma 11.1 of [22], when , then
Therefore by using (68) when , we have
| (69) | |||||
Therefore we now show that (i.e., ) holds with high probability. Now, by Lemma 6 and the triangle inequality, we have
By using Lemma 7 in Appendix C, we have the following:
| (70) |
Since , by using (65), we have
| (71) |
Since , we have . Thus
| (72) |
We now put (72) in (69) to obtain:
| (73) |
This completes the proof.
Appendix B Proofs of Theorems and Lemmas on Debiased Lasso
B-A Proof of Theorem 2
Note that we have chosen . Now, recall the expression for from (14) and model as given in (5), we have
| (74) |
In Lemma 2, (78) and (79) show that the second and third term on the RHS of (74) are negligible as , increases in probability. Therefore, in view of Lemma 2, we have
| (75) |
where denotes the column of matrix . Given , by using the Gaussianity of , the first term on the RHS of (75) is a Gaussian random variable with mean and variance . Since , the first term on the RHS is . This completes the proof of result (1) of the theorem.
We now turn to result (2) of the theorem. By using a similar decomposition argument as in the case of in (74) and using the expression of in (15), we have
| (76) |
We have . From (80) and (81) of Lemma 2, the second and third terms on the RHS of (76) are both . Therefore, using Lemma 2, we have for any
| (77) |
As is Gaussian, the first term on the RHS of (77) is a Gaussian random variable with mean and variance .
In Lemma 3, we show that converges to in probability if is a Rademacher matrix. This implies that the second term on the RHS of (77) is . This completes the proof of result (2).
Lemma 2
Let be as in (6) and set . Given is a Rademacher matrix, if is and is , then as we have following:
| (78) | |||||
| (79) | |||||
| (80) | |||||
| (81) |
Proof of Lemma 2:
When is , the assumptions of Lemma 1 are satisfied. Hence, the Rademacher matrix satisfies the assumptions of Theorem 1 with probability that goes to as . Therefore, to prove the results, it suffices to condition on the event that the conclusion of Theorem 1 holds.
Proof of (78): Using result (4) of Lemma 6, we have:
| (82) |
From result (1) of Lemma 5, result (1) of Theorem 1, and result (5) of Lemma 6 , we have,
| (83) |
Under the assumption is , we have:
| (84) |
Proof of (79): Again by using result (4) of Lemma 6, we have
Since is a Rademacher matrix, we have, . From result (2) of Theorem 1 and result (5) of Lemma 6, we have
| (85) |
As , we have
| (86) |
Proof of (80): Again using result (4) of Lemma 6, we have,
| (87) |
By using result (5) of Lemma 6, result (1) of Theorem 1 and result (2) of Lemma 5, we have
| (88) | |||||
Since is and is , (88) becomes as ,
| (89) |
Proof of (81): Using result (4) of Lemma 6, we have,
| (90) |
Since is a Rademacher matrix, the elements of lie between and . Therefore, . By using part (5) of Lemma 6 and result (2) of Theorem 1, we have
| (91) |
Since is , we have
| (92) |
This completes the proof.
Lemma 3
Let be a Rademacher matrix and be as defined in (18). If is , we have as for any ,
| (93) |
Proof of Lemma 3: Recall that from (18), . Note that for , we have
| (94) | |||||
In (94), since the second term is positive, we have
| (95) |
We have from Result (3) of Lemma 5, for ,
| (96) |
By using (96), we have
| (97) | |||||
The last inequality comes using Bonferroni’s inequality which states that for any events . Therefore by using (94) and (97), we have
| (98) |
By using (95) and (98), we have
| (99) |
Since is , as , and . This completes the proof.
Now we proceed to the results involving debiasing using the optimal weights matrix obtained from Alg. 2. The proofs of these results largely follow the same approach as that for (i.e. Theorem 2). However there is one major point of departure—due to differences in properties of the weights matrix designed from Alg. 2 (given in Lemma 4), as compared to the case where (given in Lemma 5).
B-B Proof of Theorem 3
Proof of (23): Using Result (4) of Lemma 6, we have
| (100) |
Using Result (2) of Lemma 4, Result (1) of Theorem 1 and Result (5) of Lemma 6, we have
| (101) |
If is , we have:
| (102) |
Proof of (24): Using Result (4) of Lemma 6, we have
Using Result (3) of Lemma 4, Result (2) of Theorem 1 and Result (5) of Lemma 6, we have
| (103) |
Proof of (25): Using Result (4) of Lemma 6, we have
| (104) |
Using Result (4) of Lemma 4, Result (1) of Theorem 1 and Result (5) of Lemma 6, we have
| (105) | |||||
Since is and is , we have
| (106) |
Proof of (26): Using Result (4) of Lemma 6, we have
| (107) |
Using Result (5) of Lemma 4, Result (2) of Theorem 1 and Result (5) of Lemma 6, we have
| (108) | |||||
Since is , we have
| (109) |
This completes the proof.
B-C Proof of Theorem 4
Result(1): Recall that is the output of Alg. 2, , and . We will derive the lower bound of for all following the same idea as in the proof of Lemma 12 of [28]. Note that, . For all , from (134) of result (2) of Lemma 4, for any feasible with probability at least , we have
For any feasible of Alg.2, we have for any ,
We obtain the last inequality by putting which makes the square term 0. The rightmost equality is because . The lower bound on the RHS is maximized for . Plugging in this value of , we obtain the following with probability atleast :
Hence, from the above equation and (129), we obtain the lower bound on for any as follows:
| (110) |
Furthermore from Result (1) of Lemma. 4, we have
| (111) |
We use (111) to get, for any , . As , we have for any :
| (112) |
Using (112) with (110), we obtain for any ,
Now under the assumption is , . Hence, we have, . This completes the proof of Result (1).
Result (2):
Recall that .
Now in order to obtain the upper and lower bounds for for any , we use Result (6) of Lemma. 4.
We have,
| (113) |
We have for ,
| (114) | |||||
Let . Note that, for ,
| (115) |
Hence from (115), we have
| (116) | |||||
We have, from (113),
Therefore using (116), we have
| (117) |
Using (117) in (114) yields the following inequality with probability at least ,
Therefore the lower bound on is as follows:
| (118) |
We need to now derive an upper bound on . By the same argument as before, we have from (113)
Again for , . We have from (113),
Now from (114), we have
The last inequality holds with probability at least . Hence, we have
| (119) |
Using (119) with (118), we obtain the following using the union bound, for all ,
Therefore, under the assumption is , we have, and . Hence, we have . This completes the proof.
B-D Proof of Theorem 5
Let be the output of Alg. 2. Using the definition of from (14) and the measurement model from (5), we have
| (120) |
Using Results (1) and (2) of Theorem 3, the second and third term on the RHS of (120) are . Recall that . Therefore, we have
| (121) |
where denotes the column of matrix . As is Gaussian, the first term on the RHS of (121) is a Gaussian random variable with mean and variance . Using Result (1) of Theorem 4, converges to in probability. This completes the proof of Result (1).
Using (15) and the measurement model (5), we have
| (122) |
Using Results (3) and (4) of Theorem 3, the second and third term on the RHS of (76) are both . Recall from (28), that . Therefore, we have
| (123) |
As is Gaussian, the first term on the RHS of (123) is a Gaussian random variable with mean and variance . Using Result (2) of Theorem 4, converges to in probability so that . This completes the proof of result (2).
Lemma 4
Let be a Rademacher matrix and be the corresponding output of Alg. 2. If is , we have the following results:
-
(1)
.
-
(2)
= .
-
(3)
.
-
(4)
= .
-
(5)
.
-
(6)
.
Proof of Lemma. 4:
In order to prove these results, we will first show that the intersection event of the constraints of Alg. 2 is non-null with probability at least as the solution is in the feasible set. This will show that the feasible region of the optimisation problem given in Alg. 2 is non-empty.
Let us first define the following sets:
, ,
,
, where, , and . Note that, here is a Rademacher matrix. We will now state the probabilities of the aforementioned sets.
From (149) of Lemma 5, we have
| (124) |
Again from (155) of Lemma 5, we have
| (125) |
Similarly from (157) of Lemma 5, we have
| (126) |
Lastly, since is Rademacher, . Therefore, we have,
| (127) |
Note that, . Therefore, we obtain, . Hence,
| (128) |
Therefore, satisfies the constraints of Alg.2 with high probability. This implies that there exists that satisfies the constraints.
Let
Hence, we have
| (129) |
Given that the set of feasible solutions is non-null, we can say that the optimal solution of Alg. 2 denoted by satisfies the constraints of Alg. 2 with probability .
Result (1):
Recall that the event that there exists a point satisfying constraints – is .
We have
| (130) | |||||
If there exists a feasible solution to – then . Therefore, we have
| (131) |
Now, we have from Alg. 2, if the constraints of the optimisation problem are not satisfied, then we choose as the output. This event is given by . Now, we know that for Rademacher matrix , with probability 1. Therefore, we have
| (132) |
Therefore, we have from (131),(132) and (130),
| (133) |
Result (2): Recall that . Note that we have for any two events , . Therefore, we have,
The last inequality comes from (129). Since is a feasible solution, given , it will satisfy the second constraint of Alg. 2 with probability 1. This means that
Therefore we have,
| (134) |
Since , we have, .
Result (3):
From (133), we have that, for each , with probability .
Note that for any vector , , we have for every , with probability .
Since with probability 1.
Therefore, we have
| (135) |
Result (4): Recall that . Therefore, we have
The last inequality comes from (129). Note that, since is a feasible solution, given , it will satisfy the third constraint of Alg. 2 with probability 1. This implies
Therefore, we have,
| (136) |
Hence, we have, = .
Result (5):
Recall that from Eqn.(129), we have with probability at least ,
Applying triangle inequality, we have with probability atleast ,
| (137) |
We now present some useful results about the norms being used in this proof. Let be a matrix and be a matrix . Recall the following definitions from [48],
Note that 222This is because (by the definition of the induced norm) .. Since and for all , we have
| (138) |
Then by using (138), we have
| (139) |
Substituting and , the Moore-Penrose pseudo-inverse of , in (139), we obtain:
| (140) |
We now derive the upper bound for the second factor of (140). We have,
| (141) |
Note that, for an arbitrary , using Theorem 1.1. from [37] for the mean-zero sub-Gaussian random matrix , we have the following
| (142) |
where and are constants dependent on the sub-Gaussian norm of the entries of . Let for some small constant , we have
| (143) |
we have
| (144) |
Using Eqns. (144) and (137), we have
Therefore we have by Bonferroni’s inequality,
Under the condition as , the probability . Therefore, we have,
| (145) |
Result (6): Recall that . We have,
The last inequality comes from (129). Note that, since is a feasible solution, given , it will satisfy the fourth constraint of Alg. 2 with probability 1. This implies that:
which yields:
| (146) |
Since, goes to as , the proof is completed.
Appendix C Lemma on properties of
Lemma 5
Let be a random Rademacher matrix. Then the following holds:
-
1.
= .
-
2.
.
-
3.
If , then .
Proof of Lemma 5, [Result (1)]: Let . Note that elements of matrix satisfies the following:
| (147) |
Therefore, we now consider off-diagonal elements of (i.e., ) for the bound. Each summand of is uniformly bounded since the elements of are . Note that . Furthermore, for , each of the summands of are independent since the elements of are independent. Therefore, using Hoeffding’s Inequality (see Lemma 1 of [34]) for ,
Therefore we have
| (148) |
Putting in (148), we obtain:
| (149) |
Thus, we have:
| (150) |
This completes the proof of Result (1).
Result (2): Note that,
| (151) |
Fix and , and consider
By splitting the sum over into the terms where and the term where , and simplifying by using the fact that for all , we obtain
Next we split the sum over into the terms where and the term where to obtain
| (152) |
If we condition on and , the random variables for and are independent, have mean zero, and are bounded between and . Therefore, by Hoeffding’s inequality, for , we have
| (153) |
Since the RHS of (153) is independent of and the bound also holds on the unconditional probability, i.e., we have
| (154) |
Since is Rademacher, with probability . Choosing and using the triangle inequality, we have from (154),
Then, by a union bound over events,
| (155) |
This completes the proof of Result (2).
Result (3):
Reversing the roles of and in result (1), (147) and (149) of this lemma, we have
| (156) |
Now, multiplying by , we get
| (157) |
This completes the proof.
Appendix D Some useful lemmas
Lemma 6
Let and be two random matrices. Let and . Then,
-
1.
.
-
2.
.
-
3.
If and , then .
-
4.
.
-
5.
If and , then .
Proof:
Part (1): We have, .
Part (2): We have, .
Part (3): Given and . From Part (2), we have,
Part (4): For any , we have
Part (5): We have from Part (4), = = .
Lemma 7
Let , for , be Gaussian random variables with mean and variance . Then, we have
| (158) |
References
- [1] List of countries implementing pool testing strategy against COVID-19. https://en.wikipedia.org/wiki/List_of_countries_implementing_pool_testing_strategy_against_COVID-19. Last retrieved, Oct 2021.
- [2] M. Aldridge and D. Ellis. Pooled Testing and Its Applications in the COVID-19 Pandemic, pages 217–249. 2022.
- [3] M. Aldridge, O. Johnson, and J. Scarlett. Group testing: An information theory perspective. Found. Trends Commun. Inf. Theory, 15:196–392, 2019.
- [4] A. Aldroubi, X. Chen, and A.M. Powell. Perturbations of measurement matrices and dictionaries in compressed sensing. Appl. Comput. Harmon. Anal., 33(2), 2012.
- [5] G. Atia and V. Saligrama. Boolean compressed sensing and noisy group testing. IEEE Trans. Inf. Theory, 58(3), 2012.
- [6] S. H. Bharadwaja and C. R. Murthy. Recovery algorithms for pooled RT-qPCR based COVID-19 screening. IEEE Trans. Signal Process., 70:4353–4368, 2022.
- [7] T.T. Cai and Z. Guo. Confidence intervals for high-dimensional linear regression: Minimax rates and adaptivity. Ann. Stat., 45(2), 2017.
- [8] Emmanuel J. Candès, Justin K. Romberg, and Terence Tao. Stable signal recovery from incomplete and inaccurate measurements. Comm. Pure Appl. Math., 59(8):1207–1223, 2006.
- [9] G. Casella and R. Berger. Statistical Inference. Thomson Learning, 2002.
- [10] C. L. Chan, P. H. Che, S. Jaggi, and V. Saligrama. Non-adaptive probabilistic group testing with noisy measurements: Near-optimal bounds with efficient algorithms. In ACCC, pages 1832–1839, 2011.
- [11] M. Cheraghchi, A. Hormati, A. Karbasi, and M. Vetterli. Group testing with probabilistic tests: Theory, design and application. IEEE Transactions on Information Theory, 57(10), 2011.
- [12] A. Christoff et al. Swab pooling: A new method for large-scale RT-qPCR screening of SARS-CoV-2 avoiding sample dilution. PLOS ONE, 16(2):1–12, 02 2021.
- [13] S. Comess, H. Wang, S. Holmes, and C. Donnat. Statistical Modeling for Practical Pooled Testing During the COVID-19 Pandemic. Statistical Science, 37(2):229 – 250, 2022.
- [14] R. Dorfman. The detection of defective members of large populations. Ann. Math. Stat., 14(4):436–440, 1943.
- [15] E. Fenichel, R. Koch, A. Gilbert, G. Gonsalves, and A. Wyllie. Understanding the barriers to pooled SARS-CoV-2 testing in the United States. Microbiology Spectrum, 2021.
- [16] M. Fischler and R. Bolles. Random sample consensus: A paradigm for model fitting with applications to image analysis and automated cartography. Communications of the ACM, 24(6), 1981.
- [17] D. Forsyth and J. Ponce. Computer Vision: A Modern Approach. Pearson, 2012.
- [18] S. Fosson, V. Cerone, and D. Regruto. Sparse linear regression from perturbed data. Automatica, 122, 2020.
- [19] Sabyasachi Ghosh, Rishi Agarwal, Mohammad Ali Rehan, Shreya Pathak, Pratyush Agarwal, Yash Gupta, Sarthak Consul, Nimay Gupta, Ritesh Goenka, Ajit Rajwade, and Manoj Gopalkrishnan. A compressed sensing approach to pooled RT-PCR testing for COVID-19 detection. IEEE Open Journal of Signal Processing, 2:248–264, 2021.
- [20] A. C. Gilbert, M. A. Iwen, and M. J. Strauss. Group testing and sparse signal recovery. In 42nd Asilomar Conf. Signals, Syst. and Comput., pages 1059–1063, 2008.
- [21] N. Grobe, A. Cherif, X. Wang, Z. Dong, and P. Kotanko. Sample pooling: burden or solution? Clin. Microbiol. Infect., 27(9):1212–1220, 2021.
- [22] T. Hastie, R. Tibshirani, and M. Wainwright. Statistical Learning with Sparsity: The LASSO and Generalizations. CRC Press, 2015.
- [23] A. Heidarzadeh and K. Narayanan. Two-stage adaptive pooling with RT-qPCR for COVID-19 screening. In ICASSP, 2021.
- [24] M.A. Herman and T. Strohmer. General deviants: an analysis of perturbations in compressed sensing. IEEE Journal on Sel. Topics Signal Process., 4(2), 2010.
- [25] F. Hwang. A method for detecting all defective members in a population by group testing. J Am Stat Assoc, 67(339):605–608, 1972.
- [26] J.D. Ianni and W.A. Grissom. Trajectory auto-corrected image reconstruction. Magnetic Resonance in Medicine, 76(3), 2016.
- [27] T. Ince and A. Nacaroglu. On the perturbation of measurement matrix in non-convex compressed sensing. Signal Process., 98:143–149, 2014.
- [28] A. Javanmard and A. Montanari. Confidence intervals and hypothesis testing for high-dimensional regression. J Mach Learn Res, 2014.
- [29] A. Kahng and S. Reda. New and improved BIST diagnosis methods from combinatorial group testing theory. IEEE Trans. Comp. Aided Design of Inetg. Circ. and Sys., 25(3), 2006.
- [30] D. B. Larremore, B. Wilder, E. Lester, S. Shehata, J. M. Burke, J. A. Hay, M. Tambe, M. Mina, and R. Parker. Test sensitivity is secondary to frequency and turnaround time for COVID-19 screening. Science Advances, 7(1), 2021.
- [31] Y. Li and G. Raskutti. Minimax optimal convex methods for Poisson inverse problems under -ball sparsity. IEEE Trans. Inf. Theory, 64(8):5498–5512, 2018.
- [32] Hubert W Lilliefors. On the Kolmogorov-Smirnov test for normality with mean and variance unknown. Journal of the American statistical Association, 62(318):399–402, 1967.
- [33] Miles E Lopes. Unknown sparsity in compressed sensing: Denoising and inference. IEEE Transactions on Information Theory, 62(9):5145–5166, 2016.
- [34] G. Lugosi. Concentration-of-measure inequalities, 2009. https://www.econ.upf.edu/ lugosi/anu.pdf.
- [35] A. Mazumdar and S. Mohajer. Group testing with unreliable elements. In ACCC, 2014.
- [36] D. C. Montgomery, E. Peck, and G. Vining. Introduction to Linear Regression Analysis. Wiley, 2021.
- [37] M.Rudelson and R.Vershynin. Smallest singular value of a random rectangular matrix. Comm. Pure Appl. Math., 2009.
- [38] Nam H. Nguyen and Trac D. Tran. Robust LASSO with missing and grossly corrupted observations. IEEE Trans. Inf. Theory, 59(4):2036–2058, 2013.
- [39] H. Pandotra, E. Malhotra, A. Rajwade, and K. S. Gurumoorthy. Dealing with frequency perturbations in compressive reconstructions with Fourier sensing matrices. Signal Process., 165:57–71, 2019.
- [40] J. Parker, V. Cevher, and P. Schniter. Compressive sensing under matrix uncertainties: An approximate message passing approach. In Asilomar Conference on Signals, Systems and Computers, pages 804–808, 2011.
- [41] Liangzu Peng, Boshi Wang, and Manolis Tsakiris. Homomorphic sensing: Sparsity and noise. In International Conference on Machine Learning, pages 8464–8475. PMLR, 2021.
- [42] M. Raginsky, R. Willett, Z. Harmany, and R. Marcia. Compressed sensing performance bounds under Poisson noise. IEEE Trans. Signal Process., 58(8):3990–4002, 2010.
- [43] Chiara Ravazzi, Sophie Fosson, Tiziano Bianchi, and Enrico Magli. Sparsity estimation from compressive projections via sparse random matrices. EURASIP Journal on Advances in Signal Processing, 2018:1–18, 2018.
- [44] R. Rohde. COVID-19 pool testing: Is it time to jump in? https://asm.org/Articles/2020/July/COVID-19-Pool-Testing-Is-It-Time-to-Jump-In, 2020.
- [45] Mark Rudelson and Roman Vershynin. The Littlewood–Offord problem and invertibility of random matrices. Advances in Mathematics, 218(2):600–633, 2008.
- [46] P. Massart S. Boucheron, G. Lugosi. Concentration inequality: A nonasymptotic theory of independence. Oxford Claredon Press, 2012.
- [47] N. Shental et al. Efficient high throughput SARS-CoV-2 testing to detect asymptomatic carriers. Sci. Adv., 6(37), September 2020.
- [48] J. Todd. Induced Norms, pages 19–28. Birkhäuser Basel, Basel, 1977.
- [49] R. Vershynin. High-Dimensional Probability:An Introduction with Applications in Data Science. Cambridge University Press, 2018.
- [50] Katherine J. Wu. Why pooled testing for the coronavirus isn’t working in America. https://www.nytimes.com/2020/08/18/health/coronavirus-pool-testing.html. Last retrieved October 2021.
- [51] Hooman Zabeti, Nick Dexter, Ivan Lau, Leonhardt Unruh, Ben Adcock, and Leonid Chindelevitch. Group testing large populations for SARS-CoV-2. medRxiv, pages 2021–06, 2021.
- [52] J. Zhang, L. Chen, P. Boufounos, and Y. Gu. On the theoretical analysis of cross validation in compressive sensing. In ICASSP, 2014.
- [53] H. Zhu, G. Leus, and G. Giannakis. Sparsity-cognizant total least-squares for perturbed compressive sampling. IEEE Trans. Signal Process., 59(11), 2011.