Robust estimation for functional logistic regression models
Abstract
This paper addresses the problem of providing robust estimators under a functional logistic regression model. Logistic regression is a popular tool in classification problems with two populations. As in functional linear regression, regularization tools are needed to compute estimators for the functional slope. The traditional methods are based on dimension reduction or penalization combined with maximum likelihood or quasi–likelihood techniques and for that reason, they may be affected by misclassified points especially if they are associated to functional covariates with atypical behaviour. The proposal given in this paper adapts some of the best practices used when the covariates are finite–dimensional to provide reliable estimations. Under regularity conditions, consistency of the resulting estimators and rates of convergence for the predictions are derived. A numerical study illustrates the finite sample performance of the proposed method and reveals its stability under different contamination scenarios. A real data example is also presented.
Keywords: -splines; Functional Data Analysis; Logistic Regression Models; Robust Estimation
AMS Subject Classification: 62F35; 62G25
1 Introduction
In many applications, such as chemometrics, image recognition and spectroscopy, the observed data contain functional covariates, that is, variables originated by phenomena that are continuous in time or space and can be assumed to be smooth functions, rather than finite dimensional vectors. Functional data analysis aims to provide tools for analysing such data and has received considerable attention in recent years due to its high versatility and numerous applications. Different approaches either parametric, nonparametric or even semiparametric ones, were given to model data with functional predictors. Some well-known references in the treatment of functional data are the books of Ferraty and Vieu, (2006) and Ferraty and Romain, (2010), who carefully discuss non–parametric models, and also Ramsay and Silverman, (2005, 2002), Horváth and Kokoszka, (2012) and Hsing and Eubank, (2015) who place emphasis on parametric models such as the functional linear one. We also refer to Aneiros-Pérez et al., (2017) and the reviews in Cuevas, (2014) and Goia and Vieu, (2016) for some other results in the area.
Among regression models relating a scalar response with a functional covariate, the functional linear regression model is one of the more popular ones. Several estimation aspects under this model have been considered among others in Cardot et al., (2003), Cardot and Sarda, (2005), Cai and Hall, (2006), Hall and Horowitz, (2007), see also Febrero-Bande et al., (2017) and Reiss et al., (2017) for a review. Robust proposals for functional linear regression models using either , splines or functional principal components were given in Maronna and Yohai, (2013), Boente et al., (2020), Kalogridis and Van Aelst, (2023) and Kalogridis and Van Aelst, (2019), respectively.
Most of the papers mentioned above consider the case where the response is a continuous variable. However, discrete responses arise in some practical problems such as in classification. In particular, when the interest relies on the presence or absence of a condition of interest, the response corresponds to a binary outcome. Reiss et al., (2017) includes a review on relevant papers treating the case of responses whose conditional distribution belong to an exponential–family distributions, that is, estimation under a generalized functional linear regression model. As in functional linear models, the naive approach to estimate the functional regression parameter considering as multivariate covariates the values of the functional covariates observed on a grid of points and ignoring their functional nature, is not appropriate, since this approach leads to an ill-conditioned problem. The causes for this issue are, on the one hand, the high correlation existing, within each trajectory, among observations corresponding to close grid values and on the other hand, the fact that the number of grid measurements may exceed the number of observations, see Marx and Eilers, (1999) and Ramsay, (2004) for a discussion. As mentioned in Wang et al., (2016), one of the challenges in functional regression is the inverse nature of the problem, which causes estimation problems mainly generated by the compactness of the covariance operator of . For the reasons mentioned above, the extension from the situation with finite-dimensional predictors to the case of an infinite-dimensional one is not direct. The usual practice to solve this drawback is regularization which can be achieved in several ways, either reducing the set of candidates to a finite–dimensional one or by adding a penalty term as when considering splines. In particular, Cardot and Sarda, (2005) proposed estimators based on penalized likelihood and spline approximations and derived consistency properties for them. A different approach was followed in Müller and Stadtmüller, (2005) where the estimators are obtained via a truncated Karhunen-Loève expansion for the covariates. These authors also provided a theoretical study of the properties of their estimators as well as an illustration of their proposal on a classification problem that analyzes the interplay of longevity and reproduction, in short and long–lived Mediterranean fruit flies.
Among generalized regression models, logistic regression is one of the best known and useful models in statistics. It has been extensively studied when euclidean covariates arise and several robust proposals were given in this setting, some of which will be mentioned below, in Section 2.1. The functional logistic regression model is a generalization of the finite–dimensional logistic regression model, which assumes that the observed covariates are functional data rather than vectors in . It is particularly relevant in discrimination problems for curve data. This model was already considered in James, (2002) as a particular case of generalized linear models with functional predictors. Beyond the procedures studied in the framework of generalized functional regression models which can be used in functional logistic regression models, some authors have considered specific estimation methods for this particular model. Among others, we can mention Escabias et al., (2004), Aguilera et al., (2008), Aguilera-Morillo et al., (2013) and Mousavi and Sørensen, (2018) who provides a revision and comparison of different estimation methods for functional logistic regression. Among the numerous interesting applications of functional logistic regression that have been reported in the literature we can mention Escabias et al., (2005), who use it to model environmental data, Ratcliffe et al., (2002), who apply it to foetal heart rate data and Reiss et al., (2005) who analyze pet imaging data. Besides, Sørensen et al., (2013) present several medical applications of functional data, while Wang et al., (2017) used penalized Haar wavelet approach for the classification of brain images to assist in early diagnosis of Alzheimer’s disease.
The framework in which this paper will focus corresponds to the functional logistic regression model with scalar response, also labelled as scalar–on–function logistic regression in the literature. Under this model, the i.i.d. observations , , are such that the response and the predictor , with a compact interval, while the link function is the logistic one. More precisely, if stands for the Bernoulli distribution with success probability and denotes the logistic function, the functional logistic regression model assumes that
| (1) |
with , and stands for the usual inner product in and for the corresponding norm.
The estimators for functional logistic regression mentioned above are based on the method of maximum likelihood combined with some regularization tool. As it happens with finite dimensional covariates, these estimators are highly affected by the presence of misclassified points specially when combined with high leverage covariates. Robust methods, on the other hand, have the advantage of giving reliable results, even when a proportion of the data correspond to atypical data. As mentioned above, some robust methods for functional linear regression models have been recently proposed and this area has shown great development in the last ten years. However, the literature on robust procedures for generalized functional linear models and specifically for functional logistic regression ones is scarce. Up to our knowledge, only few procedures have been considered and most of them lack a careful study of the asymptotic properties of the proposal considered. The first attempt to provide a robust method for functional logistic regression was given in Denhere and Billor, (2016). This method is based on reducing the dimension of the covariates by using a robust principal components method proposed in Hubert et al., (2005). The robustness of this method ensures that the functional principal component analysis is not influenced by outlying covariates. However, it but does not take into account the problem of large deviance residuals originated by incorrectly classified observations. To solve this problem, Mutis et al., (2022) propose to combine a basis approximation with weights computed using the Pearson residuals, in an approach related to that given by Alin and Agostinelli, (2017) for finite–dimensional covariates. Recently, Kalogridis, (2023) introduced an approach based on divergence measures combined with penalizations and provided a careful study of its asymptotic properties, for bounded covariates.
In this paper, we follow a different perspective, taking into account the sensitivity of these estimators to atypical observations and based on the ideas given for euclidean covariates by Bianco and Yohai, (1996) and Croux and Haesbroeck, (2003), we define robust estimators of the intercept and the slope following a sieve approach combined with weighted estimators. More precisely, as done for instance in functional linear regression, we first reduce the set of candidates for estimating to those belonging to a finite–dimensional space spanned by a fixed basis selected by the practitioner, such as the splines, Fourier, or wavelet bases. This enables to use the robust tools developed for finite–dimensional covariates in this infinite–dimensional framework. Clearly this regularization process involves the selection of the basis dimension which should increase with the sample size at a given rate and which must be chosen in a robust way. For that reason, in Section 2.4, we describe a resistant procedure to select the dimension of the approximating space.
The rest of the paper is organized as follows. The model and our proposed estimators are described in Section 2. Theoretical assurances regarding consistency and convergence rates of our proposal are provided in Section 3, while in Section 4 we report the results of a simulation study to explore their finite-sample properties. Section 5 contains the analysis of a real-data set, while final comments are given in Section 6. All proofs are relegated to the Appendix.
2 The estimators
As mentioned in the Introduction, our proposal for estimators under the functional logistic regression model (1) is based on basis reduction. For that reason and for the sake of completeness, in Section 2.1, we recall some of the robust proposals given when the covariates belong to a finite–dimensional space.
2.1 Some robust proposals for euclidean covariates
When the covariates are finite–dimensional, the practitioner deals with i.i.d. observations , , where , . In this case, the well–known logistic regression model states that , where . As mentioned in the Introduction, the maximum likelihood estimator of the regression coefficients is very sensitive to outliers, meaning that we cannot accurately classify a new observation based on these estimators, neither identify those covariates with important information for assignation. To solve this drawback, different robust procedures have been considered.
In particular, consistent estimators bounding the deviance were defined in Bianco and Yohai, (1996), while in order to obtain bounded influence estimators a weighted version was introduced in Croux and Haesbroeck, (2003). For the family of estimators defined in Bianco and Yohai, (1996), Croux and Haesbroeck, (2003) introduced a loss function that guarantees the existence of the resulting robust estimator when the maximum likelihood estimators do exist. Basu et al., (1998) considered a proposal based on minimum divergence. However, their approach can also be seen as a particular case of the Bianco and Yohai, (1996) estimator with a properly defined loss function. Other approaches were given in Cantoni and Ronchetti, (2001) who consider a robust quasi–likelihood estimator, Bondell, (2005, 2008) whose procedures incorporate a minimum distance perspective and Hobza et al., (2008) who defines a a median estimator by using an estimator of the smoothed responses.
As pointed out in Maronna et al., (2019), the use of redescending weighted estimators ensures estimators with good robustness properties. For that reason and taking into account that our proposal will combine dimension reduction with weighted estimators, we briefly describe the proposal introduced in Croux and Haesbroeck, (2003). From now on, denote the squared deviance function, that is, and let be a bounded, differentiable and nondecreasing function with derivative . Furthermore, define
| (2) |
where . The correction term was introduced in Bianco and Yohai, (1996) to guarantee Fisher–consistency of the resulting procedure. It is worth mentioning that the function can be written as
| (3) |
The weighted estimators are the minimizers of , that is,
| (4) |
The weights are usually based on a robust Mahalanobis distance of the explanatory variables, that is, they depend on the distance between and a robust center of the data. With this notation, the minimum divergence estimators considered in Basu et al., (1998) correspond to the choice and .
The asymptotic properties of the estimators with were obtained in Bianco and Yohai, (1996), while the situation of a general weight function was studied in Bianco and Martinez, (2009). It should be mentioned that these estimators are implemented in the package RobStatTM, through the functions logregBY, when the weights equal 1, and logregWBY when considering hard rejection weights derived from the MCD estimator of the continuous explanatory variables. In both cases, the loss function is taken as the one introduced in Croux and Haesbroeck, (2003).
2.2 The case of functional covariates
In this section, we consider the situation where , are independent observations such that and with a compact interval, that, without loss of generality, we assume to be . The model relating the responses to the covariates is the functional logistic regression model, that is, we assume that (1) holds.
As mentioned in the Introduction, estimation under functional linear regression or functional logistic regression models is an ill–posed problem. To avoid this issue, one possibility is dimension reduction that can be achieved by considering as possible candidates for estimating the elements of a finite–dimensional space spanned by a fixed basis. This is the approach we follow in this paper, that is, to define robust estimators of the intercept and the slope , we will use a sieve approach combined with weighted estimators. We do not restrict our attention to a particular basis as the spline basis considered, for instance, in Boente et al., (2020) for the functional semi–linear model or Mutis et al., (2022) for the functional logistic regression one. Instead, we provide a general framework which allows the practitioner to choose the basis according to the smoothness knowledge or assumptions to be considered on .
Henceforth, let stand for the dimension of the finite dimensional space spanned by the basis . The space of possible candidates correspond to , where .
From now on, for any , will stand for . Then, for any possible candidate , the inner product equals where which suggests to use the robust estimators defined in Section 2.1 taking as covariates .
More precisely, the weighted estimators defined in (4) over the finite–dimensional approximating spaces are the key tool for obtaining consistent estimators of . For any define
and
| (5) |
Hence, the estimator of is given by
where , meaning that .
The weights in (5) may be computed as in (4) using a weight function of the robust Mahalanobis distance of the projected variables , in which case, . Another possibility is to compute the weights from the functional covariates, for instance, discarding observations which are declared as outliers by the functional boxplot or any other functional measure of atipicity. In the simulation study reported in Section 4, we explore both possible choices for the weights. As in the finite–dimensional setting, for the sake of simplicity, when deriving consistency results, we will assume that the weight function is not data dependent.
2.3 On the basis choice
The basis choice depends on the knowledge or assumptions to be made on the slope parameter. Some well known basis are splines, Bernstein and Legendre polynomials, Fourier basis or Wavelet ones. They vary in the way they approximate a function as discussed, for instance, in Boente and Martinez, (2023) and Kalogridis and Van Aelst, (2023).
When considering -spline approximations, consistency results will require the slope parameter to be -times continuously differentiable, that is, , where and is the spline order. In particular, when cubic splines are considered, the results in Section 3 hold for twice continuously differentiable regression functions. Recall that a spline of order is a polynomial of degree within each subinterval defined by the knots. As stated in Corollary 6.21 in Schumaker, (1981), if with th derivative Lipschitz and , under proper assumptions on the knots, there exist a spline of order , let’s say , such that . It is worth mentioning that the approximation order has an impact on the rates of convergence derived in Theorems 3.1 and 3.3 through assumption A10.
Bernstein polynomials are a possible alternative to splines. They are defined as
Weierstrass Theorem ensures that if , there exists , where such that . Furthermore, Theorem 3.2 in Powell, (1981) guarantees that when considering Bernstein polynomials of order we also get that , whenever .
Legendre polynomials define an orthogonal basis in . As mentioned in Boente and Martinez, (2023), the convergence rates derived in Theorem 2.5 from Wang and Xiang, (2012) allow to show that, if and stands for the truncated Legendre series expansion of of order , then . Note that in this case, the approximation rate is lower than for the other two basis mentioned above and this will affect the rates provided in Theorem 3.3. More generally, when polynomials basis of order are considered, Jackson’s Theorem (see Theorem 3.12 in Schumaker, , 1981) ensures that if , the Sobolev space of order as defined below, there exists a polynomial of order such that and this improved approximation order is enough to guarantee a better rate of convergence for the predictions, when polynomial bases are considered.
Finally, the Fourier basis is the natural basis in and it is usually considered when approximating periodic functions. Clearly, the finite expansion , where , and converges to in . When , Corollary 2.4 in Chapter 7 from DeVore and Lorentz, (1993) ensures that
2.4 Selecting the size of the basis
The number of elements of the basis plays the role of regularization parameter in our estimation procedure. The importance of considering a robust criterion to select the regularization parameter has been discussed by several authors who report how standard model selection methods can be highly affected by a small proportion of outliers. The sensitivity to atypical data of classical basis selectors may be inherited by the final regression estimators even when robust procedure is considered.
To deal with these problems, when the covariates belong to , Ronchetti, (1985) and Tharmaratnam and Claeskens, (2013) provide some robust approaches when considering linear regression models. Besides, under a sparse logistic regression model, Bianco et al., (2022) report in their supplement a numerical study that reveals the importance of considering a robust criterion in order to achieve reliable predictions. Finally, for functional covariates and under a semi–linear and a functional linear model, Boente et al., (2020), Kalogridis and Van Aelst, (2019, 2023), respectively, discuss robust criteria for selecting the regularization parameters.
In our framework, the basis dimension may be determined by a model selection criterion such as a robust version of the Akaike criterion used in Lu, (2015) or the robust Schwarz, (1978) criterion considered in He and Shi, (1996) and He et al., (2002) for semi–parametric regression models. Suppose that is the solution of (5) when we use a dimensional linear space and denote as . We define a robust criterion, whose large values indicate a poor fit, as
| (6) |
For instance, when considering spline procedures, in order to obtain an optimal rate of convergence, we let the number of knots increase slowly with the sample size. Theorem 3.3 below shows that when is twice continuously differentiable and is approximated with cubic splines (), the size of the bases can be taken of order . Hence, a possible way to select is to search for the first local minimum of in the range . Note that for cubic splines the smallest possible number of knots is 4.
3 Consistency results
To provide a unified approach in which the basis gives approximations either in or in , equipped by their respective norms and , we will denote the space or and the corresponding norm. Hence, we have that . Furthermore, will stand for the Hölder space
when , while when , we label the Sobolev space
We denote the corresponding norm, that is,
in the former case and in the latter one.
To derive consistency results, we will need the following assumptions.
-
A1
is a bounded, continuously differentiable function with bounded derivative and .
-
A2
and there exists some such that for all .
-
A3
and there exist values and such that for every .
-
A4
is continuously differentiable function with bounded derivative .
-
A5
is a non–negative bounded function with support such that . Without loss of generality, we assume that .
-
A6
-
(a)
.
-
(b)
.
-
(a)
-
A7
The basis functions are such that .
-
A8
The basis dimension is such that , .
-
A9
There exists an element , such that as .
-
A10
There exists an element , such that , for some . Furthermore, the basis dimension is of order where .
-
A11
The following condition holds:
(7) where or , depending on whether belongs to or , respectively.
Our first result states that, under mild assumptions, the estimators obtained minimizing over produce consistent estimators of the conditional success probability with respect to the weighted mean square error of the differences between predicted probabilities defined as
where for , . Henceforth, to simplify the notation, we denote and .
Theorem 3.1.
Remark 3.1.
Denote and . When , Theorem 3.1(a) implies that for any ,
where the right hand side of the inequality converges to 0 as .Thus, allowing to consistently classify a new observation. Moreover, using that is continuous, we also conclude that converges in probability to . However, the infinite–dimensional structure of the covariates does not allow to derive the consistency of , which is instead obtained in Theorem 3.2. The rates obtained in Theorem 3.1 (b) provide a preliminary rate that will be improved in Theorem 3.3.
Theorem 3.2 establishes strong consistency of the intercept and slope parameter, which clearly implies that of the predicted probability, that is, . This result provides an improvement over the one obtained in Theorem 3.1, but requires additional assumptions on the covariates, namely, assumption A11 which is discussed in Remark 3.2.
Theorem 3.2.
Theorem 3.2(b) is useful for situation where the slope parameter is continuous but we use a smooth basis that provides an approximation in , such as the Fourier one.
Remark 3.2 (Comments on assumptions).
Assumptions A1, A2, A5 and A11 are needed to ensure Fisher–consistency of the proposal, see Lemma A.1 in the Appendix. In the finite–dimensional case, A1 and A2 were also required in Bianco and Yohai, (1996) who considered estimators, while assumption A5 corresponds to assumption A2 in Bianco and Martinez, (2009) who studied the asymptotic behaviour of weighted estimators. Assumption A11 is the infinite–dimensional counterpart of assumptions C1 in Bianco and Yohai, (1996) and A3 in Bianco and Martinez, (2009). For the functional logistic regression model considered this assumption is stronger than the one required for functional linear regression models in Boente et al., (2020) and Kalogridis and Van Aelst, (2023) which states that . However, it is weaker than assumption C2 in Kalogridis and Van Aelst, (2019) who defined robust estimators based on principal components under a functional linear model and assumed that the process has a finite–dimensional Karhunen-Loève expansion with scores having a joint density function. It is worth mentioning that condition A11 is related to the fact that the slope parameter is not identifiable if the kernel of the covariance operator of does not reduce to . Instead of requiring the condition over all possible elements , depending on the smoothness of , the set of values over which the probability equals 0 may be reduced.
Furthermore, assumptions A1 and A2 hold for the loss function introduced in Croux and Haesbroeck, (2003) and for which is related to the minimum divergence estimators defined in Basu et al., (1998) and in both cases, can be taken as . Note that if and assumptions A1 and A2 hold for some constant , then condition A3 is fulfilled. This situation arises, for example, for the two loss functions mentioned above. It is worth mentioning that A3 is a key point to derive that , for any and some constant , where . This inequality allows to derive convergence rates for the weighted mean square error of the prediction differences from those obtained for the empirical process .
Assumption A8 gives a rate at which the dimension of the finite–dimensional space should increase. It is a standard condition when a sieve approach is considered. Furthermore, in assumption A10 a stronger convergence rate is required to the basis dimension in order obtain rates of convergence.
Assumption A9 states that the true slope may be approximated by an element of . Conditions under which this assumption holds for some basis choices were discussed in Section 2.3, where conditions ensuring a given rate for this approximation were also given. The approximation rate required in A10 plays a role when deriving rates of convergence for the predicted probabilities. Note also that under A7, the approximating element , given in A9 and A10, also belongs to . A first attempt to obtain these rates is given in Theorem 3.1, but better ones will be obtained in Theorem 3.3 below.
3.1 Rates of Consistency
To derive rates of convergence for the estimators, we define the pseudo-distance given by
where for , . The following additional assumption will be required
-
A1
: There exists and a positive constant , such that for any with we have .
Note that since is bounded by 1, , so the weighted mean square error of the differences between predicted probabilities inherits the rates of converges obtained in Theorem 3.3 for the distance .
Theorem 3.3.
The lower bound given in assumption A1 is a requirement that is fulfilled when the covariates are bounded as shown in Proposition 3.4 below. Moreover, one consequence of Proposition 3.4 is that for bounded functional covariates, the pseudo-distances and are equivalent.
Proposition 3.4.
As a consequence of Proposition 3.4 and Theorem 3.3, we get the following result that improves the rates given in Theorem 3.1.
Corollary 3.5.
Remark 3.3.
As mentioned in Boente et al., (2020), who obtained rates under a semi-linear functional regression model, if in A10, one can choose , for some arbitrarily small, which yields a convergence rate arbitrarily close to the optimal one. Then, as mentioned above, when considering cubic splines, if is twice continuously differentiable one has that in A10. Hence, taking , i.e., if the basis dimension has order , we ensure that the convergence rate for and is arbitrarily close to .
Clearly, one may select in Theorem 3.3, where . Hence, if in A10, we have that . Hence, for bounded covariates, both the weighted mean square error of the predictions and the weighted mean square error between the predicted probabilities are such that and , leading to a convergence rate is suboptimal with respect to the one obtained for instance in nonparametric regression models, see Stone, (1982, 1985). Furthermore, this rate equals the one obtained for penalized estimators in Kalogridis, (2023), when considering splines with and the slope function is times continuously differentiable, i.e., . As mentioned therein, the term is related to the fact that we are considering infinite–dimensional covariates. Recall that when and to ensure identifiability, the eigenvalues of its covariance operator are non–null but converge to , enabling us to provide a lower bound for in terms of .
It also is worth mentioning that the rate derived in Theorem 3.1(c), allow to conclude that, when , that is, when , we have . Hence, if the functional covariates are bounded, from Proposition 3.4 we get that . This rate of convergence corresponds to the one obtained in Cardot and Sarda, (2005) for their penalized estimators and is slower than the rate derived from Theorem 3.3.
4 Simulation study
We performed a Monte Carlo study to investigate the finite-sample properties of our proposed estimators for the functional logistic regression model. For that purpose, we generated a training sample of observations i.i.d. such that where . The true regression parameter was set equal to , where correspond to elements of the Fourier basis, more precisely, , , , and the coefficients and , . The process that generates the functional covariates was Gaussian with mean 0 and covariance operator with eigenfunctions . For uncontaminated samples, the scores were generated as independent Gaussian random variables . We denote the distribution of this Gaussian process . Taking into account that when , the process was approximated numerically using the first 50 terms of its Karhunen-Loève representation.
We chose as basis the spline basis for all the procedures considered, denoted . We compared four estimators: the procedure based on using the deviance after dimension reduction, that is using in (2), labelled the classical estimators and denoted cl, the one that uses estimators denoted m, and their weighted versions. The estimators and weighted estimators were computed using the loss function introduced in Croux and Haesbroeck, (2003) and defined as
with tuning constant . For the former the weights equal 1 for all observations, while for the latter, as for the weighted deviance estimators, two different type of weight functions were considered.
-
a)
For the first one, after dimension reduction, that is, after computing , we evaluated the Donoho–Stahel location and scatter estimators, denoted and , respectively, of the sample with . The weights are then defined as when the squared Mahalanobis distance is less than or equal to and otherwise, where stands for the quantile of a chi-square distribution with degrees of freedom. Hence, for this family we used hard rejection weights and for that reason, the weighted estimators based on the deviance and the weighted estimators are denoted wcl-hr and wm-hr, respectively. Note that wcl-hr are related to the Mallows–type estimators introduced in Carroll and Pederson, (1993).
-
b)
The second family of weight functions is based on the functional boxplots as defined by Sun and Genton, (2011). Again, we choose hard rejection weights but on the functional space by taking if was declared an outlier by the functional boxplot and otherwise. The functional boxplot was computed using the function fbplot of the library fda taking as method ”Both” which orders the observations according to the band depth and then breaks ties with the modified band depth, as defined in López-Pintado and Romo, (2009). In this case the weighting is done before the spline approximation. The resulting weighted classical and estimators are denoted wcl-fbb and wm-fbb, respectively.
For each setting we generated samples of size and used cubic splines with equally spaced knots. For the robust estimators we selected the size of the spline basis, , by minimizing in equation (6) over the grid . For the classical estimator, we used the standard criterion, that is, we chose in equation (6).
 |
 |
 |
 |
 |
 |
We considered different contamination scenarios by adding a proportion of atypical points. We denote these scenarios , for and we chose and .
-
•
In the first scenario, denoted , we generated misclassified points , where and when and , otherwise.
-
•
Under , we have tried to adapt to the functional framework the damaging effect of the high leverage points considered by Croux and Haesbroeck, (2003). For that purpose, given , we generated . The response , related to , was always taken equal to . It is worth noticing that is very close to , thus the leverage of the added points increases with . We chose .
-
•
Contamination generates extreme outliers as with , for all . As in , we chose when and , otherwise.
-
•
Setting aims to construct trajectories with extreme symmetric outliers. For that purpose, we define with , for all . As in , we chose when and , otherwise.
-
•
The purpose of is to add trajectories with a partial contamination. We generated where , and and and are independent. As in , we chose when and , otherwise.
The way contaminated trajectories are constructed under settings to corresponds to the contaminations considered in Denhere and Billor, (2016). However, we force the atypical trajectories to correspond to bad leverage points.
To illustrate the type of outliers generated, Figure 1 shows the obtained functional covariates , for one sample generated under each scheme.
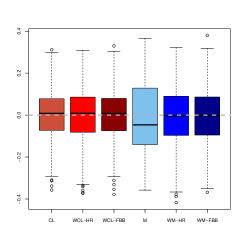
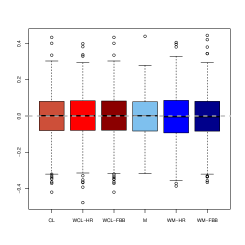
To compare the estimators of , we computed their biases and standard deviations, which are reported in Table 1. We also present in Figures 2 and 3 their boxplots for the considered contaminations.
| cl | -0.0040 | 0.1250 | ||||||||
|---|---|---|---|---|---|---|---|---|---|---|
| m | -0.0072 | 0.1528 | ||||||||
| wcl-hr | -0.0046 | 0.1250 | ||||||||
| wm-hr | -0.0045 | 0.1278 | ||||||||
| wcl-fbb | -0.0040 | 0.1250 | ||||||||
| wm-fbb | -0.0083 | 0.1259 | ||||||||
| cl | -0.0024 | 0.1160 | -0.0540 | 0.1200 | -0.0200 | 0.1230 | -0.0064 | 0.1216 | -0.0034 | 0.1166 |
| m | -0.0038 | 0.1589 | -0.1613 | 0.1139 | -0.0580 | 0.1086 | -0.0041 | 0.1170 | -0.0050 | 0.1138 |
| wcl-hr | -0.0029 | 0.1265 | -0.0028 | 0.1263 | -0.0029 | 0.1263 | -0.0065 | 0.1247 | -0.0029 | 0.1254 |
| wm-hr | 0.0007 | 0.1331 | 0.0008 | 0.1331 | 0.0009 | 0.1333 | -0.0053 | 0.1304 | 0.0042 | 0.1282 |
| wcl-fbb | -0.0030 | 0.1208 | -0.0080 | 0.1247 | -0.0177 | 0.1228 | -0.0061 | 0.1234 | -0.0028 | 0.1234 |
| wm-fbb | -0.0002 | 0.1352 | -0.0068 | 0.1326 | -0.0168 | 0.1313 | -0.0084 | 0.1283 | 0.0034 | 0.1259 |
| cl | 0.0011 | 0.1117 | -0.0550 | 0.1220 | -0.0154 | 0.1219 | -0.0017 | 0.1219 | 0.0035 | 0.1174 |
| m | -0.0092 | 0.1564 | -0.1680 | 0.0952 | -0.0397 | 0.1110 | -0.0024 | 0.1128 | -0.0006 | 0.1064 |
| wcl-hr | 0.0022 | 0.1234 | 0.0018 | 0.1240 | 0.0021 | 0.1241 | -0.0006 | 0.1250 | 0.0053 | 0.1247 |
| wm-hr | -0.0067 | 0.1292 | -0.0069 | 0.1302 | -0.0065 | 0.1299 | -0.0032 | 0.1292 | 0.0078 | 0.1279 |
| wcl-fbb | 0.0030 | 0.1156 | -0.0057 | 0.1235 | -0.0154 | 0.1219 | -0.0014 | 0.1220 | 0.0051 | 0.1229 |
| wm-fbb | -0.0037 | 0.1262 | -0.0145 | 0.1295 | -0.0240 | 0.1297 | -0.0017 | 0.1245 | 0.0031 | 0.1296 |

|
|

|
|

|

|

|

|

|
|

|

|
As expected, for clean samples, all the methods perform similarly. It should be noted that the and weighted estimators show slightly lower biases than the classical procedure based on the deviance, but their standard deviations are larger due to the loss of efficiency. For all the considered contamination schemes, the obtained results reflect the stability of the weighted estimators. In contrast, the classical procedure and also the estimator are affected by some of the these schemes. When considering the performance across contaminations, we observe that is the one with the larger effect on the bias of the classical estimator. This contamination, as well as , is also damaging for the estimator due to the presence of extreme high leverage outliers.
Regarding the performance of the weighted estimators under to the weighted proposal which downweights observations with large robust Mahalanobis distance provide the best results especially when looking at the bias. Note that under some contaminating schemes, the obtained biases for wm-fbb are considerably larger than those of wm-hr, for instance under it is more than 10 times larger, while their standard deviations are comparable. The same behaviour arises when comparing the biases of wcl-fbb and wcl-hr.
To evaluate the performance of the different estimators of , as in Qingguo, (2015) and Boente et al., (2020), one possibility is to consider numerical approximations of their integrated squared bias and mean integrated squared error, computed on a grid of equally spaced points on . However, as mentioned in He and Shi, (1998), these measures may be influenced by numerical errors at or near the boundaries of the grid. For that reason, we only report here trimmed versions of the above summaries computed without the first and last points of the grid. More specifically, if is the estimate of the function obtained with the -th sample () and are equispaced points on , we evaluated
We chose and , which uses the central 90% interior points in the grid.
We also considered another summary measure which aims to evaluate the estimator predictive capability. With that purpose, denote the estimator obtained at replication , . At the th replication, we also generated, independently from the sample used to compute the estimator, a new sample distributed as C0. We then computed the probability mean squared errors defined as
Table 2 presents the results obtained for the PMSE, while Table 3 reports the obtained summary measures and .
| cl | 0.0039 | 0.0155 | 0.0251 | 0.0223 | 0.0265 | 0.0118 | 0.0130 | 0.0118 | 0.0129 | 0.0263 | 0.0296 |
| m | 0.0043 | 0.0151 | 0.0244 | 0.0222 | 0.0256 | 0.0105 | 0.0113 | 0.0106 | 0.0113 | 0.0242 | 0.0266 |
| wcl-hr | 0.0042 | 0.0042 | 0.0040 | 0.0042 | 0.0041 | 0.0042 | 0.0040 | 0.0042 | 0.0040 | 0.0041 | 0.0041 |
| wm-hr | 0.0042 | 0.0042 | 0.0041 | 0.0041 | 0.0042 | 0.0042 | 0.0041 | 0.0042 | 0.0041 | 0.0042 | 0.0040 |
| wcl-fbb | 0.0039 | 0.0055 | 0.0115 | 0.0051 | 0.0060 | 0.0108 | 0.0130 | 0.0056 | 0.0108 | 0.0039 | 0.0039 |
| wm-fbb | 0.0039 | 0.0053 | 0.0109 | 0.0053 | 0.0060 | 0.0104 | 0.0120 | 0.0056 | 0.0102 | 0.0038 | 0.0039 |
| cl | 0.0029 | 0.3305 | ||||||||
|---|---|---|---|---|---|---|---|---|---|---|
| m | 0.0024 | 0.3259 | ||||||||
| wcl-hr | 0.0019 | 0.3795 | ||||||||
| wm-hr | 0.0021 | 0.3510 | ||||||||
| wcl-fbb | 0.0029 | 0.3305 | ||||||||
| wm-fbb | 0.0030 | 0.3257 | ||||||||
| cl | 0.5726 | 0.7706 | 1.2394 | 1.5669 | 0.1416 | 0.4412 | 0.1435 | 0.4246 | 0.9499 | 1.0056 |
| m | 0.5222 | 0.7338 | 1.0635 | 1.3688 | 0.1290 | 0.3230 | 0.1300 | 0.3323 | 0.8710 | 0.8908 |
| wcl-hr | 0.0019 | 0.3566 | 0.0020 | 0.3523 | 0.0020 | 0.3535 | 0.0020 | 0.3444 | 0.0025 | 0.3534 |
| wm-hr | 0.0016 | 0.3350 | 0.0014 | 0.3353 | 0.0015 | 0.3379 | 0.0016 | 0.3382 | 0.0018 | 0.3605 |
| wcl-fbb | 0.0749 | 0.4007 | 0.0119 | 0.4016 | 0.1069 | 0.4258 | 0.0076 | 0.3386 | 0.0028 | 0.3190 |
| wm-fbb | 0.0517 | 0.3878 | 0.0105 | 0.4046 | 0.1028 | 0.4173 | 0.0086 | 0.3452 | 0.0019 | 0.3179 |
| cl | 1.0181 | 1.1032 | 1.5130 | 1.8423 | 0.1620 | 0.4570 | 0.1659 | 0.4436 | 1.0601 | 1.0953 |
| m | 0.9764 | 1.0436 | 1.2632 | 1.5716 | 0.1440 | 0.3264 | 0.1414 | 0.3118 | 0.9227 | 0.9385 |
| wcl-hr | 0.0018 | 0.3484 | 0.0017 | 0.3497 | 0.0018 | 0.3475 | 0.0025 | 0.3344 | 0.0016 | 0.3381 |
| wm-hr | 0.0033 | 0.3354 | 0.0023 | 0.3440 | 0.0023 | 0.3385 | 0.0025 | 0.3272 | 0.0017 | 0.3274 |
| wcl-fbb | 0.4184 | 0.6609 | 0.0270 | 0.4626 | 0.1617 | 0.4568 | 0.0997 | 0.4133 | 0.0016 | 0.3188 |
| wm-fbb | 0.3615 | 0.6406 | 0.0252 | 0.4493 | 0.1441 | 0.4293 | 0.0942 | 0.4012 | 0.0016 | 0.3099 |
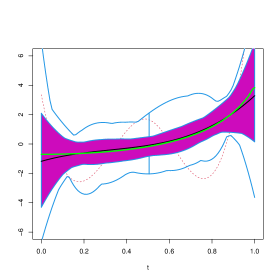
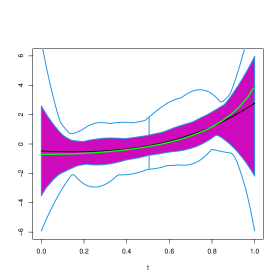
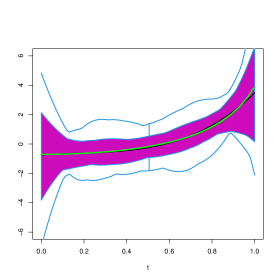
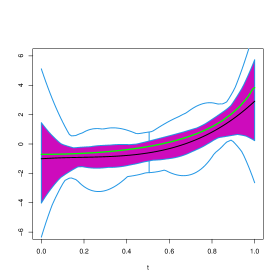
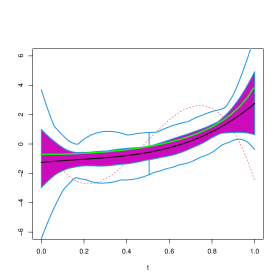
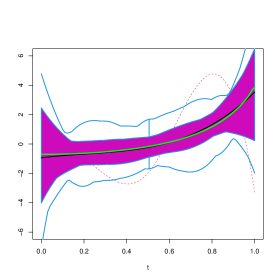
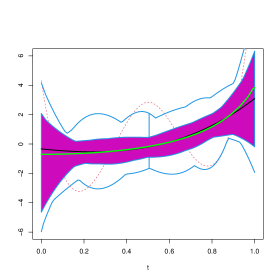
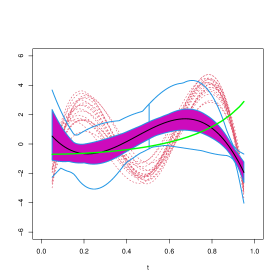
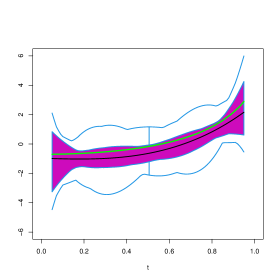
In order to visually explore the performance of these estimators, Figures 4 to 14 contain functional boxplots, see Sun and Genton, (2011), for the realizations of the different estimators for under the contamination settings. As in standard boxplots, the magenta central box of these functional boxplots represents the 50% inner band of curves, the solid black line indicates the central (deepest) function and the dotted red lines indicate outlying curves, that is, outlying estimates for some . We also indicate in blue lines the whiskers delimiting the non–outlying curves and the true function with a dark green line. To avoid boundary effects, we show in Figures 15 to 25 the different estimates evaluated on the interior points of a grid of 100 equispaced points. In addition, to facilitate comparisons between contamination cases and estimation methods, the scales of the vertical axes are the same for all Figures.
In clean samples, all the estimators give similar results with slightly smaller values of the when considering the weighted estimators. It is worth mentioning that the weighted estimators are remarkably efficient. Furthermore, when considering the PMSE, the weighted estimators giving weight 0 to the observations with covariates detected as atypical by the functional boxplot, give results similar to those of the classical estimator. This behaviour may be explained by the fact than in most generated samples, under , no atypical curves are detected among the covariates.
As expected, when misclassified observations are present, the procedure based on the deviance breaks–down, in particular when these responses are combined with extreme high leverage covariates as is the case for . Contamination schemes and have less effect than on the integrated squared bias and mean integrated squared error of the classical estimator of the slope. This fact is also illustrated in Figures 9 to 12 and 20 to 23, where the true curve is still in the band containing the 50% deepest estimates. In contrast, under , and particularly under , the plot of the true function is beyond the limits of the functional boxplot, meaning that the obtained estimates become completely uninformative and do not reflect the shape of , see Figures 5 to 8, 13 and 14 for instance.
It is interesting to note that the the unweighted -estimator shows a performance similar to that of the classical one, for the considered contamination schemes. In contrast, weighted estimators give very good results in all the studied contamination settings, especially when considering wcl-hr and wm-hr, which clearly outperform wcl-fbb and wm-fbb in most cases. It is worth mentioning that the weighted estimators based on the deviance are quite stable across contaminations, the only exception being where wcl-fbb is more sensitive. In this last case, as when considering the wm-fbb estimates, the true curve lies above the magenta central region for values of larger than 0.8 (see Figures 6 and 17), but is still included in the band limited by the blue whiskers.
In most cases, the weighted estimators improve on the weighted estimators obtained when and the procedures with weights based on the Mahalanobis distance of the projected covariates outperform those whose weights are based on the functional boxplot. In particular, contamination schemes and , affect more the PMSE of the the latter procedure than that of the former one. Note that, under , and also under the PMSE of wcl-fbb are twice those obtained with wcl-hr and similarly when comparing wm-fbb with wm-hr (see Table 2).
In summary, the wcl-hr and specially the wm-hr estimators display a remarkably stable behaviour across the selected contaminations. Both estimators are comparable, but wm-hr attains in general lower values of the . The good performance of wcl-hr may be explained by the fact that the hard–rejection weights mainly discard from the sample the observations with high leverage covariates, which in most cases correspond to missclassified ones. This behaviour was already noticed by Croux and Haesbroeck, (2003) in the finite–dimensional setting.

|

|

|

|

|

|

|

|

|

|

|

|

|

|

|

|

|

|

|

|

|

|

|

|

|

|
|

|

|
|

|

|

|
|

|
|

|
|

|

|

|

|

|

|
|

|

|

|

|

|

|

|

|

|

|

|

|
|

|

|

|

|

|

|

|

|

|

|

|

|

|

|

|

|

|

|

|

|

|

|

|

|

|

|

|

|

|

|

|

|
|

|

|

|

|

|

|

|

|

|

|

|

|

|

|

|

|

|

|

|

|

|

|

|
|

|

|

|

|

|

|

|

|

|

|

|

|

|

|

|

|

|
5 Real data example
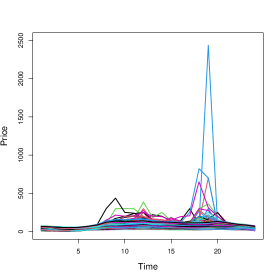
In this section, we consider the electricity prices data set analysed in Liebl, (2013) in the context of electricity price forecasting and we investigate the performance of the proposed estimators.
The data consist of hourly electricity prices in Germany between 1 January 2006 and 30 September 2008, as traded at the Leipzig European Energy Exchange, German electricity demand (as reported by the European Network of Transmission System Operators for Electricity). These data were also used in Boente et al., (2020) who modelled the daily average hourly energy demand through a semi-functional linear regression model using as euclidean covariate the mean hourly amount of wind-generated electricity in the system for that day and as functional covariate the curve of energy prices observed hourly.
In our analysis, the response measures high or low demand of electricity, that is, we define the binary variable if the average hourly demand exceeds 55000 (“High Demand”) and (“Low Demand”) otherwise. Furthermore, the functional covariates used to predict the conditional probability that a day has high demand, correspond to the curves of energy prices. These curves are observed hourly originating a matrix of dimension , after removing weekends, holidays and other non-working days. Hence, with these data we fit a functional logistic regression model,
using the weighted robust estimators defined in this paper and their classical alternatives. The trajectories corresponding to and are given in Figure 26.
| Low demand () | High demand () |

|
|
To compute the estimators, we used splines to generate the space of possible candidates and as above we denote the dimensional basis. As in the simulation study, after dimension reduction, we computed the finite–dimensional coefficients through (5) using as loss that leads to the deviance based estimators denoted cl and the function introduced in Croux and Haesbroeck, (2003) with tuning constant denoted m. We also computed the weighted versions of the previous estimators choosing as weights the weights based on the robust Mahalanobis distance of the projected data, that is, we evaluated the Donoho–Stahel location and scatter estimators, denoted and , respectively, of the sample with , and we defined when is less than or equal to and otherwise. For simplicity, in Table 4 below, these procedures are labelled wcl and wm, respectively. As in the simulation, to select the basis dimension we use the criterion defined in Section 2.4, that is, we minimize the quantity defined in (6). All procedures choose , except the estimator that selects .
| cl | m | wcl | wm |
| -1.564 | -1.588 | -1.693 | -1.811 |
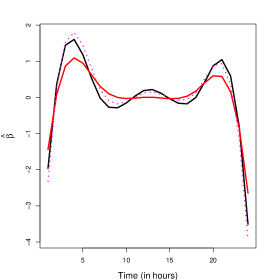
The estimates of are reported in Table 4, while those for are shown in Figure 27. In solid black and gray lines we represent the wm and estimators, respectively, while red solid and dashed lines correspond to the cl and wcl procedures. Comparing the obtained results, we note that the weighted estimators lead to slightly larger absolute values of the intercept. Regarding the estimation of , it is clear that the estimator produces a smoother curve since the basis dimension is smaller. The classical procedure is almost equal to between 9am and 4pm, while all the weighted estimators detect a positive “peak”around 1pm and two slumps near 8am and 17pm. All procedures detect the large peaks close 4am and 9pm, where prices seem to have a larger (in magnitude) association when predicting the demand, but for the classical procedure the magnitude of the function is smaller than that of the weighted ones in that range.

To identify potential atypical observations, we used the deviance QQ-plot defined in García Ben and Yohai, (2004). For that purpose, we considered the deviance residuals based on the estimator. More precisely, if stands for the weighted estimator, we compute the predicted probabilities and deviances and Let be the estimator of their distribution function, given by
where . We consider outliers those observations with deviance residual smaller than or larger than , leading to observations detected as possible atypical observations. These observations, together with the value of their residual deviance and predicted probability are reported in Table 5.
| Date | Date | |||||||
|---|---|---|---|---|---|---|---|---|
| 134 | 2006-07-25 | -5.686 | 1.000 | 66 | 2006-04-10 | 2.344 | 0.064 | |
| 136 | 2006-07-27 | -4.972 | 1.000 | 75 | 2006-04-25 | 2.905 | 0.015 | |
| 137 | 2006-07-28 | -2.667 | 0.971 | 76 | 2006-04-26 | 2.511 | 0.043 | |
| 469 | 2008-01-10 | -2.493 | 0.955 | 77 | 2006-04-27 | 2.313 | 0.069 | |
| 502 | 2008-03-03 | -2.412 | 0.945 | 445 | 2007-11-20 | 3.208 | 0.006 | |
| 508 | 2008-03-11 | -2.282 | 0.926 | 543 | 2008-05-06 | 2.393 | 0.057 | |
| 519 | 2008-03-28 | -3.052 | 0.990 | 550 | 2008-05-16 | 2.435 | 0.052 | |
| 621 | 2008-09-05 | -2.512 | 0.957 | 580 | 2008-07-01 | 2.196 | 0.090 | |
| 622 | 2008-09-08 | -2.497 | 0.956 | |||||
| 627 | 2008-09-15 | -2.385 | 0.942 | |||||
| 638 | 2008-09-30 | -2.923 | 0.986 | |||||
It is worth mentioning, that the observation corresponding to November 7 of 2006, which is an outlier in the covariate space is not detected as such by the deviance QQ-plot, since it does not correspond to a bad leverage point.
| Low demand | High demand |

|

|
The covariates related to the detected atypical observations are presented in Figure 28 with dashed black lines. The left panel correspond to the covariates corresponding to and the right one to , where we also indicate the curve corresponding to the 7th of November which clearly appears as an outlier in the covariate space.
We next compute the classical estimator after removing the identified outliers. The obtained value for the estimate of is -1.852, a value closer to the one obtained when using the wm, as reported in Table 4. Figure 29 presents the obtained estimator in dotted magenta lines. To facilitate comparisons we present in the left panel all the estimators and in the right one, only the weighted estimate with solid black line and the classical one computed with the whole data set and without the outliers, with a red solid line and a dotted magenta one. Note the similarity of the curve obtained by the wm method and the estimate obtained when using the cl method after removing the atypical observations.

|
|
6 Conclusion
This paper faces the problem of providing robust estimators for the functional logistic regression model. We tackle the problem by basis dimension reduction, that is, we consider a finite–dimensional space of candidates and, once the reduction is made, we use weighted estimators to down–weight the effect of bad leverage covariates. In this sense, our estimators are robust against outliers corresponding to miss–classified points, and also to outliers in the functional explanatory variables that have a damaging effect on the estimation. We also propose a robust BIC-type criterion to select the optimal dimension of the splines bases that seems to work well in practice.
Regarding the asymptotic behaviour of our proposal, we prove that the estimators are strongly consistent, under a very general framework which allows the practitioner to choose different basis as splines, Bernstein and Legendre polynomials, Fourier basis or Wavelet ones. The convergence rates obtained depend on the capability of the basis to approximate the true slope function. It is worth mentioning that unlike the weak consistency results obtained in Kalogridis, (2023) for penalized estimators based on divergence measures, our achievements do not require the covariates to be bounded. Moreover, strong consistency rather than convergence in probability of the sieve based weighted estimators is derived.
The performance in finite samples is studied by means of a simulation study and in a real data example. The simulation study reveals the good robustness properties of our proposal and the high sensitivity of the procedure based on the deviance when atypical observations are present. In particular, weighted estimators show their advantage over the unweighted ones, a fact already observed by Croux and Haesbroeck, (2003) when finite–dimensional covariates instead of functional ones are used in the model.
We also apply our method to a real data set where the weighted estimator remains reliable even in presence of misclassified observations corresponding to atypical functional explanatory variables. The deviance residuals obtained from the robust fit provide a natural way to identify potential atypical observations. The classical estimators obtained minimizing the deviance after dimension reduction and computed over the “cleaned” data set, that is, the data set without the outliers present a similar shape to those obtained by the robust procedure which automatically down–weights these data.
As it has been extensively discussed, functional data are intrinsically infinite–dimensional and even when recorded at a finite grid of points, they should be considered as random elements of some functional space rather than multivariate observations. For instance, in some applications, the functional covariates may be viewed as longitudinal data, while in other cases, the predictors are densely observed curves. Examples of these situations are the Mediterranean fruit flies data studied in Müller and Stadtmüller, (2005), for the former, and the Tecator data set studied in Ferraty and Vieu, (2006) or the Danone data set reported in Aguilera-Morillo et al., (2013), for the latter. In more challenging cases, the grid at which the predictors are recorded may be sparse or irregular and the observations may be possibly subject to measurement errors. The proposals considered in James, (2002) or Müller, (2005) for generalized functional regression models allow for sparse recording and measurement errors. Even when our proposal can be implemented if the predictors are observed on a dense grid of points, the asymptotic results derived make use of the whole process structure. The interesting situation of sparse and irregular time grids which is common, for instance, in longitudinal studies is beyond the scope of the paper and may be object of future research.
7 Acknowledgements.
This research was partially supported by Universidad de Buenos Aires [Grant 20020170100022ba] and anpcyt [Grant pict 2021-I-A-00260] at Argentina (Graciela Boente and Marina Valdora) and by the Ministry of Economy, Industry and Competitiveness, Spain (MINECO/AEI/FEDER, UE) [Grant MTM2016-76969P] (Graciela Boente).
A Appendix
From now on, we denote the function
| (8) |
Under A1 and A2, the function is continuous, bounded and strictly positive.
Denote where is given by (8). Under A1 and A2, the function is continuous and bounded and we will denote and , where we have used that from assumptions A1 and A2.
Henceforth, for any , we denote . Besides, stands for the population counterpart of , that is,
where . Recall that we have denoted and .
A.1 Some preliminary results
Lemma A.1 states the Fisher–consistency of the estimators defined through (5). It follows using similar arguments as those considered in Theorem S.1.1 from Bianco et al., (2022). Note that Lemma A.1(a) only states that the true value is one of the minimizers of the function , while in part (b) to derive that it is the unique minimizer an additional requirement, (9), is needed. As mentioned in Remark 3.2, this condition is related to the fact that the slope parameter is not identifiable if the kernel of the covariance operator of does not reduce to . Instead of asking (9) to hold for any , we require that the condition holds only for whenever , where henceforth, when , while when . It is worth mentioning that under A5 and A11, condition (9) is fulfilled.
Lemma A.1.
Proof.
(a) As in Theorem 2.2 in Bianco and Yohai, (1996), taking conditional expectation, we have that
where for a fixed value , we have denoted and .
We will show that, for any fixed , the function reaches its unique minimum when . For simplicity, denote , then, , where defined in (8) is positive. Hence, . Furthermore, , for , and for which entails that has a unique minimum at .
Hence, for any , , that is,
| (10) |
for any which concludes the proof of a).
Lemma A.3 provides an improvement over Lemma A.1 and will be helpful to derive Theorem 3.1. For its proof, we need the following Lemma which corresponds to Lemma 3 in Bianco et al., (2023). We state it here for completeness.
Lemma A.2.
The proof of Lemma A.3 is now a direct consequence of the previous result.
Proof.
For any , denote and let .
From now on, for any measure and class of functions , and will denote the covering and bracketing numbers of the class with respect to the distance in , as defined, for instance, in van der Vaart and Wellner, (1996). Furthermore, we will make use of the empirical process , where stands for the empirical probability measure of , , and is the probability measure corresponding of which follows the functional logistic regression model (1).
We will first derive a result regarding Glivenko–Cantelli results for classes depending on , which will be helpful to derive Lemma A.5(b) and which is a slight modification of Theorem 37 in Pollard, (1984), see also Lemma 2.3.3 in van de Geer, (1988).
Lemma A.4.
Let , be i.i.d. random elements in a metric space and be the class of bounded functions depending on , that is, for some positive constant , , for any and assume that for any , there exists some constant independent of and , such that
where is a non–random sequence of numbers such that . Then, we have that
Proof.
First of all, note that without loss of generality we may assume that , in which case
implying that for , we have that
Thus, using Lemma 8 in Pollard, (1984), we obtain the inequality
where and is a Rademacher sequence independent of , that is, are i.i.d. .
The covering number allows to choose functions , , such that for any , . Denote the index where the minimum is attained. Without loss of generality, we may assume that , so that . Thus, the approximation argument and Hoeffding’ s inequality lead to
Hence, using that , we have that for large enough
which implies that, for large enough,
so and the result follows now from the Borel–Cantelli lemma. ∎
To avoid burden notation, when there is no doubt we will denote instead of . To derive uniform results, Lemma A.5(a) below provides a bound to the covering number of the class of functions
| (12) |
Its proof relies on providing a bound for the Vapnik-Chervonenkis dimension for the set , which follows from Lemma S.2.2 in Bianco et al., (2022). Besides, Lemma A.5(b) shows that converges to with probability one, uniformly over . Its proof uses standard empirical processes. This uniform law of large numbers will be crucial to obtain consistency results for our proposal as given in Theorems 3.1(a) and 3.2.
Lemma A.5.
Let be a function satisfying A1 and A2, and a weight function satisfying A5. Let be the class of functions given in (12). Then,
-
(a)
for any measure , , there exists some constant independent of and , such that
where and .
-
b)
If in addition, A8 holds, we have .
-
c)
There exists a constant that does not depend on nor such that
(13) which entails that .
Proof.
(a) First of all note that since A1 and A5 hold, we have that is bounded and is a bounded function with , hence has envelope .
Lemma S.2.2 from Bianco et al., (2022) implies that the class of functions
where , is VC-subgraph with index smaller or equal than , since we now include an intercept term .
Note that for any we have , where and . Hence, using the permanence property of VC-classes when multiplying by a fixed function, in this case , we conclude that and the result follows now from Theorem 2.6.7 in van der Vaart and Wellner, (1996).
(b) From (a), using that and assuming that we get that
Hence, for any we have that
since A8 holds. Therefore, using Lemma A.4, we conclude that
completing the proof of (b).
(c) As in (a), using that and Theorem 2.6.7 in van der Vaart and Wellner, (1996), we deduce that there exists some constant independent of and , such that
| (14) |
for any measure , . Theorem 2.14.1 in van der Vaart and Wellner, (1996) allows us to conclude that, for some universal constant ,
where the supremum is taken over all discrete probability measures . Using (14) and that for and denoting , we get that
where we have used that . Let with . Then, we obtain that
which entails (13), since . Markov’s inequality immediately leads to , concluding the proof. ∎
The following result is needed to prove the convergence rates stated in Theorem 3.3. From now on, .
Lemma A.6.
Proof.
First note that and denote . Note that since , , where and .
For any , we have that
| (15) |
where we recall that . Hence,
Taking into account that , it can be written as , so . Thus, according to Corollary 2.6 in van de Geer, (2000), taking therein as measure the uniform measure on , we get that can be covered by
balls with center , , and radius . Besides, the interval may also be covered by balls with center , , and radius .
Given , take and for and , define the functions and
Given , let and be such that and and . Then, using (15), we obtain that
so , since . Besides,
which implies that
and the result follows taking . ∎
A.2 Proof of Theorems 3.1 and 3.2
Lemma A.7.
Proof.
From A8 and A9, we have that there exists , such that as . As mentioned above, we denote . Using that , we conclude that while from Lemma A.1(a) we have that . Thus,
| (16) |
where is defined in (12).
From Lemma A.5 we obtain that . On the other hand, from as , the fact that for any , we have the bound and the Cauchy-Schwartz inequality, we get that for any , . Thus, from the Bounded Convergence Theorem, the continuity of with respect to and its boundedness together with the boundedness of , we conclude that . Summarizing we have that
which concludes the proof. ∎
Proof of Theorem 3.1.
(a) From Lemma A.3, we have that there exists a constant independent from such that
Then, the result follows from Lemma A.7 which implies that .
(b) Recall that from (16) and Lemma A.3 we obtain that, for some constant independent of ,
Lemma A.5(c), entails that , so, using again that , the proof will be concluded if we show that
| (17) |
To prove (17), recall that where is given by (8) and that is finite. Thus,
Then, (17) follows now from the fact that .
(c) To derive (c) it will be enough to show that .
Using that is continuously differentiable with bounded derivative, we obtain that the derivative of the function defined in (8) equals
and is bounded. Hence, is also bounded. Denote .
To avoid burden notation, denote . Define the function as . Then,
Note that , and for all .
Recall that , then , for any . Therefore, we have that
where for some .
Therefore, using that is bounded, we obtain
| (18) |
where the last inequality follows from the Cauchy-Schwartz inequality and the fact that, for any , we have the bound , concluding the proof. ∎
Lemma A.8.
Proof.
From now on, denotes the unit ball in and . The Rellich–Kondrachov theorem entails that is compactly embedded in , hence is compact in .
To simplify the notation, let and . Furthermore, given , for , denote .
Step 1. We begin proving that, given , there exist and positive numbers such that for every , there exist such that
| (19) |
To derive (19), first given , define such that, for any
| (20) |
Fix now . Using that and A11, there exists a continuity point of the distribution of such that
| (21) |
Let stand for . Then, given , such that , and using that and the Cauchy–Schwartz inequality, we obtain
Hence, we get
| (22) |
Consider the covering of given by the open balls , . Using that is compact in , we get that there exist such that and . Therefore, from (22), we conclude that
| (23) |
meaning that, for every , there exist such that
concluding the proof of Step 1.
Step 2. We will show that for any
| (24) |
Let us consider a sequence it is enough to show that where . Using that is a bounded function and the bounded convergence theorem, we get that , where .
Note that as in the proof of Lemma A.1, we have that
| (25) |
where, as in the proof of Theorem 3.1, we denote and .
In the proof of Lemma A.1, we have shown that, for any fixed , the function reaches its unique minimum when and , for , and that for . Then, is strictly increasing on and strictly decreasing on , so and similarly .
Using A11 and that , we have that with probability one
| (26) |
Fix , such that satisfies (26) and is not or . Let and take as above . Then,
Using (25), A11 and A5, we obtain that Thus, using again that is a bounded function and the bounded convergence theorem, we obtain that
which concludes the proof of (24).
Step 3. Let us show that there exists such that for any , we have
| (27) |
where we have denoted . The proof is an extension to the functional setting of that of Lemma 6.3 in Bianco and Yohai, (1996).
Take where , the quantity is positive from (24) and .
From Step 1 we have that, for any , there exist such that (19) holds. Let be the index corresponding to the chosen and define the set . Then, from (19), we get that
| (28) |
Take and define . Then, using again that and that the set which is compact in , it is easy to see that for any such that , we have that
| (29) |
Using that the set is compact in we conclude that there exists (depending on and ) and a value which also depends on and , such that and . The continuity of together with the fact that and the Cauchy–Schwartz inequality leads to . Then, using (29), we conclude that
Therefore, using Fatou’s Lemma we obtain that
where we denote the complement of . Using (28) and assumption A5, we obtain that
so
which concludes the proof of (27).
Step 4. We will show that there exists and
| (30) |
Note that by proving (30), we may indeed conclude the proof. In fact, from Lemma A.7, we have that , thus if , . Take and such that for all , , then , which entails that for all , , as desired.
Let us show that (30) holds. From Step 3, there exists such that, for any , we have that where
and . Define , then , which implies that there exists such that
| (31) |
Taking into account that the open balls provide a covering of which is compact in , we get that there exist such that and . Thus, if , , and , from (31), we obtain that for we have
| (32) |
Let be such that , define , then , so there exists such that and . Therefore, using (32), we obtain that , so
concluding the proof. ∎
Proof of Theorem 3.2.
We will show only b), that is, that the result holds when , , , and provide approximations in , that is, below is the Sobolev space . The situation where follows similarly, replacing the supremum norm below by the norm and using that in this case, the Sobolev space is compactly embedded in and that A11 holds for any .
Assume that we have shown that
| (33) |
where . Then, taking into account that , that Lemma A.7 implies that and Lemma A.8, we conclude that .
Let us derive (33). Let be a sequence such that and . The Rellich–Kondrachov theorem entails that is compactly embedded in , hence the ball is compact in . Thus, there exist a subsequence of and a point with such that . Then, using that , we have which implies that . Using that and the Cauchy-Schwartz inequality, we get that for any , . Thus, using the Bounded Convergence Theorem, the continuity of with respect to and its boundedness, we get that , which leads to . Using that A11 holds and taking into account that , Lemma A.1(b) implies that concluding the proof. ∎
A.3 Proof of Theorem 3.3 and Proposition 3.4
Proof of Theorem 3.3.
From assumption A10, we have that there exists an element , such that . Without loss of generality, we assume that with defined in A1. Recall that .
In order to get the convergence rate of our estimator we will apply Theorem 3.4.1 of van der Vaart and Wellner, (1996). According to the notation in that Theorem, let and , where is given in assumption A1. Furthermore, the function in that Theorem equals
First of all, note that Theorem 3.2 implies that as required. Secondly, to emphasize the dependence on denote with defined in assumption A10. Assumption A6b, the fact that and the Bounded Convergence Theorem implies that , as . Furthermore, from Theorem 3.2, we get that . Hence, using the triangular inequality, we immediately obtain that as required in Theorem 3.4.1 of van der Vaart and Wellner, (1996). Moreover, we also have that , since , which is also a requirement to apply that result.
To make use of Theorem 3.4.1 of van der Vaart and Wellner, (1996), we have to show that there exists a function such that is decreasing on , for some and such that, for any , we have
| (34) | |||
| (35) |
where , stands for the outer expectation and .
We begin by showing (34). Assumption A1 entails that, for any ,
| (36) |
while from (18) in the proof of Theorem 3.1(c), we get that
| (37) |
Moreover, using the Cauchy Schwartz inequality and the fact that , we have
which together with the inequality , implies that
| (38) |
Then combining (36), (37) and (38), we get that for any , such that , we have
concluding the proof of (34).
We have now to find such that is decreasing in , for some and (35) holds. Define the class of functions
with . Inequality (35) involves an empirical process indexed by , since
For any we have that . Furthermore, if using the inequality
and the fact that and , we get that
Lemma 3.4.2 in van der Vaart and Wellner, (1996) leads to
where is the bracketing integral of the class .
Recall that , so for large enough, , so that, for any , we have . Therefore, where is defined in Lemma A.6 and we take , and . Hence, the bound given in Lemma A.6 ensures that leads to
for some positive constant independent of , and . Therefore, for , we have
where . Note that as , hence there exists and a constant such that for any , . This implies that for
If we denote , we obtain that for some constant independent of and ,
Choosing
we have that is decreasing in , concluding the proof of (35).
To apply Theorem 3.4.1 of van der Vaart and Wellner, (1996), it remains to show that and
| (39) |
since , for . First note that and , then .
To derive (39), observe that
where . Hence, to derive that , it is enough to show that , which follows easily since and , concluding the proof of (39).
Hence, from Theorem 3.4.1 of van der Vaart and Wellner, (1996), we get that . As noticed above,
Then, using that , we get that and from the triangular inequality we obtain that , as desired. ∎
Proof of Proposition 3.4.
From Lemma A.3, we have that there exists a constant independent from such that, for any ,
then to show that A1 holds, it will be enough to show that there exists a constant such that, for any with ,
and then take and .
Since , we have that, with probability one, for any ,
Thus, using that is strictly increasing we get that
| (40) |
The Mean Value Theorem implies that given with there exists , , such that
where the last inequality follows from (40), since and the proof is concluded taking . ∎
References
- Aguilera et al., (2008) Aguilera, A., Escabias, M., and Valderrama, M. (2008). Discussion of different logistic models with functional data: Application to systemic lupus erythematosus. Computational Statistics and Data Analysis, 53:151–163.
- Aguilera-Morillo et al., (2013) Aguilera-Morillo, M., Aguilera, A., Escabias, M., and Valderrama, M. (2013). Penalized spline approaches for functional logit regression. Test, 22:251–277.
- Alin and Agostinelli, (2017) Alin, A. and Agostinelli, C. (2017). Robust iteratively reweighted simpls. Journal of Chemometrics, 31:e2881.
- Aneiros-Pérez et al., (2017) Aneiros-Pérez, G., Bongiorno, E. G., Cao, R., and Vieu, P. (2017). Functional Statistics and Related Fields. Springer.
- Basu et al., (1998) Basu, A., Harris, I. R., Hjort, N. L., and Jones, M. C. (1998). Robust and efficient estimation by minimizing a density power divergence. Biometrika, 85:549–559.
- Bianco et al., (2022) Bianco, A., Boente, G., and Chebi, G. (2022). Penalized robust estimators in logistic regression with applications to sparse models. Test, 31:563–594.
- Bianco et al., (2023) Bianco, A., Boente, G., and Chebi, G. (2023). Asymptotic behaviour of penalized robust estimators in logistic regression when dimension increases. In Robust and Multivariate Statistical Methods: Festschrift in Honor of David E. Tyler, Eds: Yi, Mengxi and Nordhausen, Klaus, pages 323–348. Springer International Publishing.
- Bianco and Martinez, (2009) Bianco, A. and Martinez, E. (2009). Robust testing in the logistic regression model. Computational Statistics and Data Analysis, 53:4095–4105.
- Bianco and Yohai, (1996) Bianco, A. and Yohai, V. (1996). Robust estimation in the logistic regression model. Lecture Notes in Statistics, 109:17–34.
- Boente and Martinez, (2023) Boente, G. and Martinez, A. (2023). A robust spline approach in partially linear additive models. Computational Statistics and Data Analysis, 178:107611.
- Boente et al., (2020) Boente, G., Salibián-Barrera, M., and Vena, P. (2020). Robust estimation for semi–functional linear regression models. Computational Statistics and Data Analysis, 152:107041.
- Bondell, (2005) Bondell, H. D. (2005). Minimum distance estimation for the logistic regression model. Biometrika, 92:724–731.
- Bondell, (2008) Bondell, H. D. (2008). A characteristic function approach to the biased sampling model, with application to robust logistic regression. Journal of Statistical Planning and Inference, 138:742–755.
- Cai and Hall, (2006) Cai, T. and Hall, P. (2006). Prediction in functional linear regression. Annals of Statistics, 34:2159–2179.
- Cantoni and Ronchetti, (2001) Cantoni, E. and Ronchetti, E. (2001). Robust inference for generalized linear models. Journal of the American Statistical Association, 96:1022–1030.
- Cardot et al., (2003) Cardot, H., Ferraty, F., and Sarda, P. (2003). Spline estimators for the functional linear model. Statistica Sinica, 13:571–591.
- Cardot and Sarda, (2005) Cardot, H. and Sarda, P. (2005). Estimation in generalized linear models for functional data via penalized likelihood. Journal of Multivariate Analysis, 92:24–41.
- Carroll and Pederson, (1993) Carroll, R. J. and Pederson, S. (1993). On robust estimation in the logistic regression model. Journal of the Royal Statistical Society, Series B, 55:693–706.
- Croux and Haesbroeck, (2003) Croux, C. and Haesbroeck, G. (2003). Implementing the Bianco and Yohai estimator for logistic regression. Computational Statistics and Data Analysis, 44:273–295.
- Cuevas, (2014) Cuevas, A. (2014). A partial overview of the theory of statistics with functional data. Journal of Statistical Planning and Inference, 147:1–23.
- Denhere and Billor, (2016) Denhere, M. and Billor, N. (2016). Robust principal component functional logistic regression. Communications in Statistics: Simulation and Computation, 45:264–281.
- DeVore and Lorentz, (1993) DeVore, R. and Lorentz, G. (1993). Constructive Approximation. Springer.
- Escabias et al., (2005) Escabias, M., Aguilera, A., and Valderrama, M. (2005). Modeling environmental data by functional principal component logistic regression. Environmetrics, 16:95–107.
- Escabias et al., (2004) Escabias, M., Aguilera, A. M., and Valderrama, M. (2004). Principal component estimation of functional logistic regression: Discussion of two different approaches. Journal of Nonparametric Statistics, 16:365–384.
- Febrero-Bande et al., (2017) Febrero-Bande, M., Galeano, P., and González-Manteiga, W. (2017). Functional principal component regression and functional partial least–squares regression: An overview and a comparative study. International Statistical Review, 85:61–83.
- Ferraty and Romain, (2010) Ferraty, F. and Romain, Y. (2010). The Oxford Handbook of Functional Data Analysis. Oxford University Press.
- Ferraty and Vieu, (2006) Ferraty, F. and Vieu, P. (2006). Nonparametric Functional Data Analysis: Theory and Practice. Springer.
- García Ben and Yohai, (2004) García Ben, M. and Yohai, V. J. (2004). Quantile–quantile plot for deviance residuals in the generalized linear model. Journal of Computational and Graphical Statistics, 13:36–47.
- Goia and Vieu, (2016) Goia, A. and Vieu, P. (2016). An introduction to recent advances in high/infinite dimensional statistics. Journal of Multivariate Analysis, 146:1–6.
- Hall and Horowitz, (2007) Hall, P. and Horowitz, J. L. (2007). Methodology and convergence rates for functional linear regression. Annals of Statistics, 35:70–91.
- He and Shi, (1996) He, X. and Shi, P. (1996). Bivariate tensor-product B-spline in a partly linear model. Journal of Multivariate Analysis, 58:162–181.
- He and Shi, (1998) He, X. and Shi, P. (1998). Monotone B-spline smoothing. Journal of the American statistical Association, 93:643–650.
- He et al., (2002) He, X., Zhu, Z., and Fung, W. (2002). Estimation in a semiparametric model for longitudinal data with unspecified dependence structure. Biometrika, 89:579–590.
- Hobza et al., (2008) Hobza, T., Pardo, L., and Vajda, I. (2008). Robust median estimator in logistic regression. Journal of Statistical Planning and Inference, 138:3822–3840.
- Horváth and Kokoszka, (2012) Horváth, L. and Kokoszka, P. (2012). Inference for Functional Data with Applications. Springer.
- Hsing and Eubank, (2015) Hsing, T. and Eubank, R. (2015). Theoretical foundations of Functional Data Analysis with an introduction to Linear Operators, volume 997. John Wiley and Sons.
- Hubert et al., (2005) Hubert, M., Rousseeuw, P. J., and Vanden Branden, K. (2005). ROBPCA: A new approach to robust principal component analysis. Technometrics, 47:64–79.
- James, (2002) James, G. M. (2002). Generalized linear models with functional predictors. Journal of the Royal Statistical Society: Series B (Statistical Methodology), 64:411–432.
- Kalogridis, (2023) Kalogridis, I. (2023). Robust and adaptive functional logistic regression. Available at https://arxiv.org/abs/2305.01350.
- Kalogridis and Van Aelst, (2019) Kalogridis, I. and Van Aelst, S. (2019). Robust functional regression based on principal components. Journal of Multivariate Analysis, 173:393–415.
- Kalogridis and Van Aelst, (2023) Kalogridis, I. and Van Aelst, S. (2023). Robust penalized estimators for functional linear regression. Journal of Multivariate Analysis, 194:105104.
- Liebl, (2013) Liebl, D. (2013). Modelling and forecasting electricity spot prices: a functional data perspective. The Annals of Applied Statistics, 7:1562–1592.
- López-Pintado and Romo, (2009) López-Pintado, S. and Romo, J. (2009). On the concept of depth for functional data. Journal of the American Statistical Association, 104:718–734.
- Lu, (2015) Lu, M. (2015). Spline estimation of generalised monotonic regression. Journal of Nonparametric Statistics, 27:19–39.
- Mallat, (2009) Mallat, S. (2009). A Wavelet Tour of Signal Processing: the Sparse Way. Academic Press.
- Maronna et al., (2019) Maronna, R., Martin, D., Yohai, V., and Salibián-Barrera, M. (2019). Robust Statistics: Theory and Methods (with R). John Wiley and Sons.
- Maronna and Yohai, (2013) Maronna, R. and Yohai, V. (2013). Robust functional linear regression based on splines. Computational Statistics and Data Analysis, 65:46–55.
- Marx and Eilers, (1999) Marx, B. D. and Eilers, P. H. C. (1999). Generalized linear regression on sampled signals and curves: A P-spline approach. Technometrics, 4:1–13.
- Mousavi and Sørensen, (2018) Mousavi, S. N. and Sørensen, H. (2018). Functional logistic regression: A comparison of three methods. Journal of Statistical Computation and Simulation, 88:250–268.
- Müller, (2005) Müller, H. G. (2005). Functional modelling and classification of longitudinal data. Scandinavian Journal of Statistics, 32:223–240.
- Müller and Stadtmüller, (2005) Müller, H. G. and Stadtmüller, U. (2005). Generalized functional linear models. Annals of Statistics, 33:774–805.
- Mutis et al., (2022) Mutis, M., Beyaztas, U., Simsek, G., and Shang, H. (2022). A robust scalar–on–function logistic regression for classification. Communications in Statistics - Theory and Methods, pages 1–17.
- Pollard, (1984) Pollard, D. (1984). Convergence of Stochastic Processes. Springer Series in Statistics.
- Powell, (1981) Powell, M. (1981). Approximation Theory and Methods. Cambridge: Cambridge University Press.
- Qingguo, (2015) Qingguo, T. (2015). Estimation for semi-functional linear regression. Statistics, 49:1262–1278.
- Ramsay and Silverman, (2002) Ramsay, J. and Silverman, B. (2002). Applied Functional Data Analysis. Methods and Case Studies. Springer.
- Ramsay and Silverman, (2005) Ramsay, J. and Silverman, B. (2005). Functional Data Analysis, 2nd edition. Springer.
- Ramsay, (2004) Ramsay, J. O. (2004). Functional data analysis. Encyclopedia of Statistical Sciences.
- Ratcliffe et al., (2002) Ratcliffe, S. J., Heller, G. Z., and Leader, L. R. (2002). Functional data analysis with application to periodically stimulated foetal heart rate data. II: Functional logistic regression. Statistics in Medicine, 21:1115–1127.
- Reiss et al., (2017) Reiss, P. T., Goldsmith, J., Shang, H. L., and Ogden, R. T. (2017). Methods for scalar–on–function regression. International Statistical Review, 85:228–249.
- Reiss et al., (2005) Reiss, P. T., Ogden, R. T., Mann, J., and Parsey, R. V. (2005). Functional logistic regression with pet imaging data: A voxel-level clinical diagnostic tool. Journal of Cerebral Blood Flow and Metabolism, 25:S635–S635.
- Ronchetti, (1985) Ronchetti, E. (1985). Robust model selection in regression. Statistics and Probability Letters, 3:21–23.
- Schumaker, (1981) Schumaker, L. (1981). Spline Functions: Basic Theory. Wiley.
- Schwarz, (1978) Schwarz, G. (1978). Estimating the dimension of a model. Annals of Statistics, 6:461–464.
- Sørensen et al., (2013) Sørensen, H., Goldsmith, J., and Sangalli, L. M. (2013). An introduction with medical applications to functional data analysis. Statistics in Medicine, 32:5222–5240.
- Stone, (1982) Stone, C. (1982). Optimal global rates of convergence for nonparametric regression. Annals of Statistics, 10:1040–1053.
- Stone, (1985) Stone, C. (1985). Additive regression and other nonparametric models. Annals of Statistics, 13:689–705.
- Sun and Genton, (2011) Sun, Y. and Genton, M. G. (2011). Functional boxplots. Journal of Computational and Graphical Statistics, 20:316–334.
- Tharmaratnam and Claeskens, (2013) Tharmaratnam, K. and Claeskens, G. (2013). A comparison of robust versions of the AIC based on M-, S- and MM-estimators. Statistics, 47:216–235.
- van de Geer, (1988) van de Geer, S. (1988). Regression Analysis and Empirical Processes. CWI Tract 45. Center for Mathematics and Computer Science, Amsterdam. Available at https://ir.cwi.nl/pub/13169.
- van de Geer, (2000) van de Geer, S. (2000). Empirical Processes in Estimation. Cambridge Series in Statistical and Probabilistic Mathematics.
- van der Vaart and Wellner, (1996) van der Vaart, A. W. and Wellner, J. A. (1996). Weak Convergence and Empirical Processes. Springer, New York.
- Wang and Xiang, (2012) Wang, H. and Xiang, S. (2012). On the convergence rates of Legendre approximation. Mathematics of Computation, 81:861–877.
- Wang et al., (2016) Wang, J. L., Chiou, J., and Müller, H. (2016). Functional data analysis. Annual Review of Statistics and Its Application, 3:257–295.
- Wang et al., (2017) Wang, X., Nan, B., Zhu, J., Koeppe, R., and Frey, K. (2017). Classification of ADNI PET images via regularized 3D functional data analysis. Biostatistics and Epidemiology, 1:3–19.
- Zhao et al., (2012) Zhao, Y., Ogden, T., and Reiss, P. (2012). Wavelet-based LASSO in functional linear regression. Journal of Computational and Graphical Statistics, 21:600–617.