RiskLabs: Predicting Financial Risk Using Large Language Model Based on Multi-Sources Data
Abstract
The integration of Artificial Intelligence (AI) techniques, particularly large language models (LLMs), in finance has garnered increasing academic attention. Despite progress, existing studies predominantly focus on tasks like financial text summarization, question-answering (QA), and stock movement prediction (binary classification), with a notable gap in the application of LLMs for financial risk prediction. Addressing this gap, in this paper, we introduce RiskLabs, a novel framework that leverages LLMs to analyze and predict financial risks. RiskLabs uniquely combines different types of financial data, including textual and vocal information from Earnings Conference Calls (ECCs), market-related time series data, and contextual news data surrounding ECC release dates. Our approach involves a multi-stage process: initially extracting and analyzing ECC data using LLMs, followed by gathering and processing time-series data before the ECC dates to model and understand risk over different timeframes. Using multimodal fusion techniques, RiskLabs amalgamates these varied data features for comprehensive multi-task financial risk prediction. Empirical experiment results demonstrate RiskLab’s effectiveness in forecasting both volatility and variance in financial markets. Through comparative experiments, we demonstrate how different data sources contribute to financial risk assessment and discuss the critical role of LLMs in this context. Our findings not only contribute to the AI in finance application but also open new avenues for applying LLMs in financial risk assessment.
1 Introduction
The integration of artificial intelligence (AI) techniques have dramatically transformed financial activities, including the way transactions are processed, investment decisions are made, and services are delivered across the industry Belhaj and Hachaıchi (2021); Ashta and Herrmann (2021). This technological evolution has facilitated the automation of complex and time-consuming tasks, allowing for more efficient and accurate operations.
Several compelling examples showcase how AI applications in finance support market participants to meet their needs for optimizing investment strategies, improving risk management, and enhancing customer service experiences. Investors are focused on identifying the underlying factors that influence key financial metrics. Techniques such as Random Forest, Support Vector Machines (SVM), and k_Nearest Neighbors (KNN) are effective at capturing both of the linear, non-linear relationships between variables Wu et al. (2006); Breiman (2001); Cortes and Vapnik (1995). Gu et al. (2020) explore the correlation between economic indicators and the performance of different asset classes using Tree-based models. Khaidem et al. (2016); Lee (2007) use SVM to predict credit rating using ratios from financial statements.
In addition to structured data like historical stock prices, investors are also seeking to derive trading signals from unstructured sources, such as financial reports and media news. Souma et al. (2019); Mohan et al. (2019); Liapis et al. (2023) use Recurrent Neural Networks (RNN) to analyze and extract sentiment from news articles, aiming to uncover market attitude towards the stock trends. Ahbali et al. (2022); Wang et al. (2023) use Natural Language Processing (NLP) techniques to monitor corporate credit risk by analyzing vast quantities of textual data for early warning signals and indicators of potential risks. Aue et al. (2022) use information extracted from news articles to construct Environmental, Social, and Governance (ESG) scores for companies. For instance, during quarterly earning conference calls, CEOs present the company’s past performance and future outlook, offering a wealth of information not just in the content but in the delivery itself. Qin and Yang (2019) focus on extracting information from audio recordings, such as changes in tone, speaker emotion, and the rate of speech, to predict the stock movement. They have shown that integrating audio analysis with traditional transcript text significantly enhances the accuracy of predictive models. Yang et al. (2020) further extends the idea of using multimodal data to improve risk prediction performance in multi-task learning, and the authors’ experiments show that predicting multiple tasks at the same time can help the model further improve prediction performance.
The previously discussed models all fall under the category of supervised learning, which, while effective, is highly task-specific and has limited adaptability to the generalization Singh et al. (2016). For example, a supervised learning model trained to summarize financial documents would require extensive training on specialized, labeled data from that domain. Its performance could significantly deteriorate if applied to summarizing energy sector reports, illustrating a key limitation in domain adaptability. Furthermore, the predictive performance of these models is constrained by the relatively limited amount of input data length they can process and the size of their parameters Li et al. (2020). However, the emergence of Large Language Models (LLMs) represents a paradigm shift in overcoming these challenges. LLMs, with their expansive knowledge base and advanced zero-shot learning capabilities, can effectively perform a broad spectrum of text-related tasks, such as summarization Zhang et al. (2024), question-answer Wei et al. (2022), and sentiment analysis Zhang et al. (2023) without the necessity for task-specific or domain-centric training.
There has been a lot of prior work that has begun to explore how LLM can be used to solve problems related to the financial sector. Li et al. (2023) explore how LLMs have been adeptly applied to summarize and abstract complex financial documents such as 10-K, 10-Q filings. Furthermore, Yang et al. (2023); Yu et al. (2023) explores the usage of LLMs in mining extensive media news to derive trading recommendations, highlighting the models’ ability to understand subtle market indicators and sentiments that might reveal human analysis. In the domain of customer service, the implementation of LLM-powered chatbots is spotlighted for offering context-aware interactions, serving as both assistants and consultants Lakhani (2023); Subagja et al. (2023); Soni (2023). Abdaljalil and Bouamor (2021); Zmandar et al. (2021) have delved into the specific task of navigating financial and legal items from long text documents, such as financial regulations, legal stipulations, and comprehensive policy manuals. This research highlights the adeptness of LLMs in parsing and understanding complex textual information to identify and retrieve highly specific content. In summary, these scholarly works illuminate the diverse and impact applications of LLMs, affirming the critical role of advanced AI technologies in enhancing business operations and decision-making processes.
While there is a growing body of literature on the application of Large Language Models (LLMs) in finance, the specific area of financial risk prediction—such as market volatility and Value at Risk (VaR)—remains relatively unexplored. This observation underscores the novelty and significance of our research focus, which is dedicated to leveraging LLMs for financial risk prediction. The exploration of financial risk is crucial not only for understanding market dynamics but also for building resilience and ensuring sustainable success across various sectors Mitchell (2013); Van Der Vegt et al. (2015); Becker (2023). Our work seeks to bridge this research gap, recognizing the potential of LLMs to offer innovative insights in this pivotal aspect of finance.
In contemplating the application of Large Language Models (LLMs) for financial risk prediction, we recognized several inherent challenges. Primarily, analyzing market reactions like predicting stock volatility necessitates a comprehensive understanding of the multifaceted environment in which these markets operate, due to their inherent complexity. This requires the assimilation of diverse data sources, as different types of information can shed light on various aspects of the market. The true challenge lies in integrating multiple data types—ranging from quantitative data like stock prices and financial indicators to qualitative data from news articles, earnings transcripts, and social media—to form a more holistic view of the market. However, there are relatively few studies that attempt to merge these disparate data sources into a unified analysis. Bridging this gap could significantly enhance our ability to understand and predict market dynamics.
Moreover, the innate limitations of LLMs pose further hurdles in their functional deployment. For instance, For instance, using LLMs merely as tools for querying financial forecasts, with questions like “What will the stock price be tomorrow?", could yield imprecise outcomes. Utilizing large language models without careful data preprocessing and critical analysis of the results can lead to issues, leading users to make uninformed or misinformed financial decisions. One significant risk associated with this approach is the phenomenon known as ‘hallucination’, where LLMs generate responses incorrect responses rather than using factual accuracy or real-world data analysis Rawte et al. (2023).
Except for the hallucination problem, another inherent limitation when using Large Language Models to address financial queries lies in their inability to analyze current events and market conditions, as the training data for these models typically concludes at a specific cutoff point, such as 2021 Achiam et al. (2023). This presents a significant challenge in the context of financial analysis, where the relevancy and accuracy of information are significant, and the value of data diminishes rapidly with time. Financial markets are highly dynamic, with stock prices, economic indicators, and market sentiment changing constantly, often influenced by recent events, announcements, and global trends.
Given this gap, in designing financial risk prediction framework using LLM, this paper is interested in exploring the following research questions (RQs):
-
•
RQ1: How does the predictive performance of Large Language Models (LLMs) compare with other artificial intelligence techniques in forecasting risk metrics?
-
•
RQ2: What are the differences in predictive performance between traditional finance methods and Large Language Models LLMs in forecasting financial risk metrics?
-
•
RQ3: What role do large language models play in the financial area?
-
•
RQ4: How can multiple inputs of varying data types be effectively incorporated and balanced?
-
•
RQ5: How can the LLM model be updated with new media news and information?
In order to address the problems we mentioned above, this paper proposes a RiskLabs (Risk-Large Language model Based with Multi-sources input) framework. To accurately grasp the comprehensive complexities of the investment environment, our model is designed to ingest and analyze data from multiple sources, ensuring a holistic view of the factors that impact financial markets. This multifaceted data source includes: (1) Earnings conference call transcripts, which provide insight into company performance and future outlooks as communicated by corporate executives; (2) Earnings conference call audio, offering additional details such as tone and sentiment that might not be captured in text alone; (3) media news, to gauge the current economic, political, and social climate affecting market sentiment and investor behavior; and (4) time series data, for historical and real-time analysis of market trends and stock performance.
RiskLabs is equipped with four key modules to effectively process these diverse data streams: a) The Earnings Conference Call Encoder: leveraging LLM to handle data related to earnings conference call (1 and 2); b) The News-Market Reactions Encoder: establishing a pipeline through LLM to collect and interpret news data; c) The Time-Series Encoder: organizing and analyzing time-related data; and d) The Multi-Task Prediction: which amalgamates outputs from the aforementioned modules for multifaceted prediction. This synthesis of varied inputs allows the model to provide a nuanced understanding of the investment landscape, blending quantitative market data with qualitative insights. Such an integrated methodology is crucial for precise forecasting and risk assessment, a key to navigating the often turbulent and complex terrain of financial markets.
In our various modules, we employ Large Language Models (LLMs) to create dedicated pipelines for text analysis. To effectively process and analyze text-based content, we propose three pipelines: (1)Earnings conference call transcript analyzer, (2) enrich news attribute pipeline (3) news analyzer. These pipelines are based on an LLM technique known as retrieval augmentation generation (RAG) Lewis et al. (2020); Shuster et al. (2021). This approach is specifically designed to mitigate the issue of hallucination and use the updated material. More specifically, our approach goes beyond simply inputting a text file into an LLM model and awaiting the output. Instead, it is equipped with a function designed to interact intelligently with the LLM, thereby refining the retrieval process. This interaction enables the system to dynamically adjust queries based on initial responses, ask follow-up questions, or even reformulate the input to ensure that the information being sought is accurately retrieved and analyzed.
The news analyzer plays a crucial role in identifying the connections between news articles and market reactions, adopting a dual perspective of recency and relevance to achieve this. For recency, the focus is on analyzing news from the last three days, ensuring that the most current events are considered for their potential impact on the market. Regarding relevance, the goal is to identify news articles from the past that bear the highest similarity to current events. Similar events tend to have similar market responses. However, this task is challenging due to the vast diversity of news, making it difficult to find historical counterparts based solely on similarity. Therefore, to tackle this, the analyzer leverages an enriched news attributes pipeline, which encompasses a wide array of information related to each news piece. This information acts as a preliminary filter, helping to eliminate unrelated or irrelevant articles early in the process. Subsequently, the top ’k’ news articles that most closely match the current news in question are selected. This methodical approach allows for a refined analysis that significantly reduces noise and enhances the accuracy of understanding how current events resonate with historical market reactions, offering insightful perspectives on potential future market movements.
In addition to processing text data, our system includes a specialized module designed to handle audio data through the use of the LLM model. This innovative module extends the capabilities of traditional LLMs beyond textual analysis, allowing for the interpretation and understanding of earnings conference call recordings.
By incorporating a diverse range of inputs and using processing steps, RiskLabs solves a multitasking problem: forecasting volatility over various intervals (3 days, 7 days, 15 days, and 30 days), as well as the value at risk (VaR). To enhance the predictive capabilities for solving multitasking problems, we have developed a novel approach dubbed the Bayes-VaR method. This innovative technique is specifically designed to capture and elucidate the intricate relationships between response variables, which are crucial for forecasting tasks such as volatility and Value at Risk (VaR) estimations over different time intervals. By leveraging Bayesian statistics, the Bayes-VaR method provides a probabilistic framework that allows for the incorporation of prior knowledge and the updating of beliefs as new evidence is presented. This approach not only improves the accuracy of predictions by taking into account the inherent uncertainties and correlations in financial markets but also offers a more nuanced understanding of the risk factors influencing these metrics. Through this method, we can better model the complex dynamics between various financial indicators, thereby significantly enhancing our ability to predict market behaviors and risk exposures with greater precision and reliability.
Our contributions are encapsulated as follows: 1) We utilize LLM to develop the RiskLabs framework, thereby addressing the shortfall in applying LLMs to financial risk prediction. 2) The versatility of our model lies in its capability to seamlessly integrate a variety of financial data from multiple sources, consequently bolstering risk prediction accuracy. 3) The efficacy of our framework is evidenced by experimental results, demonstrating its effectiveness in forecasting financial risks. 4) Furthermore, we provide a comprehensive analysis of the pivotal role LLM should assume in the realm of financial risk prediction.
The subsequent sections of the article are outlined as follows: Section 2 provides an in-depth exploration of the data types and the specific dataset utilized in our study. It also clarifies the nature of our prediction task and delves into the intricate details of our framework’s structure and functionality. In Section 3, we conduct a thorough evaluation of both the overall performance of the model and the individual efficacy of each module. This section also includes comprehensive responses to the research questions outlined earlier. Finally, Section 4 revisits the central themes of our research, summarizing key insights and proposing practical solutions to address the current challenges and obstacles in the field.
2 RiskLabs Framework
Figure 1 illustrates the RiskLabs Framework, designed to handle multiple data types surrounding the financial information including audio, text, and time-series from different sources. The framework comprises four main modules: 1) Earnings Conference Call Encoder; 2) Time-Series Encoder; 3) Relevant News Encoder; and 4) Multi-Task Prediction Block. This section outlines the format of the data input and details each module. In brief, the Earnings Conference Call Encoder, Time-Series Data Encoder, and Relevant News Encoder are utilized to extract features from various data types. These features are fused data undergoes processing and modeling, after which it is fed into the Multi-Task Prediction Block. This block is responsible for forecasting both volatility for difference interval and VaR (Value at Risk) values.

2.1 Multi-Source Data Input
Previous research has shown that textual information in a company’s financial statements can be used to predict the level of risk in its stock Kogan et al. (2009). In the current landscape, CEOs communicate not only through written mediums like press releases and financial reports but also through investor meetings and earnings conference calls, often captured in audio and video formats. Technological advancements have made it possible to archive and access audio recordings of investor meetings and videos of CEOs’ speeches, available to both organizations and individuals. Additionally, research in natural language processing (NLP) indicates that a CEO’s affective state, tone, and mood, as conveyed through voice cues, can complement verbal information and enhance risk prediction Qin and Yang (2019). Therefore, relevant earnings conference call data form a vital component of our dataset. In detail, each earnings conference call data sample consists of two parts: an audio record and a corresponding transcript.
Furthermore, the literature suggests that combining historical numerical data can enhance the accuracy of financial predictions, considering the varied frequencies of multiple data sources Sawhney et al. (2020). To accommodate this, we gather historical price data for the 30 days preceding earnings announcements, acknowledging the different frequencies of data sources like daily price updates and quarterly earnings notices. This historical price data represents our second key data source.
Additionally, prior research has often overlooked the influence of earnings conference call releases on long-term forecasts. While earnings conference calls can cause significant short-term volatility in financial risk, their quarterly frequency diminishes their long-term forecast impact. To address this, we also compile daily relevant news texts centered around the firm, serving as our third crucial data source. This approach aims to provide a more comprehensive view of the company’s financial standing, considering both short-term events and long-term trends.
In this study, the dataset is from the publicly available S&P 500 earnings conference call dataset as constructed by Qin and Yang (2019). This dataset comprises both audio recordings and their corresponding text transcripts from the 2017 earnings conference calls of 500 major public companies listed in the S&P 500 Index and traded on U.S. stock exchanges. Originally, the dataset contained 2,243 conference calls from 2017. However, due to the challenge of noisy and imprecise alignments between audio and text, a significant portion of this raw data was deemed unusable. Consequently, we focused on 576 unique instances where the audio recordings were accurately and closely aligned with the text transcripts. These instances represent profitable conference calls and encompass a total of 88,829 sentences where the text and audio data were well-matched. To enrich this dataset, we collected corresponding time-series data and conducted thorough research to identify relevant news items pertaining to these companies and the dates of their ECC releases. This extensive process of data collation and curation led to the construction of the comprehensive dataset employed in our experiments.
2.2 Response Variables
RiskLabs is a multi-task training model that trains and predicts the volatility of different terms and VaR. In the model, our first task is to predict the four different terms of volatility, which are 3-day, 7-day, 15-day, and 30-day volatility. We focused on different volatility terms for the following reasons: (1) Multiple terms could reflect the level of stability in different time horizons. In our mind, we consider that 3-day, 7-day could reflect the short-term risk, 15-days could reflect the mid-term Risk, and 30-days could reflect the long-term risk; (2) 30-day volatility will link to the VIX; (3) Volatility will be an essential part for the portfolio management, specifically in portfolio weight adjustment and asset selection.
Our second task is predicting the 1-day VaR of the target stock based on the multi-source inputs. The definition of VaR is:
The is the cumulative loss distribution, is the percentile we set, and is the VaR. From the idea of Quantile Regression, we can have:
Calculating and estimating VaR can help the company better deal with financial risks and avoid extreme scenarios in the future.
2.3 Earnings Conference Call Encoder
The Earnings Conference Call Encoder module is composed of four key components: 1) Audio Encoding; 2) Transcript Encoding; 3) Earnings Conference Call Analyzer; and 4) Additive Multi-modal Fusion. In the first two components, audio and textual data are initially converted into vector space representations using an appropriate pre-trained model. Subsequently, a multi-head attention mechanism is employed to extract salient features. The third component involves the utilization of a large language model to summarize and abstract the text. This process aims to distill the essential information contained in the text and transform it into a suitable vector format. Lastly, the Additive Multi-modal Fusion integrates these feature sets, effectively combining the information extracted from both audio and textual data. This holistic approach ensures a comprehensive analysis of the earnings conference call, leveraging multiple data modalities for a more robust encoding.
2.3.1 Audio Encoding
The Audio Encoding component consists of a pre-trained audio embedding model, a Multi-Head Self-Attention, and an Average Pooling layer. Firstly, we extracted audio embedding using the Wav2vec2, a transformer-based Large Language Model proposed by Baevski et al. (2020). The Wav2vec2 model has been recognized for its effectiveness, showing that learning from speech audio alone can surpass some of the best semi-supervised methods in performance while maintaining conceptual simplicity. Wav2vec2 operates by masking the speech input in the latent space and engaging in a contrastive task based on a quantization of these latent representations, which are learned concurrently. Following this, the audio embeddings are processed through the Multi-Head Self-Attention mechanism. This step is crucial for distilling specific audio features, which are then poised for integration with features from other data modalities, ensuring a comprehensive and nuanced analysis.
To describe the Audio Encoding in more detail, we let the raw audio input data be represented by where represents the audio frame in one data sample. Each audio frame will be converted into a vector representation:
| (1) |
Therefore, we obtain the audio embeddings . The shape of the is 520 512, where 520 is the maximum number of audio files amongst all companies and 512 is the dimension of the resulting transform from the model for a single audio frame. Earnings conference calls with less than 520 audio frames () have been zero-padded for uniformity in input matrix size.
Then, we fed audio embedding into the Multi-Head Self-Attention (MHSA) to extract the audio feature. The MHSA further comprises a multi-head attention block, followed by a norm block, and an MLP block. MLP denotes a two-layer feed-forward network (FNN) with a ReLU activation function. The MHSA block essentially forms the basis of all the architectures discussed later in the paper. In detail, the multi-head self-attention calculation process is as follows:
| (2) |
| (3) |
where (queries) and (keys) of dimension and values of dimension . The dimensions of the weights are: , , , and . The dot product is then calculated for the query with all the keys. These values are then normalized by dividing each value by and then we apply a softmax function to obtain the weights of the values:
| (4) |
The attention function on a set of queries is calculated simultaneously packed together in a matrix Q. The keys and values are also packed in the matrices K and V respectively.
Combining (2)-(4), we apply this process to :
| (5) |
where with size 520 512. Following this, an average pooling layer is applied to :
| (6) |
where denotes the resultant extracted audio feature of size 512.
2.3.2 Transcript Encoding
The overall process is similar to Audio Encoding. We first use SimCSE Gao et al. (2021) to extract the vector representation of each sentence in earnings conference transcripts. SimCSE is a sentence-level representation as word/token-level representations are too difficult and document-level embedding is too sparse and loses a lot of information. SimCSE is a Siamese neural network architecture that learns to embed pairs of sentences into a shared space where similar sentences are mapped close together and dissimilar sentences are mapped far apart. We let raw transcripts as where represents the sentence in the transcript. Therefore, each sentence will be converted into a vector representation:
| (7) |
We obtain the corresponding text embeddings given by . The shape of the is 520 768, where 520 is the maximum number of sentences amongst all data samples and 768 is the dimension of the output of SimCSE. Earnings conference calls with less than 520 sentences () have been zero-padded for uniformity in input matrix size.
Same with (2)-(5), the MHA is applied to to get with dimension 520 768. Then, the average pooling layer is applied to :
| (8) |
where denotes the resultant extracted textual feature of size 768.
2.3.3 Earnings Conference Call Analyzer
An Earnings Conference Call is a teleconference or webcast in which a public company discusses its financial results for a reporting period, typically a quarter or fiscal year. During the call, senior company executives, including the CEO and CFO, present key financial figures, performance metrics, and strategies. They also provide insights into the company’s future outlook, including forecasts and potential challenges. Following the presentation, analysts and investors have the opportunity to ask questions.
In additional of the document structure, Earnings Conference Call within the same sector often exhibits similar discussion topics. For instance, in the energy sector, topics frequently revolve around oil and gas price fluctuations, regulatory changes, and environmental sustainability efforts. Earnings Conference Call in the consumer sector typically centers around consumer behavior trends, e-commerce growth, supply chain management, and product innovation.
To obtain insights from an Earnings Conference Call on how it might influence future market volatility, our approach encompasses two primary steps. (See Figure 2) Initially, we summarize the entire earnings conference call to capture a broad understanding of the company’s performance and future outlook. Following this, the second step involves a meticulous examination of specific points of interest to investors, for example focusing on detailed financial metrics and performance indicators mentioned in the call.

However, when attempting to summarize or retrieve information from earnings conference call transcripts using LLMs, directly inputting the entire document can pose significant challenges. The lengthy nature of these documents, often extending to thousands of words, along with the inclusion of sentences ranging from crucial insights to irrelevant remarks such as greetings, can affect the LLM’s ability to effectively comprehend and analyze the content of the earnings conference call.
Therefore, in the proposed Earnings Conference Call analyzer, it begins by segmenting the call transcripts based on the average length attributed to each topic. By organizing the text in this manner, we create distinct embeddings for paragraphs that revolve around similar ideas or themes. This strategy significantly enhances the model’s efficiency in information processing at later stages.
After dividing the lengthy earnings conference call transcript into several smaller sections, we use LLM to summarize each individual chunk. Since the content within each chunk is more homogeneous and concentrated around a single theme, the LLM can more effectively grasp the core idea. (See Figure 2 Green part) At the same time, to further combine the analyzed content with other extracted features, we use LLM to extract embedding from the analyzed earnings conference call as the analysis feature:
| (9) |
After generating summaries for each segmented chunk of the earnings conference call, we proceed to aggregate these individual summaries and make a second summarization again. The initial summaries distill the essence of each chunk, stripping away extraneous details and focusing on the core information. When these condensed summaries are combined and summarized again, the reduced length facilitates an even more efficient and effective summarization by the LLM. Consequently, this two-tiered approach to summarization not only enhances the manageability of the text for the LLM but also ensures that the final summary is both comprehensive and succinct, capturing the most critical insights in a more accessible format.
In addition to summarization, the earnings conference call analyzer delves deeper into analyzing the transcript. We simulate the analytical process of financial analysts as they examine an earnings conference call. Experts will prioritize certain information, meticulously analyzing key financial metrics and performance indicators to gauge the company’s current state and future prospects.
To simulate this analysis process, we begin by identifying core topics analysts typically focus on in earnings conference call, such as dividends, earnings, and costs. Then we use LLM to locate and extract paragraphs mentioning these topics. However, accurately extracting this information from the dense narrative of earnings conference calls can pose a challenge. Because LLM searches are based on similarity, comparing a single-word topic to an entire document presents a scale issue, and a single word may lack the necessary context, thus diminishing the extraction capability. To enhance the precision of information extraction, we formulate a variety of questions related to each topic but phrased differently, ensuring a broad coverage and increasing the likelihood of accurately pinpointing relevant sections. For instance, regarding the dividends topic, we pose questions such as: (1) "Have there been any changes in the stock dividends, and if so, at what rate have the dividends increased or decreased?" (2) Does the company Board expect to increase the stock dividends in the next future? (3) How does the dividend yield compare to the peers?
After locating the segments where these topics are discussed, we extract the corresponding paragraphs. These paragraphs, however, may still contain irrelevant text such as preceding discussions. To address this, we use a contextual compression method from LLM, adept at distilling the paragraph down to its most relevant sentences, effectively obtaining the crucial data from the noise.
Our subsequent step involves determining how the company’s present position of each topic could influence future stock behavior. To this end, we consult financial experts to provide various potential scenarios within a specific topic and offer their professional insights on how each scenario could impact market responses. For example, regarding the dividend topics, the earnings conference call may discuss about increasing dividends and decreasing dividends in these two scenarios. Increasing dividends may drive positive returns and lower stock volatility. Conversely, a decrease in dividends might be perceived negatively by investors, leading to decreased returns and increased volatility in the stock’s price. Once again, we face the challenge of mapping sentences from earnings conference calls to various potential scenarios. Our approach involves a detailed, sentence-by-sentence comparison. (See Figure 2 Yellow part) We collect various expressions from multiple earnings conference calls, focusing on how speakers convey specific scenarios, like the increase of dividends. In this way, we can precisely determine the current scenario of the company, and then, guided by expert insights, we can gain an understanding of how the stock is likely to move in the coming days.
In summary, our analysis of the earnings conference call includes two parts: summarizing the documents to obtain an overview and extracting precise information for in-depth company analysis. Ultimately, we merge these two components to form an integrated earnings conference call encoder.
2.3.4 Additive Multi-modal Fusion
Given the model’s reliance on several inputs and diverse data types, we identify an effective fusion structure to integrate these features into the training process to ensure a balanced weighting among components. We use additive interactions to handle the representational fusion of different abstract representations. These operators can be viewed as differentiable building blocks that combine information from several different data streams and can be flexibly inserted into almost any unimodal pipeline Liang et al. (2022). Given the audio feature , textual feature from the transcript, and from ECC analyzed text, additive fusion can be seen as learning a new joint representation:
| (10) |
where , and are the weights learned for additive fusion, the bias term and the error term. is a vector with 512 as the final feature from the Earning Conference Call Encoder.
2.4 Time-Series Encoder
In this section, we mainly introduce how we can treat the time series data and how to capture the information from the time series data. Firstly, we collected daily VIX from CBOE. VIX reflects panic in the financial markets and is also an important indicator of market volatility. Furthermore, we downloaded the historical stock prices of each company in the S&P 500 and calculated the return and historical volatility for further analysis. We used two methods as our encoder to extract the information from the time series: Time-series embedding and the traditional econometrics model.
2.4.1 Time-Series Embedding
For our time series input, we capture the VIX values from a 30-day period preceding the ECC release date. To distill meaningful features from this VIX series, we employ a Bidirectional Long Short-Term Memory (BiLSTM) network Siami-Namini et al. (2019):
| (11) |
In this setup, the BiLSTM is configured with 64 hidden states. Consequently, the output , representing the extracted time series features, has a dimensionality of 128, reflecting the bidirectional nature of the BiLSTM.
2.4.2 Extract Relationship Among Multiple Response Variable Using Vector Auto-regression-based Method
The task of RiskLabs is to predict multiple risk metrics in the meantime. Relationships will exist among them. Therefore, by identifying and modeling the relationships between them, we can significantly improve the accuracy of our predictions. This method shifts the focus from treating each metric as an isolated entity to understanding them as part of a complex system, where the dynamics between variables can provide critical insights for more precise risk assessment.
To achieve this, we attempt to find the relationship that links the two different stages: the -day before and the -day after. We will use the VAR(Vector Auto-Regression Model) to capture the linear relationship between the volatility of different terms. We set four different "-day volatility"(3-day volatility, 7-day volatility, 15-day volatility, and 30-day volatility). We define the as the "-day future volatility" at time ; the calculation method traces back from today and calculates the ’s standard deviation of returns.
Volatility typically shows the cluster characteristics, which means that the change transmission pattern to the next stage tends to be similar to the last transmission pattern. These characteristics indicate that we could use the results from the close historical data as indicators or predictors to predict the next stage. We assume that the correlation between the volatility among different time scales will affect each other. We also measure the correlation by estimating the coefficient matrix and the information included in the historical data.
To estimate the coefficient of the model, we use the Bayesian Methodology by estimating the posterior distribution of the coefficient. If we have a general linear regression , here is the coefficient that we need to estimate. We can have the:
| (12) |
Here, (or ) is the prior distribution that we could guess from the existing research or common knowledge. We also suppose that the independent variable is independent with the regression coefficient; is the Likelihood Estimation from the data, and is the marginal distribution. Usually, we could view as a constant because we could have the real value from the true dataset. From the Equation 12, we could have the following relation:
| (13) |
If we can determine the prior and the likelihood function, we can estimate the posterior distribution. We assume that the prior distribution satisfies the Normal distribution based on the simple linear regression. Subsequently, we consider the Likelihood . In the empirical study from Andersen et al. (2001), the unconditional distribution of the realized historical distribution of the volatility is highly right-skewed. Besides, Cizeau et al. (1997) tested the distribution historical volatility of S&P 500 stock from 1984 to 1996 and demonstrated that the pattern follows the log-normal distribution. Therefore, we took the log form of the original data. Given the preparation, we build the VAR model as follows:
Here, stands for the "-day" future volatility at time ; is a White noise term, which ; represents the linear relationship, which is the coefficient matrix of the VAR model, , which is the intercept term of the VAR model.
We apply the Monte Carlo Markov Chain(MCMC) algorithm to obtain the posterior distribution of the coefficient. MCMC is a method that is based on Bayesian Estimation. It is mainly used to predict the posterior distribution in a probability space by sampling. The Markov Chain follows the equation:
This could be explained by the fact that the probability of transforming only depends on the former statement. And based on the convergence theorem of Markov Chain, suppose the Markov Chain converges to one probability at th step: , and , , , we could say that , , are i.i.d random variables.
We attempt to calculate the expectation of the posterior distribution by sampling. However, the posterior distribution is challenging to measure. To achieve this, we introduce the MCMC method to create a Markov Chain to achieve a stationary distribution and make it our desired posterior distribution. For MCMC, Metropolis-Hastings introduced a system to find a Markov Chain. For the model with many parameters to estimate, another alternative way is to use the Gibbs Sampling to update the estimated parameters one by one.
Regarding testing the MCMC process, we use several matrices, such as Monte Carlo standard errors (MCSE). There are two types, which measure the standard error of the mean and the standard error of the standard deviation of the chains. Also, because we did not generate the independent samples, the simulated samples are correlated. We want to know how many theoretically independent samples we drew and create the effective sample size (ESS), which measures the number of effectively independent samples we draw. Besides, we need to test if we achieve the stationary of our chains. Gelman-Rubin R-hat statistic() gave us a measure. We measure by:
Usually, should close to 1 and less than 1.01 otherwise it doesn’t achieve the stationary with the Markov Chain.
| Dependent | Independent | N | Mean | Sd | Hdi_3% | Hdi_97% | mcse_mean | mcse_sd | ess_bulk | ess_tail | r_hat |
|---|---|---|---|---|---|---|---|---|---|---|---|
| 3-Day | Intercept | 250 | -2.571 | 0.364 | -3.275 | -1.908 | 0.004 | 0.003 | 8342.0 | 7461.0 | 1.0 |
| 3-Day | 250 | 0.070 | 0.058 | -0.044 | 0.174 | 0.001 | 0.000 | 9345.0 | 8076.0 | 1.0 | |
| 7-Day | 250 | 0.118 | 0.116 | -0.107 | 0.329 | 0.001 | 0.001 | 8512.0 | 7501.0 | 1.0 | |
| 15-Day | 250 | 0.017 | 0.146 | -0.249 | 0.297 | 0.002 | 0.001 | 7259.0 | 7407.0 | 1.0 | |
| 30-Day | 250 | 0.203 | 0.143 | -0.079 | 0.465 | 0.002 | 0.001 | 7072.0 | 7532.0 | 1.0 | |
| 7-Day | Intercept | 250 | -2.748 | 0.251 | -3.207 | -2.265 | 0.003 | 0.002 | 8684.0 | 7809.0 | 1.0 |
| 3-Day | 250 | 0.042 | 0.040 | -0.033 | 0.118 | 0.000 | 0.000 | 8600.0 | 7890.0 | 1.0 | |
| 7-Day | 250 | 0.181 | 0.079 | 0.033 | 0.330 | 0.001 | 0.001 | 7281.0 | 7845.0 | 1.0 | |
| 15-Day | 250 | -0.078 | 0.100 | -0.270 | 0.104 | 0.001 | 0.001 | 7428.0 | 7426.0 | 1.0 | |
| 30-Day | 250 | 0.142 | 0.098 | -0.035 | 0.333 | 0.001 | 0.001 | 7308.0 | 7386.0 | 1.0 | |
| 15-Day | Intercept | 250 | -3.350 | 0.207 | -3.729 | -2.960 | 0.002 | 0.002 | 9410.0 | 8082.0 | 1.0 |
| 3-Day | 250 | 0.039 | 0.034 | -0.025 | 0.103 | 0.000 | 0.000 | 10471.0 | 8203.0 | 1.0 | |
| 7-Day | 250 | 0.068 | 0.067 | -0.058 | 0.194 | 0.001 | 0.001 | 8018.0 | 7923.0 | 1.0 | |
| 15-Day | 250 | -0.026 | 0.085 | -0.182 | 0.134 | 0.001 | 0.001 | 7053.0 | 7467.0 | 1.0 | |
| 30-Day | 250 | 0.006 | 0.083 | -0.149 | 0.165 | 0.001 | 0.001 | 7373.0 | 8124.0 | 1.0 | |
| 30-Day | Intercept | 250 | -3.604 | 0.164 | -3.904 | -3.280 | 0.002 | 0.001 | 9388.0 | 8508.0 | 1.0 |
| 3-Day | 250 | 0.015 | 0.027 | -0.034 | 0.067 | 0.000 | 0.000 | 9676.0 | 8515.0 | 1.0 | |
| 7-Day | 250 | 0.108 | 0.052 | 0.006 | 0.200 | 0.001 | 0.000 | 7919.0 | 7510.0 | 1.0 | |
| 15-Day | 250 | 0.005 | 0.065 | -0.115 | 0.129 | 0.001 | 0..001 | 7004.0 | 7650.0 | 1.0 | |
| 30-Day | 250 | -0.140 | 0.065 | -0.263 | -0.020 | 0.001 | 0.001 | 7145.0 | 7494.0 | 1.0 |
In order to validate this methodology, we choose one of the stocks "TWTR," in our database as a case study, and then output the Bayesian regression results. Here, we used 250 days of data(from 2016-02-22 to 2017-02-15) as the model training period. Table 1 shows the training result. We observe that the of all parameters is equal to 1, and the value and are all over 7000. Typically, there is no specific argument about the number of ESS. Kruschke (2014) in the book mentioned that we need more ESS samples for the interested parameters. In the meantime, we also need to balance the number of ESS data and model training costs. Vehtari et al. (2021) in the paper recommends having the ESS number over 400, which should be dependent on practical experience and model, to get a stable Monte Carlo standard error.
| Variable | N | Mean | SD | Skewness | Kurtosis | 5% Percentile | 25% Percentile | 50% Percentile | 75% Percentile | 95% Percentile |
|---|---|---|---|---|---|---|---|---|---|---|
| 3-Day | 100 | -0.13167 | 0.08377 | -0.42741 | -0.70133 | -0.26854 | -0.19993 | -0.13011 | -0.07004 | -0.01447 |
| 7-Day | 100 | -0.08501 | 0.05202 | -0.37466 | -0.43682 | -0.17094 | -0.11859 | -0.08499 | -0.04545 | -0.00960 |
| 15-Day | 100 | -0.07950 | 0.05310 | -0.23159 | -1.37432 | -0.16238 | -0.11840 | -0.07607 | -0.03119 | -0.00952 |
| 30-Day | 100 | -0.04195 | 0.03775 | -1.75213 | 3.12077 | -0.11573 | -0.05777 | -0.03011 | -0.01555 | -0.00600 |
We used the rolling window(see Figure 6) to make a rough simulation only based on the historical data of different volatility terms. We chose 250 days(Approximately one year) as the training set window for the next-day prediction and iterated 100 times. The result is shown in Table 2. This table measures the distribution of AEP(Absolute Error Percentage), which is calculated by the following formula:
Here, the is the estimated value from the Bayesian VAR model, and is the true value. From Table 2, we can see that the average estimation bias will become smaller when we estimate the longer volatility term, the same as the standard deviation of AEP. The negative skewness tells us that the peak of the AEP distribution is close to the y-axis(Because the mean is negative, as we calculated). In general, this experiment shows that using the VAR model based on historical data to predict the future term should be possible and could maintain some accuracy.
2.5 News-Market-Reactions Encoder
News plays an important role in influencing stock movements, serving as a powerful indicator of market trends. It contains a wealth of information, ranging from macroeconomic indicators and industry trends to company-specific news such as earnings reports, mergers and acquisitions, regulatory changes, and management shifts.
News carries several key features that commonly impact its reception and influence on its audience. Firstly, news is most impactful when it is fresh. Information that is current and up-to-date is more likely to influence decisions and perceptions than outdated news. Secondly, similar news tends to produce comparable impacts on market reactions. When news items share key characteristics—such as subject matter, sentiment, and relevance to investors—they often trigger similar responses among market participants. For instance, announcements of unexpected earnings surpassing market forecasts typically lead to positive stock price movements. Conversely, news of regulatory setbacks or legal challenges can prompt a downturn in stock values. This patterned response largely stems from investors collectively interpreting news through the lens of their past experiences and established market precedents, leading to the development of conditioned reactions to specific types of news. Consequently, understanding the similarities in news items can offer insights into potential market reactions. However, given the volume of news a company may receive in a day, and considering that each piece of news partially influences the future stock price, it’s essential to assess the entire context. To account for the cumulative effect and interrelations among different news items, we analyze them collectively, treating all news related to a company within a single day as a unified analytical unit.

Initially, we collect news pertaining to a particular company from the three days prior to our target trading day, including the market responses for each day. This compilation allows a Large Language Model (LLM) to examine the data and deduce how the news might influence the stock’s performance in the subsequent days. Subsequently, our strategy involves identifying historical dates on which the news profiles closely resemble those on the day before the intended trading day. This comparative analysis aims to understand the potential market reactions based on similar past events, thereby informing our trading strategies with a nuanced perspective on news impact
Based on these news features, we propose a news-market reactions encoder composed of two main components. (See Algorithm 1) Firstly, we collect news for a specific company from the three days prior to our target trading day, along with the market reactions for each days. We then use an LLM to analyze the data and identify how the news might affect the stock’s performance in the days that follow. Secondly, we attempt to identify the historical date whose news is similar to that of the intended trading date. In this scenario, we face the challenge of assessing similarity once more. Given that we are comparing two groups of news, the likelihood of identical combinations of news reoccurring is extremely small, which may lead to less accurate retrieval results. (See Figure 3)
To address this problem, we designed an enriched news pipeline to obtain attributes associated to the news and then attach this news to news group. Specifically, the enriched news pipeline comprises several key steps to analyze news content effectively.
After processing all news in our database through this pipeline, we assign these identified attributes to each news group as metadata. This metadata becomes instrumental in locating news similar to those of the target trading days. Rather than directly comparing two groups of news, we initially compare the metadata between them. This process helps us identify the top k news groups in the historical record that share similar metadata attributes. Subsequently, we assess the similarity between these top k groups and the news groups from the target trading date. (See Figure 4)

This method significantly streamlines the process of finding similar news groups, enabling us to efficiently draw parallels. With these similarities established, we can make informed predictions about the potential impact of these news groups on the stock market in the days following the target trading date, based on the market reactions to historically similar news.
In this way, it is efficient to identify the two groups that are similar, then we can make an inference for the target trading date about how these results could impact the following stock market based on the historical similar news and its corresponding market reactions.
2.6 Multi-Task Prediction
We start the prediction by aggregating features from various modules to form a comprehensive feature representation. This unified representation is then connected to a two-layer neural network, which is employed to carry out the regression task. This integration is essential for synthesizing the diverse inputs into a cohesive output, leveraging the strengths of each module for effective analysis and prediction.
Building on insights from previous research in multimodal financial risk prediction, which has demonstrated substantial improvements in prediction performance through multitask learning, we adopt a joint modeling approach. Here, we concurrently model volatility prediction and VaR prediction using a multi-task framework. The multi-task prediction module is comprised of two separate single-layer feedforward networks, each responsible for predicting volatility (vol) and Value at Risk (var) values individually. We train RiskLabs by optimizing multitask loss:
| (14) |
2.7 Time Decay Hyper-parameter and Dynamic Moving Time Window Training
In previous sections, we examined the model inputs: (1) earnings conference call transcripts, (2) historical time series data, and (3) news articles. However, the availability frequency of these inputs varies. News and historical time series data are available on a daily basis, whereas earnings conference calls are released on specific dates when a company presents its earnings report.
Consequently, the input from earnings conference calls may be absent on some training days. Ignoring this input entirely would be imprecise, as the information from an earnings conference call can continue to affect stock price movements after its publication. To incorporate the continuous influence of earnings conference call information even on days without new input, we will introduce a hyper-parameter to measure the decaying speed of its relevance. We will apply the Exponential Decay function:
In the equation, is the hyper-parameter that measures the decay rate. is the time to the last earnings conference call release date. When the is fixed, the impact of the earnings conference call will still decrease as gets larger, which satisfies our common sense. Figure 5 shows the daily data inputs, for days lacking a new earnings conference call, we still incorporate the information from the most recent call, adjusted by to reflect its diminishing impact speed over time.

Another consideration related to timing is the impact of input data on the market across time. RiskLabs takes time series data and news as inputs. The relevance of these inputs to the response variables is strongly dependent on the timing of the data. If we solely train a model without further updates and then use it to make predictions for dates far away the training period, the model’s predictive performance may decline. This decrease in accuracy arises because the model becomes less relevant of later dates.
Hence, updating the model at a high frequency can continuously adjust the model’s parameters to maintain its sensitivity to the latest market trends and fluctuations. To achieve this, we use a dynamic moving time window method for training. Specifically, we use a fixed window of historical data up to the target trading day to train our model, which is then used only to predict the response variable for that particular day. Once the day has passed, we shift the window to include the newly added day and proceed to train a new model for the next target trading day(See Figure 6). This iterative process ensures our model remains adaptive and up-to-date with the latest market data.

3 Experiment and Results
In this section, we aim to thoroughly evaluate the effectiveness of RiskLabs by conducting extensive experiments. Our approach begins with outlining the comparative methodology we have selected, along with the specifics of our implementation details. This is followed by a detailed comparison of RiskLabs’ performance against other existing methods, providing a clear understanding of its relative efficacy. Then, to gain deeper insights into the contribution of each component within RiskLabs, we conduct a series of ablation studies. These experiments are designed to dissect and analyze the function and impact of each module individually, offering a granular view of how each part contributes to the overall performance of the framework.
3.1 Experiment Setup
3.1.1 Baselines
We compare our approach to volatility prediction to several important baselines as described below.
-
•
Classical Methods: The analysis incorporates the GARCH model, a classical auto-regressive model for predicting volatility, as well as its various derivatives Franses and Van Dijk (1996); Kim and Won (2018). These models are widely recognized and commonly employed in the realm of volatility prediction. Primarily, they are tailored for short-term volatility forecasting and may not perform as efficiently in predicting average volatility over an extended period (e.g., n-day volatility).
-
•
LSTM Gers et al. (2000): Long Short-Term Memory Networks (LSTMs) are a popular choice for financial time series prediction due to their efficacy in handling sequential data. In the context of volatility prediction, we select a straightforward LSTM model as a benchmark.
-
•
MT-LSTM+ATT Luong et al. (2015): merges the prediction of average n-day volatility with the forecasting of single-day volatility, using attention-enhanced LSTM as the foundational learning models.
-
•
HAN (Glove): This baseline implements a Hierarchical Attention Network that incorporates dual-layered attention mechanisms at both the word and sentence levels. Initially, every word within a sentence is transformed into a word embedding through the pre-trained Glove 300-dimensional embeddings. Subsequently, these embedded sentences are processed by a Bi-GRU encoder Chung et al. (2014), and in parallel, another Bi-GRU encoder is utilized to formulate a representation of each document as a series of sentences. This representation of the document is then fed into the concluding regression layer to generate predictions.
-
•
MRDM Qin and Yang (2019): The MRDM model first introduced a multi-modal deep regression approach for volatility prediction tasks. It utilizes pre-trained GloVe embeddings and bespoke acoustic features, which are processed through individual BiLSTMs to generate uni-modal contextual embeddings. These embeddings are subsequently merged and input into a two-layer dense network for further processing.
-
•
HTML Yang et al. (2020): This work presented a state-of-the-art model that employs WWM-BERT for text token encoding. Similar to MDRM, HTML also leverages the same audio features. These unimodal features are then combined and processed through a sentence-level transformer, resulting in multimodal representations for each call.
-
•
GPT-3.5-Turbo: We evaluated the efficacy of using GPT-3.5-Turbo for direct financial risk prediction. The input for this test was earnings conference calls, and we instructed GPT-3.5-Turbo to generate numerical risk forecasts based on the provided EC, utilizing a specified prompt setting. In the experiment, we set the temperature as zero.
3.1.2 Implementation Detail
We use GPT-4 for the Earnings Conference Call Analyzer and the News-Market Reactions Encoder, utilizing it to analyze ECC data and build the news database. Throughout this process, we set the temperature parameter to 0. This ensures that the Large Language Models (LLMs) produce the most predictable responses, which aids in maintaining consistency in our experiments.
For dataset usage, we strategically partitioned it into a training set and a test set, adhering to an 8:2 ratio. It is crucial to highlight that the division of the data was conducted on a temporal basis, ensuring that the dates of the data in the training set always precede those in the test set. This temporal segregation is imperative for maintaining the integrity of our predictive model. By structuring the dataset in this manner, we ensure that the training process is consistently oriented towards predicting future risks based on past data, a fundamental principle for the accuracy and reliability of our forecasting methodology.
For the overall training of the framework, we developed the code using PyTorch. Each Multi-Head Attention layer in the network comprises 8 individual heads, and the training process utilized batch sizes . We use a grid search to determine the optimal parameters and select the learning rate for Adam optimizer among . The best hyper-parameters were kept consistent across all experiments, with the exception of the trade-off parameter which varied between the two tasks.
3.2 Performance Comparison (RQ1 & RQ2 & RQ3)
| Model | Multi-Task | ||||||
|---|---|---|---|---|---|---|---|
| Classical Method | 0.713 | 1.710 | 0.526 | 0.330 | 0.284 | / | |
| LSTM | 0.746 | 1.970 | 0.459 | 0.320 | 0.235 | / | |
| MT-LSTM-ATT | 0.739 | 1.983 | 0.435 | 0.304 | 0.233 | / | |
| HAN | 0.598 | 1.426 | 0.461 | 0.308 | 0.198 | / | |
| MRDM | 0.577 | 1.371 | 0.420 | 0.300 | 0.217 | / | |
| HTML | 0.401 | 0.845 | 0.349 | 0.251 | 0.158 | / | |
| GPT-3.5-Turbo | 2.198 | 2.152 | 1.793 | 2.514 | 2.332 | 0.371 | |
| RiskLabs | 0.324 | 0.585 | 0.317 | 0.233 | 0.171 | 0.049 |
The performance of different models in predicting financial risks is detailed in Table 3. This comparison includes baseline models, our proposed RiskLabs framework, and a range of periods (3, 7, 15, and 30 days). Besides forecasting accuracy, we also consider factors like the predicted Value at Risk (VaR) and the multi-tasking capabilities of each model. Notably, the RiskLabs framework outperforms others in prediction accuracy, particularly in short-term and medium-term forecasts, evidenced by the lowest Mean Squared Error (MSE) values. This improvement becomes more pronounced when the RiskLabs framework integrates various data sources such as earnings conference calls, time series, and news feeds, outshining the current state-of-the-art HTML solutions. Moreover, the RiskLabs framework demonstrates superior performance in VaR prediction, underscoring the effectiveness of our proposed methodology in offering a more nuanced and comprehensive approach to financial risk prediction. This could be invaluable for investors seeking to make more informed decisions. Nevertheless, the framework’s performance in 30-day forecasts lags behind the HTML models, indicating potential areas for further enhancement in long-term risk forecasting with LLM-based solutions.
In addition to comparing the effectiveness of various AI techniques in risk prediction, our study also evaluates the differences in Value at Risk (VaR) predictions made by Large Language Models (LLMs), traditional financial methodologies, and neural network frameworks. This comparison sheds light on each approach’s strengths and weaknesses in risk quantification, offering a clearer understanding of how modern LLMs are different from financial and neural network models. Table 4 displays the performance of value at risk prediction between the traditional finance model and the AI techniques.
| Method | Prediction of VaR |
|---|---|
| Historical Method | 0.016 |
| Fully Connected Neural Network | 0.044 |
| LSTM | 0.056 |
| RiskLabs | 0.049 |
The predefined VaR value is 0.05, meaning that the closer the model’s predictions are to 0.05, the better its performance. The result above shows that the prediction of VaR via applying the historical method is 0.016, which is significantly below the pre-defined percentile(5%). It indicates that the historical method overestimated the 95% VaR benchmark. Tracing back to 2016, we know there was a global financial crisis in 2015, and its effect lasted till the beginning of 2016. On January 20, 2016, the price of crude oil fell below $27 a barrel; the DJIA index took a roller coaster from down 565 points to down 249 intraday. In February, the YTD (yield to Date) return came to -10.5%. These events, together with the sequelae of the 2015 stock market crisis, define 2016 as a risky year. Comparing 2016, 2017 will be much better. In January 2017, DJIA achieved a new historical height, landing above 20,000. The stock market experienced a boost with a 25% growth rate for DJIA, 19% for S&P 500, and 28% for Nasdaq. The market had strong confidence, and the VIX index in 2017 came to its historical lowest point. That explains the reason why the historical method may overestimate the 95% VaR benchmark, due to this method duplicating the extreme scenarios from 2016 to 2017, which leads to the extra estimation of financial risks.
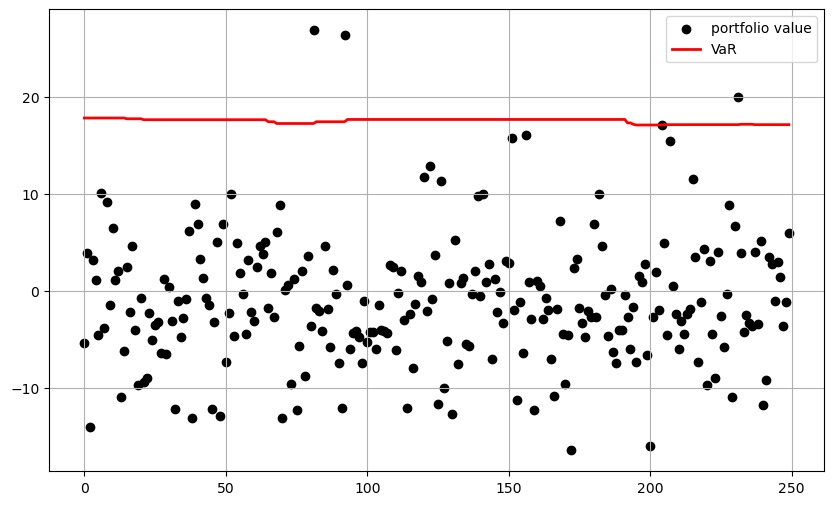

From the analysis presented in the figure, a notable observation emerges: the plot on the left, which uses the historical method for VaR prediction, appears relatively flat, indicating a consistent, albeit less responsive, forecast over time. In contrast, the plot on the right, using a fully connected neural network, exhibits a more zigzag pattern, reflecting greater responsiveness to daily information changes. This contrast suggests that AI techniques, such as neural networks or LLMs, offer a dynamic advantage by more effectively incorporating daily updates into the model, as opposed to relying solely on historical scenarios. The ability of AI-driven models to adapt to new information underscores their potential for providing more accurate and timely risk assessments.
Turning our focus to Table 3, we observe that the direct application of LLMs for financial risk prediction is markedly ineffective, akin to making random guesses. This underscores a crucial caution; if LLMs are not utilized appropriately, they might elevate investment risks. Consequently, in response to Research Questions 1 and 2 (RQ1 and RQ2), we conclude:
-
•
Utilizing LLMs through simple prompt instructions for direct financial risk prediction is ineffectual and potentially hazardous, increasing investment risks.
-
•
LLM is a bad trader/predictor, but it’s a helpful assistant. While LLMs alone may not be reliable for direct risk prediction, they can serve as valuable tools in collating and analyzing diverse financial data. This processed information, when fed into sophisticated deep learning models, significantly enhances AI’s capability in forecasting financial risks, thus positioning LLMs as beneficial assistants rather than standalone predictors.
3.3 Comparison Across Modules (RQ4)
In addition to overall performance, we also wanted to understand the different relative contributions of each module in the RiskLabs design decision to predictive performance. Here, we evaluate the impact of different data combinations on predictive performance to better understand the relative contributions of data sources and each sub-module. We designed the ablation study as follows:
-
•
Audio + Text: We design a comparison experiment starting with only using earnings conference calls. These calls are crucial in financial analysis as they are where executives of publicly traded companies discuss the company’s financial results for a specific period. They offer valuable insights into the company’s performance, strategic initiatives, and future projections. Investors highly regard these calls for the direct access they provide to the company’s leadership, offering in-depth financial data, operational updates, and forward-looking statements essential for informed investment decisions. In our approach, we initially concentrate on processing both the audio and textual content from these earnings conference calls using Multi-Head Self-Attention to extract salient features. Subsequently, we integrate these extracted features to directly predict financial outcomes.
-
•
Audio + Text + Analysis: Then, we integrate the earnings conference calls analysis results into the prediction process. This is also the complete earnings conference call encoder in RiskLabs. This experiment will help us to verify whether the earnings conference calls analysis results are useful in helping to improve the model prediction performance.
-
•
Audio + Text + Analysis + VIX: Next, we incorporate time series information into the model as well. We will determine whether the introduction of time series information helps the model to make predictions by observing changes in predictive performance.
| Module | ||||||
|---|---|---|---|---|---|---|
| Audio + Text | 0.373 | 0.645 | 0.362 | 0.280 | 0.204 | 0.131 |
| Audio + Text + Analysis | 0.357 | 0.627 | 0.335 | 0.267 | 0.199 | 0.057 |
| Audio + Text + Analysis + VIX | 0.324 | 0.585 | 0.317 | 0.233 | 0.171 | 0.049 |
Table 5 reveals that the ‘Audio + Text’ combination yields superior results compared to the baseline HTML model for 3-day forecasts. For longer periods, specifically 7, 15, and 30 days, RiskLabs demonstrates predictions closely aligned with HTML, while still outperforming other baseline models. It’s worth noting that with just ‘Audio + Text’, our model is more concise than HTML. This efficiency stems from our use of an advanced pre-trained model with extensive parameters, enabling the mapping of text and audio to vector representations. These vectors are then processed through a multi-head self-attention mechanism for feature extraction, underscoring the effectiveness of utilizing large-scale models in enhancing AI’s capability in risk prediction.
Further enhancement of the model was observed upon the integration of earnings conference call analysis text and time-series data, leading to incremental improvements in RiskLab’s performance. This improvement was particularly pronounced in medium to long-term forecasts (7, 15, and 30 days). This finding suggests that earnings conference calls, as critical investment references, exert more influence on short-term risk volatility. For long-term forecasts, the incorporation of diverse information sources appears to be instrumental in refining prediction accuracy. Cumulatively, these experimental results attest to the valuable contribution of each component within the RiskLabs framework, culminating in a robust predictive model.
3.4 Challenge and Solutions (RQ5)
Our experimental findings demonstrate that leveraging large language models to integrate diverse information sources can significantly enhance the capability of our framework in predicting financial risks. With this in mind, we’ve expanded our data sources to include variables that could influence market volatility, such as news disseminated through social media. As detailed in Section 2.4, we utilize LLM to collect and analyze daily financial news. Initial small-scale experiments indicate that this addition can further improve the model’s performance. However, scaling up has introduced challenges: 1) the variable quality of news sources, with some containing misinformation, potentially introduces noise into our news database and affects audio model predictions; 2) there is a need to test the module’s effectiveness across a broader data spectrum.
To address these challenges, we are implementing more nuanced steps to filter out low-quality news. Additionally, we are amassing newer data samples to enlarge our dataset, allowing for more comprehensive validation of our model’s efficacy. Furthermore, we will apply a "Dynamic Moving Time Window" and a "Time Decay Hyper-parameter" in RiskLabs (see in Section 2.4). These features will enable more flexible training and forecasting on a daily basis, thus offering investors timelier and more accurate risk assessments.
4 Conclusion
In this study, we explored the utilization of LLMs in predicting financial risks and introduced the RiskLabs framework. This innovative framework employs LLMs to systematically organize and analyze diverse financial data types and sources, augmenting deep learning models in financial risk prediction. Central to RiskLabs are specialized modules: the Earnings Conference Call Encoder, the Time-Series Encoder, and the News-Market Reactions Encoder, each designed to process specific financial data. These encoders collectively facilitate the merging of various data features for robust multi-task financial risk forecasting.
Our extensive evaluation of RiskLabs focused on its short-, medium-, and long-term predictive capabilities, specifically in forecasting market volatility and VaR metrics. The empirical findings from our study led to several key insights: 1) The RiskLabs framework demonstrates a high efficacy in predicting financial risks, confirming its potential as a valuable tool in this domain. 2) While LLMs in isolation may not yield effective financial risk predictions, their strategic application in processing relevant financial data significantly enhances the predictive power of deep learning models. 3) Ablation studies further affirm that each individual module of RiskLabs meaningfully contributes to the accuracy of the final risk predictions. Overall, our research underscores the transformative potential of LLMs in financial risk assessment, marking a significant step forward in the application of AI in finance.
We are currently enhancing the News-Market Reactions Encoder module within RiskLabs, aiming to refine its ability to utilize high-quality news information effectively. This enhancement is pivotal for augmenting the model’s performance in predicting financial risks. Concurrently, we are engaged in the acquisition of more recent and expansive datasets to facilitate a larger-scale validation of our model. A key aspect of our ongoing development is the implementation of dynamic training windows in RiskLabs. This feature is designed to increase the model’s adaptability, enabling it to deliver more prompt and precise risk-forecasting information to investors. These advancements are part of our continuous effort to advance RiskLabs, ensuring it remains at the forefront of financial risk prediction technology.
References
- Abdaljalil and Bouamor (2021) Abdaljalil, S. and H. Bouamor (2021). An exploration of automatic text summarization of financial reports. In Proceedings of the Third Workshop on Financial Technology and Natural Language Processing, pp. 1–7.
- Achiam et al. (2023) Achiam, J., S. Adler, S. Agarwal, L. Ahmad, I. Akkaya, F. L. Aleman, D. Almeida, J. Altenschmidt, S. Altman, S. Anadkat, et al. (2023). Gpt-4 technical report. arXiv preprint arXiv:2303.08774.
- Ahbali et al. (2022) Ahbali, N., X. Liu, A. Nanda, J. Stark, A. Talukder, and R. P. Khandpur (2022). Identifying corporate credit risk sentiments from financial news. In Proceedings of the 2022 Conference of the North American Chapter of the Association for Computational Linguistics: Human Language Technologies: Industry Track, pp. 362–370.
- Andersen et al. (2001) Andersen, T. G., T. Bollerslev, F. X. Diebold, and H. Ebens (2001). The distribution of realized stock return volatility. Journal of financial economics 61(1), 43–76.
- Ashta and Herrmann (2021) Ashta, A. and H. Herrmann (2021). Artificial intelligence and fintech: An overview of opportunities and risks for banking, investments, and microfinance. Strategic Change 30(3), 211–222.
- Aue et al. (2022) Aue, T., A. Jatowt, and M. Färber (2022). Predicting companies’ esg ratings from news articles using multivariate timeseries analysis. arXiv preprint arXiv:2212.11765.
- Baevski et al. (2020) Baevski, A., Y. Zhou, A. Mohamed, and M. Auli (2020). wav2vec 2.0: A framework for self-supervised learning of speech representations. Advances in neural information processing systems 33, 12449–12460.
- Becker (2023) Becker, P. (2023). Sustainability science: Managing risk and resilience for sustainable development. Elsevier.
- Belhaj and Hachaıchi (2021) Belhaj, M. and Y. Hachaıchi (2021). Artificial intelligence, machine learning and big data in finance opportunities, challenges, and implications for policy makers.
- Breiman (2001) Breiman, L. (2001). Random forests. Machine learning 45, 5–32.
- Chung et al. (2014) Chung, J., C. Gulcehre, K. Cho, and Y. Bengio (2014). Empirical evaluation of gated recurrent neural networks on sequence modeling. arXiv preprint arXiv:1412.3555.
- Cizeau et al. (1997) Cizeau, P., Y. Liu, M. Meyer, C.-K. Peng, and H. E. Stanley (1997). Volatility distribution in the s&p500 stock index. Physica A: Statistical Mechanics and its Applications 245(3-4), 441–445.
- Cortes and Vapnik (1995) Cortes, C. and V. Vapnik (1995). Support-vector networks. Machine learning 20, 273–297.
- Franses and Van Dijk (1996) Franses, P. H. and D. Van Dijk (1996). Forecasting stock market volatility using (non-linear) garch models. Journal of forecasting 15(3), 229–235.
- Gao et al. (2021) Gao, T., X. Yao, and D. Chen (2021). Simcse: Simple contrastive learning of sentence embeddings. arXiv preprint arXiv:2104.08821.
- Gers et al. (2000) Gers, F. A., J. Schmidhuber, and F. Cummins (2000). Learning to forget: Continual prediction with lstm. Neural computation 12(10), 2451–2471.
- Gu et al. (2020) Gu, S., B. Kelly, and D. Xiu (2020). Empirical asset pricing via machine learning. The Review of Financial Studies 33(5), 2223–2273.
- Khaidem et al. (2016) Khaidem, L., S. Saha, and S. R. Dey (2016). Predicting the direction of stock market prices using random forest. arXiv preprint arXiv:1605.00003.
- Kim and Won (2018) Kim, H. Y. and C. H. Won (2018). Forecasting the volatility of stock price index: A hybrid model integrating lstm with multiple garch-type models. Expert Systems with Applications 103, 25–37.
- Kogan et al. (2009) Kogan, S., D. Levin, B. R. Routledge, J. S. Sagi, and N. A. Smith (2009). Predicting risk from financial reports with regression. In Proceedings of human language technologies: the 2009 annual conference of the North American Chapter of the Association for Computational Linguistics, pp. 272–280.
- Kruschke (2014) Kruschke, J. (2014). Doing bayesian data analysis: A tutorial with r, jags, and stan.
- Lakhani (2023) Lakhani, A. (2023). Enhancing customer service with chatgpt transforming the way businesses interact with customers.
- Lee (2007) Lee, Y.-C. (2007). Application of support vector machines to corporate credit rating prediction. Expert Systems with Applications 33(1), 67–74.
- Lewis et al. (2020) Lewis, P., E. Perez, A. Piktus, F. Petroni, V. Karpukhin, N. Goyal, H. Küttler, M. Lewis, W.-t. Yih, T. Rocktäschel, et al. (2020). Retrieval-augmented generation for knowledge-intensive nlp tasks. Advances in Neural Information Processing Systems 33, 9459–9474.
- Li et al. (2023) Li, Y., S. Wang, H. Ding, and H. Chen (2023). Large language models in finance: A survey. In Proceedings of the Fourth ACM International Conference on AI in Finance, pp. 374–382.
- Li et al. (2020) Li, Z., E. Wallace, S. Shen, K. Lin, K. Keutzer, D. Klein, and J. Gonzalez (2020). Train big, then compress: Rethinking model size for efficient training and inference of transformers. In International Conference on machine learning, pp. 5958–5968. PMLR.
- Liang et al. (2022) Liang, P. P., A. Zadeh, and L.-P. Morency (2022). Foundations and trends in multimodal machine learning: Principles, challenges, and open questions. arXiv preprint arXiv:2209.03430.
- Liapis et al. (2023) Liapis, C. M., A. Karanikola, and S. Kotsiantis (2023). Investigating deep stock market forecasting with sentiment analysis. Entropy 25(2), 219.
- Luong et al. (2015) Luong, M.-T., Q. V. Le, I. Sutskever, O. Vinyals, and L. Kaiser (2015). Multi-task sequence to sequence learning. arXiv preprint arXiv:1511.06114.
- Mitchell (2013) Mitchell, A. (2013). Risk and resilience: From good idea to good practice.
- Mohan et al. (2019) Mohan, S., S. Mullapudi, S. Sammeta, P. Vijayvergia, and D. C. Anastasiu (2019). Stock price prediction using news sentiment analysis. In 2019 IEEE fifth international conference on big data computing service and applications (BigDataService), pp. 205–208. IEEE.
- Qin and Yang (2019) Qin, Y. and Y. Yang (2019). What you say and how you say it matters: Predicting stock volatility using verbal and vocal cues. In Proceedings of the 57th Annual Meeting of the Association for Computational Linguistics, pp. 390–401.
- Rawte et al. (2023) Rawte, V., A. Sheth, and A. Das (2023). A survey of hallucination in large foundation models. arXiv preprint arXiv:2309.05922.
- Sawhney et al. (2020) Sawhney, R., P. Mathur, A. Mangal, P. Khanna, R. R. Shah, and R. Zimmermann (2020). Multimodal multi-task financial risk forecasting. In Proceedings of the 28th ACM international conference on multimedia, pp. 456–465.
- Shuster et al. (2021) Shuster, K., S. Poff, M. Chen, D. Kiela, and J. Weston (2021). Retrieval augmentation reduces hallucination in conversation. arXiv preprint arXiv:2104.07567.
- Siami-Namini et al. (2019) Siami-Namini, S., N. Tavakoli, and A. S. Namin (2019). The performance of lstm and bilstm in forecasting time series. In 2019 IEEE International conference on big data (Big Data), pp. 3285–3292. IEEE.
- Singh et al. (2016) Singh, A., N. Thakur, and A. Sharma (2016). A review of supervised machine learning algorithms. In 2016 3rd international conference on computing for sustainable global development (INDIACom), pp. 1310–1315. Ieee.
- Soni (2023) Soni, V. (2023). Large language models for enhancing customer lifecycle management. Journal of Empirical Social Science Studies 7(1), 67–89.
- Souma et al. (2019) Souma, W., I. Vodenska, and H. Aoyama (2019). Enhanced news sentiment analysis using deep learning methods. Journal of Computational Social Science 2(1), 33–46.
- Subagja et al. (2023) Subagja, A. D., A. M. A. Ausat, A. R. Sari, M. I. Wanof, and S. Suherlan (2023). Improving customer service quality in msmes through the use of chatgpt. Jurnal Minfo Polgan 12(1), 380–386.
- Van Der Vegt et al. (2015) Van Der Vegt, G. S., P. Essens, M. Wahlström, and G. George (2015). Managing risk and resilience.
- Vehtari et al. (2021) Vehtari, A., A. Gelman, D. Simpson, B. Carpenter, and P.-C. Brkner (2021). Rank-normalization, folding, and localization: An improved r for assessing convergence of mcmc (with discussion). Bayesian analysis 16(2), 667–718.
- Wang et al. (2023) Wang, D., Z. Chen, I. Florescu, and B. Wen (2023). A sparsity algorithm for finding optimal counterfactual explanations: Application to corporate credit rating. Research in International Business and Finance 64, 101869.
- Wei et al. (2022) Wei, J., X. Wang, D. Schuurmans, M. Bosma, F. Xia, E. Chi, Q. V. Le, D. Zhou, et al. (2022). Chain-of-thought prompting elicits reasoning in large language models. Advances in neural information processing systems 35, 24824–24837.
- Wu et al. (2006) Wu, M.-C., S.-Y. Lin, and C.-H. Lin (2006). An effective application of decision tree to stock trading. Expert Systems with applications 31(2), 270–274.
- Yang et al. (2023) Yang, H., X.-Y. Liu, and C. D. Wang (2023). Fingpt: Open-source financial large language models. arXiv preprint arXiv:2306.06031.
- Yang et al. (2020) Yang, L., T. L. J. Ng, B. Smyth, and R. Dong (2020). Html: Hierarchical transformer-based multi-task learning for volatility prediction. In Proceedings of The Web Conference 2020, pp. 441–451.
- Yu et al. (2023) Yu, Y., H. Li, Z. Chen, Y. Jiang, Y. Li, D. Zhang, R. Liu, J. W. Suchow, and K. Khashanah (2023). Finmem: A performance-enhanced llm trading agent with layered memory and character design. arXiv preprint arXiv:2311.13743.
- Zhang et al. (2023) Zhang, B., H. Yang, T. Zhou, M. Ali Babar, and X.-Y. Liu (2023). Enhancing financial sentiment analysis via retrieval augmented large language models. In Proceedings of the Fourth ACM International Conference on AI in Finance, pp. 349–356.
- Zhang et al. (2024) Zhang, T., F. Ladhak, E. Durmus, P. Liang, K. McKeown, and T. B. Hashimoto (2024). Benchmarking large language models for news summarization. Transactions of the Association for Computational Linguistics 12, 39–57.
- Zmandar et al. (2021) Zmandar, N., A. Singh, M. El-Haj, and P. Rayson (2021). Joint abstractive and extractive method for long financial document summarization. In Proceedings of the 3rd Financial Narrative Processing Workshop, pp. 99–105.