Rigorous Derivation of Stochastic Conceptual Models for the El Niño-Southern Oscillation from a Spatially-Extended Dynamical System
Abstract
El Niño-Southern Oscillation (ENSO) is the most predominant interannual variability in the tropics, significantly impacting global weather and climate. In this paper, a framework of low-order conceptual models for the ENSO is systematically derived from a spatially-extended stochastic dynamical system with full mathematical rigor. The spatially-extended stochastic dynamical system has a linear, deterministic, and stable dynamical core. It also exploits a simple stochastic process with multiplicative noise to parameterize the intraseasonal wind burst activities. A principal component analysis based on the eigenvalue decomposition method is applied to provide a low-order conceptual model that succeeds in characterizing the large-scale dynamical and non-Gaussian statistical features of the eastern Pacific El Niño events. Despite the low dimensionality, the conceptual modeling framework contains outputs for all the atmosphere, ocean, and sea surface temperature components with detailed spatiotemporal patterns. This contrasts with many existing conceptual models focusing only on a small set of specified state variables. The stochastic versions of many state-of-the-art low-order models, such as the recharge-discharge and the delayed oscillators, become special cases within this framework. The rigorous derivation of such low-order models provides a unique way to connect models with different spatiotemporal complexities. The framework also facilitates understanding the instantaneous and memory effects of stochastic noise in contributing to the large-scale dynamics of the ENSO.
keywords:
Stochastic conceptual model, Eigenvalue decomposition, Spatially-extended stochastic dynamical systems, Large-scale ENSO features, Multiplicative noise, Stochastic discharge-recharge oscillator, Stochastic delayed oscillatorMSC:
[2010] 35R60, 37N10, 60H10 , 65F151 Introduction
El Niño-Southern Oscillation (ENSO) is the most predominant interannual variability in the tropics with significant impacts on the global weather and climate [1, 2, 3, 4]. El Niño and La Niña are opposing patterns, representing the warm and cool phases of a recurring climate pattern across the tropical Pacific. They form an irregular oscillator, shifting back and forth every three to seven years, leading to predictable shifts in sea surface temperature (SST) and disrupting the wind and rainfall patterns across the tropics.
A hierarchy of dynamical and statistical models with different spatiotemporal complexity has been developed to understand the ENSO dynamics across a wide range of spatiotemporal scales. The simplest models are the conceptual or box models [5, 6, 7, 8, 9, 10], which involve a few (stochastic) ordinary differential equations. Some variables in these models are directly related to the commonly used low-dimensional ENSO indicators, such as the Niño 3 index. The models at the next level of complexity are called simple dynamical models [11, 12, 13, 14], which consist of a set of partial differential equations to characterize the large-scale dynamics of ENSO. By including more detailed dynamics and coupled relationships with atmosphere and other state variables, the resulting models are named the intermediate complex models (ICMs) [15, 16, 17, 18, 19]. The ICMs are widely used for studying the mechanisms and the forecast of the ENSO. The ENSO dynamics have also been incorporated into the general circulation models (GCMs) [20, 21, 22, 23] to understand its global and regional impacts.
Among these categories of ENSO models, the low-order conceptual models are of particular interest for the following reasons. First, these models are mathematically tractable due to low dimensionality and simple structures. Rigorous analysis of model properties, such as the bifurcations and the stability, can be easily carried out for these models that help understand the mechanisms of the large-scale ENSO features. Second, these models are often utilized to test various hypotheses of physical and causal dependence between different variables. The results can provide valuable guidelines for developing more sophisticated models with refined dynamical structures [7, 24]. These conceptual models have also been used as testbeds for guiding simple dynamical models or ICMs to include additional stochastic noise or stochastic parameterizations [9, 19]. Third, because of the low computational cost, these conceptual models can also be used to predict the ENSO indices [25, 26] and study the predictability from a statistical point of view [27] in light of ensemble forecast methods. Several low-order conceptual models have been independently developed, including the recharge-discharge oscillator [7, 28], the delayed oscillator [29, 16, 30], the western-Pacific oscillator [31], and the advective–reflective oscillator [32]. Later, a unified ENSO oscillator motivated by the dynamics and thermodynamics of Zebiak and Cane’s coupled ocean–atmosphere model has also been built [33]. These models were mainly proposed based on physical intuitions and highlighted one or two specific dynamical features of the ENSO as the building blocks. They have led to many successes in applications.
In this paper, a framework of low-order conceptual models for the ENSO is systematically derived from a spatially-extended stochastic dynamical system with full mathematical rigor. The spatially-extended stochastic dynamical system has a linear, deterministic, and stable dynamical core, describing the interactions between atmosphere, ocean and SST at the interannual time scale. It also exploits a simple stochastic process with state dependent (i.e., multiplicative) noise to parameterize the intraseasonal wind burst activities, including the effect from the Madden-Julian oscillation (MJO), that trigger or terminate the El Niño events. The model captures many observed dynamical features of the ENSO, such as the varying amplitudes and durations of different El Niños as well as the extreme events. It also reproduces the observed power spectrum and non-Gaussian statistics of the SST in the eastern Pacific, the region of the active ENSO events, thanks to the multiplicative noise. Since the dynamical core is linear, a principal component analysis based on the eigenvalue decomposition method is applied to provide a low-order representation of the large-scale dynamics of the ENSO. By further projecting the stochastic wind bursts to the leading order basis functions, the low-order representation succeeds in reproducing the observed large-scale dynamical and statistical features of the ENSO. In light of such a strategy of reducing the model complexity, a low-order conceptual modeling framework is thus rigorously derived. The stochastic versions of many state-of-the-art low-order oscillators, such as the recharge-discharge and the delayed oscillators, become special cases within this framework.
The development of the low-order conceptual modeling framework here is very different from the unified ENSO oscillator [33] and many other models. First, the unified oscillator exploits Zebiak and Cane’s model, which utilizes nonlinearity to trigger the ENSO cycles, as a starting reference model to provide guidelines for developing the conceptual model. In contrast, the conceptual model developed here starts from a linear spatially-extended dynamical system, which uses multiplicative noise to induce the ENSO events. Second, instead of providing only a heuristic building block, the linear dynamical core allows rigorous mathematical derivations from the spatially-extended dynamical system to the low-order conceptual model. This procedure facilitates rigorous analysis and direct intercomparison between the two systems. Third, the low-order conceptual modeling framework here provides outputs for all the atmosphere, ocean, and SST components with detailed spatiotemporal patterns. This contrasts with many existing conceptual models, which focus only on a small set of specified state variables and often involve the averaged quantities over a large domain as a coarse-graining representation. Despite the intrinsic low dimensionality of the model, the state variables for atmosphere, ocean, and SST in this conceptual modeling framework are connected via the eigenvectors. Therefore, depending on the quantity of interest, the model can explicitly characterize the relationships between different atmosphere-ocean-SST components contributing to the ENSO dynamics.
The rest of the paper is organized as follows. Section 2 describes the observational data. Section 3 presents the simple spatially-extended stochastic dynamical model and its properties. Section 4 utilizes the eigenvalue decomposition to illustrate the reduced order representation of the ENSO dynamics. Section 5 shows the mathematical expressions of the conceptual models, including the recharge-discharge and the delayed oscillators. The paper is concluded in Section 6.
2 Observational Data
The following observational data are utilized in this study. Daily sea surface temperature (SST) data comes from the OISST reanalysis [34] (https://www.ncdc.noaa.gov/oisst). Monthly thermocline depth is from the NCEP GODAS reanalysis [35] (http://www.esrl.noaa.gov/psd/). Note that thermocline depth is computed from potential temperature as the depth of the C isotherm. Daily zonal winds at 850 hPa are from the NCEP–NCAR reanalysis [36] (http://www.esrl.noaa.gov/psd/). All datasets are averaged meridionally within S-N in the tropical Pacific (E–W). Only the anomalies are presented in this study, calculated by removing the monthly mean climatology of the whole period. The eastern and western Pacific regions are defined as E-W and W-W, respectively. The Niño 3 SST index is the average of SST anomalies over the region of W-W. Denote by the time series of SST averaged over the eastern Pacific. The time series and Niño 3 SST index are almost the same as each other.
3 The Simple Spatially-Extended Stochastic Model
3.1 Review of the model
The simple spatially-extended stochastic model was originally developed in [13]. The starting system is a coupled atmosphere-ocean-SST model, which is given by
Atmosphere:
| (1) |
Ocean:
| (2) |
SST:
| (3) |
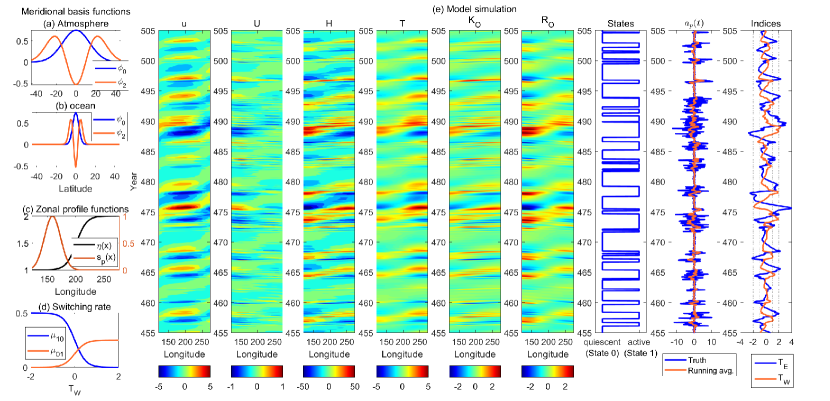
The above coupled system consists of a non-dissipative Matsuno–Gill type atmosphere model [37, 38], a simple shallow-water ocean model [39] and an SST budget equation [24]. The non-dissipative atmosphere is also consistent with the skeleton model for the MJO in the tropics [40]. In (1)–(3), and are the zonal and meridional wind speeds, is the potential temperature, and are the zonal and meridional ocean currents, is the thermocline depth, is the SST, is the latent heat, and is the wind stress along the zonal direction. All the variables are the anomalies from the climatology mean states. There parameters , and are all constants. The parameter is a non-dimensional number, representing the ratio of ocean and atmosphere phase speeds over the Froude number, is related to the background moisture, and is the latent heating exchange coefficient. The thermocline feedback is a fixed spatial dependent function stronger in the eastern Pacific due to the shallower thermocline. See Panel (c) of Figure 1. Also, see the Appendix for a summary of model parameters. Note that different axes in the meridional directions are utilized for the atmosphere () and ocean (). This is because the deformation radii of the atmosphere and the ocean are different. The atmosphere covers the entire equatorial band from , and therefore the periodic boundary condition in the zonal direction is applied, namely . The ocean covers the equatorial Pacific with the boundary conditions and [41, 24].
Since the most predominant behavior of the ENSO is around the equator and along the zonal direction, it is natural to apply a meridional expansion, which serves as the separation of variables, and then implement a meridional truncation to the first basis in both atmosphere and ocean to reduce the complexity of the system. The basis functions in the meridional direction are given by the parabolic cylinder functions [42]. See Panels (a)–(b) in Figure 1 for the meridional basis functions, where the first one has a Gaussian profile. The meridional truncation triggers atmosphere Kelvin, Rossby waves , and ocean Kelvin, Rossby waves . Therefore, after removing the meridional dependence from (1)–(3), the coupled system (with dependence only on time and zonal coordinate ) yields.
Atmosphere:
| (4) |
Ocean:
| (5) |
SST:
| (6) |
The boundary conditions (B.C.) in (4)–(6) are derived from those related to (1)–(3). Periodic boundary conditions are remained for atmosphere waves, while those for the ocean velocity become the reflection boundary conditions for ocean waves. The constants and are the meridional projection coefficients with and , where is the ratio of ocean and atmosphere phase speed. Once these waves are solved, the physical variables can be reconstructed,
| (7) |
where and are the third meridional bases of atmosphere and ocean, respectively, resulting from the meridional expansion of the parabolic cylinder function [42]. See Panels (a)–(b) in Figure 1 for the structures of these bases.
In addition to the interannual state variables, the intraseasonal variabilities are also part of the indispensable ENSO dynamics. Although these intraseasonal variabilities behave like random noise in the interannual time scale, they play vital roles in generating the ENSO events and increasing the ENSO complexity. In particular, atmosphere wind bursts in the intraseasonal time scale, such as the westerly wind bursts (WWBs) [43, 44, 45], easterly wind bursts (EWBs) [46, 47] and the MJO [48, 49], are essential in triggering and terminating the El Niño events. Due to the fast dynamics of wind activities, it is natural to adopt a simple stochastic process to effectively characterize their time evolutions. With the stochastic wind bursts, the zonal wind stress now has two components, , where is directly from the atmosphere model (4) while is the contribution from the stochastic wind bursts. Here,
| (8) |
where for simplicity is a fixed spatial basis function being localized in the western Pacific (see Panel (c) of Figure 1), since most of the active wind bursts are observed there. The stochastic amplitude is given by the following stochastic differential equation
| (9) |
where is a standard white noise [50] and is a damping term characterizing the temporal correlation of the wind bursts at the intraseasonal time scale.
Note that the noise coefficient is state-dependent (namely, the multiplicative noise) as a function of the averaged SST in the western Pacific. This is because a warmer SST induces more convective activities, which in turn triggers more wind bursts [44, 43]. Here, the state dependence of is given by a two-state Markov jump process with one active state and one quiescent state:
| (10) |
The transition rate from the quiescent to the active state and that from the active to the quiescent state are shown in Panel (d) of Figure 1. The explicit equations of them are in the following:
| (11) |
Here, transition rates and are correlated and anti-correlated with , respectively, which reflect the nature of the multiplicative noise. Note that the wind burst activity from the model does not favor specifically westerly or easterly. The WWBs and EWBs generated from the model are entirely random. Only the amplitude of the wind bursts is determined by the transitions related to the SST. The two-state Markov jump process for parameterizing the wind activities is utilized here for simplicity, categorizing the winds by only the active and quiescent phases. A continuous dependence of the wind strength on the SST can easily be incorporated, which leads to a similar SST behavior in the ENSO dynamics [51, 52].
As a final remark, the coupled model (4)–(9) focuses on the eastern Pacific El Niño events, which is the primary interest of this study. The model does not include the mechanism of generating the central Pacific events [53, 54, 55]. Incorporating the central Pacific events into the model will be briefly discussed in Section 6.
3.2 Model properties
The dynamical core of the system (4)–(6) is deterministic, linear and stable. In other words, the solution is a linear damped regular oscillator. The random wind bursts serve as external forcing to trigger the El Niño events and introduce irregularity in the solution. The subsequent La Niña is a consequence of the decaying phase of the ENSO cycle.
Panel (e) in Figure 1 shows one simulation of the coupled model (4)–(9) for different fields. The model can reproduce the quasi-regular oscillation behavior of the SST anomaly. When the SST in the western Pacific increases, the wind activities become more significant. If the strong wind activity is dominated by the WWBs, then El Niño events are likely to be triggered. During this process, the center of the atmosphere wind convergence moves towards the east, and the strong eastward ocean zonal current is observed in the western Pacific. The thermocline depth becomes deeper in the eastern Pacific and induces the El Niño events. The model can generate not only the moderate El Niño events, but also the extreme events, known as the super El Niños, that have strong amplitudes (e.g., the event at ). In addition to reproducing the super El Niño that mimics the observed 1997-1998 event (e.g., at ), the model succeeds in generating the so-called delayed super El Niño [56], similar to the observed 2014-2016 event [57, 47]. One such example is the event around -, which is due to the peculiar wind structures. A series of WWBs induce the onset of an El Niño event. However, a strong EWB occurs immediately to present the development of such an event to a super El Niño. After a year, another period of strong WWBs happen to trigger the extreme event.
Averaging the SST over the eastern Pacific, the resulting time series is denoted by . The model can reproduce very similar non-Gaussian probability density function (PDF) of as the observations [13]. This non-Gaussian feature is reproduced with the contribution from the multiplicative noise, without which the model is linear and the associated PDF is Gaussian. Likewise, the spectrum of the model has the most significant power within the band of 3 to 7 years, which is also consistent with observations.
4 Reduced-Order Representation of the ENSO dynamics
4.1 Discretization of the deterministic, linear and stable dynamics
Without the stochastic wind bursts, the coupled atmosphere-ocean-SST model (4)–(6) is a linear, deterministic and stable model. Since (and therefore the wind stress ) is a function of and , the coupled system can be rewritten as
| (12) | ||||||
where a small damping is added to guarantee the solution is unique [13], and the new constants introduced in (12) are the following ones:
The domain of and is the equatorial Pacific ocean while the domain of and is the entire equatorial band .
Define a vector that contains all the prognostic variables at discrete equal-partitioned grid points,
| (13) |
where is the total number of grid points over the equatorial Pacific region and is the vector transpose. Using an upwind scheme, the discrete form of the linear system (12) is given by:
| (14) |
The detailed form of is included in the Appendix. With the stochastic wind burst, the above equation can be formally written as:
| (15) |
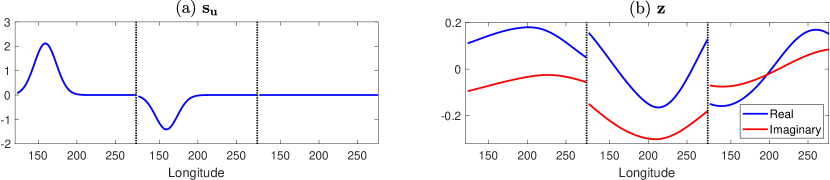
where is associated with the stochastic forcing. Denote by and then , where is written in the discrete form at grid points and is a vector with all zero entries. This is the wind burst forcing acting on the three components (ocean Kelvin wave, ocean Rossby wave, and SST) of the state variables. See Panel (a) of Figure 2 for the profile of . As expected, a positive response is on the ocean Kelvin waves and a negative one is on the ocean Rossby waves, both in the western Pacific. The forcing is not directly imposed on SST; therefore, the third segment of , corresponding to SST components, is zero.
4.2 The eigenvalues of the system
It can be numerically validated that the eigenvalues all have distinct values and are non-zero. In addition, the -th left eigenvector and the -th right eigenvector of the matrix are orthogonal with each other for . Therefore, in light of the matrix similarity, the following result is arrived at:
| (16) |
or equivalently
| (17) |
where is a diagonal matrix with diagonal entries being eigenvalues and contains the right eigenvectors. Since the right eigenvectors are complete, the matrix inverse exists.
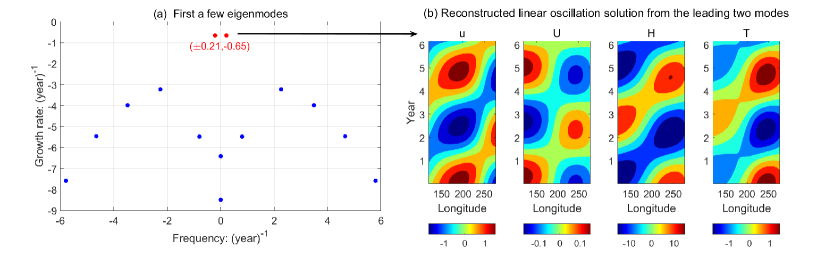
Panel (a) of Figure 3 shows the eigenvalues associated with the matrix , where is utilized here and in the subsequent numerical simulations. These eigenvalues are complex numbers. The real and imaginary parts are shown in the y- and x-axis, representing the growth rate and the frequency, respectively. Since the starting system is stable, the growth rates of all the eigenvalues are negative, representing the decay of the solution. These eigenvalues are ranked according to the growth rate. Therefore, the leading two eigenmodes (marked by red dots) are the dominant modes of the system since they have the slowest decaying rates. These two modes appear in pairs; both the eigenvalues and the eigenvectors are complex conjugates. Their eigenvalues have a frequency of years and a decay rate of years, which are consistent with the observed features of ENSO. The reconstructed spatiotemporal patterns associated with these two eigenmodes (by setting the growth rate to be zero for the plotting purpose), as shown in Panel (b) of (3), mimic the large-scale ENSO oscillation solution. Notably, the leading two eigenmodes are very robust with respect to the spatial resolution as long as is not too small. Therefore, the analysis here provides a theoretical justification for developing a low-order model based on these leading two eigenmodes.
4.3 Comparison of the projected solution with the full solution
Before developing a reduced-order conceptual model based on the eigenvalue analysis, as shown above, it is essential to study the similarity and the gap between the full solution from the spatially-extended stochastic system (4)–(9) and that from the low-dimensional representation consisting of only the leading two eigenmodes, namely the projected solution.
Figure 4 includes a comparison of the SST between these two solutions. The projected solution (Panel (b)) is qualitatively similar to the full solution (Panel (a)) with an almost identical pattern and a nearly negligible residual error (Panel (c)). This is not surprising since the decaying rates of the remaining eigenmodes are more significant than those of the leading two components. Thus, the time evolution of the signal is overall explained by the two leading modes. In addition to the spatiotemporal pattern, the two key statistics, namely the power spectrum and the PDF, of the averaged SST over the eastern Pacific are almost indistinguishable between the full and the projected solutions. In particular, the power spectrum peaks between 3 and 7 years, which is consistent with the observed frequency of the ENSO cycles. The projected solution also recovers the non-Gaussian PDF of , which has almost the same skewness and kurtosis as the full solution. Non-Gaussianity is a crucial feature of the ENSO statistics, which indicates a non-symmetry between the El Niño and the La Niña. The fat tail on the positive side corresponds to the super El Niños, which remains in the projected solution.
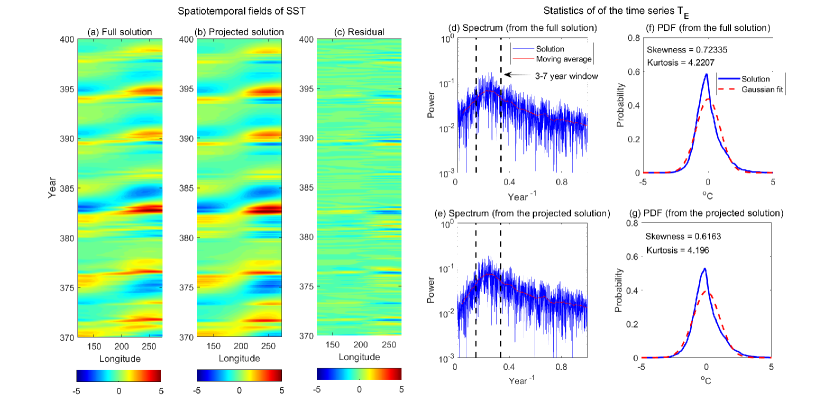
Figure 5 includes a more detailed comparison between the full and the projected solutions by showing different physical and wave variables. A delayed super El Niño event (from to ) occurs during this period. Overall, the projected solution captures the spatiotemporal patterns of the full one. Especially, the delayed super El Niño is reproduced in the projected solution. Yet, the small-scale wave propagation is missed in the projected solution. This is particularly unambiguous in the panels of the ocean Kelvin wave and the ocean Rossby wave . As a result, the values across the western Pacific or the eastern Pacific remain constant for different fields. This is perhaps the most significant difference between the full and the projected solutions. Small-scale wave propagations are expected to appear at least with three degrees of freedom (e.g., either three variables or three regions across Pacific) [9]. Nevertheless, the projected solution clearly captures the large-scale eastward moving patterns, representing the ENSO development.
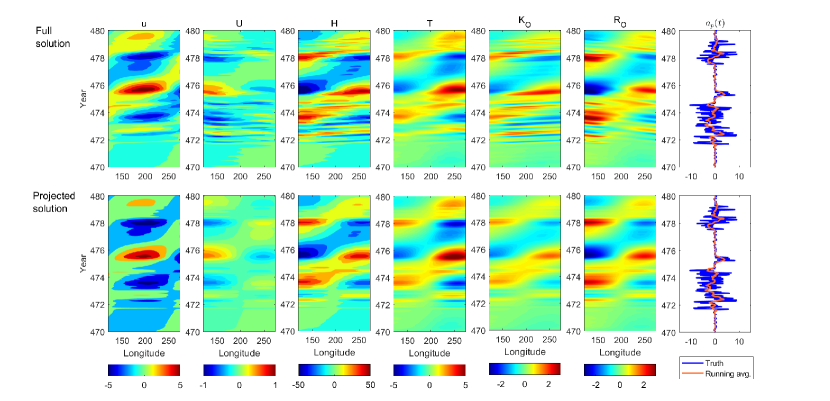
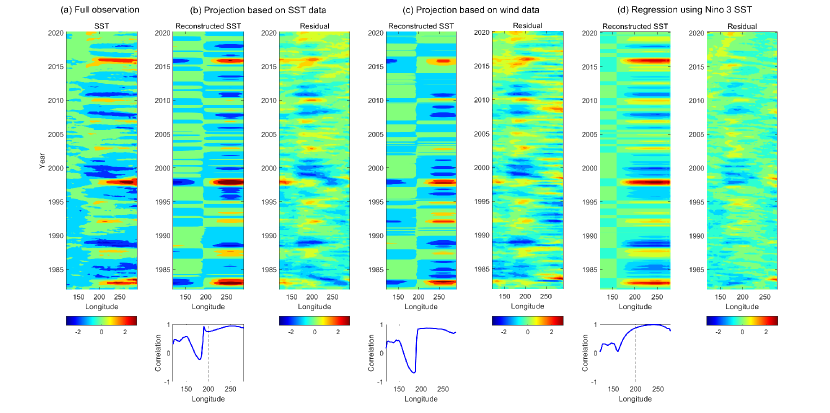
Figure 6 compares the full observed SST using the reanalysis data (Panel (a)) with the projected data using the leading two eigenmodes computed from the model. Panel (b) shows the results by directly projecting the SST to these two modes. The projected solution resembles the full observations in the eastern Pacific with a pattern correlation above at all longitude grid points. In contrast, the projected solution in the central-western Pacific differs from the full solution. This is not surprising since the starting model and the low-order presentation here focus only on the eastern Pacific El Niño events and do not have the mechanism to create the central Pacific events. The projected solution in the western Pacific captures the overall patterns of the full observations, though the details are somewhat missed. In addition to using the SST data, the atmosphere wind data can also be used to reconstruct the low-order representation of the SST. See Panel (c). Here, the atmosphere wind data is first projected to the leading two eigenvectors corresponding to the atmosphere components to compute the projection coefficients. Then these coefficients are multiplied by the eigenvectors corresponding to the SST components for reconstruction. The reconstructed low-order representation of SST using the atmosphere reanalysis data has a similar pattern as that based on the direct projection using the SST in the eastern Pacific. Finally, Panel (d) shows the reconstructed SST data using a direct data-driven regression method. This is achieved by first computing the correlation coefficient between the SST at each longitude with the Niño 3 SST index using the observational data and then carrying out the spatiotemporal reconstruction using the formula . Note that this procedure uses the entire observational data and can be regarded as one of the optimal linear reconstruction methods. It serves as a benchmark solution. The results show that, similar to the low-dimensional projected solutions in Panels (b)–(c), the reconstruction in the eastern Pacific resembles the truth while that in the central-western Pacific contains a significant error. The comparison between the results in Panels (b)–(c) and Panel (d) implies that the reconstruction using the model-induced basis functions is skillful in reproducing the eastern Pacific El Niño events. It also indicates that both the wind and the SST data can be used for the reconstruction, allowing large freedom in choosing the available data sets.
5 Reduced-Order Conceptual Models
Given the fact that the reconstructed SST fields from the projected solution and the full solution are similar to each other, it is natural to develop a reduced-order conceptual model using these two eigenmodes to characterize ENSO complexity with low computational cost.
5.1 The general framework
Plugging the relationship of the matrix decomposition in (17) into the full system (15) yields
| (18) |
where is a diagonal matrix. Then multiplying (18) by gives independent equations
| (19) |
where
| (20) |
Once is solved, can be obtained by
| (21) |
Denote by and the first two rows of . See Panel (b) of Figure 2 for the profile of . Likewise, denote by and the first two columns of . The corresponding leading two eigenvalues are denoted by and (the two red dots in Panel (a) of Figure 3), which are written as with and being the growth rate and the frequency, respectively. Here is the transpose, and is the complex conjugate. Clearly, .
Proposition 5.1.
Define and and naturally, and . In light of the first two dimensions of (19), the following two-dimensional forced oscillator system is reached,
| (22) |
Once and are computed, the approximate of based on these two modes (namely the low-order representation of the spatiotemporal reconstructed solution), which is denoted by , can be computed via
| (23) |
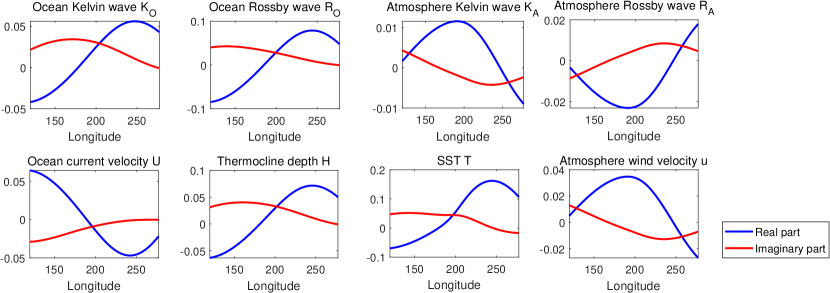
Figure 7 shows the eigenvector associated with for different model components.
It is worthwhile to highlight that, as was shown in (13), the solution consists of the ocean Kelvin wave , the ocean Rossby wave , and the SST . Recall in (7) that the ocean current and the thermocline depth are the linear combinations of and . In addition, the atmosphere wind and the potential temperature can be solved by exploiting the linear relationship with the ocean and SST variables according to (12) (see Appendix for details). Therefore, the two-dimensional low-order conceptual model (22) provides the solutions for all the atmosphere, ocean, and SST fields with detailed spatiotemporal solutions. This contrasts with many existing conceptual models, which focus only on a small set of specified state variables and often merely involve the averaged quantities over a large domain.
5.2 Two-dimensional forced oscillator with arbitrarily specified quantities as state variables
The general framework in (22) also allows the development of the reduced-order models with arbitrarily specified quantities (in addition to the direct model output , , , and ) as state variables. This can be achieved by introducing two new real-valued state variables and , which are the linear combinations of and by angle rotations and amplifications,
| (24a) | ||||
| (24b) | ||||
Here and are rotating angles to be in phase with the two new physical variables of interest while the real variables and are the amplitudes. Here, it is required that and to rule out the degenerated case. The two variables and can be defined as any variables that can be represented by a linear combination of the model state variables.
Proposition 5.2.
The approximate solution of based on the two arbitrary state variables and is given by
| (25) |
where
| (26) |
are the new spatial bases (eigenvectors) associated with and , which are real-valued.
Proof.
The above framework is adapted to the cases where the main interest lies in certain averaged quantities, as in many of the classical conceptual models for the ENSO. For example, can be the SST in the eastern Pacific and the thermocline in the western Pacific. They can also be the atmosphere wind and ocean current averaged over the entire Pacific or a specific region. In such situations, the amplitudes and can be determined by two scalars and , which are the averaged values of and over a certain domain. This allows the development of a two-dimensional system for and that is linked with the traditional conceptual models.
Proposition 5.3.
See the Appendix for the proofs.
5.3 Special case: stochastic discharge-recharge oscillator
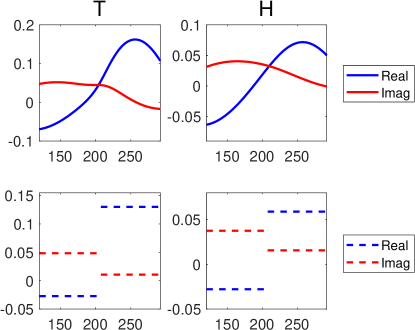
The discharge-recharge oscillator argues that discharge and recharge of equatorial heat content cause the coupled system to oscillate [7]. Define and in (29), representing the averaged SST in the eastern Pacific and the averaged thermocline depth in the western Pacific. The corresponding scalars and are given by
| (31) |
which are computed by averaging the eigenvectors associated with and over the eastern Pacific and western Pacific, respectively. See Figure 8.
The other coefficients in (29) can be computed using the eigenvalues of the leading two modes as well as and in (31). They are:
| (32) |
and
| (33) |
The remaining thing is to determine the multiplicative noise coefficient of the stochastic amplitude in (9), which is a function of the averaged SST in the western Pacific . Yet, is not the state variable in the two-dimensional discharge-recharge oscillator model. Nevertheless, can be written as a linear function of and . Recall that
| (34) |
which can be used to solve and ,
| (35) |
Once the basis is determined, the value of can be computed,
| (36) |
which are functions of and , and is given by
| (37) |
The direct representation of the by also justifies and unifies the use of SST in different regions (averaged values over the eastern Pacific, over the western Pacific or basin averaged value) as multiplicative noise coefficients in various conceptual models [58, 59, 60, 61].
After obtaining the value of , the multiplicative noise coefficient is determined. Note that the is slightly modified to and to compensate for the approximation error from the low-order representation.
According to (32), the coefficient and associated with equations are both positive. The coefficient represents the Bjerknes positive feedback while is the recharge mechanism. On the other hand, a negative coefficient appears in the equation of , which indicates the discharge mechanism. Another finding is that, although the wind bursts directly impact the SST in heuristic thinking, the stochastic forcing appears in both the equations of and for the completeness of the stochastic discharge-recharge diagram. The opposite signs of and imply that the increase of SST in the eastern Pacific by the WWBs will simultaneously cause a decrease of the thermocline in the western Pacific.
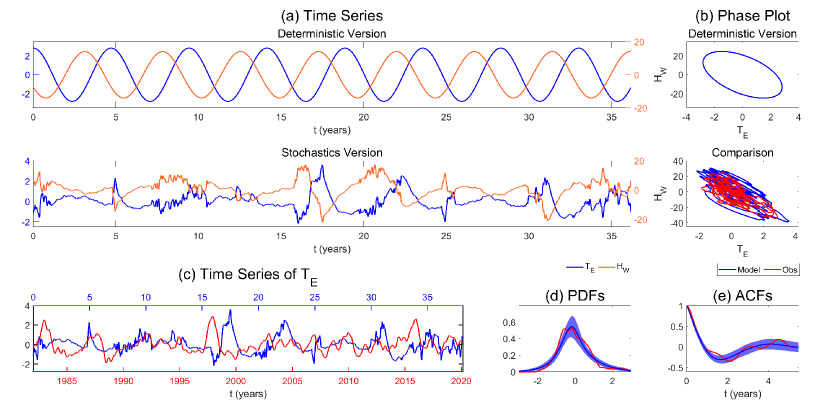
Figure 9 shows the time series and phase plot of both the deterministic and stochastic versions of the discharge-recharge models developed above. The deterministic model (by setting the damping to be zero and ignoring the stochastic terms) leads to a regular oscillator while the time series of and generated from the stochastic model mimic those in observations. It is worth highlighting that the phase difference between and is (not or ), which is also confirmed by the lag between the two time series. Such a phase difference also resembles that from the observations. In addition, the observational time series and the stochastic model simulation of are compared. Due to the random noise, the trajectories from the stochastic model and the observations do not expect to have a one-to-one point-wise match between each other. Nevertheless, the stochastic model simulation succeeds in capturing the EP events. Finally, the PDF and the autocorrelation function (ACF) of from the stochastic model have very similar behavior to the observations. The PDF is skewed with a one-sided fat tail, which indicates that the model can reproduce a sufficient number of the super El Niño events. Similarly, matching the ACF with observations implies that the time series of from the model has, on average, the same temporal correlation (namely the time scale of the memory effect) as the observations. These findings suggest that the low-order model can capture the observed dynamical and statistical features of the time series , which is an important indicator for the eastern Pacific El Niño.
5.4 Special case: stochastic delayed oscillator
The two-dimensional stochastic oscillator (29) can be further reduced to a one-dimensional oscillator with a delayed effect, which leads to the delayed oscillator of the ENSO.
Proposition 5.4.
Defining , the averaged SST over the eastern Pacific. The delayed oscillator is given by
| (38) |
where and . The coefficients , and are the same as those in (32) and (33). The other two noise coefficients and are given by
Here, and are solved as follows. As the matrix in (30) has two distinct eigenvalues, which are also complex conjugates, it can be diagonalized . Denote by
where the fact that the two eigenvectors are complex conjugates has been utilized. In addition, the angle difference and the amplitude difference are given by
| (39) |
where
with and .
See the Appendix for the proofs. Numerically, these constants and coefficients are given by
The detailed expression of the stochastic forcing with the memory effect derived here is an essential supplement to the original delayed oscillator model [29, 16], which was deterministic. Several conclusions can be drawn from this delayed oscillator. First, In front of the delayed term , there is a factor with an exponential decay . This is a crucial feature, which indicates that the contribution of the delayed signal will be affected by the damping effect and becomes weaker as time goes on. Second, there are two ways that stochastic noise contributes to the system. The term provides an instantaneous response to the system, while the stochastic forcing inside the integral represents the contribution from the noise accumulation. The latter also has a delayed contribution. Notably, although the damping time of the noise is intraseasonal, the noise interacting with the coupled system can affect the interannual time scale. Third, similar to the discharge-recharge oscillator, the delay here is () instead of (). Finally, the sign of the delayed term depends on the sign of , which can be either positive or negative, depending on the state variables used for the model. The parameter is positive in the above model since . Yet, when the angle is less than , then representing a negative delay, which is consistent with the discussions in [16]. In particular, if the average of the thermocline over the whole Pacific is adopted as was in [16], then a negative delay (about ) appears.
6 Conclusion and Discussions
In this paper, a framework of low-order stochastic conceptual models for the ENSO is systematically derived from a spatially-extended stochastic dynamical system with full mathematical rigor. It provides outputs for all the atmosphere, ocean, and SST components with detailed spatiotemporal patterns, which differs from many existing conceptual models focusing only on a small set of specified state variables. The framework also allows rigorously deriving the stochastic versions of the discharge-recharge oscillator and delayed oscillator models. Observational data is utilized to validate the skill of the low-order conceptual model in capturing the large-scale features of the ENSO in the eastern Pacific. The rigorous derivation of these low-order models provides a unique connection between models with different complexities. The framework developed here also facilitates understanding the instantaneous and memory effects of stochastic noise in contributing to the large-scale dynamics of ENSO.
The current modeling framework focuses on the eastern Pacific ENSO events. To characterize the ENSO diversity [55] that also includes the central Pacific El Niño, the ocean zonal advection mechanism should be incorporated in the starting spatially-extended model. It is worth noting that the dynamics of the central Pacific El Niño often contain certain levels of nonlinearity [62, 9]. Therefore, suitable nonlinearity needs to be added to the linear low-order conceptual models to better describe the central Pacific El Niño, which is remained as a future work.
Despite the simple forms of conceptual models, they can be utilized as testbeds for guiding more sophisticated models. In particular, including stochastic noise or stochastic parameterizations in ICMs or GCMs is always a challenging topic. Therefore, testing various strategies based on conceptual models is practically useful. These simple conceptual models can also be utilized to build a hierarchy of models with different complexity for understanding the ENSO dynamics with the help of data-driven techniques.
Acknowledgements
The research of N.C. is partially funded by ONR N00014-21-1-2904. Y.Z. is supported as a PhD research assistant under this grant. N.C. wish to thank his late advisor Andrew J. Majda for valuable discussions on some initial ideas of this work.
7 Appendix
7.1 A summary of the parameters in the spatially-extended stochastic system
This section will provide details for parameter values and dimensional values.
| Variable | Explanation | Value |
|---|---|---|
| thermocline depth anomalies | ||
| sea surface temperature anomalies | ||
| zonal current speed anomalies | ||
| time axis intraseasonal | 0.48 days | |
| zonal wind speed anomalies | ||
| potential temperature anomalies |
| Parameter | Explanation | Value |
|---|---|---|
| atmospheric meridional projection coefficient | 0.325 | |
| oceanic meridional projection coefficient | 1.3 | |
| equatorial belt length | 8/3 | |
| equatorial Pacific length | 7/6 | |
| mean vertical moisture gradient | 0.9 | |
| mean SST | 16.67 (which is 25oC) | |
| wind stress coefficient | 6.53 | |
| latent heating exchange coefficient | 8.7 | |
| latent heating factor | ||
| latent heating multiplier coefficient | 7 | |
| latent heating exponential coefficient | 0.093 | |
| latent heating adjustment rate | 15 | |
| western boundary reflection coefficient | 0.5 | |
| eastern boundary reflection coefficient | 1 | |
| modified ratio of phase speed | 0.5 | |
| profile of thermocline feedback | ||
| additional damping | ||
| wind burst damping | 3.4 (which is 3mon-1) | |
| wind burst zonal structure | ||
| wind burst source of quiescent state | 0.2 | |
| wind burst source of active state | 2.6 | |
| transition rate from the active to quiescent state | ||
| transition rate from the quiescent to active state |
7.2 Determining the matrix in (14)
Recall the system in (14). Rewrite it in terms of the components with respect to the three set of the variables , and :
| (40) |
where the matrix in (14) is expanded into a matrix. In the following, the goal is to determine the matrix , namely the with , in (40).
Let us start with the ocean model
| (41) | ||||||
An upwind scheme is utilized for the spatial discretization,
| (42) |
where the boundary conditions are given by and . Therefore,
| (43) |
Next, for the atmosphere model
| (44) | ||||||
where is an indicator function with value being when variables are located within the interval and otherwise. The discretization of (44) results in
and
| (45) |
where the relationship has been used. Note that the averaging is taken over the entire equator band and therefore the factor in front of the summation appears. Rearranging the terms in (45) gives
and
Thus, and for can be solved via the following linear systems,
| (46) |
which means and can be expressed by . In (46)
with being one unit of the spatial discretization. Further define . Then the matrices in (46) are given by
and
Recall the ocean model,
Since and can be expressed by , we have
| (47) |
where the original matrices on the right hand side should be of size but only the first rows are utilized to form and which correspond to and within the Pacific band.
7.3 Proofs of the propositions
7.3.1 Proof of Proposition 5.3
Proof.
Let and , where , , , and . It is clear that and are complex scalars. For convenience, write
| (49) |
and therefore
Once is computed, multiplying it by a factor of finishes the solutions and . For this reason, the focus here is on solving .
Multiplying (22) by and , respectively, yields
| (50a) | ||||
| (50b) | ||||
where and . Inserting (49) into (50) results in four equations for the real and imaginary parts of and the real and imaginary parts of ,
| (51a) | ||||
| (51b) | ||||
| (51c) | ||||
| (51d) | ||||
Here, only the two equations (51a) and (51c) for the real part of and need to be solved, since and give the pair of physical variables we aim at.
The goal now is to use and to represent the term and in (51a) and (51c). To this end, let’s introduce two new complex scalars
| (52) |
which are the ratio (and the inverse ratio) of the two bases and . Combining (49) and (52) yields,
which leads to
| (53a) | ||||
| (53b) | ||||
With (53) in hand, plugging (53a) into (51a) yields
| (54) |
Next, plugging (53b) into (54) to cancel leads to
| (55) |
Although (55) again introduces , making use of (51a) and (55) suffices to cancel this . To this end, multiplying the equation (51a) by gives
| (56) |
Subtracting (56) from (55) results in
which implies
| (57) |
Applying the same argument leads to the corresponding equation of that does not explicitly depend on ,
| (58) |
Finally, multiplying both and by a factor of gives the two-dimensional oscillator model of and ,
| (59) |
where
| (60) |
It is convenient to define
| (61) |
which links with and gives the form in (29). ∎
7.3.2 Proof of Proposition 5.4
Proof.
The delayed oscillator is formed based on the same starting idea from the discharge-recharge oscillator. It exploits the equations in (59) to represent in the first equation as a function of leads to a delayed El Niño.
Let us start with (59). To make the notation simple, rewrite (59) as follows:
| (62) |
where and . Define two-dimensional vectors and a matrix ,
It is easy to check that has two distinct eigenvectors . Thus, a similarity transform leads to , where is a diagonal matrix with diagonal entries being . Now, (62) can be written as
| (63) |
Define and . Multiplying (63) by yields
where
and therefore
| (64) |
Once is solved, is easily recovered by . Since the two eigenvalues are a complex conjugate pair, the eigenvector matrix must have the following form
| (65) |
Therefore,
| (66) |
For the notation simplicity below, rewrite and into the following form
Similarly, rewrite the initial value and the forcing as
Thus, the solution of (64) can be written as
Therefore,
| (67) |
Similarly,
| (68) |
Note that (67) and (68) have the same composition: a contribution from initial value and a contribution from external forcing. Below, let’s write down these two components (and drop the common prefactors) for the convenience of discussion.
I. Composition of initial value:
II. Composition of external forcing:
For the initial value part, rewrite the two expressions as
| (69d) | ||||
| (69j) | ||||
| (69n) | ||||
| (69t) | ||||
and
| (70d) | ||||
| (70j) | ||||
| (70n) | ||||
| (70t) | ||||
It is clear that the difference between and is given by the angle between the two matrices consisted of the eigenvectors
| (71) |
that is, there exists a rotation matrix and a constant
| (72) |
such that
| (73) |
Making use of (73), the formula in (69t) becomes
| (74) |
Similarly, (70t) can be rewritten as
| (75) |
Therefore, in light of (74) and (75), (68) becomes
| (76) |
Comparing (67) and (76) leads to
| (77) |
Note that in (66) we defined and . Thus, plugging (77) to the first equation of (62) yields
| (78) |
∎
References
- [1] S. G. H. Philander, El Niño Southern Oscillation phenomena, Nature 302 (5906) (1983) 295–301.
- [2] C. F. Ropelewski, M. S. Halpert, Global and regional scale precipitation patterns associated with the El Niño/Southern Oscillation, Monthly Weather Review 115 (8) (1987) 1606–1626.
- [3] S. A. Klein, B. J. Soden, N.-C. Lau, Remote sea surface temperature variations during ENSO: Evidence for a tropical atmospheric bridge, Journal of Climate 12 (4) (1999) 917–932.
- [4] M. J. McPhaden, S. E. Zebiak, M. H. Glantz, ENSO as an integrating concept in earth science, Science 314 (5806) (2006) 1740–1745.
- [5] P. S. Schopf, M. J. Suarez, Vacillations in a coupled ocean–atmosphere model, Journal of Atmospheric Sciences 45 (3) (1988) 549–566.
- [6] J. Picaut, M. Ioualalen, C. Menkès, T. Delcroix, M. J. Mcphaden, Mechanism of the zonal displacements of the pacific warm pool: Implications for ENSO, Science 274 (5292) (1996) 1486–1489.
- [7] F.-F. Jin, An equatorial ocean recharge paradigm for ENSO. Part I: Conceptual model, Journal of the Atmospheric Sciences 54 (7) (1997) 811–829.
- [8] C. Wang, J. Picaut, Understanding ENSO physics—A review, Earth’s Climate: The Ocean–Atmosphere Interaction, Geophys. Monogr 147 (2004) 21–48.
- [9] N. Chen, X. Fang, J.-Y. Yu, A multiscale model for El Niño complexity, npj Climate and Atmospheric Science 5 (1) (2022) 1–13.
- [10] A. Capotondi, P. D. Sardeshmukh, L. Ricciardulli, The nature of the stochastic wind forcing of ENSO, Journal of Climate 31 (19) (2018) 8081–8099.
- [11] P. Leeuwen, Balanced ocean-data assimilation near the equator, Journal of Physical Oceanography 32 (2002) 25092519Caniaux.
- [12] X. Fang, F. Zheng, Simulating eastern-and central-pacific type ENSO using a simple coupled model, Advances in Atmospheric Sciences 35 (6) (2018) 671–681.
- [13] S. Thual, A. J. Majda, N. Chen, S. N. Stechmann, Simple stochastic model for El Niño with westerly wind bursts, Proceedings of the National Academy of Sciences 113 (37) (2016) 10245–10250.
- [14] N. Chen, A. J. Majda, Simple stochastic dynamical models capturing the statistical diversity of El Niño Southern Oscillation, Proceedings of the National Academy of Sciences 114 (7) (2017) 1468–1473.
- [15] S. E. Zebiak, M. A. Cane, A model El Niño–Southern Oscillation, Monthly Weather Review 115 (10) (1987) 2262–2278.
- [16] D. S. Battisti, A. C. Hirst, Interannual variability in a tropical atmosphere–ocean model: Influence of the basic state, ocean geometry and nonlinearity, Journal of the Atmospheric Sciences 46 (12) (1989) 1687–1712.
- [17] J. D. Neelin, F.-F. Jin, Modes of interannual tropical ocean–atmosphere interaction—a unified view. Part II: Analytical results in the weak-coupling limit, Journal of Atmospheric Sciences 50 (21) (1993) 3504–3522.
- [18] R.-H. Zhang, S. E. Zebiak, R. Kleeman, N. Keenlyside, A new intermediate coupled model for El Niño simulation and prediction, Geophysical Research Letters 30 (19).
- [19] N. Chen, X. Fang, A simple multiscale intermediate coupled stochastic model for El Niño diversity and complexity, arXiv preprint arXiv:2206.06649.
- [20] Y. Y. Planton, E. Guilyardi, A. T. Wittenberg, J. Lee, P. J. Gleckler, T. Bayr, S. McGregor, M. J. McPhaden, S. Power, R. Roehrig, et al., Evaluating climate models with the clivar 2020 ENSO metrics package, Bulletin of the American Meteorological Society 102 (2) (2021) E193–E217.
- [21] N.-C. Lau, M. J. Nath, Impact of ENSO on the variability of the Asian–Australian monsoons as simulated in GCM experiments, Journal of Climate 13 (24) (2000) 4287–4309.
- [22] E. Guilyardi, A. Capotondi, M. Lengaigne, S. Thual, A. T. Wittenberg, Enso modeling: History, progress, and challenges, El Niño Southern Oscillation in a changing climate (2020) 199–226.
- [23] B. Zhao, A. Fedorov, The effects of background zonal and meridional winds on ENSO in a coupled GCM, Journal of Climate 33 (6) (2020) 2075–2091.
- [24] F.-F. Jin, An equatorial ocean recharge paradigm for ENSO. Part II: A stripped-down coupled model, Journal of the Atmospheric Sciences 54 (7) (1997) 830–847.
- [25] M. Latif, D. Anderson, T. Barnett, M. Cane, R. Kleeman, A. Leetmaa, J. O’Brien, A. Rosati, E. Schneider, A review of the predictability and prediction of ENSO, Journal of Geophysical Research: Oceans 103 (C7) (1998) 14375–14393.
- [26] Y. Xue, M. Cane, S. Zebiak, M. Blumenthal, On the prediction of ENSO: A study with a low-order Markov model, Tellus A 46 (4) (1994) 512–528.
- [27] X. Fang, N. Chen, Quantifying the predictability of ENSO complexity using a statistically accurate multiscale stochastic model and information theory, arXiv preprint arXiv:2203.02657.
- [28] K. Wyrtki, El Niño–the dynamic response of the equatorial Pacific ocean to atmospheric forcing, Journal of Physical Oceanography 5 (4) (1975) 572–584.
- [29] M. J. Suarez, P. S. Schopf, A delayed action oscillator for ENSO, Journal of Atmospheric Sciences 45 (21) (1988) 3283–3287.
- [30] J. P. McCreary Jr, A model of tropical ocean-atmosphere interaction, Monthly Weather Review 111 (2) (1983) 370–387.
- [31] R. H. Weisberg, C. Wang, A western Pacific oscillator paradigm for the El Niño-Southern Oscillation, Geophysical Research Letters 24 (7) (1997) 779–782.
- [32] J. Picaut, F. Masia, Y. Du Penhoat, An advective-reflective conceptual model for the oscillatory nature of the ENSO, Science 277 (5326) (1997) 663–666.
- [33] C. Wang, A unified oscillator model for the el niño–southern oscillation, Journal of Climate 14 (1) (2001) 98–115.
- [34] R. W. Reynolds, T. M. Smith, C. Liu, D. B. Chelton, K. S. Casey, M. G. Schlax, Daily high-resolution-blended analyses for sea surface temperature, Journal of Climate 20 (22) (2007) 5473–5496.
- [35] D. Behringer, Y. Xue, Evaluation of the global ocean data assimilation system at NCEP: The Pacific Ocean, in: Proc. Eighth Symp. on Integrated Observing and Assimilation Systems for Atmosphere, Oceans, and Land Surface, 2004.
- [36] E. Kalnay, M. Kanamitsu, R. Kistler, W. Collins, D. Deaven, L. Gandin, M. Iredell, S. Saha, G. White, J. Woollen, et al., The NCEP/NCAR 40-year reanalysis project, Bulletin of the American Meteorological Society 77 (3) (1996) 437–472.
- [37] T. Matsuno, Quasi-geostrophic motions in the equatorial area, Journal of the Meteorological Society of Japan. Ser. II 44 (1) (1966) 25–43.
- [38] A. E. Gill, Some simple solutions for heat-induced tropical circulation, Quarterly Journal of the Royal Meteorological Society 106 (449) (1980) 447–462.
- [39] G. K. Vallis, Geophysical fluid dynamics: whence, whither and why?, Proceedings of the Royal Society A: Mathematical, Physical and Engineering Sciences 472 (2192) (2016) 20160140.
- [40] A. J. Majda, S. N. Stechmann, The skeleton of tropical intraseasonal oscillations, Proceedings of the National Academy of Sciences 106 (21) (2009) 8417–8422.
- [41] M. A. Cane, E. Sarachik, D. Moore, E. Sarachik, The response of a linear baroclinic equatorial ocean to periodic forcing, Journal of Marine Research 39 (4) (1981) 651–693.
- [42] A. Majda, Introduction to PDEs and Waves for the Atmosphere and Ocean, Vol. 9, American Mathematical Soc., 2003.
- [43] D. Harrison, G. A. Vecchi, Westerly wind events in the tropical pacific, 1986–95, Journal of Climate 10 (12) (1997) 3131–3156.
- [44] G. A. Vecchi, D. Harrison, Tropical Pacific sea surface temperature anomalies, El Niño, and equatorial westerly wind events, Journal of climate 13 (11) (2000) 1814–1830.
- [45] E. Tziperman, L. Yu, Quantifying the dependence of westerly wind bursts on the large-scale tropical Pacific SST, Journal of Climate 20 (12) (2007) 2760–2768.
- [46] S. Hu, A. V. Fedorov, Exceptionally strong easterly wind burst stalling El Niño of 2014, Proceedings of the National Academy of Sciences 113 (8) (2016) 2005–2010.
- [47] A. F. Levine, M. J. McPhaden, How the July 2014 easterly wind burst gave the 2015–2016 El Niño a head start, Geophysical research letters 43 (12) (2016) 6503–6510.
- [48] H. H. Hendon, M. C. Wheeler, C. Zhang, Seasonal dependence of the MJO–ENSO relationship, Journal of Climate 20 (3) (2007) 531–543.
- [49] M. Puy, J. Vialard, M. Lengaigne, E. Guilyardi, Modulation of equatorial Pacific westerly/easterly wind events by the Madden–Julian oscillation and convectively-coupled Rossby waves, Climate Dynamics 46 (7-8) (2016) 2155–2178.
- [50] C. W. Gardiner, et al., Handbook of stochastic methods, Vol. 3, springer Berlin, 1985.
- [51] A. F. Levine, F.-F. Jin, Noise-induced instability in the ENSO recharge oscillator, Journal of the Atmospheric Sciences 67 (2) (2010) 529–542.
- [52] N. Chen, F. Gilani, J. Harlim, A Bayesian machine learning algorithm for predicting ENSO using short observational time series, Geophysical Research Letters 48 (17) (2021) e2021GL093704.
- [53] K. Ashok, S. K. Behera, S. A. Rao, H. Weng, T. Yamagata, El Niño Modoki and its possible teleconnection, Journal of Geophysical Research: Oceans 112 (C11).
- [54] T. Lee, M. J. McPhaden, Increasing intensity of el Niño in the central-equatorial pacific, Geophysical Research Letters 37 (14).
- [55] A. Capotondi, A. T. Wittenberg, M. Newman, E. Di Lorenzo, J.-Y. Yu, P. Braconnot, J. Cole, B. Dewitte, B. Giese, E. Guilyardi, et al., Understanding ENSO diversity, Bulletin of the American Meteorological Society 96 (6) (2015) 921–938.
- [56] S. Thual, A. J. Majda, N. Chen, Statistical occurrence and mechanisms of the 2014–2016 delayed super El Niño captured by a simple dynamical model, Climate Dynamics 52 (3-4) (2019) 2351–2366.
- [57] L. Chen, T. Li, B. Wang, L. Wang, Formation mechanism for 2015/16 super El Niño, Scientific reports 7 (1) (2017) 1–10.
- [58] S.-I. An, S.-K. Kim, A. Timmermann, Fokker–Planck dynamics of the El Niño-Southern Oscillation, Scientific reports 10 (1) (2020) 1–11.
- [59] S.-I. An, E. Tziperman, Y. M. Okumura, T. Li, ENSO irregularity and asymmetry, El Niño Southern Oscillation in a changing climate (2020) 153–172.
- [60] A. F. Levine, F. F. Jin, A simple approach to quantifying the noise–enso interaction. part i: Deducing the state-dependency of the windstress forcing using monthly mean data, Climate Dynamics 48 (1-2) (2017) 1–18.
- [61] L. T. Giorgini, W. Moon, N. Chen, J. Wettlaufer, Non-Gaussian stochastic dynamical model for the El Niño southern oscillation, Physical Review Research 4 (2) (2022) L022065.
- [62] S. Zhao, F.-F. Jin, X. Long, M. A. Cane, On the breakdown of ENSO’s relationship with thermocline depth in the central-equatorial Pacific, Geophysical Research Letters 48 (9) (2021) e2020GL092335.