Retinal Microvasculature as Biomarker for Diabetes and Cardiovascular Diseases
Abstract.
Purpose: To demonstrate that retinal microvasculature per se is a reliable biomarker for Diabetic Retinopathy (DR) and, by extension, cardiovascular diseases.
Methods: Deep Learning Convolutional Neural Networks (CNN) applied to color fundus images for semantic segmentation of the blood vessels and severity classification on both vascular and full images. Vessel reconstruction through harmonic descriptors is also used as a smoothing and de-noising tool. The mathematical background of the theory is also outlined.
Results: For diabetic patients, at least 93.8% of DR No-Refer vs. Refer classification can be related to vasculature defects. As for the Non-Sight Threatening vs. Sight Threatening case, the ratio is as high as 96.7%.
Conclusion: In the case of DR, most of the disease biomarkers are related topologically to the vasculature.
Translational Relevance: Experiments conducted on eye blood vasculature reconstruction as a biomarker shows a strong correlation between vasculature shape and later stages of DR.
Keywords: Healthcare, Diabetic Retinopathy, Cardiovascular, Artificial Intelligence, Deep Learning, Semantic Segmentation, Fourier Theory.
1. Introduction
Diseases that primarily affect blood vessels, including diabetes and cardiovascular disease, are four of the top seven causes of death in the United States and have an increasing prevalence worldwide (Reports, 2017). An enhanced ability to diagnose these diseases and their stage and determine an individual’s propensity to develop or have progressive complications from these diseases would be of enormous benefit. Recent technological advances have allowed the development of clinical data acquisition and analysis to begin to fulfill this goal. Retinal vasculature provides a unique ability to examine blood vessels and can now be imaged non-invasively with efficient and effective devices in large populations. The benefits of telemedicine using these images to diagnose and determine the severity of diabetic retinopathy have been demonstrated to be as accurate as live examinations, if not more (Lin et al., 2002; Mansburger et al., 2015). The ability to incorporate this capability into a health system to improve patient outcomes has been shown in the English NHS Diabetic Eye Screening Program that has reported an 82.8% rate of diabetic retinopathy evaluation, over time resulting in diabetic retinopathy no longer being the leading cause of blindness and visual disability among working-class adults in the UK (Scanlon, 2017).
Artificial Intelligence and Deep Learning provide new technology to facilitate the ability to improve the sensitivity and specificity of the analysis of retinal images. We can use a deep convolutional neural network-based model to detect referable DR (Sayres et al., 2019). It has been shown that Deep Learning assistance can improve the accuracy of reader grading of retinal images for DR severity (Gulshan et al., 2016). Additionally, to further improve access, quality, and cost-effectiveness, artificial intelligence has been FDA cleared for autonomous diagnosis of more than mild diabetic retinopathy and diabetic macular edema using a single camera in patients without diabetic retinopathy. The pivotal FDA trial demonstrated a sensitivity of 87.2% and specificity of 90.7% (Abramoff et al., 2018).
Fundus photography, with the assessment of retinal vascular measurements, is useful in the evaluation of other vital diseases in addition to diabetes, including cardiovascular, cerebrovascular, and Alzheimer’s diseases. Retinal vascular caliber has been shown to correlate with diabetes complications: retinopathy, nephropathy, neuropathy, and cardiovascular risk (Ikram et al., 2017; Ho et al., 2017). The impact of including retinal parameters and biomarkers with traditional cardiovascular risk measures in a diabetic population showed a statistically significant improvement based on net re-classification improvement (Ho et al., 2017). This improved ability to assess cardiovascular risk has been demonstrated in an older population in (Wong et al., 2017). Given the similar embryological origins and structural characteristics of retinal and cerebrovascular vessels, it is not surprising to find associations between retinal signs and brain microvascular disease (Hanff et al., 2014). There is also evidence of an increased abnormality of several retinal vascular parameters in patients with Alzheimer’s Disease compared to matched controls (Cheung et al., 2014).
| Normal | Mild | Moderate | Severe | Proliferative | |
|---|---|---|---|---|---|
| Normal | 1436 | 55 | 6 | 0 | 0 |
| Mild | 14 | 448 | 260 | 2 | 0 |
| Moderate | 8 | 12 | 1652 | 252 | 56 |
| Severe | 0 | 2 | 19 | 1286 | 179 |
| Proliferative | 4 | 1 | 7 | 30 | 1259 |
In medical images, identifying candidate regions is of the highest importance since it provides intuitive illustrations for doctors and patients of how the diagnosis is inferred. Recently, advances in Deep Learning have dramatically improved the performance of disease detection. Most of these Deep Learning systems treat CNN as a kind of black box, lacking comprehensive explanation. Traditional ways of visual ”feature finding” are given through heat-map generation or sliding windows. In this report, we show that for retinal diseases, most of the visual features allowing AI recognition like vessel curvature, angles, etc. are topologically concentrated along the retinal vasculature.
2. Prior Work
Biomarkers are traditionally associated with lesions on the retina caused by the disease, such as Microaneurisms, Hemorrhages, Exudates, Macular Edema, and Neovascularization (Jenkins et al., 2015). Moreover, they are also related to typical risk factors for DR (HbA1c, blood pressure, total cholesterol, etc.). The absence or presence, type, and severity of retinal vessel lesions diagnosed by retinal photography are biomarkers of DR status and are commonly used in screening clinics and research (Thomas et al., 2015). Many methods from Image Processing and Deep Learning domains have been designed and implemented to automatically or semi-automatically detect the markers.
Retinal markers like the retinal arteriolar and venular caliber and their arterio-venous ratio (AVR) are of great importance. It has been found useful for early diagnosis of diseases such as hypertension, diabetes, stroke, other cardiovascular diseases in adults, and retinopathy of premature (Ikram et al., 2004). One calculates it as the ratio of average arteriolar diameter and average venous diameter of the vessels within one and two disk diameter circular rings from the optic disk center (Knudtson et al., 2003). So only a small but essential part of the vasculature is used.
Retinal vessel geometry comprises another group of retinal vessel-based biomarkers. It includes measures of vessel branching angles, branching complexity, tortuosity, length-to-diameter ratio, and fractals (Lim et al., 2017; Cheung et al., 2012). They have been used, among other things, to identify patterns summarizing the retinal vascular network in the elderly and to relate them to cardiovascular history (see Table 2 of (Arnould et al., 2018) for a full list of geometric biomarkers).
The extraction of retinal microvasculature with the help of Deep Learning, which dates back to 2015 (Soomro et al., 2019), has shown outstanding results and outperformed drastically the methods based on traditional image processing (Almotiri et al., 2018). This allows the segmentation of vessels to the extent of being able to characterize the whole vasculature as a biomarker encompassing, therefore, other biomarkers such as tortuosity, curvature, angles, etc.
3. Dataset
This study is performed utilizing the Intelligent Retinal Imaging Systems (IRIS, Pensacola, Florida) FDA-cleared, HIPPA compliant, commercial platform database. The IRIS software is a software-as-a-service (SaaS) application that is hosted on the Internet which gives clinicians the ability to scan a patient’s retina with a fundus camera, store the images in a cloud-based data-store, view the images and their associated information, and offer an opinion on the scans.
The dataset consisted of color digital fundus photography obtained in a non-Eye-Care Professional’s environment operated by staff with minimal training. The IRIS software solution is designed to be camera agnostic. For this study, a total of 6,988 graded CenterVue DRS camera (CenterVue SpA, Freemont, CA) were utilized. All images are monoscopic, and single images centered on the fovea. These 6,988 graded images represent a random sample from over 430,000 orders within the IRIS database.
The categorization of the images was performed using the Diabetic Retinopathy Severity Scale (DRSS) based on the International Classification of Diabetic Retinopathy (ICDR) criteria. Ground truth for each image was determined by the agreement of two experienced grading board-certified ophthalmologists. If there was disagreement among the two, a third ophthalmologist acted as an adjudicator. All images were evaluated in the standard color image as well as an IRIS proprietary image enhancement. We see from the confusion matrix presented in Table 1 that the main disagreements lie along the Mild/Moderate boundary.
Agreements between the clinicians were assessed by Cohen’s coefficient, whose equation is , where is the observed probability of agreement, and is the probability of chance agreement. The golden rule being the more significant the , the better is the agreement. The value of the confusion matrix is , which shows a pretty good agreement.

4. Methods
Due to the time-consuming and repetitious aspects of manual blood vessel segmentation, automatic segmentation of retinal vessels is necessary for making a computer diagnostic system for ophthalmic disorders. Automatic segmentation of the blood vessels in retinal images is important in detecting several eye diseases because, in some cases, they affect the vessel network itself.
4.1. Image Processing Segmentation
Several topological features of retinal vessels (e.g. diameter, length, branching angle, tortuosity, curvature) have diagnostic value(Estrada et al., 2015). They can be used in the follow-up of disease progression, treatment, and evaluation of various cardiovascular and eye-related diseases (e.g. diabetes, hypertension, arteriosclerosis, and neovascularization)(MacGillivray et al., 2014). The basic image segmentation is obtained by applying the following filters to the source image:
-
•
Gray-scale conversion of the color fundus image.
-
•
Standardization.
-
•
Contrast-limited adaptive histogram equalization (CLAHE).
-
•
Gamma adjustment.
However, due to the high variance in image quality and camera type, image processing segmentation software tends to deliver good to poor accurate vascular segmentation. In Figure 1, the middle row displays blood vessel networks segmented through image processing. As one can see, some images have almost no segmented vasculature. For around one-third of the dataset, images have partial or no segmentation due to image quality, intensity variation, lens artifacts, etc. This is the reason why we need a more accurate segmentation tool.


4.2. Semantic Segmentation
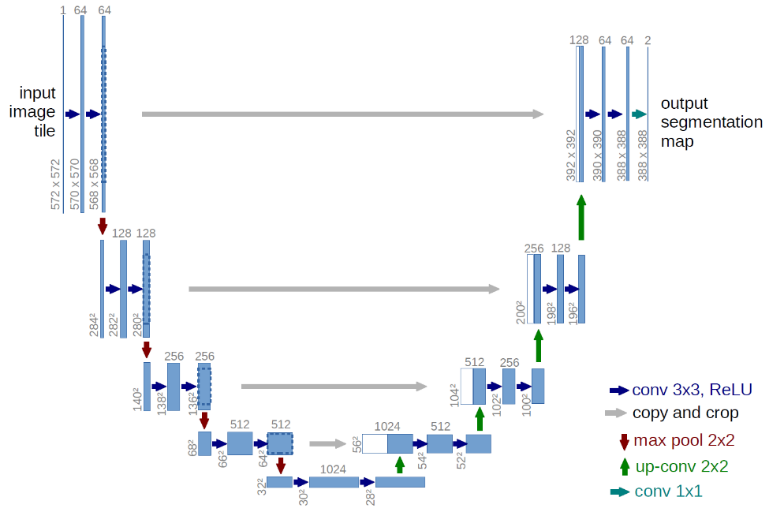
In recent years, Deep Learning has achieved great success in visual perception, and the semantic segmentation of images is one of the most successful cases. The overall architecture of the model we used is shown in Figure 2. Our model adopts a full convolutional neural network, which is commonly used in most semantic segmentation tasks. It can be briefly divided into two parts - encoder and decoder. The encoder is a convolutional neural network that extracts features from the input image, such as the retinal vasculature image. The decoder will up-sample the extracted features to the resulting image that we desired, such as the vessel segmentation in our case.
The neural network architecture is derived from the U-Net architecture (Ronneberger et al., 2015). The major advantage of this architecture is its ability to consider a wider context when predicting a pixel. This is facilitated by using the large number of channels used in the up-sampling operation.
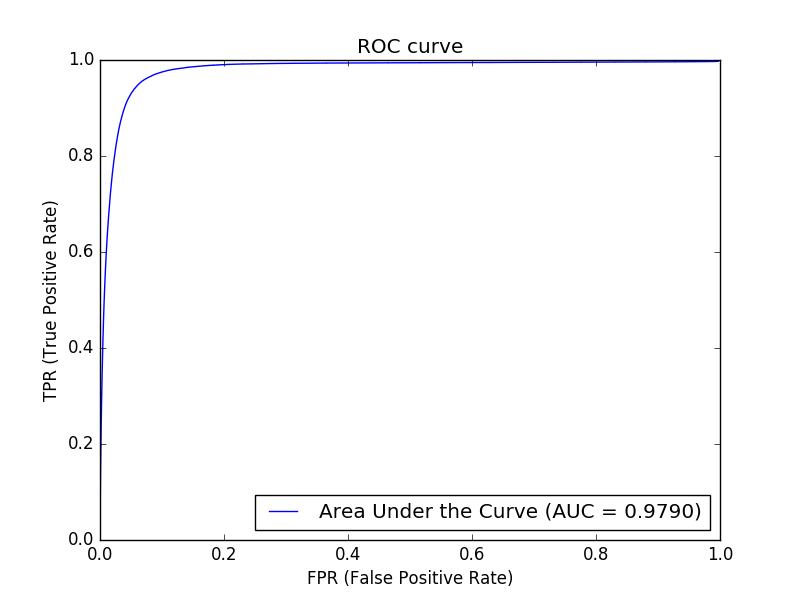
We apply cross-entropy for the loss function, and the stochastic gradient descent (SGD) is employed for back-propagation optimization. After each convolutional layer, the activation function is the Rectifier Linear Unit (ReLU). A dropout rate of 0.2 is used between two consecutive convolutional layers. Among the dataset, 150 images with correct image processed segmentation were chosen for training purposes. The training was performed over 50 epochs, with a mini-batch size of 16 patches. Performance obtained was measured by a 97.9% AUC (see Figure 8) on the 150 training images.
The experiments were run on a high-end GPU, the Tesla V100-PCIE, containing 2496 CUDA cores. After training, all 6,988 images in the dataset were processed to generate the vasculature images (see bottom row of Figure 1). Segmentation time took 1 hour and 49 minutes.
4.2.1. Vessel Reconstruction and Harmonic Descriptors
The microvasculature segmentation one obtains from Deep Learning has better coverage than image processing can yield, but it is far from being perfect. Noise reduction has to be provided, blobs and false-positive pixels have to be removed from the processed images. Furthermore, some vessel smoothing has to be applied to the generated segments. We based our smoothing method on Fourier Descriptors (Zahn and Roskies, 1972). We give a mathematical description of the theory in Appendix A.
Image Processing Steps
(1) Binarize vasculature image obtained by semantic segmentation. (2) Extract skeleton from binary image by thinning. (3) Build an abstract graph from the skeleton. (4) Remove noise from graph and apply vessel tracking over the entire vasculature. (5) Reconstruct each extended vessel in the graph by harmonic descriptors smoothing.
Harmonic Descriptor Smoothing
Harmonic descriptors have multiple advantages. For instance, knowing the harmonic descriptors of a given vessel, it is straightforward to compute its first and second derivatives, yielding the local curvature. A by-product, i.e. averaging the curvature over the entire vasculature, gives an estimation of the tortuosity of the vessel network. Likewise, the angle made by two incident vessels can be readily computed.


5. Experiments
As retinal blood vessels are the only deep vessels that can be observed in the human body, they could directly reflect the state of some cardiovascular diseases. They could also reflect the severity of DR (Fraz et al., 2012). We ran four experiments to test this assumption.
5.1. Severity Classification of Vasculature Images
To obtain a baseline measure, we run experiments against the corresponding reconstructed vasculature images without the out-of-vessels lesions (Scenario I). A technique called fine-tuning is used to make a pre-trained model adapt to a new dataset. We first train a model on a large dataset with millions of images. Then on the second step, we adjust the weights using the domain-specific dataset. Fine-tuning often benefits medical domains with relatively small datasets. At the same time, fine-tuning carries the accuracy advantage of deep learning. In our case, we used the pre-trained ResNet101 model (He et al., 2015). The training was performed over 50 epochs, with a mini-batch size of 8 images. Learning rate per mini-batch was with a regularization weight of . On a Tesla V100-PCIE, training time amounted to 56 minutes.
5.1.1. Scenario I-A
First dataset was Normal + Mild vs Moderate + Severe + Proliferative (No-Refer vs Refer) containing segmented retinal vasculature images only. Training dataset consists of 5,988 vasculature images, validation dataset of 1,000 vasculature images. Classification results are to be found in Figures 4 and 9(a).
5.1.2. Scenario I-B
Second dataset was Normal + Mild vs Severe + Proliferative (Non-Sight Threatening vs Sight Threatening) containing segmented retinal vasculature images only. Training dataset consists of 4,008 vasculature images, validation dataset of 1,000 vasculature images. Classification results are to be found in Figures 5 and 9(b).
5.2. Severity Classification of Full Retinal Images
To check if lesions can discriminate more than vasculature alone, we re-run same experimentes on the full images containing all potential lesions (Scenario II). We used the same training/validation datasets as in the above experiments.
5.2.1. Scenario II-A
5.2.2. Scenario II-B
Fourth dataset was Normal + Mild vs Severe + Proliferative (Non-Sight Threatening vs Sight Threatening) containing full retinal images only. Training dataset consists of 5,988 full images, validation dataset of 1,000 full images. Classification results are to be found in Figures 7, and 10(b).
| A | B | |
| Vascular Images | 93.8% | 96.7% |
| Full Images (Baseline) | 98.1% | 98.8% |
| Mean Vasculature Tortuosity | Observable - 2.86 Referable - 3.14 | Non-Sight Threatening - 2.86 Sight Threatening - 3.26 |
6. Results
For scenario A, we can say that 95.6% of the success rate can be explained by the blood vessel defects present in the microvasculature. In case of scenario B, 97.9% of the success rate can be attributed to the vasculature itself.
As everyone knows the low-level layers of a convolutional neural network match simple salient features such as lines (vertical, horizontal, and diagonal), corners, and contours (Zeiler and Fergus, 2013). Other intermediate level layers might, for instance, match curved lines and circles. Actually, in CNNs, each layer of nodes is trained on a distinct set of features based on the previous layer’s outcome. The deeper down into the neural network, the simpler the features the nodes can recognize, obviously because they aggregate and recombine features from the previous layer. As a matter of fact, related retinal vessel diseases tend to modify the morphological and topological structure of the vasculature by creating new vessels (neovascularization), increasing vessel curvature, widening branching angles, etc.
We make the hypothesis that the deep learning recognized geometric features are essential to help CNNs provide such good accuracy results. As shown by Cheung CY et. al. (Cheung et al., 2011), the retinal vascular tortuosity from retinal images may provide further information regarding effects of cardiovascular risk factors. From our experiments, the success rate for cardiovascular risk detection can be attributed to the success rate of vasculature itself due to the fact that tortuosity as overlay on the vasculature image brings a differential layer of information, with its delta being larger in B than in A (see Mean Vasculature Tortuosity row in Table 2).
7. Conclusion
There is a strong interest in the early detection of individuals with diabetes and hypertension. It is known that individuals with impaired glucose metabolism or diabetes have higher mortality from cardiovascular disease (Brunner et al., 2006). In a similar fashion, individuals with high to standard blood pressure or pre-hypertension are more likely to develop cardiovascular events (Hsia et al., 2007). The new tortuosity definition we explain in this paper can provide a high level of abstraction similar to what CNNs are offering and as such can help us better identify cardiovascular risks in patients.
References
- (1)
- Abramoff et al. (2018) M.D. Abramoff, P.T. Lavin, M. Birch, N. Shah, and J.C. Folk. 2018. Pivotal trial of an autonomous AI-based diagnostic system for detection of Diabetic Retinopathy in primary care offices. Digital Medicine (2018), 1–39.
- Almotiri et al. (2018) J. Almotiri, K. Elleithy, and A. Elleithy. 2018. Retinal Vessels Segmentation Techniques and Algorithms: A Survey. Appl. Sci. 8, 155 (2018), 1–31.
- Arnould et al. (2018) C. Arnould, L. Binquet, C. Guenancia, S. Alassane, R. Kawasaki, V. Daien, C. Tzourio, Y. Kawasaki, A. Bourredjem, A. Bron, and C. Creuzot-Garcher. 2018. Association between the retinal vascular network with Singapore ”I” Vessel Assessment (SIVA) software, cardiovascular history and risk factors in the elderly: The Montrachet study, population-based study. PLOS One 3 (April 2018), 1–14.
- Brunner et al. (2006) E. Brunner, M. Shipley, D. Witte, J. Fuller, and M. Marmot. 2006. Relation between blood glucose and coronary mortality over 33 years in the Whitehall Study. Diabetes Care 29 (2006), 26–31.
- Cheung et al. (2012) C.Y. Cheung, E. Lamoureux, M.K. Ikram, M.B. Sasongko, M. Epi, J. Ding, Y. Zheng, P. Mitchell, J.J. Wang, and T.Y. Wong. 2012. Retinal Vascular Geometry in Asian Persons with Diabetes and Retinopathy. Journal of Diabetes Science and Technology 6, 3 (2012).
- Cheung et al. (2011) Carol Yim-lui Cheung, Yingfeng Zheng, Wynne Hsu, Mong Li Lee, Qiangfeng Peter Lau, Paul Mitchell, Jie Jin Wang, Ronald Klein, and Tien Yin Wong. 2011. Retinal vascular tortuosity, blood pressure, and cardiovascular risk factors. Ophthalmology 118, 5 (2011), 812–818.
- Cheung et al. (2014) Y.L. Cheung, Y.T. Ong, M.K. Ikram, S.Y. Ong, X. Lia, S. Hilal, J.S. S.Catindig, N. Venketasubramanian, P. Yap, D. Seow, C.P. Chen, and T.Y. Wong. 2014. Microvascular network alterations in the retina of patients with Alzheimer’s disease. Alzheimer’s & Dementia 10 (2014), 135–142.
- Estrada et al. (2015) Rolando Estrada, Michael J Allingham, Priyatham S Mettu, Scott W Cousins, Carlo Tomasi, and Sina Farsiu. 2015. Retinal artery-vein classification via topology estimation. IEEE transactions on medical imaging 34, 12 (2015), 2518–2534.
- Fraz et al. (2012) M.M. Fraz, P. Remagnino, A. Hoppe, B. Uyyanonvara, A.R. Rudnicka, C.G. Owen, and S.A. Barman. 2012. Blood Vessel Segmentation Methodologies in Retinal Images: A Survey. pubmed (Oct. 2012).
- Frigo (1999) M. Frigo. 1999. A Fast Fourier Transform Compiler. Proceedings of the 1999 ACM SIGPLAN Conference on Programming Language Design and Implementation (1999).
- Gulshan et al. (2016) V. Gulshan, L. Peng, M. Coram, M.C. Stumpe, D. Wu, A. Narayanaswamy, S. Venugopalan, K. Widner, T. Madams, and J. Cuadros. 2016. Development and validation of a Deep Learning algorithm for detection of Diabetic Retinopathy in retinal fundus photographs. JAMA 316, 22 (2016), 2402–2410.
- Hanff et al. (2014) T.C. Hanff, A.R. Sharrett, T.H. Mosley, D. Shibata, D.S. Knopman, R. Klein, B.E.K. Klein, and R.F Gottesman. 2014. Retinal Microvascular Abnormalities Predict Progression of Brain Microvascular Disease: An ARIC MRI Study. Stroke 45, 4 (April 2014), 1012–1017.
- He et al. (2015) K. He, X. Zhang, S. Ren, and J. Sun. 2015. Deep Residual Learning for Image Recognition. CoRR abs/1512.03385 (2015). arXiv:1512.03385 http://arxiv.org/abs/1512.03385
- Ho et al. (2017) H. Ho, C.Y Cheung, C. Sabanayagam, W. Yip, M.K. Ikram, P.G. Ong, P. Mitchell, K.Y. Chow, C.Y. Cheng, E.S. Tai, and T.Y. Wong. 2017. Retinopathy signs improved prediction and reclassification of cardiovascular disease risk in diabetes: A prospective cohort study. Scientific Reports 7, 41492 (2017).
- Hsia et al. (2007) J. Hsia, K. Margolis, C. Eaton, N. Wenger, M. Allison, L. Wu, and H. Black. 2007. Prehypertension and cardiovascular disease risk in the Women’s Health Initiative. Circulation 115 (2007), 855–860.
- Ikram et al. (2004) M.K. Ikram, F.J. de Jong, J.R. Vingerling, J.C. Witteman, A. Hofman, and M.M. Breteler. 2004. Are retinal arteriolar or venular diameters associated with markers for cardiovascular disorders? The Rotterdam Study. Invest Ophthalmol Vis Sci 45 (2004), 2129–2134.
- Ikram et al. (2017) N.K. Ikram, C.Y. Cheung, M. Lorenzi, R. Klein, T.L.Z Jones, and T.Y. Wong. 2017. Retinal vascular caliber as a biomarker for diabetes microvascular complications. Diabetes Care 36 (2017), 750–759.
- Jenkins et al. (2015) A.J. Jenkins, M.V. Joglekar, A.A. Hardikar, A.C. Keech, D.N O’Neal, and A.S. Januszewski. 2015. Biomarkers in Diabetic Retinopathy. The Review of Diabetic Studies 12 (2015), 159–195.
- Knudtson et al. (2003) M.D. Knudtson, K.E. Lee, L.D. Hubbard, T.Y. Wong, R. Klein, and B.E. Klein. 2003. Revised formulas for summarizing retinal vessel diameters. Curr Eye Res. 27 (2003), 143–149.
- Lim et al. (2017) L.S. Lim, M.L. Chee, C.Y. Cheung, and T.Y. Wong. 2017. Retinal Vessel Geometry and the Incidence and Progression of Diabetic Retinopathy. Investigative Ophthalmology & Visual Science 58, 6 (2017), 200–205.
- Lin et al. (2002) D.Y. Lin, M.S. Blumencranz, R.J. Brothers, and D.M. Grosvenor. 2002. The Sensitivity and Specificity of Single-field Nonmydriatic Monochromatic Digital Fundus Photography With Remote Image Interpretation for Diabetic Retinopathy Screening: A Comparison With Ophthalmoscopy and Standardized Mydriatic Color Photography. Am J Ophthalmol. 134, 2 (2002), 204–213.
- MacGillivray et al. (2014) TJ MacGillivray, Emanuele Trucco, JR Cameron, Baljean Dhillon, JG Houston, and EJR Van Beek. 2014. Retinal imaging as a source of biomarkers for diagnosis, characterization and prognosis of chronic illness or long-term conditions. The British journal of radiology 87, 1040 (2014), 20130832.
- Mansburger et al. (2015) S.L. Mansburger, C. Sheppler, S.K. Barker, S.K. Gardiner, S. Demirel, K. Wooten, and T. Becker. 2015. Long-term Comparative Effectiveness of Telemedicine in Providing Diabetic Retinopathy Screening Examinations A Randomized Clinical Trial. JAMA Ophthalmol. 133, 5 (2015), 518–525.
- Reports (2017) National Vital Statistics Reports. 2017. . Technical Report 66. https://www.cdc.gov/nchs/data/nvsr/nvsr66/nvsr66_06.pdf
- Ronneberger et al. (2015) O. Ronneberger, P. Fischer, and T. Brox. 2015. U-Net: Convolutional Networks for Biomedical Image Segmentation. arXiv (May 2015).
- Sayres et al. (2019) R. Sayres, A. Taly, E. Rahimy, K. Blumer, D. Coz, N. Hammel, J. Krause, and A. Narayanaswamy. 2019. Using a Deep Learning algorithm and integrated gradients explanation to assist grading for Diabetic Retinophathy. Ophthalmology 126, 4 (April 2019), 552–564.
- Scanlon (2017) P.H. Scanlon. 2017. The English National Screening Programme for Diabetic Retinopathy. Acta Diabetol 54 (2017), 515–525.
- Soomro et al. (2019) T.A. Soomro, A.J. Afifi, L. Zheng, S. Soomro, J. Gao, O. Hellwich, and M. Paul. 2019. Deep Learning Models for Retinal Blood Vessels Segmentation: A Review. IEEE Access 7 (2019), 71696–71717.
- Thomas et al. (2015) R.L. Thomas, F.D. Dunstan, S.D. Luzio, S.R. Chowdhury, R.V. North, S.L. Hale, R.L. Gibbins, and D.R. Owens. 2015. Prevalence of Diabetic Retinopathy within a national Diabetic Retinopathy screening service. Br J Ophthalmology 99, 1 (2015), 64–68.
- Wong et al. (2017) T.Y. Wong, A. Kamineni, R. Klein, A.R. Sharrett, B.E. Klein, D.S. Siscovick, M. Cushman, and B.B. Duncan. 2017. Quantitative Retinal Venular Caliber and Risk of Cardiovascular Disease in Older Persons. Arch Int Med. 166, 21 (2017), 2388–2394.
- Zahn and Roskies (1972) C.T. Zahn and R.Z. Roskies. 1972. Fourier descriptors for plane closed curves. IEEE Trans. Comput. 100, 3 (March 1972), 269–281.
- Zeiler and Fergus (2013) M.D. Zeiler and R. Fergus. 2013. Visualizing and Understanding Convolutional Networks. CoRR abs/1311.2901 (2013). arXiv:1311.2901 http://arxiv.org/abs/1311.2901
Appendix A Appendix I - Harmonic Descriptors
Consider a periodic signal with period . The period being , we will take the fundamental frequency to be . We may represent any such function (with some very minor restrictions) using a Fourier series. There are two common representations of Fourier series, “Trigonometric” and “Exponential”. For easy reference the two forms are
| (1) | (Trigonometric) | |||||
The coefficients and are related by the following equations111 is the complex conjugate operator.
| (2) | |||
| (3) |
for with , and , , and . A leaner representation of the Fourier Series using complex exponential ends up with the following
A.1. Vessel Transformation
Let be a discrete curve that can be reduced to a discrete function after a rotation and a translation . Its coordinates can be then viewed as the sampling values
of a continuous curve such that can be extended continuously to a -periodic function. When the function is expanded into a Fourier series, a fixed number of discrete Fourier coefficients approximately represents the curve. Hence, among other interesting properties, allowing for data reduction. For the rest of the paper let us assume that we are dealing with periodic smooth functions having as their fundamental period .
A.2. Harmonic Descriptors
When identifying the two-dimensional plane with the complex plane , a curve may be approximated by a sequence of complex numbers having the discrete Fourier expansion :
with discrete Fourier coefficients
When the coefficients are interpreted as numerical approximations of the Fourier coefficients of the continuous curve
then the connection between and is given by
A.3. Derivative’s Energy
It is known from Parseval’s identity that the formula represents the total energy of the waveform over . In the above, all Harmonic Descriptors have the same contribution to the total, namely 1. Since we derive instead a weighted version of the energy , noted , by the formula
| (4) |
where is the scaling factor used for transforming the vessel over . Notice that the DC component makes no contribution whatsoever to the value of , obviously a corollary of the HD translation invariance principle. If is integrable over the infinite series converges since it’s then a positive increasing series bounded by .
A.4. Tortuosity
Tortuosity is the result of an accumulation of curvature along a blood vessel length and vessel tortuosity augmentation is a first class manifestation of the changes in vessel morphology. It could be caused by several diseases like high blood pressure, angiogenesis, or blood vessel congestion.
A.4.1. Definition
Definition A.1 (Tortuosity).
Let defined on . The tortuosity of is defined as
| (5) |
Tortuosity definition involves also second derivatives since
| (6) |
In (6), notice how low-frequencies matter more than high-frequencies.
It can be said that tortuosity is a global Fourier expression of the curvature of a vessel. For the sake of the reader’s curiosity, Table 3 gives a list of the tortuosity value for quite a few simple functions.
As the spatial domain contents rotates the frequency domain contents we may deduce that tortuosity is rotation invariant. Geometrically, rotation in the frequency domain is equivalent to multiply each HD by a common factor , where is the specified angle of rotation. Hence since . In summary,
A.4.2. Properties
-
•
Translation: Tortuosity is translation invariant.
-
•
Rotation: Tortuosity is rotation invariant.
-
•
Scaling: Tortuosity is a quadratic function of the scaling factor.
A.5. Tortuosity of Some Common Curves
| Curve Type | Definition | Tortuosity | Value |
|---|---|---|---|
| Trigonometric | 2 ( | ||
| Inverse Trig. | |||
| Paraboloid | |||
| Hyperboloid | |||
| Elliptical Arc222Here and with . | |||
| Gaussian |
See Table 3. The inverse trigonometric function almost being a straight line on it’s natural that its tortuosity value is near zero.
A.6. Tortuosity of the Union of Two Vessels
Theorem A.2 (Tortuosity of the Union of Two Vessels).
Let , , , and defined as above. The tortuosity of the union of and is equal to
| (7) |
As a special case, if then (7) reduces to
| (8) |
Appendix B Appendix II - ROC Curves