Resolving the Binary Components of the Outbursting Protostar HBC 494 with ALMA
Abstract
Episodic accretion is a low-mass pre-main sequence phenomenon characterized by sudden outbursts of enhanced accretion. These objects are classified into two: protostars with elevated levels of accretion that lasts for decades or more, called FUors, and protostars with shorter and repetitive bursts, called EXors. HBC 494 is a FUor object embedded in the Orion Molecular Cloud. Earlier Atacama Large (sub-)Millimeter Array (ALMA) continuum observations showed an asymmetry in the disk at 02 resolution. Here, we present follow-up observations at 003, resolving the system into two components: HBC 494 N (primary) and HBC 494 S (secondary). No circumbinary disk was detected. Both disks are resolved with a projected separation of (75 au). Their projected dimensions are 841.8 66.91.5 mas for HBC 494 N and 64.62.5 46.01.9 mas for HBC 494 S. The disks are almost aligned and with similar inclinations. The observations show that the primary is 5 times brighter/more massive and 2 times bigger than the secondary. We notice that the northern component has a similar mass to the FUors, while the southern has to EXors. The HBC 494 disks show individual sizes that are smaller than single eruptive YSOs. In this work, we also report 12CO, 13CO, and C18O molecular line observations. At large scale, the 12CO emission shows bipolar outflows, while the 13CO and C18O maps show a rotating and infalling envelope around the system. At a smaller scale, the 12CO and 13CO moment zero maps show cavities within the continuum disks’ area, which may indicate continuum over-subtraction or slow-moving jets and chemical destruction along the line-of-sight.
keywords:
stars: protostars – protoplanetary disks – radio continuum: planetary systems – accretion, accretion disks – radio lines: planetary systems – ISM: jets and outflows1 Introduction
During their evolution, young stellar objects (YSOs) dissipate their envelopes while feeding their developing protostars through accretion via a disk. However, YSOs are underluminous compared to the luminosity and accretion rates expected from steady disk accretion. This discrepancy has been established as the “luminosity problem" (Kenyon et al., 1990; Evans et al., 2009). One potential solution to the luminosity problem is that young stars undergo episodes of high accretion interspersed by quiescent phases. During the episodes of enhanced accretion, large amounts of material are accreted very quickly (e.g., Dunham & Vorobyov, 2012). Such phenomena have been observed in low-mass pre-main sequence stars like FU Orionis and EX Lupi, the prototypes of the two subclasses that display the episodic accretion phenomenon.
FU Orionis type stars, a.k.a. FUors, are pre-main sequence low-mass stars that show variability in both luminosity and spectral type due to variation in the accretion mass rate, on a short timescale (Herbig, 1966). Their optical brightness can dramatically increase due to enhanced mass accretion by more than five magnitudes over a few months. After this “outburst”, FUors can remain in this active state for decades. This occurrence is considered episodic and suspected to be common at the early stages of star formation. Throughout an outburst, the star can accrete 0.01 M⊙ of material, roughly the mass of a typical T-Tauri disk (Andrews & Williams, 2005). The bolometric luminosity of the FUors during the outburst is 100–300 and the accretion rate is between and M⊙ yr-1 (Audard et al., 2014). EX Lupi type stars, a.k.a. EXors, are a scaled-down version of the FUors, with shorter and less intense outbursts (Herbig, 2007). The EXors enhanced accretion stage can last months to years, with accretion rates ranging from 10-7 to 10-6 M⊙ yr-1, which are the order up to 5 magnitudes brighter than quiescent periods. The episodic recurrence is also on the order of years (e.g., Jurdana-Šepić et al., 2018; Giannini et al., 2022).
The mechanisms producing the eruptions in systems like FUors and EXors have yet to be understood (Cieza et al., 2018). Several different triggers have been proposed to explain this phenomenon, such as disk fragmentation (Vorobyov & Basu, 2005, 2015; Zhu et al., 2012), coupling of gravitational and magneto-rotational instability (MRI) (Armitage et al., 2001; Zhu et al., 2009), and tidal interaction between the disk and a companion (Bonnell & Bastien, 1992; Lodato & Clarke, 2004; Borchert et al., 2022b). In terms of evolution, a scenario where FUors are understood as an earlier phase followed by an EXor phase could explain some of the observed properties of these systems (Cieza et al., 2018). EXors have less prominent (or lack of) outflows, and smaller masses/luminosities than FUors since the mass loss, accretion, and outbursts will significantly remove the gas and dust material during their evolutionary stages.
If most stars undergo FUor/EXor-like episodic accretions during their evolution, imaging the circumstellar disks of FUors at sub-mm/mm wavelengths can inform or constrain the underlying outburst mechanisms. For class 0/I objects (e.g., those still accreting from their circumstellar disks and envelopes), the massive disk could be expected to be prone to be gravitationally unstable, which can, consequently, trigger the MRI and/or disk fragmentation. Additionally, close encounters of stars can shape both gas and dust disk morphology (Cuello et al., 2019). Inferring which scenario plays in each disk requests an analysis that strongly depends on how well-resolved and which features one can extract from the observations. Consequently, when eruptive disks give a hint of irregular morphology or kinematics, follow-up observations at higher resolution are needed to resolve the substructures and infer the nature of the system.
HBC 494 is a Class I protostar, located in the Orion molecular cloud at a distance of 4147 pc (Menten et al., 2007), and has been classified as a FUor111The FU Ori classification is still controversial and has been contested by Connelley & Reipurth (2018).. This young eruptive object (also called Reipurth 50) was discovered during an optical survey and described as a bright, conical, and large nebula reflecting light from a 1.5 arcmin away from a 250 L infrared source. Both were located at the southern part of the L1641 cloud in Orion (Reipurth, 1985; Reipurth & Bally, 1986). This nebula was claimed to appear after 1955, and its first detailed study showed high variability between 1982 and 1985, a consequence of a primordial IR source variability. Posterior studies have also confirmed its variability. For example, Chiang et al. (2015) reported a dramatic brightening (thus clearing of part of the nebula) that occurred between 2006 and 2014. These events can be explained by an episode of outflow coming from HBC 494. More recently, Postel et al. (2019), using archival photometry data along with Herschel and Spitzer spectra presented the detection of several molecular lines and the spectral energy distribution (SED) of HBC 494. The SED presented strong continuum emission in the mid and far-infrared, which is indicative of envelope emission. Such violent outflows were observed and described in Ruíz-Rodríguez et al. (2017).
ALMA Cycle-2 observations in the millimeter continuum (025 angular resolution) show that the disk is elongated with an apparent asymmetry (Cieza et al., 2018), indicating the presence of an unresolved structure or a secondary disk. In this work, we present ALMA Cycle 4 observations at 003 angular resolution that reveal the binary nature of the HBC 494 system. Only Cycle 4 data were used in this work. The paper is structured as follows. The ALMA observations and data reduction are described in section 2. The results from the continuum and line analysis are described in section 3. The discussion is presented in section 4, while we conclude with a summary of our results in section 5.
2 Observations and data reduction
HBC 494 has been observed during the ALMA Cycle-4 in band 6 (program 2016.1.00630.S: PI Zurlo) for two nights, one on the 9th October 2016 and the other on the 26th September 2017 (see table 1). On the first night, the short baseline configuration was acquired, with a precipitable water vapor of 0.42 mm. The ALMA configuration of antennas was composed of 40 12-m antennas with a baseline from 19 to 3144 m. The flux calibrator and bandpass calibrator were both J0522-3627, and the phase calibrator was J0607-0834. The total integration on the target was 8.39 min. The second night, the long baseline dataset, had precipitable water vapor of 1.08 mm. The ALMA configuration consisted of 40 12-m antennas with a baseline from 42 m to 14851 m. The flux calibrator was J0423-0120, the bandpass calibrator was J0510+1800, and the phase calibrator was J0541-0541. The total integration on the target was 25.55 min.
| PI | Proj. ID | Ang. Res. | Date of obs. | Integration | |
|---|---|---|---|---|---|
| (beam minor axis) | |||||
| Zurlo | 2016.1.00630.S | 0142 | 09/10/2016 | 8.39 min | |
| Zurlo | 2016.1.00630.S | 0027 | 26/09/2017 | 25.55 min |
The central frequencies of each spectral window were: 230.543 (to cover the transition 12CO J=2-1), 233.010 (continuum), 220.403 (13CO J=2-1), 219.565 (C18O J=2-1), and 218.010 (continuum) GHz. The minimum spectral resolution achieved (second night) for 12CO was 15.259 kHz ( 0.02 km/s), while for 13CO and C18CO, it was 30.518 kHz ( 0.04 km/s). Both continuum bands presented 2 GHz bandwidths. The data were calibrated with the Common Astronomy Software Applications package (CASA v.5.5, McMullin et al., 2007), and the python modules from CASA API, casatasks and casatools (CASA Team et al., 2022). The standard calibrations include water vapor calibration, temperature correction, and phase, amplitude, and bandpass calibrations.
2.1 Continuum imaging
We started our analysis by fixing the visibilities’ phase center on J2000 05h40m27.448s -07d27m29.65s. The image synthesis of the 1.3 mm continuum emission was performed with the tclean task of CASA. For the high-resolution data, we used the Briggs weighting scheme with a robust parameter of 0.5, resulting in a synthesized beam size of 41.2 29.8 mas, and a position angle of 40.6. The pixel scale of the image was set to 1.5 mas. One iteration step of self-calibration was applied to both observations. For the first night (low-resolution image: 142 mas), it resulted in an improvement of 6 SNR. For the second night (high-resolution image: 27 mas), it resulted in an SNR improvement of 1.6.
Our final continuum image was produced from a concatenated measurement set combining both, the short and the long baseline visibilities, using the concat task of CASA. We used the same image synthesis parameters used for the second night of observation.
2.2 Line imaging
The visibilities were fixed at the same phase center as was done for the continuum coordinates (see subsection 2.1). After producing a dirty image from the visibilities, we noticed that the emission mimicked the presence of gaseous envelopes around the disks (moment 0 maps, see Figure 1, left column) but no gas dynamic signatures were revealed (moment 1 map, see Figure 1, right column). Therefore, we proceeded to remove the visibility’s continuum contributions by using the CASA task uvcontsub.

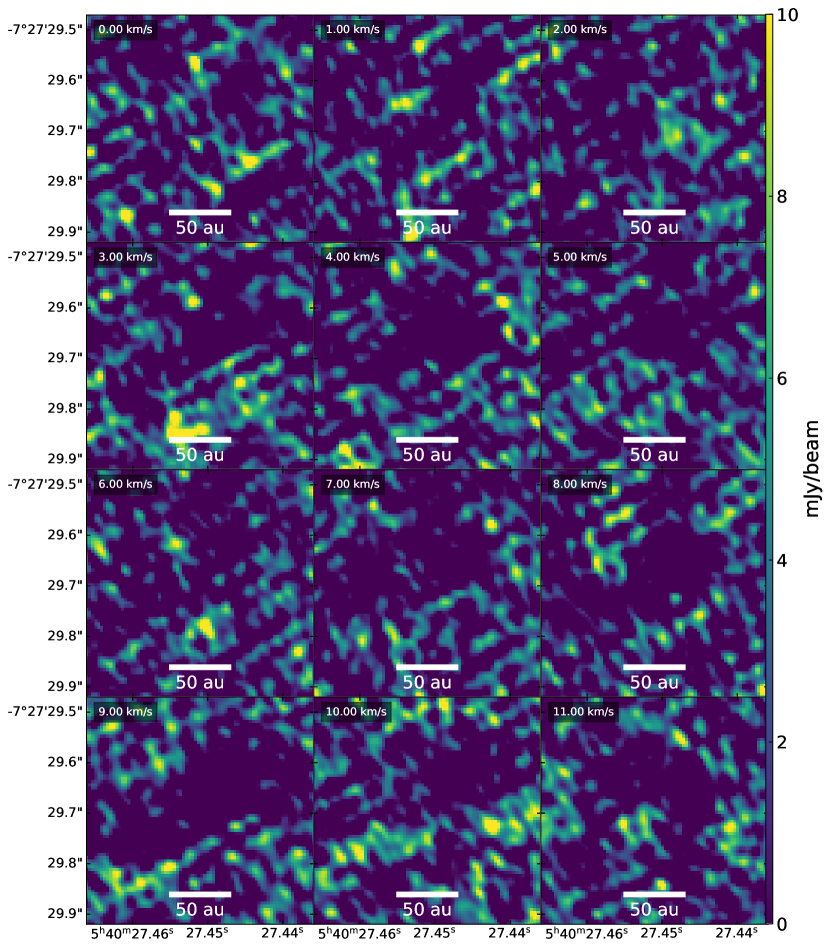
Next, we performed the tclean process using Briggs weighting with a robust parameter of 0.5, Hogbom deconvolver, and pixel scale of 6 mas. The total velocity ranged between -6 km/s to 18 km/s, although a smaller range (0 km/s to 11 km/s) was used to create the 13CO and C18O moment maps. We used spectral resolution widths of 1 km/s for 12CO and of 0.3 km/s for 13CO and C18O. The rms values, obtained for the channel without a clear signal on the channel maps (4 km/s), were 1.9, 3.6, and 2.6 mJy/beam for 12CO, 13CO and C18O, respectively.
3 Results
3.1 Continuum analysis
With the high-resolution data shown in Figure 2, we could reveal the binary nature of the HBC 494 system. Each of the components in HBC 494 is surrounded by continuum emission, most likely associated with circumstellar disks.

We performed a 2D Gaussian fitting with the imfit tool of CASA in order to characterize the newly resolved components. The projected separation between the two sources is 018 (75 au). We name each component with the usual convention, i.e. “N” and “S” components, referring to the northern and the southern source, respectively. We assume the northern component to be the primary as it is five times brighter than the southern (secondary) disk. Both individual disks are resolved according to our Gaussian fit. For the primary component, we find a major axis FWHM of 84.00 1.82 mas and a minor axis of 66.94 1.50 mas (34.8 0.7 27.8 0.6 au), with a position angle of 70.01 4.46 deg (values deconvolved from the beam). For the secondary, the major axis FWHM is 64.60 2.49 mas and the minor axis FWHM is 45.96 1.89 mas (26.7 1.0 19.9 0.8 au), and the position angle is 65.38 5.32 deg. The integrated fluxes for “N” and “S” are 105.17 1.89 mJy and 21.06 0.63 mJy, respectively. The peak fluxes are 22.96 0.35 mJy/beam and 8.71 0.21 mJy/beam for the primary and secondary sources, respectively. The rms is 0.034 mJy/beam, as observed in a circular region with a radius of 225 mas without emission. The inclinations are calculated using the aspect ratios of the disks. These are assumed as projected circular disks when face-on, thus elliptical when inclined:
,
where “b" and “a" are the semi-minor and semi-major axes, respectively. It resulted in 37.16 2.36 degrees inclination for HBC 494 N and 44.65 3.27 for HBC 494 S. At 30 mas resolution, no substructures were detected (see the radial profiles in Figure 3).

A large fraction of the mm-sized grains in protoplanetary disks resides in the midplane. They are usually optically thin to their own radiation. Thus, assuming standard disks, we can use the observed fluxes to estimate the dust masses of HBC 494 N and S. For that, we use the following formula (as in Beckwith et al., 1990; Andrews & Williams, 2005; Cieza et al., 2018):
| (1) |
where is the observed flux, d is the distance to the source, is the Planck function and is the dust opacity. Adopting the distance of 414 pc, isothermal dust temperature ( = 20 K) and dust opacity assuming a fraction of 100, ( = 10 ( 1012Hz) cm2 g-1; Beckwith et al. 1990) we get dust masses of 1.43 (HBC 494 N) and 0.29 (HBC 494 S). Following the standard gas-to-dust mass ratio of 100, we report disk gas masses estimations of 143.46 for HBC 494 N, and 28.68 for HBC 494 S. The physical parameters based on the CASA analysis are listed in Table 2.
| HBC 494 N | HBC 494 S | |
|---|---|---|
| Flux density (mJy) | 105.2 1.9 | 21.1 0.6 |
| Peak flux (mJy / beam) | 23.0 0.4 | 8.7 0.2 |
| Major axis (mas) | 84.0 1.8 | 64.6 2.5 |
| Minor axis (mas) | 66.9 1.5 | 46.0 1.9 |
| Major axis (au) | 34.8 0.7 | 26.7 1.0 |
| Minor axis (au) | 27.8 0.6 | 19.9 0.8 |
| Position angle (deg) | 70.0 4.5 | 65.4 5.3 |
| Beam major axis (mas) | 41.2 | 41.2 |
| Beam minor axis (mas) | 29.8 | 29.8 |
| Beam Position angle (deg) | 40.6 | 40.6 |
| Beam area (sr) | 3.3e-14 | 3.3e-14 |
| rms (Jy / beam) | 34.0 | 34.0 |
| Dust mass | 1.4 | 0.3 |
| Gas mass | 143.5 | 28.7 |
| Inclination (deg) | 37.22.4 | 44.73.3 |
| FWHM Radius (au) | 34.80.7 | 26.71.0 |
3.2 Line analysis
The next two subsections describe the large and small-scale structure analyses. The large scale, using the extent of 8000 au, shows the results of outflows and envelopes. At such a scale, there is not enough resolution to display both disks’ dynamics and their possible interactions. The small scale (150 au) fulfills this role, and thus, both gas scenarios must be taken into account.
3.2.1 Large-scale structures (8000 au)

The channel maps (Figures 4, 13 and 14) show southern and northern 12CO wide-angle arcs () and no clear signal of large structures from the other molecular lines. This bipolar outflow was previously described in Ruíz-Rodríguez et al. (2017). The wide angular structure shows an outflow morphology expected for Class I disks (Arce & Sargent, 2006). In our observations, the southern and northern arcs are defined by the velocity ranges of [-6 km/s to 1 km/s] and [5 km/s to 18 km/s], respectively. The moment 0 and 1 12CO arcs are shown in Figure 5. However, it is noticeable that the northern arc (redshifted emission) dominates the displayed velocities. The lack of signal in the southern arc can be explained by lower molecular density, or due to intracloud absorption. Figure 6 shows the three molecular lines’ concentration and dynamics (moment 0 and 1 maps), as well as the spectral profile measured within the dashed regions.

The 13CO emission traces the rotating, infalling, and expanding envelope surrounding the system, showing a small deviation from the 12CO outflowing arcs’ rotation axis. The blue-shifted emission concentrates around 3 km/s, while the red-shifted emission is around 5 km/s. It is noticeable that the 13CO emission has a rotation axis almost perpendicular to the 12CO outflows axis, ensuring that the physical processes behind the two are different. The spectral 13CO also shows a dip around 4 km/s, but this may not trace an absorption but a lack of signal due to the analyzed uv-coverage or cloud contamination.
The C18O emission, however, is faint and hardly distinguishable from the surrounding gas in moment 0 maps. It has also the lowest abundance of the three analyzed isotopologues, being a good tracer of the higher gas densities in the innermost regions of the cloud. Its velocity maps show that a faint blueshifted motion was detected around 3 km/s, very weak when compared to the redshifted emission detected principally around 5 km/s. Due to the higher concentration of gas in the northern part, it is reasonable that we observed a weak gas counterpart in the southern region. At large-scale, our results are comparable with the ones presented in (Ruíz-Rodríguez et al., 2017). Furthermore, a lower limit of the envelope material of 600 Jy.km/s towards HBC 494 could be traced using Total Power (TP), ALMA compact array (ACA), and the main array ALMA observations with C18O data in the range of 4.30.5 km s-1 (Ruíz-Rodríguez private communication).

3.2.2 Small scale structures (150 au resolution)
We started by removing the continuum contribution from all molecular lines observed (12CO, 13CO, C18O). We already expected that 12CO would trace the gas in larger scales due to its optical depth and, thus, could blend with smaller gas signatures. To avoid cloud contamination during the creation of 12CO small-scale moment maps, we removed the channels that were more affected. We considered velocities in the range of -6 km/s to 1 km/s, and from 5 km/s to 18 km/s, as similarly done for the different large-scale arcs described in the previous subsection.
Following, CO channel maps and moment 0 and 1 maps were produced to explore potential hints of interaction between the stars and the two circumstellar disks. In particular, we looked for disk substructures and perturbed rotation patterns. The moment maps can indeed provide valuable information about the binary orbit and the disks’ geometry. However, by looking at the molecular lines in this scale (see the moment maps in Figure 7, left and middle columns), we could not clearly detect the presence of the disks or their rotational signatures. We can only notice that the 12CO and 13CO moment 0 maps show an interesting pattern, where less gas emission is found where the continuum disks are. Additionally, the area within the continuum disks highlights regions similar to cavities or “holes" (Figure 7, left column, upper and middle row). Interestingly, Ruíz-Rodríguez et al. (2022) observed similar features from the same molecular lines, in addition to HCO+, for another FUor system, V883 Ori. The work also showed that the origin of cavities and ring emission around disks can be interpreted in two ways, one based on gas removal and the other on optical depth effects.
If the signal traces the lack of gas surrounding the disks, the leading mechanism may be slow-moving outflows. The central regions of young continuum disks are expected to be constantly carved by the influence of magneto-hydrodynamical jets (Frank et al., 2014). In addition, it is also expected that the lower emission observed comes from the chemical destruction by high-energy radiation (more active disks will create bigger cavities). By looking at the size of the gaps, we can observe that HBC 494 S exerts a smaller influence on the gas than HBC 494 N and, thus, HBC 494 N is the more active disk in the system if this hypothesis is correct.
Another interpretation of the negatives in our gas maps is that this is a spurious result of continuum subtraction. Usually, the continuum emission is inferred from channels devoid of gas line emission. The usual procedure does not consider the line emission where these channels overlap. Suppose the emission lines are optically thick above the continuum. In that case, the foreground gas can significantly absorb the photons coming from the underlying continuum, which may lead to a continuum overestimation. Consequently, in such cases, the continuum may be over-subtracted, causing the “hole" feature that is stronger where the line peaks (see e.g., Boehler et al., 2017; Weaver et al., 2018).

4 Discussion
4.1 Multiplicity and triggering mechanisms
Besides HBC 494, there are 25 known FUor objects within 1 kpc (Audard et al., 2014). As previously commented, many triggering mechanisms can cause episodic accretion events. From this sample, only HBC 494 and a few other FUor systems are known binaries (e.g., FU Orionis, L1551 IRS, RNO 1B/C, AR 6A/B; Pueyo et al., 2012 and references therein).
Given the high occurrence rate of stellar binaries harboring disks, the lack of detection of multiple YSO systems remains a case of investigation. Additionally, young disks evolve in crowded star-forming regions, enhancing the hypothesis that the outbursts of Class 0/I disks may affect other disks, driving episodic accretion events. Also, surveys and studies using ALMA and NIR data for Class I-III disks, show that there is a lack of detection when only visual multiple systems (separations of 20-4800 au) are considered (e.g., Zurlo et al., 2020a, 2021). When all the possible separations are taken into account, the multiplicity frequencies considerably increase. For Taurus, for example, it goes up to 70% when spectroscopic binaries are included (Kraus et al., 2011). In the case of Orion, 30% of the systems are multiple with separations between 20 and, 10000 au (Tobin et al., 2022). The latter study also noticed that the separations decrease with time (when comparing Class 0, I, and flat-spectrum disks) and that the multiplicity frequency in Class 0 is higher than in the later evolutionary stages. Therefore, multiple eruptive young systems must be common, and more detectable within evolutionary time. They probably are not frequently detected due to the short time duration of enhanced accretion events in comparison with the lifetime of disks in class 0/I stages (see Audard et al. 2014 for a FUors review). Still, it is not clear if disks belonging to close-separation systems are more susceptible to eruptive events than isolated ones.
For each HBC 494 disk, no clue of trigger mechanisms was found, since the gas and continuum data did not reveal clear spiral or clumpy features indicating a case of infall or GI (see e.g., Zhu et al., 2012; Kratter & Lodato, 2016). Looking at the dust continuum (Figure 2), CO isotopologues moment maps (Figure 7), and the scattered 12CO emission (Figure 12 of Ruíz-Rodríguez et al. 2017), the hypothesis of stellar flybys is also not encouraged since no trace of perturbation was detected (Cuello et al. 2020, 2023). Moreover, dynamical data (small-scale moment 1 maps) also can provide clues for the triggering mechanism (Vorobyov et al., 2021). However, it requires clear detection of quasi-keplerian rotation, which was not observed.
In the case of binaries, the first component to ignite the FUor outbursts can quickly trigger the secondary one by inducing perturbations and mutual gravitational interactions (Bonnell & Bastien, 1992; Reipurth & Aspin, 2004; Vorobyov et al., 2021; Borchert et al., 2022a, c). Therefore, we can assume that all the disks in FUor multiple systems like HBC 494 might have undergone successive enhanced eruptive stages, despite the differences in mass and radius between each component. However, it is not clear how the outbursts in HBC 494 N and HBC 494 S affect each other since the moment maps do not show the connection between disks. Although, on larger scales, we detected the difference in the amount of gas mass detected in the northern regions compared to the southern. This scenario may be described if the more massive disk (i.e. HBC 494 N) has a higher contribution to the outbursts and winds.
With astrometric data, the eccentricity of orbits can be determined. If both disks are still accreting gas from the environment, it is expected that quasi-circular orbits trigger enhanced accretion every few binary periods. Eccentric orbits, on the other hand, can induce eruptive events in every orbit, preferentially when the binaries reach the pericentre (see e.g. Dunhill et al., 2015; Lai & Muñoz, 2022). Observational evidence of circumbinary disks in different YSO stages was found (see e.g. Dutrey et al., 1994; Mathieu et al., 1997; Tobin et al., 2016a; Maureira et al., 2020) and are seen as a common counterpart of young binaries in formation. However, no HBC 494 circumbinary gas disk was observed due to cloud contamination and optical depth effects.
4.2 Disk sizes and masses
FU Orionis, the precursor of the classification FUor, is also a binary system. HBC 494 system, however, has smaller disks separation compared to the 210 au between FU Orionis north and south components (Pérez et al., 2020). FU Orionis components have similar sizes and masses between their disks, contrary to the HBC 494 components. We can argue that, due to HBC 494 being a close-packed system with substantially different masses between their components, a scenario of radius truncation can be tested. However, the FU Orionis disks are exceptional compared to other FUors, which are generally more massive and larger. Nevertheless, it is important to check if HBC 494 follows the trend which shows that FUor objects are more massive than class 0/I disks and that disks from multiple systems are smaller compared to those from non-multiple systems (Cieza et al., 2018; Hales et al., 2020; Tobin et al., 2020; Zurlo et al., 2020b). First, we will describe our results regarding masses and radius. Then, we will compare HBC 494 disks to FUors and Orion YSOs in the literature.
We assumed dust masses (assuming the gas-to-dust ratio of 100) inferred by optically thin approximation (described in section 3.1). However, it is worth mentioning that the optically thin analysis can not take into account the innermost regions of the disk (optically thick). This may lead to an underestimation of the dust masses. Also, an underlying miscalculated dust grain temperature can alter the results, overestimating the masses if the dust is warmer than expected. The chosen assumptions of temperatures (fixed 20 K for dust grains) and opacities for both disks lead to 1.43 and 0.29 for HBC 494 N and HBC 494 S, respectively. Based on these results, we can say that the HBC 494 N is comparable to other FUor sources, but HBC 494 S has its dust mass comparable to EXor disks (Cieza et al., 2018). The disk sizes were calculated using the deconvolved Gaussian FWHM/2 radius obtained from 2D Gaussian fits. This methodology was also used for other ALMA datasets (e.g., Hales et al., 2020; Tobin et al., 2020). Therefore, it allows a consistent comparison with other disks. The dust mass vs radius comparison between HBC 494 N and HBC 494 S, a sample of 14 resolved FUors and EXors (extracted from Hales et al., 2020) and Class 0/I systems (Tobin et al., 2020), can be seen in figure 8. Here, as previously stated, we notice that HBC 494 disks (black, hexagon symbols), as other eruptive systems (hexagon, square, and triangle symbols), present higher masses than young systems, which are not in the stage of episodic accretion. However, there is no obvious distinction between the disk sizes of individual systems, eruptive or not. A clear difference is seen when we compare the disks from multiple systems (hexagon symbols) and single systems. The latter present bigger sizes as they are not targets for tidal truncation, enhanced radial drift, and more aggressive photoevaporation — processes known to rule close-systems dynamics and evolution (see e.g., Kraus et al., 2012; Harris et al., 2012; Rosotti & Clarke, 2018; Zurlo et al., 2020a, 2021).
4.3 Binary formation and alignment
Different scenarios have been proposed to explain the formation of binary systems. The main one for close-separated systems is fragmentation, followed by dynamic interactions (for a review, see Offner et al., 2022).
The fragmentation process consists of partial gravitational collapse from self-gravitating objects. To be successful, many initial physical conditions are relevant as thermal pressure, density, turbulence, and magnetic fields. In addition, the fragmentation can be divided into two main classes: direct/turbulent (e.g., Boss & Bodenheimer, 1979; Bate & Burkert, 1997) and rotational (e.g., Larson, 1972; Bonnell, 1994; Bonnell & Bate, 1994a, b; Burkert et al., 1997).
The direct/turbulent fragmentation from a collapsing core is highly dependent on the initial density distribution. It can form wide-separated multiple YSO systems with uncorrelated angular momentum. Thus, the direct/turbulent fragmentation may lead to preferentially misaligned multiple systems (Bate, 2000; Offner et al., 2016; Bate, 2018; Lee et al., 2019). The rotational fragmentation, instead, is caused by instabilities in rotating disks and leads to preferentially spin-aligned and coplanar systems (Offner et al., 2016; Bate, 2018). Moreover, later dynamical processes such as stellar flybys (Clarke & Pringle, 1993; Nealon et al., 2020; Cuello et al., 2023) and misaligned accretion from the environment (Dullemond et al., 2019; Kuffmeier et al., 2020, 2021) can also induce alignment or misalignment.
The HBC 494 disks have similar inclinations ( = 7.5 4.1 degrees) and similar PAs ( = 4.6 7.0 degrees). The relative orientations of the disks suggest that the system is coplanar. Assuming they are quasi-coplanar, with the same PA, the unprojected separation would be 024 (99 au). Therefore, the HBC 494 disks may show a spin-alignment situation, more typical to observed close-separated systems (see, e.g., Tobin et al., 2016b, 2020). Thus, we tentatively suggest that HBC 494 was formed by rotational disk fragmentation rather than direct collapsing. However, more precise observation of the kinematics of the surrounding gas on a small scale (Vorobyov et al., 2021), complemented with orbital information coming from astrometrical measurements, is required to evaluate this hypothesis.
In this context, IRAS 04158+2805 is of interest as Ragusa et al. (2021) reported the detection of two circumstellar disks, similar to HBC 494 in terms of small to moderate misalignment, and an external circumbinary disk. However, in contrast to IRAS 04158+2805, no circumbinary disk was detected in HBC 494. This difference could be explained either by the absorption of the circumbinary disk emission due to cloud contamination, or because HBC 494 had enough time to sufficiently empty the circumbinary mass reservoir. Since most hydrodynamical models of star formation naturally produce young binaries with individual disks and a surrounding circumbinary disk (Bate, 2018, 2019; Kuruwita et al., 2020), it is likely that a circumbinary disk formed at some earlier evolutionary stage of HBC 494. If the circumbinary disk is actually there, but remains undetected, the supply of material could extend the disk lifetime of the circumstellar disks in HBC 494. Deeper multi-wavelength observations would provide more information, enabling us to solve this binary riddle.

.
5 Conclusions
In this work, we presented high-resolution 1.3 mm observations of HBC 494 with ALMA. The unprecedented angular resolution in this source (0027), reveals that HBC 494 is a binary that can be resolved into two disks, HBC 494 N and HBC 494 S. The disks have a projected separation of 75 au. We derived sizes, orientations, inclinations, and dust masses for both components. Both objects appear to be in a quasi-coplanar configuration and with their sizes halted by dynamical evolution, besides preserving high masses, common to FUors and EXors than typical (not eruptive) Class 0/I disks. Comparing the two sources, we noticed that HBC 494 N is 5 times brighter/more massive and 2 times bigger than HBC 494 S.
The gas kinematics was analyzed at two different spatial scales: 8000 au and 150 au. At large-scale, we have obtained similar results as those presented in Ruíz-Rodríguez et al. (2017), revealing the wide outflow arcs (traced by the 12CO) and the infalling envelopes (13CO and C18O). At the small-scale, we detected depleted gas emission (cavities) for both disks (12CO and 13CO, moment 0). They were probably formed by slow outflows and jets coming from the disks along the line of sight or by optical depth effects and over-subtraction of the continuum emission. The dynamics of both disks in such scales were masked principally by cloud contamination.
Further observations with similar resolution but of optically thinner molecular lines may lead to the characterization of the dynamical interaction of the two components. For example, the identification of rotational signatures from the disks can be used to identify the dynamical masses of their central stars. With this information, we could also constrain truncation radii. Additionally, observations of small-scale gas structures, allied to astrometric measurements, can be used to constrain the possible formation scenarios.
We conclude that the HBC 494 system constitutes a test bed for eruptive binary-disk interactions and the connection between stellar multiplicity and accretion/luminosity processes (such as outbursts). Also, it provides a statistics enhancement about the rarely observed systems FUors and Exors.
Acknowledgements
We want to thank the referee for their comments and suggestions that significantly improved the manuscript. This paper makes use of the following ALMA data: ADS/JAO.ALMA 2016.1.00630.S. ALMA is a partnership of ESO (representing its member states), NSF (USA) and NINS (Japan), together with NRC (Canada), MOST and ASIAA (Taiwan), and KASI (Republic of Korea), in cooperation with the Republic of Chile. The Joint ALMA Observatory is operated by ESO, AUI/NRAO and NAOJ. The National Radio Astronomy Observatory is a facility of the National Science Foundation operated under cooperative agreement by Associated Universities, Inc. This work is funded by ANID – Millennium Science Initiative Program – Center Code NCN2021_080. P.H.N. acknowledges support from the Joint China-Chile Committee fund and the ANID Doctorado Nacional grant 21221084 from the government of Chile. A.Z. acknowledges support from the FONDECYT Iniciación en investigación project number 11190837. S.P. acknowledges support from FONDECYT Regular project 1191934. L.A.C. acknowledges support from the FONDECYT project number 1211656. M.M. acknowledges financial support by Fondos de Investigación 2022 de la Universidad Viña del Mar. J.C. and M.M. acknowledge support from ANID, – Millennium Science Initiative Program – NCN19_171. S.C. acknowledges support from Agencia Nacional de Investigación y Desarrollo de Chile (ANID) given by FONDECYT Regular grant 1211496, and ANID project Data Observatory Foundation DO210001. T.B. acknowledges financial support from the Joint Committee ESO-Government of Chile fund and the FONDECYT postdoctorado project number 3230470. This project has received funding from the European Union (ERC, Stellar-MADE, No. 101042275).
Data Availability
This paper makes use of the following ALMA data: ADS/JAO.ALMA 2016.1.00630.S. The data are downloadable from the official ALMA archive and public. ALMA is a partnership of ESO (representing its member states), NSF (USA) and NINS (Japan), together with NRC (Canada), MOST and ASIAA (Taiwan), and KASI (Republic of Korea), in cooperation with the Republic of Chile. The Joint ALMA Observatory is operated by ESO, AUI/NRAO and NAOJ.
References
- Andrews & Williams (2005) Andrews S. M., Williams J. P., 2005, ApJ, 631, 1134
- Arce & Sargent (2006) Arce H. G., Sargent A. I., 2006, ApJ, 646, 1070
- Armitage et al. (2001) Armitage P. J., Livio M., Pringle J. E., 2001, MNRAS, 324, 705
- Audard et al. (2014) Audard M., et al., 2014, Protostars and Planets VI, pp 387–410
- Bate (2000) Bate M. R., 2000, MNRAS, 314, 33
- Bate (2018) Bate M. R., 2018, MNRAS, 475, 5618
- Bate (2019) Bate M. R., 2019, MNRAS, 484, 2341
- Bate & Burkert (1997) Bate M. R., Burkert A., 1997, MNRAS, 288, 1060
- Beckwith et al. (1990) Beckwith S. V. W., Sargent A. I., Chini R. S., Guesten R., 1990, AJ, 99, 924
- Boehler et al. (2017) Boehler Y., Weaver E., Isella A., Ricci L., Grady C., Carpenter J., Perez L., 2017, ApJ, 840, 60
- Bonnell (1994) Bonnell I. A., 1994, MNRAS, 269, 837
- Bonnell & Bastien (1992) Bonnell I., Bastien P., 1992, ApJ, 401, L31
- Bonnell & Bate (1994a) Bonnell I. A., Bate M. R., 1994a, MNRAS, 269, L45
- Bonnell & Bate (1994b) Bonnell I. A., Bate M. R., 1994b, MNRAS, 271, 999
- Borchert et al. (2022a) Borchert E. M. A., Price D. J., Pinte C., Cuello N., 2022a, MNRAS, 510, L37
- Borchert et al. (2022b) Borchert E. M. A., Price D. J., Pinte C., Cuello N., 2022b, MNRAS, 517, 4436
- Borchert et al. (2022c) Borchert E. M. A., Price D. J., Pinte C., Cuello N., 2022c, MNRAS, 517, 4436
- Boss & Bodenheimer (1979) Boss A. P., Bodenheimer P., 1979, ApJ, 234, 289
- Burkert et al. (1997) Burkert A., Bate M. R., Bodenheimer P., 1997, MNRAS, 289, 497
- CASA Team et al. (2022) CASA Team et al., 2022, PASP, 134, 114501
- Chiang et al. (2015) Chiang H.-F., Reipurth B., Walawender J., Connelley M. S., Pessev P., Geballe T. R., Best W. M. J., Paegert M., 2015, ApJ, 805, 54
- Cieza et al. (2018) Cieza L. A., et al., 2018, MNRAS, 474, 4347
- Clarke & Pringle (1993) Clarke C. J., Pringle J. E., 1993, MNRAS, 261, 190
- Connelley & Reipurth (2018) Connelley M. S., Reipurth B., 2018, ApJ, 861, 145
- Cruz-Sáenz de Miera et al. (2019) Cruz-Sáenz de Miera F., Kóspál Á., Ábrahám P., Liu H. B., Takami M., 2019, ApJ, 882, L4
- Cuello et al. (2019) Cuello N., et al., 2019, MNRAS, 483, 4114
- Cuello et al. (2020) Cuello N., et al., 2020, MNRAS, 491, 504
- Cuello et al. (2023) Cuello N., Ménard F., Price D. J., 2023, European Physical Journal Plus, 138, 11
- Dullemond et al. (2019) Dullemond C. P., Küffmeier M., Goicovic F., Fukagawa M., Oehl V., Kramer M., 2019, A&A, 628, A20
- Dunham & Vorobyov (2012) Dunham M. M., Vorobyov E. I., 2012, ApJ, 747, 52
- Dunhill et al. (2015) Dunhill A. C., Cuadra J., Dougados C., 2015, MNRAS, 448, 3545
- Dutrey et al. (1994) Dutrey A., Guilloteau S., Simon M., 1994, A&A, 286, 149
- Evans et al. (2009) Evans Neal J. I., et al., 2009, ApJS, 181, 321
- Frank et al. (2014) Frank A., et al., 2014, in Beuther H., Klessen R. S., Dullemond C. P., Henning T., eds, Protostars and Planets VI. p. 451 (arXiv:1402.3553), doi:10.2458/azu_uapress_9780816531240-ch020
- Giannini et al. (2022) Giannini T., et al., 2022, ApJ, 929, 129
- Hales et al. (2018) Hales A. S., et al., 2018, ApJ, 859, 111
- Hales et al. (2020) Hales A. S., et al., 2020, ApJ, 900, 7
- Harris et al. (2012) Harris R. J., Andrews S. M., Wilner D. J., Kraus A. L., 2012, ApJ, 751, 115
- Herbig (1966) Herbig G. H., 1966, Vistas in Astronomy, 8, 109
- Herbig (2007) Herbig G. H., 2007, AJ, 133, 2679
- Jurdana-Šepić et al. (2018) Jurdana-Šepić R., Munari U., Antoniucci S., Giannini T., Lorenzetti D., 2018, A&A, 614, A9
- Kenyon et al. (1990) Kenyon S. J., Hartmann L. W., Strom K. M., Strom S. E., 1990, AJ, 99, 869
- Kóspál et al. (2017) Kóspál Á., et al., 2017, ApJ, 843, 45
- Kratter & Lodato (2016) Kratter K., Lodato G., 2016, ARA&A, 54, 271
- Kraus et al. (2011) Kraus A. L., Ireland M. J., Martinache F., Hillenbrand L. A., 2011, ApJ, 731, 8
- Kraus et al. (2012) Kraus A. L., Ireland M. J., Hillenbrand L. A., Martinache F., 2012, ApJ, 745, 19
- Kuffmeier et al. (2020) Kuffmeier M., Goicovic F. G., Dullemond C. P., 2020, A&A, 633, A3
- Kuffmeier et al. (2021) Kuffmeier M., Dullemond C. P., Reissl S., Goicovic F. G., 2021, A&A, 656, A161
- Kuruwita et al. (2020) Kuruwita R. L., Federrath C., Haugbølle T., 2020, A&A, 641, A59
- Lai & Muñoz (2022) Lai D., Muñoz D. J., 2022, arXiv e-prints, p. arXiv:2211.00028
- Larson (1972) Larson R. B., 1972, MNRAS, 156, 437
- Lee et al. (2019) Lee A. T., Offner S. S. R., Kratter K. M., Smullen R. A., Li P. S., 2019, ApJ, 887, 232
- Lodato & Clarke (2004) Lodato G., Clarke C. J., 2004, MNRAS, 353, 841
- Mathieu et al. (1997) Mathieu R. D., Stassun K., Basri G., Jensen E. L. N., Johns-Krull C. M., Valenti J. A., Hartmann L. W., 1997, AJ, 113, 1841
- Maureira et al. (2020) Maureira M. J., Pineda J. E., Segura-Cox D. M., Caselli P., Testi L., Lodato G., Loinard L., Hernández-Gómez A., 2020, ApJ, 897, 59
- McMullin et al. (2007) McMullin J. P., Waters B., Schiebel D., Young W., Golap K., 2007, in Shaw R. A., Hill F., Bell D. J., eds, Astronomical Society of the Pacific Conference Series Vol. 376, Astronomical Data Analysis Software and Systems XVI. p. 127
- Menten et al. (2007) Menten K. M., Reid M. J., Forbrich J., Brunthaler A., 2007, A&A, 474, 515
- Nealon et al. (2020) Nealon R., Cuello N., Alexander R., 2020, MNRAS, 491, 4108
- Offner et al. (2016) Offner S. S. R., Dunham M. M., Lee K. I., Arce H. G., Fielding D. B., 2016, ApJ, 827, L11
- Offner et al. (2022) Offner S. S. R., Moe M., Kratter K. M., Sadavoy S. I., Jensen E. L. N., Tobin J. J., 2022, arXiv e-prints, p. arXiv:2203.10066
- Pérez et al. (2020) Pérez S., et al., 2020, ApJ, 889, 59
- Postel et al. (2019) Postel A., Audard M., Vorobyov E., Dionatos O., Rab C., Güdel M., 2019, A&A, 631, A30
- Pueyo et al. (2012) Pueyo L., et al., 2012, ApJ, 757, 57
- Ragusa et al. (2021) Ragusa E., et al., 2021, MNRAS, 507, 1157
- Reipurth (1985) Reipurth B., 1985, A&AS, 61, 319
- Reipurth & Aspin (2004) Reipurth B., Aspin C., 2004, ApJ, 608, L65
- Reipurth & Bally (1986) Reipurth B., Bally J., 1986, Nature, 320, 336
- Rosotti & Clarke (2018) Rosotti G. P., Clarke C. J., 2018, MNRAS, 473, 5630
- Ruíz-Rodríguez et al. (2017) Ruíz-Rodríguez D., et al., 2017, MNRAS, 466, 3519
- Ruíz-Rodríguez et al. (2022) Ruíz-Rodríguez D. A., Williams J. P., Kastner J. H., Cieza L., Leemker M., Principe D. A., 2022, MNRAS, 515, 2646
- Takami et al. (2019) Takami M., et al., 2019, ApJ, 884, 146
- Tobin et al. (2016a) Tobin J. J., et al., 2016a, Nature, 538, 483
- Tobin et al. (2016b) Tobin J. J., et al., 2016b, ApJ, 818, 73
- Tobin et al. (2020) Tobin J. J., et al., 2020, ApJ, 890, 130
- Tobin et al. (2022) Tobin J. J., et al., 2022, ApJ, 925, 39
- Vorobyov & Basu (2005) Vorobyov E. I., Basu S., 2005, ApJ, 633, L137
- Vorobyov & Basu (2015) Vorobyov E. I., Basu S., 2015, ApJ, 805, 115
- Vorobyov et al. (2021) Vorobyov E. I., Elbakyan V. G., Liu H. B., Takami M., 2021, A&A, 647, A44
- Weaver et al. (2018) Weaver E., Isella A., Boehler Y., 2018, ApJ, 853, 113
- Zhu et al. (2009) Zhu Z., Hartmann L., Gammie C., McKinney J. C., 2009, ApJ, 701, 620
- Zhu et al. (2012) Zhu Z., Hartmann L., Nelson R. P., Gammie C. F., 2012, ApJ, 746, 110
- Zurlo et al. (2020a) Zurlo A., et al., 2020a, MNRAS, 496, 5089
- Zurlo et al. (2020b) Zurlo A., et al., 2020b, A&A, 633, A119
- Zurlo et al. (2021) Zurlo A., et al., 2021, MNRAS, 501, 2305
Appendix A Effects of continuum over-subtraction
To evaluate the effects of continuum over-subtraction, we generated spatial profiles for each disk using 12CO moment 0 maps at small scales before and after continuum subtraction. We created cuts that crossed the semi-major axis of each disk (see red lines in Figure 9, top panels) for this purpose. Figure 9, top-left panel displays moment 0 maps before continuum removal, while the top-right panel shows the same maps after this process. The comparison between these effects is better visualized in the bottom panels, where continuum emission (magenta diamonds/lines) has a similar shape as 12CO before continuum subtraction (orange crosses/lines), but shifted in flux, for both disks. The spatial profile subtractions are displayed by black lines. However, they display higher fluxes when compared to the spatial profiles produced after continuum subtraction (blue-filled circles/lines). Additionally, the continuum was overestimated by foreground optical depth molecular lines that absorbed continuum emission and then propagated to the uvcontsub CASA task. The "holes" or cavities seen in the top-right panel could potentially be diminished by manually adding back some of the lost line signal, but this would only create a fake signal at the level of noise. Thus, optically thinner lines must be used to obtain the real signal of disks in moment 0 and 1 maps.

Appendix B 12CO, 13CO and C18O channel maps with contours and the effect of cloud contamination
This appendix presents the 12CO, 13CO, and C18O channel maps with contour plots (see Figures 10 and 11). To visualize the signals and corresponding flux values using a color bar, we also provide versions of the same channel maps without contours (see Figures 4 and 13).
Figure 10 shows the 3-rms significant southern arcs (velocity channels from -6 km/s to 1 km/s) and northern arcs (velocity channels from 5 km/s to 18 km/s). However, cloud contamination affects channels between 2 km/s and 6 km/s. These channels were not used in the creation of large-scale moment maps. Channel 6 km/s shows the most evidence of cloud contamination, with contour plots showing innermost flux values near the disks (marked by the central orange star). It also shows some significant contours on both horizontal extremes, which can be tracers of the filtered signals using only the main array data. The data partially trace features that, due to their large extension, require a combination of the ALMA main and single dish arrays to recover extended flux emission.
In Figure 11, the 13CO channel maps are heavily marked by 3-rms black contours, which show the significant gas signal on each channel. Specifically, channels from 2.20 km/s to 6.10 km/s indicate gas infalling clumps near where the disks are located, but also show random/scattered signals far from the disks due to cloud contamination.
The C18O channel maps represented in Figure 12 are also heavily marked by 3-rms black contours. Channels from 2.80 km/s to 4.60 km/s indicate gas infalling clumps near where the disks are located, but also show random/scattered signals far from the disks due to cloud contamination. Other channels are affected by cloud contamination or lack a significant signal.


Appendix C Extra channel maps
The 13CO (large scale), C18O (large scale), 12CO (small scale and with continuum subtracted), 13CO (small scale and with continuum subtracted), and C18O (small scale and with continuum subtracted) channel maps are displayed in Figs. 13, 14, 15, 16, and 17, respectively.