Reading the tea leaves in the - and - diagrams: dry and gaseous mergers with remnant angular momentum
Abstract
We recently revealed that bulges and elliptical galaxies broadly define distinct, super-linear relations in the - diagram, with the order-of-magnitude lower ratios in the elliptical galaxies due to major (disc-destroying, elliptical-building) dry mergers. Here we present a more nuanced picture. Galaxy mergers, in which the net orbital angular momentum does not cancel, can lead to systems with a rotating disc. This situation can occur with either wet (gas-rich) mergers involving one or two spiral galaxies, e.g., NGC 5128, or dry (relatively gas-poor) collisions involving one or two lenticular galaxies, e.g., NGC 5813. The spheroid and disc masses of the progenitor galaxies and merger remnant dictate the shift in the - and - diagrams. We show how this explains the (previously excluded merger remnant) Sérsic S0 galaxies near the bottom of the elliptical sequence and core-Sérsic S0 galaxies at the top of the bulge sequence, neither of which are faded spiral galaxies. Different evolutionary pathways in the scaling diagrams are discussed. We also introduce two ellicular (ES) galaxy types, explore the location of brightest cluster galaxies and stripped ‘compact elliptical’ galaxies in the - diagram, and present a new merger-built - relation which may prove helpful for studies of nanohertz gravitational waves. This work effectively brings into the fold many systems previously considered outliers with either overly massive or undermassive black holes relative to the near-linear - ‘red sequence’ patched together with select bulges and elliptical galaxies.
keywords:
galaxies: bulges – galaxies: elliptical and lenticular, cD – galaxies: structure – galaxies: interactions – galaxies: evolution – (galaxies:) quasars: supermassive black holes1 Introduction
For a long time, most astronomers, including the author, had, in effect, been looking at the tip of the proverbial iceberg in the (black hole mass, )-(spheroid stellar mass, ) diagram due to samples biased with high fractions of massive red galaxies in which star-formation had largely ceased. For many years, the ratio was routinely quoted as a constant value and used as such in theory, simulations and observation-based predictions. This practice was a consequence of belief in a near-linear - relation (Dressler & Richstone, 1988; Magorrian et al., 1998) coupled with the accurate insight and deduction by Rees (1989) that “massive black holes now starved of fuel [] lurk in the nuclei of most galaxies”. However, a decade ago, this was explained as an incomplete picture, and early clues that a universal, near-linear - relation was not the full story can be found in Laor (1998), Laor (2001) and Wandel (1999). The lower-mass spheroids ( M⊙), in particular those without a core partially-depleted of stars, were observed to follow a near-quadratic - relation, and dry111The term ‘dry’ denotes systems (galaxies and mergers) relatively poor in star-forming gas, when compared to most spiral galaxies. mergers were invoked to explain movement off this relation through the creation of core-Sérsic spheroids which appeared to follow a near-linear relation (Graham, 2012b; Graham & Scott, 2013; Scott et al., 2013). That is, step-change mergers, discussed by Begelman et al. (1980) and Rees (1989), were heralded as the driving force behind the apparent near-linear - relation at high masses.
This core-Sérsic versus Sérsic divide was interpreted by Graham (2012b) using the galaxy luminosity-(velocity dispersion) relations, and it was subsequently explored by Kormendy & Ho (2013, hereafter KH13, see their Section 6.7) and (Sahu et al., 2019b, see their Section 5). ‘Quasar mode’, also known as ‘cold mode’, feedback processes (e.g., Lynden-Bell, 1969; Kauffmann & Haehnelt, 2000; Ciotti & Ostriker, 2001; Feruglio et al., 2010) were considered by Graham & Scott (2013) as responsible for shaping the non-linear spheroid/(black hole) coevolution at low masses. Furthermore, the virial masses of black holes (BHs) in active galactic nuclei (AGNs) were seen to extend this near-quadratic - relation down to - M⊙ (Graham & Scott, 2015). This marked a significant change, building on past works which had advocated a single near-linear relation with slope 0.9–1.2 (e.g., Kormendy & Richstone, 1995; McLure & Dunlop, 2002; Marconi & Hunt, 2003; Häring & Rix, 2004; Graham, 2007b; Gültekin et al., 2009b; McConnell & Ma, 2013, KH13).
Over more recent years, our understanding of the - diagram has advanced in several important ways. Savorgnan et al. (2016) observed the presence of galaxies with partially depleted cores at the top of the near-quadratic relation defined by spheroids without such cores, and they also revealed how a near-linear “red sequence” involving early-type galaxies (ETGs) yields an apparent separation from the bulges of late-type galaxies (LTGs) which followed a notably steeper “blue sequence”. Doubling the sample size of LTGs with multicomponent decompositions, Davis et al. (2019) reported that the LTGs followed a near-quadratic - relation. Doubling the sample size of ETGs with similar decompositions, Sahu et al. (2019a) discovered that the bulges of lenticular (S0) galaxies also follow a near-quadratic relation, as does the ensemble of elliptical (E) galaxies, albeit with different intercept points, i.e., normalisations. Indeed, a striking revelation was the order of magnitude offset in the ratios, at a given spheroid mass, between E galaxies and the bulges of S0 galaxies. This offset has since been explained in Graham & Sahu (2022) by dry, major mergers of lenticular galaxies folding in their disc mass and creating the elliptical galaxies (Naab et al., 2006b). Graham & Sahu (2022) borrowed from Darwinian evolution and used the terminology of “gradualism” to describe coevolution via accretion of external material, star formation, AGN growth, and feedback, and the term “punctuated equilibrium” to describe dry mergers that dramatically change the properties of the remnant galaxy through simple additive means.222Technically, the Darwinian analogy may not be perfect if accretion-driven black hole growth spurts occur on a shorter timescale than the resettlement of discbulge stars during a galactic merger event. While much emphasis and effort has been expended on the role of feedback over the past quarter century, here, we provide a further, more complete investigation into these merger-induced jumps in the - diagram.
While it has long been suggested that galaxies with discs can collide to create an E galaxy (e.g., van Albada & van Gorkom, 1977; Toomre, 1977), they can also merge to create a system with substantial orbital angular momentum (e.g., Barnes & Hernquist, 1996; Naab & Burkert, 2003; Naab et al., 2006b). Indeed, the merger simulations by Negroponte & White (1983), Barnes (1992), and Naab et al. (2006a) appear quite capable of creating galaxies in which varying fractions of (initially) disc stars end up in the spheroidal component of the remnant. This outcome seems inescapable given the possible range of initial bulge-to-disc ratios, disc rotation speeds and relative orientations, orbital impact parameters, etc. In a sense, ‘natural selection’ occurs when the environment and initial conditions dictate the survival of discs and the creation of spheroids. Many of the progenitor galaxies’ disc stars are at larger orbital radii than its spheroid stars, and these stars likely contribute to the shallow tails of the high- light profiles of massive ETGs.
Knowing the mass of the progenitor galaxies’ black holes, one can hope to track the evolutionary paths of merging galaxies through the - diagram. This task is relatively easy in the case of dry mergers, where the variable parameter is the fraction of progenitor disc stars that end up in the new spheroid, related to the net angular momentum of the pre-merged binary galaxy system. In the case of ‘wet mergers’ involving cold gas, there will additionally be some fraction of star formation and AGN accretion contributing to the spheroid and black hole mass, respectively (e.g., Lotz et al., 2008; Bournaud et al., 2011; Ivison et al., 2012).
In wet and dry mergers, there may also be some black hole mass loss through gravitational radiation (e.g., Peters, 1964; Blandford, 1979; Kandrup & Mahon, 1992; Rajagopal & Romani, 1995; Lommen & Backer, 2001; Sesana et al., 2004; Chen et al., 2020). This latter aspect, or more generally, black hole collisions, adds another exciting research element beyond the topic of galaxy/(black hole) coevolution and has led to pioneering endeavours to detect long-wavelength gravitational waves using ‘pulsar timing arrays’ (e.g., Arzoumanian et al., 2020; Chen et al., 2021; Goncharov et al., 2021, 2022; Tarafdar et al., 2022). Most predictions of the expected signal strength of the stochastic gravitational-wave background — arising from the merger of many supermassive black hole binaries — at nanohertz-frequencies have been based on the notion of a near-linear - relation. However, Graham & Sahu (2022) revealed that one might be better served using the super-linear - relation defined by merger-built elliptical (and Es,e: see Section 3.2.2) galaxies.333A more complete approach, which we provide here, would also offer a prescription for including the (wet and dry) merger-built S0 galaxies.
In this work, we present a value-added - diagram, which better reveals the phylogeny of spheroids and shows the (possible origin and) location of different types of merger remnant. We pay particular attention to ‘mergers’ previously flagged for exclusion from the - diagram due to their semi-unrelaxed state and thus potentially evolving spheroid (and black hole) mass. These include lenticular galaxies undergoing star formation, likely involving at least one spiral galaxy progenitor (e.g., Toomre, 1977), and are discussed in Section 3.1. These merger-built disc galaxies follow the low-mass end of the elliptical galaxy - relation. Pseudobulges, sometimes claimed as the population at the low-mass end of the spiral galaxy sequence (e.g., Courteau et al., 1996; Carollo et al., 2001), are discussed in subsection 3.1.1. In Section 3.2, we address lenticular galaxies whose bulges have partially depleted cores, suggestive that these galaxies were built from a dry merger event in which the net angular momentum did not cancel. We also discuss the ellicular (ES) galaxy type and potential evidence for subtypes differentiating between merger remnants midway between an E and an S0 galaxy versus compact relic ‘red nuggets’ (Daddi et al., 2005; Damjanov et al., 2011) that have accreted an intermediate-scale disc. We also review the location of the brightest cluster galaxies (BCGs: Section 3.3) in the - diagram. Finally, in Section 3.4, we note how the stripping of stars by the gravitational tide of a massive neighbouring galaxy can impact the placement of systems such as ‘compact elliptical’ (cE) galaxies and ‘ultracompact dwarf galaxies’ (UDGs) in the - diagram. A brief summary is provided in Section 4, prior to an Appendix which provides new multicomponent decompositions for seven galaxies and possibly helpful notes on several others.
2 The Data Sample
This research forms an extension of Graham & Sahu (2022), which was based on a sample of 104 galaxies with directly measured supermassive black hole masses, critical galaxy morphology information, and multicomponent decompositions of their Spitzer Space Telescope images taken at an infrared wavelength of 3.6 m. Of these 104, 31 are late-type galaxies (S), 35 are elliptical galaxies, and the remaining 38 are identified as S0 or ES galaxies.444Liller (1966) introduced the ES galaxy type discussed further in Graham (2019b). This paper uses the same sample, black hole masses, spheroid and galaxy stellar masses, and spheroid sizes, but looks more deeply into this rich data set. For instance, some of the S0 galaxies are clearly built from wet mergers and others from dry mergers. That is, they are not all faded S galaxies. More generally, a greater emphasis is placed on the subtleties of the ETG morphology and distinguishing between E, ES and S0 galaxies and whether the latter two types have been built by mergers.
Rather than simple bulgedisc fits, which can fail to capture the bulge component correctly, or randomly fitting multiple (e.g., three) Sérsic (1963) functions that may have no connection to the physical structures in galaxies, the images were previously inspected by us for the presence of distinct components. Details of this process were noted in Graham & Sahu (2022), see also Ciambur (2015), and the decompositions are shown for each galaxy in Savorgnan & Graham (2016a)555Readers may find the paper’s original format, available at arxiv.org, preferable., Sahu et al. (2019a)666See the corresponding journal’s online link “View figure set (41 panels)” after their Fig. 3. and Davis et al. (2019).
One point worth noting is that our image analysis will often conveniently fold boxy/X/(peanut shell)-shaped structures — captured with radially-dependent, Fourier harmonic terms used to describe isophotal departures from pure ellipses (e.g., Ciambur & Graham, 2016) — back into the bar from which they emerged (e.g., Combes et al., 1990; Athanassoula, 2016). When this does not occur, we add a barlens component to the decomposition. As such, for the most part, our bulge luminosities and masses do not pertain to such ‘pseudobulges’. Nor do our bulge masses pertain to bars or inner discs, which we model as separate components when present. Based on a multitude of clues from our past work, for seven galaxies, we reinvestigated their image and provide an updated decomposition in Appendix A. We remodel four of the original galaxies from Savorgnan & Graham (2016a), two ETGs from Sahu et al. (2019a), and one spiral galaxy from Davis et al. (2019).
Our spheroid stellar masses were based on the 3.6 m magnitudes and the colour-dependent, spatially-constant, stellar mass-to-light ratio, , prescription from the dusty galaxy model of Into & Portinari (2013, their Table 6) after conversion to a (Kroupa, 2002) stellar initial mass function (Graham & Sahu, 2022, their Equation 4 and Fig. 1). These 3.6 m ratios do not vary too much with optical colour, with for the ETG colours , and providing enhanced stability over estimates of the bulge (and galaxy) stellar mass derived from optical magnitudes alone. As shown in the Appendix of Graham & Sahu (2022), a broadly consistent set of stellar masses was obtained using the independent set of colour-dependent ratios from Schombert et al. (2022), once converted to the same (Kroupa, 2002) stellar initial mass function (Graham & Sahu, 2022, their Equation A2).
2.1 Advancing the - diagram
Two contributions we have strived to make over the years are improved measurements of the spheroid mass coupled with a better recognition of the host galaxy morphology. This has been achieved through several advancements in galaxy image analysis, such as the introduction of the core-Sérsic model (Graham et al., 2003), which unites a spheroid’s inner and outer structure. King & Minkowski (1966) and King & Minkowski (1972) had reported that massive ETGs have cores which flatten relative to the outer de Vaucouleurs (1948) light profile. Begelman et al. (1980) and Ebisuzaki et al. (1991) explained how binary black holes from galaxy merger events could create such cores, with massive dense infalling star systems creating larger cores (e.g., El-Zant et al., 2001; Goerdt et al., 2010; Bonfini & Graham, 2016). Building on the ‘core-Hubble’ model of Crane et al. (1993), and the double power-law models of Ferrarese et al. (1994) and Grillmair et al. (1994), application of the core-Sérsic model revealed that roughly 1-in-5 past allegations of a partially depleted core — when based on the Nuker model777The Nuker model is mathematically equivalent to the double power-law introduced by Hernquist (1990, his Equation 43). (Grillmair et al., 1994; Kormendy et al., 1994), — were not correct (see Dullo & Graham, 2012, 2013, their Appendix A.2).888This was in part due to the measured Nuker model parameters depending on the fitted radial range (Graham et al., 2003), but also because low-mass spheroids with low Sérsic indices have shallow inner light profiles but no depleted core Graham & Guzmán (2003, their Fig. 8). The presence of additional nuclear discs can also flatten the inner light profile, creating the illusion of a central deficit Dullo & Graham (2013). Fitting a Sérsic model to a spheroid containing a core-Sérsic light profile can result in a misleadingly low Sérsic index and erroneously faint spheroid luminosity. The core-Sérsic model is available in Profiler (Ciambur, 2016) and was implemented into Galfit (Peng et al., 2010) by Bonfini (2014) and can be found in Imfit (Erwin, 2015).
Coupled with the above has been the realisation that the less luminous (, or Vega mag) galaxies often extra lighave ‘extra light’, such as a nuclear star cluster, rather than a central deficit of light. Furthermore, the nuclear star cluster mass has been discovered to scale with the host spheroid mass (Balcells et al., 2003; Graham & Guzmán, 2003), and nuclear discs are also a common feature (e.g., Nieto et al., 1991; Jaffe et al., 1994; Balcells et al., 2007). While nuclear star clusters are typically only a fraction of one per cent of the host spheroid’s stellar mass (e.g., Ferrarese et al., 2006; Wehner & Harris, 2006; Scott & Graham, 2013), if they are overlooked in the modelling of the galaxy light, then they can have a disproportionate influence on the galaxy decomposition by, for example, inflating both the fitted Sérsic index and luminosity of the spheroid.999This situation arises when sufficiently high spatial resolution reveals an excess in the image capable of biasing the galaxy decomposition. As such, accounting for these additional components in the image analysis can be important for acquiring an unbiased spheroid magnitude, and also for better understanding the nature of, and connections between, galaxies.
For example, Faber et al. (1997, p. 1783) partly advocated against a division among ETGs at mag by arguing that the additional brightness of the nuclear star clusters yields a continuous and unifying galaxy luminosity-(central surface brightness) relation for ETGs brighter than mag (Faber et al., 1997, their Fig.4c and 6). This followed Kormendy (1985), which concluded that ETGs brighter and fainter than mag formed in very different ways. Why that interpretation of ETGs was misleading is explained in Graham & Guzmán (2003) and detailed further in Graham (2019a), both of which advocated for a divide at mag, in agreement with other arguments in (Faber et al., 1997). This divide is mirrored by the (cold gas)-poor S0 versus E galaxy separation at , seen in Figure 1. It arises from the (large scale disc)-eroding, spheroid-building, core-depleting mergers of disc galaxies with massive black holes (Negroponte & White, 1983; Nieto & Bender, 1989; Ebisuzaki et al., 1991).
An additional breakthrough of sorts has been the rediscovery of ES galaxies (Savorgnan & Graham, 2016b). Introduced by Liller (1966) and reviewed by Graham (2019b), they contain intermediate-scale discs having sizes greater than nuclear discs (20 pc to a few hundred parsecs) and smaller than the large-scale discs of S0 galaxies (with typical disc scalelengths of a few kpc). Some of these ES galaxies are also known as ‘disc ellipticals’ (Nieto et al., 1988). In Section 3.2.2, we have introduced the ES,e and ES,b subtypes. Failing to identify such discs during the decomposition of the galaxy light can result in an erroneous luminosity for the spheroid.
Another advance has stemmed from the realisation that the ELLIPSE task (Jedrzejewski, 1987) in the IRAF software suite is flawed, failing to properly capture the isophotal deviations from pure ellipses observed at least since Oort (1940) in the case of NGC 3115, and described using Fourier harmonics by Carter (1978), see also Carter (1987) and Bender & Moellenhoff (1987). Ciambur (2015) revealed how the size of the error in the ELLIPSE task grows with the ellipticity of the isophote, which means it is particularly prominent when a bar is present, or a disc is approaching an edge-on orientation. Correcting this, Ciambur & Graham (2016) were, for the first time, able to detect and quantify the radial variation in the amplitude of the sixth order Fourier Harmonic term, which does well with capturing (peanut shell)-shaped structures (e.g., de Vaucouleurs, 1974; Jarvis, 1986; Shaw, 1987) associated with buckled bars (Combes et al., 1990; Athanassoula, 2005). As dramatically illustrated by Ciambur (2015), in the case of NGC 128, the superposition of the bar and (peanut shell)/box/X-shaped ‘bulge’ results in isophotes which are not boxy, i.e., neither described by nor captured with the fourth-order Fourier Harmonic term but instead requiring the sixth order Fourier Harmonic term. Collectively, this has enabled progress in dissecting and understanding the - diagram.
In this work, we provide some further notes on individual galaxies, which are common to us and KH13, but for which we disagree on the spheroid mass. Finally, it is noted that there is of course room for further improvement, which could include application of galaxy-component-specific stellar mass-to-light ratios for calculation of galaxy component masses, and also for the derivation of black hole masses, taking into account the nuclear star clusters. Nguyen et al. (2017) represents a good example where the nuclear stellar populations in NGC 404 were modelled and a spatially-varying colour-dependent used.101010Davis et al. (2020) subsequently updated the measured black hole mass in NGC 404, which we have used. Working with images taken at 3.6 m, the influence of hot young stars is small given that their blackbody radiation curves peak in the blue to UV region of the electromagnetic spectrum. Instead, older stars, and to a lesser degree thermally-glowing dust (Querejeta et al., 2015), contribute to the light seen at 3.6 m. An analysis of Hubble Space Telescope (HST) images, coupled with stellar mass-to-light ratios for the nuclear star clusters, plus the refined galaxy morphologies used here, would enable advances with the - relation for LTGs (Balcells et al., 2003) and ETGs (Graham & Guzmán, 2003), and with the - relation (Graham & Spitler, 2009) and the - relation (Graham, 2012a). To date, these discoveries have taken a back seat to the - and - relations (Magorrian et al., 1998; Ferrarese & Merritt, 2000; Gebhardt et al., 2000), yet such mass-mass-morphology (m3) and mass-sigma–morphology (msm) diagrams involving nuclear star clusters will enable a better understanding of massive compact objects at the centres of galaxies, as will the - relation (Graham, 2016). HST-resolved images, coupled with the galaxy morphologies, will also enable an exploration of the depleted cores built by merging black hole binaries (Begelman et al., 1980; Merritt & Milosavljević, 2005), and the prior destruction of the nuclear star clusters (Bekki & Graham, 2010).
3 Demographics in the (black hole)-spheroid mass diagram
Within the - diagram, Sahu et al. (2019a) and Graham & Sahu (2022) present a super-linear bulge sequence, and an offset parallel elliptical galaxy sequence having ratios that differ by roughly an order of magnitude at any given spheroid mass. This primary pattern is not due to splitting off the disc’s stellar mass from a single unified - relation. It can, however, be explained in terms of elliptical galaxy formation via dry S0 galaxy mergers, which end in little net rotation.
Here, we identify and explain additional substructures in the - diagram, typically when the merger remnant is not an elliptical galaxy but contains significant rotation, as in the case of lenticular galaxies. We also broach the location of BCGs — typically E galaxies likely built from multiple mergers — in the - diagram and the effect of ‘tidal stripping’ on the location of bulges. These latter two processes can broaden the distribution in the - diagram, acting in opposing directions.

3.1 Bulges at the bottom of the E galaxy - sequence
KH13 had a subsection titled “Mergers in progress have abnormally small BH masses”. They were referring to the known result that, relative to the original near-linear - relation, the ratio is low in the mergers they mentioned. Here, we explain that these system’s black hole masses are not abnormal but instead as expected, given their origin from a wet galaxy merger likely involving one or two spiral galaxies.
KH13 advocated excluding five merger products (NGC 1316, NGC 2960, NGC 4382, NGC 5128 and IC 1481) from the black hole scaling diagrams (see their Table 2). These galaxies contain merger-built ‘classical bulges’ whose inclusion, as we shall see, provides a more complete understanding of galaxy/(black hole) coevolution. KH13 regarded these systems as elliptical galaxies; see the final paragraph of their Section 5, and in their - diagram (their Fig. 14), they appear as notable outliers. However, their offset location is somewhat exaggerated because the galaxy rather than the bulge luminosity was used for these (three S0,pec plus two S?) galaxies.
While still perturbed at varying levels, these are recognised disc galaxies whose light profiles display an unmistakable bulge plus outer exponential structure (Savorgnan & Graham, 2016a; Sahu et al., 2019a) and for which rotation has been measured. Indeed, in the case of NGC 5128, it has long been known to rotate (Burbidge & Burbidge, 1959; Hui et al., 1995). As noted in the Introduction, wet mergers involving spiral galaxies can lead to disc galaxies with more prominent bulges (e.g., Barnes & Hernquist, 1996). NGC 5128 (aka Centaurus A) is a recognised merger involving at least one spiral galaxy (Tubbs, 1980; Bekki et al., 2003; Wang et al., 2020), as is NGC 1316 (Vagshette et al., 2021), which underwent a major gas-rich merger 3 Gyr ago (e.g., Goudfrooij et al., 2004). NGC 2960 (Mrk 1419) is an optically disturbed S0–Sa LINER with no nearby companions (Kuo et al., 2008) and labelled a merger product by KH13. NGC 2960 may represent an advanced stage of the suspected spiral-spiral merger NGC 7252 (Whitmore et al., 1993).
In passing, we note that pushing observations into the low surface brightness regime around the outskirts of galaxies (e.g., Martínez-Delgado et al., 2001; Bennert et al., 2008; Hood et al., 2018; Martin et al., 2022), may be insightful if tidal streams, debris tails, shells and ripples (e.g., NGC3923: Fort et al., 1986) can distinguish between accretion versus more substantial mergers. As such, deep observations of the sample of galaxies with directly measured black hole masses, coupled with their location in the - diagram, may reveal further tell-tale clues as to the origin and evolution of galaxies more generally. For example, Morales et al. (2018) have flagged the dusty spiral galaxy NGC 3227 as a possible major merger remnant, somewhat akin to NGC 2960 but with eight times larger. Future gains in this exciting area are expected from ESA’s new ARRAKIHS (Analysis of Resolved Remnants of Accreted galaxies as a Key Instrument for Halo Surveys) F-class mission, comprised of a dedicated satellite providing incredibly deep optical and near-infrared images of 100 nearby galaxies and their outskirts (P.I. R.Guzmán).
While NGC 4382 and IC 1481 are not in our Spitzer sample, Sahu et al. (2019b) reported an additional two S0 merger remnants among our Spitzer sample of galaxies with directly measured black hole masses. These are NGC 1194 and NGC 5018, an S0 galaxy whose black hole mass was only recently acquired by Saglia et al. (2016). Sahu et al. (2019b) commented on a faint debris tail in NGC 1194, a galaxy which displays a prominent dust lane somewhat reminiscent of that seen in NGC 1316 and NGC 5128. Fedorova et al. (2016) explored but could not confirm the presence of two BHs in this galaxy. In NGC 5018, the brightest galaxy within the NGC 5018 Group, there are multiple dust lanes in addition to stellar shells and tidal debris (Buson et al., 2004; Kim et al., 2012; Spavone et al., 2018, and references therein).
We noticed that all five of the clearly merger-built galaxies in our sample (NGC 1194, NGC 1316, NGC 2960, NGC 5018, and NGC 5128) reside close to each other in the - diagram and the - diagram, where they sit at the low-mass end of the elliptical galaxy sequence (Fig. 1). They have spheroid masses larger than the other (less gas-rich) S0 galaxies hosting a similar mass black hole. While not on the - relation for elliptical galaxies, they have larger sizes than the spheroidal component of the other (relatively gas-poor) S0 galaxies hosting a similar mass black hole (Fig. 1, left-hand panel).
The red coloured track in the middle of Fig. 1 shows how an equal-mass spiralspiral galaxy merger could explain the location and movement of the above five bulges in the - diagram. The associated shift in the - diagram stems from the expected movement along the tight - relation (Graham & Sahu, 2022, their Fig. 7). While the black hole mass in this example merger (red track) has roughly doubled, the spheroid mass has increased four-fold. The spheroid mass can more than double depending on how much of the pre-existing disc stars contribute to the new galaxy’s bulge. The current example could represent the merger of two spiral galaxies with bulge-to-total, , stellar mass ratios equal to 1 to create an S0 with . That is, half of the stars in the new bulge came from what was disc material, and the other half came from what was pre-existing bulge material. Of course, other scenarios are possible, such as a collision involving an S and an S0 galaxy with different ratios and fractions of discs stars making it into the merger product’s bulge.
Wet mergers are expected to be accompanied by star formation and AGN fueling (e.g., Joseph & Wright, 1985; Di Matteo et al., 2007), which the ‘quasar mode’ of galaxy/(black hole) coevolution tries to capture (Kauffmann & Haehnelt, 2000; Di Matteo et al., 2005; Croton et al., 2006; Silk, 2013). In Fig. 1, we only show the jump (punctuated equilibrium) in growth from the (dissipationless component of the) merger and not the movement arising from star formation and AGN feeding. However, ‘quasar mode’ activity may ultimately progress the systems further along the - distribution for either S galaxies or perhaps the relatively (cold gas)-poor S0 galaxies. Here, we recast this term (quasar mode) to encapsulate black hole growth from (i) the subsequent binary black hole merger and (ii) accretion — as per the original definition — and for spheroid growth from (i) the merger of the pre-existing spheroids, (ii) the fraction of pre-existing disc stars converted into the new spheroid, and (iii) the fraction of cold gas that underwent star formation to create new spheroid stars. Collectively, this is more complicated than the simple prescriptions given to date (e.g., Graham & Scott, 2013, their Equation 6). One also needs to resolve where these wet mergers ultimately end up, that is, do they remain on the E sequence or evolve to the S or S0 sequence depicted in Fig. 1.
The above type of merger event introduces a deviation to the general picture presented in Graham & Sahu (2022), in which, at a given spheroid stellar mass, the bulges of S0 galaxies have an ratio that is an order of magnitude greater than that in E galaxies. We now have a situation where, at a given spheroid stellar mass, the relatively (cold gas)-poor S0 galaxies have an ratio roughly an order of magnitude greater than that in S0 galaxies built by wet mergers. The presence/absence of hot gas versus cool gas and dust in these S0 galaxies helps discriminate their origin. For example, the core-Sérsic S0 NGC 5813 is immersed in a hot gas halo (Randall et al., 2015) that keeps star formation at bay, while the Sérsic S0 NGC 5128 is rich in cool gas and dust (e.g., Hawarden et al., 1993). The latter is clearly formed from a gas-rich merger, and the partially-depleted core in the former is thought to suggest a relatively dry merger origin.
Like the merger-built elliptical galaxies, these (wet merger)-built bulges roughly follow the same - relation as the elliptical galaxies. However, as noted above, we have not yet incorporated any black hole or bulge growth due to gaseous processes. Conceivably, the AGN may be about to experience a Seyfert/quasar growth spurt and return the system to the - relation traced by the relatively (cold gas)-poor S0 galaxies, in accord with trends seen in some simulations (e.g., Anglés-Alcázar et al., 2017; Bower et al., 2017; McAlpine et al., 2018; Tillman et al., 2022). As with tidal interactions which disturb the HI gas reservoir and ignite AGN (Kuo et al., 2008), minor and major mergers can also liberate HI and HII gas from their Keplerian merry-go-round (Hernquist, 1989; Hernquist & Mihos, 1995). For an S galaxy with and (e.g., Graham & Sahu, 2022), it does not take an unrealistic amount of cold gas to boost and thus . For example, if gas amounting to 0.1 per cent of the galaxy’s stellar mass were accreted onto the black hole, it would boost by an order of magnitude.
Tillman et al. (2022, their Fig. 1 and references therein) present a scenario which may reveal the fate of the S0 galaxies built from wet mergers. Having exceeded a critical (galaxy stellar) mass threshold, where supernova also becomes less effective at clearing away potential fuel for the AGN, the mergers may experience a rapid burst of AGN accretion capable of growing the black hole by a couple of orders of magnitude. Even if star-formation were to double the spheroid’s stellar mass, this AGN spurt would more than compensate for the observed disparity between the (cold gas)-rich and the relatively (cold gas)-poor S0 galaxies in the - diagram. Although, as alluded to by Kauffmann & Haehnelt (2000), in an evolving Universe in which galaxies are less (cold gas)-rich, the uptick in the - diagram today may not be as pronounced as it perhaps was in the younger Universe. As lower-mass spiral galaxies dry up over time, perhaps due to ram-pressure stripping from their environment or strong supernova feedback which inhibits the growth of the spheroid, they too may evolve along a more upward trajectory in the - diagram, bringing them onto the distribution seen for the relatively (cold gas)-poor S0 galaxies.
While the above wet mergers reveal that not all S0 galaxies are faded spiral galaxies, some may be if (cold gas)-rich disc galaxies evolve (and fade) in a primarily upward direction in the - diagram. Of course, this would also mean that some S0 galaxies may be faded, merger-built S0 galaxies. This could mesh with the observation that while massive S0 galaxies consist of old stars — and as we will see in the following section, some of these have likely been built by dry mergers — the less massive S0 galaxies can have a broader range of stellar ages (Barway et al., 2013; Bait et al., 2017; Rathore et al., 2022).


We note that the - diagram from the SIMBA simulation (Davé et al., 2019, their Fig. 13), when coloured according to the (galaxy) specific star formation rate, shows a promising correlation with what is expected given the galaxy types shown in Figures 2 and 3. This agreement, at least at , is even more evident in Fig. 4 from Habouzit et al. (2021). The merger-induced jump, explained in Graham & Sahu (2022), from the non-(star-forming) S0 galaxies defining the left-hand envelope of points across to the E galaxies is even more pronounced in the - diagram (Fig. 2, left-hand side).
If not for the ES,b and S0 galaxies (the green and cyan squares in Fig. 3), there would be a notably tighter - relation.111111Removal of the ES,b and S0 galaxies also reduces the scatter in the - and - diagrams (Figure 2. If the ES,b galaxies were to acquire a large-scale disc and thus have a higher disc-to-bulge stellar mass ratio more typical of S0 galaxies, they would reside closer to the E galaxies. This makes us wonder if some of the S0 galaxies, specifically the cyan points on the left-hand side of the distribution in Fig. 3, may have reduced disc-to-bulge ratios. Might they perhaps reside in clusters, where S0 galaxy disc scalelengths are known to be smaller (e.g., Gutiérrez et al., 2004), perhaps due to cluster-hindered growth from ram pressure stripping of gas (e.g., Gunn & Gott, 1972; Yagi et al., 2010; Merluzzi et al., 2013) or tidal stripping of disc stars (Moore et al., 1996) which build the intracluster light (ICL). The BCGs aside, the high galaxy velocities in clusters will act to hinder collisions, thereby preventing some systems from moving across to the right in the - diagram. Supernovae and stellar winds (e.g., De Loore et al., 1977; Björklund et al., 2022) may also reduce the stellar mass, while a final burst of quasar fuelling might drive the systems up in the - diagram before they ‘dry out’. In future work, the S0 galaxies will be studied in more detail, as will the addition of intermediate mass black hole (IMBH) candidates (e.g., Chilingarian et al., 2018; Graham et al., 2019; Mezcua & Domínguez Sánchez, 2020).
With an eye to collisions involving supermassive black holes, Fig. 4 may offer some guidance for simulations and predictions for the stochastic background of long-wavelength gravitational radiation. Due to the clutter in Fig. 4, it was felt that a less adulterated version (Fig. 3) should be included. Although the number of data points is still low, it appears that the merger-built lenticular galaxies broadly partake in the same distribution as the elliptical galaxies.121212Curiously, one can also see how removing the cyan points, i.e., the possibly (non-merger)-built S0 galaxies, will result in a notably tighter - relation. This will be pursued in a future paper. This observation may be of practical use if (i) all (major merger)-built galaxies in the - diagram follow the same relation and (ii) no bulge/disc/etc. decomposition is required. To date, obvious mergers have been excluded from the scaling relations, and it has frequently been emphasised that black holes correlate with spheroid mass rather than galaxy mass (e.g., KH13). However, a merger-built galaxy relation represents the ‘end product’ of major mergers generating nanohertz gravitational waves (e.g., Burke-Spolaor et al., 2019). Fig. 4 may reveal how elliptical galaxies are built from dry mergers involving lenticular galaxies on the (cold gas)-poor S0 ‘sequence’131313This ‘sequence’ is perhaps more of an elongated cloud until lower mass S0 galaxies are included. while relatively (cold gas)-rich S0,pec galaxies are built from wet mergers. This broad merger-built galaxy relation has not been presented before and has a steeper slope than 1.690.17 defined by just the E galaxies in Graham & Sahu (2022). It is instead roughly such that
| (1) |
with when using stellar mass-to-light ratios that are consistent with Graham & Sahu (2022, their Equation 4), which is based on the models of Into & Portinari (2013) and a Kroupa (2002) initial mass function. Equation 1 is shown by the grey line in Fig. 4.
3.1.1 Alleged pseudobulges
Kormendy (2001) initially reported that classical and pseudobulges follow the same relation. Graham (2007a) and Graham (2008) observed that barred galaxies, often associated with pseudobulges (e.g., Gadotti, 2011), appeared offset from the relation defined by the non-barred galaxies in the - diagram (Ferrarese & Merritt, 2000; Gebhardt et al., 2000). This was the first paper to report on potential morphology-dependent substructure in the black hole scaling diagrams. Hu (2008) reported a morphology-dependence in terms of classical bulges versus pseudobulges; although all of their alleged pseudobulges were barred galaxies, (see also Gadotti & Kauffmann, 2009). Kormendy et al. (2011) subsequently embraced this notion of an offset population of pseudobulges with low black hole masses relative to their bulge mass, while Graham et al. (2011) continued to favour an offset population of barred galaxies with elevated velocity dispersions — a reported feature of barred galaxies (Gadotti & de Souza, 2005; Hartmann et al., 2014; Brown et al., 2013; Debattista et al., 2013).
Complicating matters was that the problematic identification (Graham, 2014) of pseudobulges is a subjective practice leading to classification disagreements in the literature, as noted in, for example, Davis et al. (2017, their Section 4.1). Furthermore, some galaxies (e.g., NGC 2787, NGC 3368, NGC 4371 and NGC 4699) are claimed to have both types of bulge (e.g., Erwin et al., 2003; Erwin et al., 2015; Gadotti et al., 2015), and simulations have shown how this can occur (e.g., Athanassoula et al., 2016). Our use of multicomponent decompositions circumvents many instances of pseudobulge confusion because the alleged pseudobulge, whether an inner disc or (peanut shell)-shaped structure associated with the bar, is captured, modelled, and not considered the bulge. For example, as seen in Appendix A, we remodel NGC 2787 by introducing a truncated-exponential for the inner disc, i.e., the purported pseudobulge in this galaxy (Erwin et al., 2003). We also remodelled NGC 4699, whose previous ‘pseudobulge’ was a conglomeration of the bar, spiral arms, and disc (Erwin et al., 2015), none of which we consider to be the ‘bulge’ component. In addition, as noted earlier, boxy/X/(peanut shell)-shaped perturbations arising from bar instabilities, and labelled as pseudobulges by some, are not treated as bulges in our image analysis (except, of course, for those we have undoubtedly, inadvertently, over-looked).
Over time, as the sample size increased, the picture cleared, and Sahu et al. (2019b) revealed that not all barred galaxies are offset to higher velocity dispersions. All bulges appear to follow the same - relation, at least until higher masses where the relation steepens (Bogdán et al., 2018), perhaps associated with the onset of partially depleted cores (Sahu et al., 2019b) or for virialisation issues that will be dealt with in a subsequent paper. Now, neither the barred galaxies nor the alleged pseudobulges appear to form an offset population with low in the - diagram.
KH13 (their Table 3) excluded roughly half (22/43) of the bulges in their parent sample, deeming them ‘pseudobulges’ rather than ‘classical’ bulges. In passing, we clarify that KH13 excluded an additional four ‘classical’ bulges (NGC 1277, NGC 3998, NGC 4342 and NGC 4596), therefore explaining why their bulge sample used for their linear regression was reduced to 17 rather than 21, i.e., they used 40 per cent of the parent sample of 43 bulges. Of these four classical bulges, they rightly avoided using NGC 1277 at that time. The ratio in their table was later shown to be too high by two orders of magnitude (Graham et al., 2016b), and the system is no longer considered unusual. This galaxy was not a part of our Spitzer sample in Sahu et al. (2019a); however, we plot it in Fig. 2, where it appears that the ratio used to obtain the spheroid mass may be too high. This ratio is revisited in the following subsection. Finally, NGC 4342 is a stripped galaxy (Blom et al., 2014) that we also exclude from the Bayesian linear regression analysis in Graham & Sahu (2022) but plot in Fig. 1. We do, however, include NGC 3998 (de Francesco et al., 2006; Devereux, 2018) and NGC 4596 (see Section 3.3).
In effect, KH13 (see their Fig. 21) exclude all but four systems with black hole masses less than M⊙ (plus four alleged pseudobulges with (3–8) M⊙). Not surprisingly, with their select pseudobulge sample spanning just 1.2 dex (NGC 4395 aside), they reported the absence of any correlations among that sample. However, as revealed in, for example, Fig. 2, these low-mass systems are involved in strong correlations.
Although we have tried to be inclusive, we, too, have a sample selection at play, such that spiral galaxies with apparently small bulges are excluded. Specifically, 13 spiral galaxies whose bulge required a spatial resolution better than the Spitzer Space Telescope could provide have not been included because their galaxy analyses was performed on Hubble Space Telescope F814W images, for which we may not have a consistent prescription for . However, it is thought that this exclusion of the, in general, more distant spiral galaxies is not introducing a bias, given that the near-quadratic - relation obtained using the sample of spiral galaxy bulges with Spitzer data (Graham & Sahu, 2022) is consistent with that obtained from the fuller sample of spiral galaxy bulges containing the above exclusions Davis et al. (2019). Furthermore, it is noted in passing that galaxies with a direct black hole mass measurement do not represent a biased sample, in the (galaxy stellar mass) –(central velocity dispersion) diagram, with respect to those not having a direct measurement (Sahu et al., 2022). In addition, the overlapping agreement seen in the spheroid size-mass diagram for samples with and without a direct black hole mass measurement (Hon et al., 2022b) also reveals no sample selection bias. As such, neither the -, -, nor - relations are thought to be biased. However, both bulge- and disc-dominated galaxies with low surface brightness discs (e.g., Graham & de Blok, 2001) but galaxy stellar masses comparable to those seen in Figures 3 and 4 are absent.
3.2 Spheroids at the top of the bulge sequence
As discussed in Graham & Sahu (2022), massive compact spheroids from ‘relic galaxies’ — largely unevolved, compact massive galaxies, aka ‘red nuggets’ from with M⊙, kpc, and a red colour characteristic of a quiescent non-starforming stellar population (Daddi et al., 2005; Damjanov et al., 2009; Hon et al., 2022a, and references therein) — tend to reside near the top of the bulge sequence in the - diagram. Examples are the ES,b galaxies NGC 1332 and NGC 5845 listed in Table 1. Other examples, albeit without our uniform analysis of a Spitzer image, include Mrk 1216 (, D=40.7 Mpc, Yıldırım et al., 2015) with (, Savorgnan & Graham, 2016b), NGC 1271 (, Walsh et al., 2015) with (, Graham et al., 2016c), and NGC 1277 with (central , Martín-Navarro et al., 2015) and a likely upper limit to the black hole mass of M⊙ based on high spatial resolution (adaptive optics)-assisted Keck/osiris data (Graham et al., 2016b). Looking at Fig. 2, the spheroid mass for NGC 1277 seems some three times higher than expected from the distribution of the other ES,b galaxies. Although Martín-Navarro et al. (2015, their Fig. 6) suggest a lower from 0.7 to 1.4 , this would only reduce the spheroid mass by one-third. It would require to yield a two-third reduction giving the speculated factor of three shift.
NGC 5252 (, Capetti et al., 2005), with (Sahu et al., 2019a), is thought to represent a (possible relic) compact massive spheroid that has acquired a large-scale disc rather than an intermediate-scale disc (see Graham et al., 2015, and references therein). It is the S0 galaxy with the highest black hole mass among the S0 galaxies in our sample and is thought to represent a good example of the two-step scenario introduced141414First posted on arxiv.org in 2011. by Graham (2013) in which discs grow in and around pre-existing ‘red nuggets’. The potential binary black hole in this galaxy would be further evidence of a past accretion event (Yang et al., 2017).
NGC 6861 is an ES,b galaxy likely to cause some confusion, assuming we have assigned the correct designation. While it appears to have grown/accreted an intermediate-scale disc (Sahu et al., 2019a), there is still a dusty disc in this galaxy, at odds with what the term ‘relic’ might conjure for some. It is. however, a galaxy that may have been left behind in an evolutionary sense, having not acquired a substantial disc mass.
3.2.1 Bulges with core-Sérsic profiles
Dry galaxy mergers building ‘fast rotators’, specifically S0 disc galaxies (e.g., Krajnović et al., 2013), are readily explained in simulations (Naab et al., 2014). The S0 galaxies with partially depleted cores have likely been built by inspiralling black holes in relatively dry mergers (Ebisuzaki et al., 1991), whereas relic red nuggets are not expected to have depleted cores, nor are S0 galaxies built from wet mergers, like NGC 5128, which may yet evolve upward in the - diagram to eventually join the (cold gas)-poor S0 galaxies, or perhaps the (cold gas)-poor S0 galaxies have been frozen in time, reflective of how things scaled long ago.
The core-Sérsic S0 galaxies in our sample do not appear to reside on the elliptical galaxy sequence in the - diagram. This is expected when the merger event does not fold in much of the progenitors’ disc mass. It would not, however, be unreasonable to expect (as more data becomes available) a continuum — based on the amount of disc mass converted into bulge mass — of relatively dry merger remnants bridging the left- and right-hand sides of the distribution seen in Fig. 2.
Five core-Sérsic S0s are identified in Sahu et al. (2019b). They are NGC 524, NGC 584, NGC 3796, NGC 4751 and NGC 5813, with the first and last galaxies appearing in our Spitzer sample. These two have been identified in Fig. 2. Their location can, once again, be explained by a merger in which the net orbital angular momentum of the pre-merged progenitor galaxies — themselves likely to be lesser lenticular galaxies — is not cancelled. It is worth reiterating that these core-Sérsic galaxies with large-scale discs are not thought to have formed from an overly gas-rich dissipative merger event, otherwise the depleted stellar core may not have formed. This would imply that the ‘quasar mode’ of galaxy/AGN growth did not dominate the construction of the spheroid in these disc galaxies. Although, dust is evident151515See the ‘level 4’ colour images available from the Hubble Legacy Archive (HLA: https://hla.stsci.edu). in NGC 524, with its dusty spiral arms/rings, and in NGC 5813, and thus there was some gas and past star formation. Furthermore, at least in NGC 5813, nuclear dust may complicate the identification of the depleted core, an issue highlighted in two other galaxies by (Bonfini et al., 2018).
Galaxies without cold gas, especially those of high-mass embedded within a hot gas halo (Ponman et al., 1994; Pellegrini, 2005, e.g.,), would be expected to evolve further only through mergers. The ‘hot mode’ / ‘radio mode’ activity maintained by the central ‘Benson burner’ (a term introduced by Graham & Sahu, 2022, see their footnote 33) in these galaxies performs a maintenance, rather than an evolutionary, role that keeps a galaxy ‘dry’, by which we mean essentially free of cold gas capable of forming stars. However, significant ‘cold stream’ inflows from the intergalactic medium could infiltrate the galaxy and begin to build a new or grow an existing disc (Kereš et al., 2005; Dekel et al., 2009; Bouché et al., 2013).
One significant difference between the merger of low- and high-mass disc galaxies is that the pre-merged low-mass galaxies will have smaller ratios, and thus, there is greater scope for larger fractional increases in the bulge mass of the post-merger end-product. This is reflected by the longer horizontal arrow of the middle red track in Fig. 1 relative to the upper red track in this figure.
| Galaxy | Type | Ref | Notes | |||||
| kpc | ||||||||
| NGC 0821 | ES,e | 7.59 | 0.00056 | 0.40 | 3.5 | 5.2 | Fig. 8 | |
| NGC 1275 | ES,e | 8.88 | 0.0021 | 0.016 | 17.4 | 4.3 | SGD19 | cD, ES,pec. with undigested component. |
| NGC 3377 | ES,e | 7.89 | 0.0039 | 0.39 | 2.3 | 4.5 | Fig. 12 | Offset in some diagrams |
| NGC 3414 | ES,e | 8.38 | 0.0027 | 0.80 | 3.0 | 4.5 | SG16 | ES,pec. with a polar ring possibly building a disc. |
| NGC 3585 | ES,e | 8.49 | 0.0013 | 0.11 | 8.0 | 6.3 | SG16 | High-rotation (Scorza & Bender, 1995). |
| NGC 3607 | ES,e | 8.16 | 0.00054 | 0.13 | 7.9 | 5.6 | SG16 | |
| NGC 4473 | ES,e | 8.07 | 0.0021 | 0.69 | 2.7 | 2.9 | SG16 | Two counter-rot. inner discs. |
| NGC 4552 | ES,e | 8.67 | 0.0046 | 0.19 | 5.1 | 5.4 | SGD19 | Inner ring and undigested component. |
| NGC 4621 | ES,e | 8.59 | 0.0022 | 0.09 | 7.6 | 8.8 | SG16 | M59. |
| NGC 4697 | ES,e | 8.26 | 0.0015 | 0.015 | 12.2 | 6.7 | SG16 | BGG in NGC 4697 Group. |
| NGC 1332 | ES,b | 9.15 | 0.010 | 4.99 | 1.9 | 3.7 | SG16 | Maybe an S0 (Rusli et al., 2011). |
| NGC 3115 | ES,b | 8.94 | 0.012 | 4.75 | 1.6 | 5.1 | SG16 | |
| NGC 5845 | ES,b | 8.41 | 0.014 | 17.4 | 0.6 | 3.3 | SGD19 | |
| NGC 6861 | ES,b | 9.30 | 0.017 | 1.59 | 2.6 | 3.5 | SGD19 |
These tabulated ES galaxy types may reflect the galaxies’ history. They are based on the ratio, the spheroid’s stellar density, , within the spheroid’s effective half light radii, , and the galaxy appearance (not to be confused with the spheroid Sérsic index, , shown here for completeness). The parameters are sourced from Graham & Sahu (2022). ES,e: galaxies may be akin to merger-built E galaxies but with an inner intermediate-scale disc. NGC 4594 also belongs to this type. ES,b: galaxies can be thought of as bulges which did not grow up: relic ‘red nuggets’ which did not accrete a large-scale disc. The values and pertain to the equivalent-axis, i.e., the geometric-mean axis, and have the usual meaning (e.g., Caon et al., 1993; Graham & Driver, 2005), with half the spheroid’s light contained within . The external references showing our decompositions of the galaxy light are: SG16 = Savorgnan & Graham (2016a); SGD19 = Sahu et al. (2019a).
3.2.2 Massive ES galaxies
There has been a tendency to misidentify ES galaxies in the literature. They can be dwarf galaxies (Graham et al., 2012; Graham et al., 2017) or massive galaxies (Savorgnan & Graham, 2016b). Their discs are often missed, and the galaxies are modelled with a single Sérsic function. Or, when the disc is detected, they tend to be modelled as large-scale discs, dominating the light at large radii. However, ES galaxies have intermediate-scale discs, with the spheroid dominating the light at large radii (Liller, 1966; Savorgnan & Graham, 2016b). Just as the E and S0 classification does not apply to them, neither do the terms ‘slow rotator’ or ‘fast rotator’. ES galaxies are both fast and slow rotators depending on the radial range sampled (Bellstedt et al., 2017). Both wet and dry mergers can build fast rotators if the net angular momentum is not nulled, and it stands to reason that both types of mergers can build ES galaxies. As described in Graham & Sahu (2022), the slow rotating E galaxies appear to be built from dry mergers involving ES and S0 galaxies with larger ratios.
In Graham & Sahu (2022), our focus was on the broad division between bulges and merger-built E galaxies. Half a dozen ES galaxies (NGC: 821; 3377; 3607; 4473; 4621; 4697) were modelled as such, i.e., as ES galaxies, but treated as E galaxies (with inner discs) for consistency with the designations in Sahu et al. (2019a). The ES galaxies in our sample have spheroid-to-total flux ratios from 0.8–0.85 to 0.95. Here, with our higher resolution investigation of the - diagram, in which we attempt to read the proverbial tea leaves and go beyond the first-order divisions reported by Sahu et al. (2019a), we look more closely at the ES galaxies (listed in Table 1) and their possible subdivision.
There appears to be two types of ES galaxies with an intermediate-scale disc. One of these are the relic ‘red nuggets’ (e.g., Ferré-Mateu et al., 2017) from the high- Universe that have evolved little and not accreted a substantial disc (Section 3.2), designated here as ES,b. They may be expected to reside at the top of the bulge sequence in the - diagram. Somewhat midway between core-Sérsic S0 galaxies and disc-less elliptical galaxies are merger-built ES,e galaxies. They may have transformed more of their progenitor galaxies’ disc stars into a spheroid than was achieved with the merger-built S0 galaxies, i.e., the core-Sérsic S0 galaxies, but did not achieve the high conversion level required to become an E galaxy. Many of the examples in Table 1 have previously been identified as “disc elliptical” (Scorza & Bender, 1995, their Table 1). We summarise this as follows.
(i) ES,e: merger-built, near-elliptical galaxies with partial disc formation. These spheroids and galaxies are not expected to be compact ( kpc) in size like ’red nuggets’ and can be considered more in the E galaxy camp than the bulge camp. They will have reduced ratios due to the pre-merged galaxies’ disc stars bolstering the spheroid mass of the merger-built galaxy.
(ii) ES,b: relic ‘red nuggets’ with partial disc accretion. These spheroids should still be compact and can be considered more in the bulge camp than the E galaxy camp. They will be the rare compact massive systems largely unevolved since , such as NGC 1277 (Trujillo et al., 2014; Graham et al., 2016b). NGC 3115 (Oort, 1940; Arnold et al., 2011), with kpc and (Graham & Sahu, 2022) may be another example. In this case, it may be a ‘red nugget’ which experienced a single minor merger with a small spiral galaxy that created the intermediate-scale disc. Compared to the ES,e systems, the ES,b spheroids may have higher stellar densities within their half-light radii (see Table 1).

In Fig. 5, we show the stellar density of the ES and other galaxy types in the - diagram. This figure is a variant of Fig. 11 in Sahu et al. (2021)161616Note: Sahu et al. (2021, see their Table 2) use the density within the internal half light radius and within a sphere of radius equal to the projected half-light radius., which showed the - diagram for the E, ES/S0 and S galaxy types. Sahu et al. (2021) additionally present results in terms of the internal density and the projected density, aka ‘compactness’, as a function of the radius used to measure these enclosed densities. Fig. 5 shows that the most compact spheroids do not host the most massive black holes. Instead, such black holes are found in the most diffuse spheroids, the giant E galaxies built from mergers. The most diffuse spheroids also tend to reside to right of the E galaxy sequence.
3.3 Brightest cluster galaxies
We already have key insight into the morphogenesis and ontogeny of spheroids. For example, S0S0 unions may create E galaxies, branching off from the - relation. Indeed, major dry mergers in which the large-scale angular momentum is erased will produce elliptical galaxies (Naab et al., 2006b). Graham & Sahu (2022) noted that a single S0 merger is sufficient to explain the average offset of the elliptical galaxies in the - diagram (Sahu et al., 2019a). Some BCGs have likely formed from the merger of E galaxies. Such an equal mass merger would roughly double both the black hole and spheroid mass, thereby forming an offshoot in the scaling diagram following a trajectory with a slope of 1.
Some massive E galaxies may have suffered such extensive erosion by infalling perturbers (Goerdt et al., 2010) and supermassive black holes (Merritt & Milosavljević, 2005) that it has fundamentally re-shaped the remnant galaxy to yield a system well described by a low- Sérsic profile. Indeed, some cD galaxies at the centres of clusters are likely built by multiple mergers, evidenced by multiple bright nuclei in the same system. They are sometimes seen to consist of a low- spheroid surrounded by intracluster light with a tendency to have an exponential light profile (Seigar et al., 2007). Systems involving such a halo are referred to as cD galaxies.
As Graham & Sahu (2022) illustrated, in terms of ratios, the E galaxies represent a population built by mergers. The super-linear - relation observed for brightest group galaxies (BGGs) and BCGs by Bogdán et al. (2018) is understood here in terms of mergers which built the offset E galaxy sequence (Sahu et al., 2019a). By definition, they do not contain substantial discs or significant rotation. With BCGs and BGGs representing systems that may have experienced the highest number of mergers, here we check if they occupy a distinct region of the - and - diagram.
In Table 2, we identify the BCGs and BGGs in our sample. If they are a known cD galaxy, this is also reported. Our imaging data may not have always been deep/extended enough to capture the contribution from the ICL. For four of the six cD galaxies, we did not detect the presence of the ICL. This non-detection is only a problem if there is an ICL component that has influenced a portion of the outer-light profile included in the galaxy decomposition work. Within the - diagram, we do not detect a separation of BCG/BGG from the non-(BCG/BGG) elliptical galaxies. While there is likely benefit to be had by acquiring and investigating new deep images of the cD galaxies in our sample, such an undertaking is beyond the intended scope of the present research project.
The galaxy with the largest directly measured black hole is Holm 15A, with an adopted distance modulus of 37.02 mag. Holm 15A is an intriguing galaxy which was initially reported to have a vast 4.570.06 kpc depleted core (López-Cruz et al., 2014) which was later queried by Bonfini et al. (2015) and Madrid & Donzelli (2016). Although lacking a noticeable downward break in its light profile, it is conceivable that this galaxy has been so heavily eroded that what may have once been a high Sérsic index galaxy now resembles a low Sérsic index system with no discernable break in its light profile. To distinguish this potential scenario from the less severe core depletion seen in many big spheroids, we coin a new phrase and refer to such dramatic reshaping as ‘galforming’, in a somewhat similar vein to the term terraforming. Other brightest cluster galaxies, such as NGC 5419 (Table 2), NGC 4874 in the Coma cluster and UGC 9799 (not in our sample), are also known to display this behaviour of an unusually low Sérsic index for their luminosity, embedded in a halo of intracluster light (Seigar et al., 2007). NGC 4472 (M49), the brightest galaxy in the Virgo B subcluster, has also been reported to have an unexpectedly low Sérsic index (Dullo & Graham, 2014, their Appendix C).171717According to Sandage & Tammann (1981), NGC 4472 is an S0 galaxy. From photometry, Laurikainen et al. (2011) fit a large-scale exponential function which dominates the light beyond 100, although we wonder (but have not explored) if this might be a halo of ICL given that other works regard NGC 4472 as an E galaxy.
Mehrgan et al. (2019) report for Holm 15A. Presumably, when measuring the brightness of BCGs, one needs to exclude the ICL, which belongs to the cluster, rather than the BCG. This was done by Bonfini et al. (2015), who reported a CFHT -band magnitude of 13.8 mag (AB system). Using mag, and adopting an ratio of 31, gives a stellar mass . On the other hand, Mehrgan et al. (2019) include the ICL and adopt an ratio of 4.50.19 to report a galaxy+ICL stellar mass of , six times larger than the galaxy stellar mass reported by Bonfini et al. (2015). While this places it smack on the super-linear - relation for elliptical galaxies, the inclusion of the ICL appears questionable.
Finally, we note that KH13 excluded NGC 4889 (Coma) and NGC 3842 (Leo) due to these galaxies’ high black hole masses relative to the near-linear - relation in KH13. However, these galaxies do not have an over-massive black hole relative to the morphology-dependent, super-linear - relations from Graham & Sahu (2022), and we do not exclude them. KH13 also excluded NGC 1316, NGC 3607, NGC 4261 and IC 4296 (Abell 3565-BCG) from their regression. They also did not have NGC 1275 and NGC 5419 in their sample. As such, they only used 6 of the 14 galaxies listed in Table 2.
| Galaxy | Type | ICL fit | Ref | Morphology | Parent group/cluster. | |
| IC 4296 | BCG | no | 3.8 | SGD19 | Elliptical | Abell 3565 Cluster. |
| NGC 1275 | BCG,cD | no | 4.3 | SGD19 | Ellicular pec. (ES,e) | Perseus Cluster. |
| NGC 1316 | BCG | no | 1.8 | SG16 | Lenticular pec. | aka Fornax A. Fornax Cluster. |
| NGC 1399 | cD | yes | 10.0 | Fig. 8 | Elliptical pec. | 2nd brightest in Fornax Cluster. |
| NGC 3842 | BCG | no | 8.2 | SG16 | Elliptical | Leo Cluster. |
| NGC 4472 | cD | no | 5.4 | SG16 | Elliptical/S0? | aka M49 and Virgo B. 2nd brightest in Virgo Cluster. |
| NGC 4486 | BCG,cD | no | 5.9 | SG16 | Elliptical pec. | aka M87 and Virgo A. Virgo Cluster. |
| NGC 4889 | BCG,cD | no | 6.8 | SG16 | Elliptical (rare E4) | NGC 4874/4889 Coma Cluster. |
| NGC 5419 | BCG,cD | yes | 2.6 | Fig. 15 | Elliptical | Abell S0753 Cluster. |
| NGC 7768 | BCG | no | 6.7 | SG16 | Elliptical | Abell 2666 Cluster. |
| IC 1459 | BGG | no | 7.0 | SGD19 | Elliptical | IC 1459 Group (N=16). |
| NGC 0524 | BGG | no | 2.2 | SGD10 | Lenticular | NGC 524 Group (N=16). |
| NGC 1332 | BGG | no | 3.7 | SGD19 | Ellicular (ES,b) | NGC 1332 Group (N=22) in Eridanus Cluster. |
| NGC 1407 | BGG | no | 3.9 | SGD19 | E with undigested cpt | NGC 1407 Group (N=25) in Eridanus Cluster. |
| NGC 3031 | BGG | no | 3.5 | DGC19 | Spiral (SAab) | aka M81. NGC 3031 Group (N=30). |
| NGC 3091 | BGG | no | 6.6 | SGD19 | Elliptical | Hickson Compact Group No. 42. |
| NGC 3368 | BGG | no | 1.0 | DGC19 | Spiral (SABab) | aka M96. M96 Group, aka Leo I Group. |
| NGC 3379 | BGG | no | 5.3 | SG16 | Elliptical | aka M105. NGC 3379 Group (N=27). |
| NGC 3607 | BGG | no | 5.6 | SG16 | Ellicular (ES,e) | NGC 3607 Group (N=31), Leo II Group, equal brightest (Karachentsev et al., 2015). |
| NGC 3608 | BGG | no | 5.7 | SG16 | Elliptical | Leo II Group, equal brightest. |
| NGC 3627 | BGG | no | 2.1 | DGC19 | Spiral (SABb) | aka M66. N3627 Group (N=16) in Leo II Group. |
| NGC 3665 | BGG | no | 2.7 | SGD19 | Lenticular | NGC 3665 Group (N=16). |
| NGC 3923 | BGG | no | 4.8 | SGD19 | Elliptical with shells | NGC 3923 Group (N=23). |
| NGC 4151 | BGG | no | 1.9 | DGC19 | Spiral (SABab) | NGC 4151 Group (N=16). Binary BH? (Bon et al., 2012). |
| NGC 4258 | BGG | no | 2.6 | DGC19 | Spiral (SABbc) | aka M106. NGC 4258 Group (N=15). |
| NGC 4261 | BGG | no | 4.3 | SG16 | Elliptical | NGC 4261 Group (N=87) (Davis et al., 1995). |
| NGC 4303 | BGG | no | 0.90 | DGC19 | Spiral (SABbc) | aka M61. NGC 4303 Group (N=23). |
| NGC 4501 | BGG | no | 2.8 | DGC19 | Spiral (SAb) | aka M88. NGC 4501 Group (N=31). |
| NGC 4552 | BGG | no | 5.4 | SGD19 | Elliptical | aka M89. NGC 4552 Group (N=12). |
| NGC 4594 | BGG | no | 4.2 | DGC19 | Spiral (SAa) or ES,e | aka M104. NGC 4594 Group (N=11). |
| NGC 4697 | BGG | no | 6.7 | SG16 | Ellicular (ES,e) | NGC 4697 Group (N=37). |
| NGC 5018 | BGG | no | 2.5 | SGD19 | Merger S0 pec. | NGC 5018 Group (N=9). (Hilker & Kissler-Patig, 1996). |
| NGC 5128 | BGG | no | 2.2 | SG16 | Merger S0 pec. | aka Cen-A. NGC 5128 Group (N=15). |
| NGC 5846 | BGG | no | 5.7 | SGD19 | Elliptical | NGC 5846 Group (N=74). |
| NGC 7582 | BGG | no | 2.2 | DGC19 | Spiral (SBab) | NGC 7582 Group (N=13). |
Column 2 indicates if the galaxy is the brightest in a group or cluster or a cD galaxy. Column 3 indicates if we (thought we needed to) fit for intracluster light, which is dependent on the surface brightness limit to which a galaxy is modelled. Column 4 lists the equivalent-axis Sérsic index. Column 5 provides the reference for the galaxy decomposition: SGD19 = Sahu et al. (2019a); SG16 = Savorgnan & Graham (2016a). Column 6 provides the galaxy morphology, and Column 7 gives the group/cluster identification (Osmond & Ponman, 2004; Makarov & Karachentsev, 2011) if the membership count is 10, along with an alternate galaxy name if it is also known as (aka) something else.
3.3.1 Exclusions
As noted above, KH13 excluded many BCGs from their regressions while we find that BCGs can naturally be included and explained in terms of mergers and morphology-dependent black hole scaling relations. In fact, KH13 excluded more than one-third (17/45) of the ’Elliptical galaxies” in their set. Six of these 17 (plus one S0 galaxy) appear to have been excluded because KH13 reported tentative evidence for the BH masses to be low in systems for which the black hole mass was measured using ionised emission lines but for which the width of the emission line was not taken into account. For two (NGC 4261 and NGC 7052), we have new BH mass estimates from the literature, as reported in Graham & Sahu (2022). For NGC 4459 (Krajnović et al., 2011), KH13 considered the galaxy to be an E rather than an S0 galaxy and consequently over-estimated the spheroid brightness. Adjusting for this, NGC 4459 is not an outlier in the - diagram, nor is the S0 galaxy NGC 4596, which KH13 recognised as such. The inclusion or inclusion of these two S0 galaxies has no significant impact on our results. This leaves Abell 1836-BCG (not in our sample), Abell 1836-BCG (=IC 4296, kept in our sample) and the giant elliptical galaxy NGC 6251, which we also keep with its active Seyfert 2 nucleus and a dusty nuclear disc (Crane & Vernet, 1997). NGC 6251 resides in the - diagram near NGC 1399 (the second brightest galaxy of the Fornax cluster). Given the cluster-centric location and high galaxy stellar mass of NGC 1399, it is highly plausible that it was built from a significant merger involving elliptical galaxies. As such, it can be expected to reside to the right of the distribution of elliptical galaxies built from the merger of lenticular galaxies. There is no additional folding in of disc mass in EE mergers; as such, they will migrate along a line with a slope of unity in the - diagram, thereby moving off and to the right of the steeper super-linear relation defined by the ensemble of elliptical galaxies. This assumes that most E galaxies in the ensemble are not the central dominant galaxy in a cluster and have thus presumably not experienced quite as active merger histories. Additional notes on galaxies that we have included but which KH13 excluded can be found in Appendix A.2.
For a century, astronomers have inadvertently overlooked, and thus excluded in their analysis, the presence of discs in ETGs. KH13 is no different and regards eight galaxies containing discs as E galaxies. In addition to NGC 4459 noted above, plus the five late-stage mergers mentioned in Section 3.1, KH13 also treated the S0 galaxies NGC 1374 (Sahu et al., 2019a) and NGC 2778 (Krajnović et al., 2011; Savorgnan & Graham, 2016a) as E galaxies, overestimating the spheroid mass by a factor of 2 and 4, respectively. KH13 additionally treat the ES galaxies NGC 1332, NGC 3377, NGC 3607, NGC 4473, NGC 4697, NGC 5845 and NGC 6861 (Table 1) as E galaxies, and thus they assign 5–25 per cent too much flux/mass to the spheroidal component of these seven galaxies.

3.4 Stripped and threshed galaxies
Soon after William Parsons181818William Parsons was the 3rd Earl of Rosse, Ireland, and is often referred to as Lord Rosse. discovered the first spiral nebulae (Rosse, 1850a, b), the tidal theory of Roche (1850) explained how a massive galaxy could gravitationally strip stars from a neighbouring galaxy. Alexander (1852) reasoned that the relatively stronger (weaker) gravitational force on the facing (opposing) sides of the galaxy would lead to two protrusions which would be drawn out into spiral-like arms if the galaxy rotated. Indeed, tidal arms and tails have since been modelled (e.g., Toomre & Toomre, 1972), and are well known (e.g., Brüns et al., 2000; Jarrett et al., 2006). It is the ongoing tidal-stripping which is thought to eventually pare away a galaxy’s disc, rather than the outskirts of a large E galaxy, to create a more dominant bulge (Bekki et al., 2001b), as seen in the ‘compact elliptical’ (cE) galaxies. If the bulge is not stripped, ignoring any black hole growth or spheroid mass loss due to stellar winds, the system will remain on the S0 - relation shown in Fig. 1. Ongoing stripping may pare away the bulge, leaving the more resilient nuclear star cluster to become a UCD galaxy, in a process referred to as threshing (e.g., Bekki et al., 2001a; Graham, 2020, and references therein). The migration from these processes is illustrated in Fig. 6, including the compact elliptical galaxies M32 and NGC 4486B, the stripped galaxy NGC 4342, and several UCDs. This pattern has been seen before, for example, Ferré-Mateu et al. (2021, their Fig. 7).
van den Bosch & de Zeeuw (2010) report for M32. Saglia et al. (2016, their Table 1) report based on from Magorrian et al. (1998), along with a -band Galactic extinction of 0.206 mag, and the use of rather than as reported by Magorrian et al. (1998). We depart from this mass estimate in two ways. First, the adopted mass-to-light ratio is probably too small for the ancient stellar population in M32 (Coelho et al., 2009), which has (de Vaucouleurs et al., 1991). The models of Schombert et al. (2022) suggest , which we reduce by , i.e., 0.1 dex, to give for a Kroupa (2002) initial mass function. Second, M32 is known to have a three-component structure (Graham & Spitler, 2009), including a weak disc (Graham, 2002) that was likely eroded by tidal-stripping (King, 1962; King & Kiser, 1973; Rood, 1965; Faber, 1973; Bekki et al., 2001b). As such, we reduce the galaxy luminosity by a factor of 0.62 (Graham, 2002) to obtain the spheroid luminosity. In so doing, we obtain a Galactic extinction corrected (: Schlafly & Finkbeiner, 2011) stellar mass for the spheroidal component of M32 equal to . This is just 35 per cent higher than the preferred derivation provided in Graham & Sahu (2022), which we use here.
Another well known cE galaxy is NGC 4486B, for which Magorrian et al. (1998) report and , giving . Saglia et al. (2016) report a higher value of , and , which we plot in Fig. 6 along with M32. While M32 may be the result of stripping much of the disc from an S0 galaxy while leaving the spheroidal component largely intact, NGC 4486B may have additionally had some of the spheroidal component removed.191919As revealed in Graham & Soria (2019, their Fig. 11), IC 3653 (not in our sample) is another galaxy which might be expected to have an elevated ratio due to tidal stripping if its bulge component has been depleted. However, confirming this would require further investigation. For example, while the S0 galaxy NGC 2787 appears to the left of the (cold gas)-poor S0 sequence in the - diagram, similar to NGC 4486B, it is not regarded as a tidally-stripped galaxy.
Although not a cE galaxy, the S0 galaxy NGC 404 also resides at the low-mass end of our scaling relations. NGC 404 is marginally consistent with the black hole scaling relations for the predominantly non-(star-forming) S0 galaxies, as seen in the lower left of the panels in Fig. 1. While most of the stars in NGC 404 are old, it does contain cold gas in its disc but only displays a declining tail of star formation in its outer disc (Williams et al., 2010; Bresolin, 2013). If NGC 404, or the dwarf ETG Pox 52 (Thornton et al., 2008)202020Pox 52 appears to have an AGN plus a two-component stellar structure. It may be a dwarf S0 galaxy with a disc and bulge, with the unsubtracted portion of the bulge visible in the residual image of Kim et al. (2017, their Fig. 11.50)., were to merge with a larger bulgeless LTG, the remnant might resemble the post-merger spiral galaxy NGC 4424 (Graham et al., 2021), which can be appreciated from Fig. 3. Although, we do caution that more, and reliable, data is needed at low masses before a secure picture can be established in the low-mass regime. Silk (2017) has argued that the presence of IMBHs may be a common feature of old dwarf galaxies. Unlike in low-mass LTGs, IMBHs may be hard to spot due to their expectedly lower Eddington ratios, possibly explaining the lower detection rates in ETGs than LTGs (Graham & Soria, 2019; Graham et al., 2019).

4 Summary
In Figures 6 and 7, we have tried to summarise key movements in the - diagram. As noted in Graham & Sahu (2022), elliptical galaxies built from the merger of (two) lenticular galaxies can produce a notable jump in this diagram due to folding all of the lenticular galaxies’ disc stars into the new elliptical galaxy. As was also revealed in Graham & Sahu (2022), these jumps are mirrored in the - diagram (see Fig. 1). Obviously, but perhaps worth stating, is that if these mergers occurred long ago, then lenticular disc galaxies, and their offset sequence from the elliptical galaxies in the scaling diagram, existed long ago. This has implications for observation-based evolutionary studies (e.g., Bennert et al., 2011; Ding et al., 2020), which would benefit from knowledge of the high- galaxies’ morphological type beyond simply ETG or LTG.
We looked for the signature of EE mergers by checking for a displaced population of brightest cluster (and group) galaxies relative to the general distribution of elliptical galaxies, but we did not observe a clear signal (Fig. 2). That is, our sample of BGGs/BCGs largely overlap with the location of non-(BGGs/BCGs) elliptical galaxies in the - diagram. This may reflect that not all BGGs/BCGs are built from a major EE collision.
We find tentative evidence for two types of ellicular galaxy: ancient compact systems which have not accreted a large-scale disc and less dense systems likely built by a substantial merger event (see Fig. 5. We also observe lenticular galaxies with partially depleted cores, likely built by a dry S0 galaxy merger, near the top of the S0 sequence, and relatively (cold gas)-rich lenticular galaxies built from a wet merger event, near the bottom of the merger-built elliptical galaxy sequence. Neither the (cold gas)-poor lenticular sequence nor the elliptical galaxy sequence are linear. As noted in Graham & Sahu (2022), they have a superlinear, or near-quadratic, slope of 1.6. These ETGs with discs are examples of mergers in which some of the orbital angular momentum from the pre-merged binary remains. Indeed, mergers which do not cancel the orbital angular momentum can result in the formation of S0 and ES galaxies (Barnes, 1992; Naab et al., 2006a). Figures 3 and 4 present the - diagram as a function of galaxy morphology, revealing the evolutionary pathways of galaxies and their black holes, mirroring the morphology-dependent sequences in the - diagram.
Building upon the Darwinian concepts of punctuated equilibrium and gradualism — introduced in Graham & Sahu (2022) to help explain the two dominant sequences seen in the - diagram — we start to present the beginning of what might become something of a phylogenetic tree to help bring out the additional information in this diagram. Although still some way from offering a complete picture of spheroid/(black hole) evolution, akin to how the Hertzsprung-Russell diagram explains stars, the evolutionary paths shown here offer a significantly increased understanding beyond the notion of a (near-linear) - relation with disjoint populations of low- and high-mass spheroids having under- and over-massive black holes, respectively. The non-linear, morphology-dependent relations represent a markedly different picture to that based on the idea of ‘classical bulges’ versus ‘pseudobulges’ (e.g., Hu, 2008; Kormendy & Ho, 2013; Saglia et al., 2016, their Fig. 13) dictating the demographics within the black hole scaling diagrams. They also represent a substantial advancement over the ‘red sequence’ for ETGs presented in (Savorgnan et al., 2016) along with the ‘blue sequence’ for LTGs. Our holistic approach also reminds us that some lenticular galaxies are not faded spiral galaxies but have origins tied to (wet and dry) mergers. However, suggestions surrounding the environmental impact on discs, presented at the end of Section 3.1, for the offset behaviour of ES,b and some S0 galaxies in the - diagram, would benefit from further investigation.
By combining our results with detailed morphological information for galaxies with reverberation-mapped AGN (e.g., Bentz et al., 2009; Ilić et al., 2017; Bennert et al., 2021), we can revisit and improve derivations of the virial -factor (Peterson, 1993) used to convert AGN virial masses into black hole masses. The morphology-dependence seen in Fig. 3 will enable improved estimates of black hole masses in galaxies for which the gravitational influence of the black hole cannot be spatially resolved, including systems displaying tidal disruption events (TDEs: Rees, 1988; Strubbe & Quataert, 2009; Komossa, 2015). Furthermore, the new, all-encompassing, merger-built sequence in the - diagram, to which S galaxies also roughly adhere to, may prove helpful for pursuing long-wavelength gravitational waves generated through the coalescence of massive black holes (e.g., Mapelli et al., 2012; Shannon et al., 2013; Chen et al., 2019).
Acknowledgements
This research was supported under the Australian Research Council’s funding scheme DP17012923. Part of this research was conducted within the Australian Research Council’s Centre of Excellence for Gravitational Wave Discovery (OzGrav) through project number CE170100004. This research has used the NASA/IPAC Extragalactic Database (NED) and the NASA/IPAC Infrared Science Archive. We used the Rstan package available at https://mc-stan.org/. We also used python packages NumPy (Harris et al., 2020), Matplotlib (Hunter, 2007), and SciPy (Virtanen et al., 2020).
We acknowledge having borrowed terms from our colleagues in the biological sciences, such as ‘natural selection’ from Darwin (1859) and ‘phylogeny’ and ‘ontogeny’ from Haeckel (1866).
5 Data Availability
References
- Alexander (1852) Alexander S., 1852, AJ, 2, 95
- Anglés-Alcázar et al. (2017) Anglés-Alcázar D., Faucher-Giguère C.-A., Quataert E., Hopkins P. F., Feldmann R., Torrey P., Wetzel A., Kereš D., 2017, MNRAS, 472, L109
- Arnold et al. (2011) Arnold J. A., Romanowsky A. J., Brodie J. P., Chomiuk L., Spitler L. R., Strader J., Benson A. J., Forbes D. A., 2011, ApJ, 736, L26
- Arzoumanian et al. (2020) Arzoumanian Z., et al., 2020, ApJ, 905, L34
- Athanassoula (2005) Athanassoula E., 2005, MNRAS, 358, 1477
- Athanassoula (2016) Athanassoula E., 2016, in Laurikainen E., Peletier R., Gadotti D., eds, Astrophysics and Space Science Library Vol. 418, Galactic Bulges. p. 391 (arXiv:1503.04804), doi:10.1007/978-3-319-19378-6_14
- Athanassoula et al. (2016) Athanassoula E., Rodionov S. A., Peschken N., Lambert J. C., 2016, ApJ, 821, 90
- Bait et al. (2017) Bait O., Barway S., Wadadekar Y., 2017, MNRAS, 471, 2687
- Balcells et al. (2003) Balcells M., Graham A. W., Domínguez-Palmero L., Peletier R. F., 2003, ApJ, 582, L79
- Balcells et al. (2007) Balcells M., Graham A. W., Peletier R. F., 2007, ApJ, 665, 1084
- Baldassare et al. (2015) Baldassare V. F., Reines A. E., Gallo E., Greene J. E., 2015, ApJ, 809, L14
- Barnes (1992) Barnes J. E., 1992, ApJ, 393, 484
- Barnes & Hernquist (1996) Barnes J. E., Hernquist L., 1996, ApJ, 471, 115
- Barway et al. (2013) Barway S., Wadadekar Y., Vaghmare K., Kembhavi A. K., 2013, MNRAS, 432, 430
- Begelman et al. (1980) Begelman M. C., Blandford R. D., Rees M. J., 1980, Nature, 287, 307
- Bekki & Graham (2010) Bekki K., Graham A. W., 2010, ApJ, 714, L313
- Bekki et al. (2001a) Bekki K., Couch W. J., Drinkwater M. J., 2001a, ApJ, 552, L105
- Bekki et al. (2001b) Bekki K., Couch W. J., Drinkwater M. J., Gregg M. D., 2001b, ApJ, 557, L39
- Bekki et al. (2003) Bekki K., Harris W. E., Harris G. L. H., 2003, MNRAS, 338, 587
- Bellstedt et al. (2017) Bellstedt S., Graham A. W., Forbes D. A., Romanowsky A. J., Brodie J. P., Strader J., 2017, MNRAS, 470, 1321
- Bender & Moellenhoff (1987) Bender R., Moellenhoff C., 1987, A&A, 177, 71
- Bennert et al. (2008) Bennert N., Canalizo G., Jungwiert B., Stockton A., Schweizer F., Peng C. Y., Lacy M., 2008, ApJ, 677, 846
- Bennert et al. (2011) Bennert V. N., Auger M. W., Treu T., Woo J.-H., Malkan M. A., 2011, ApJ, 742, 107
- Bennert et al. (2021) Bennert V. N., et al., 2021, ApJ, 921, 36
- Bentz et al. (2009) Bentz M. C., Peterson B. M., Pogge R. W., Vestergaard M., 2009, ApJ, 694, L166
- Björklund et al. (2022) Björklund R., Sundqvist J. O., Singh S. M., Puls J., Najarro F., 2022, arXiv e-prints, p. arXiv:2203.08218
- Blais-Ouellette et al. (2004) Blais-Ouellette S., Amram P., Carignan C., Swaters R., 2004, A&A, 420, 147
- Blakeslee et al. (2002) Blakeslee J. P., Lucey J. R., Tonry J. L., Hudson M. J., Narayanan V. K., Barris B. J., 2002, MNRAS, 330, 443
- Blakeslee et al. (2010) Blakeslee J. P., et al., 2010, ApJ, 724, 657
- Blandford (1979) Blandford R. D., 1979, in Smarr L. L., ed., Sources of Gravitational Radiation. pp 191–210
- Blom et al. (2014) Blom C., Forbes D. A., Foster C., Romanowsky A. J., Brodie J. P., 2014, MNRAS, 439, 2420
- Bogdán et al. (2018) Bogdán Á., Lovisari L., Volonteri M., Dubois Y., 2018, ApJ, 852, 131
- Boizelle et al. (2021) Boizelle B. D., et al., 2021, ApJ, 908, 19
- Bon et al. (2012) Bon E., et al., 2012, ApJ, 759, 118
- Bonfini (2014) Bonfini P., 2014, PASP, 126, 935
- Bonfini & Graham (2016) Bonfini P., Graham A. W., 2016, ApJ, 829, 81
- Bonfini et al. (2015) Bonfini P., Dullo B. T., Graham A. W., 2015, ApJ, 807, 136
- Bonfini et al. (2018) Bonfini P., González-Martín O., Fritz J., Bitsakis T., Bruzual G., Cervantes Sodi B., 2018, MNRAS, 478, 1161
- Bouché et al. (2013) Bouché N., Murphy M. T., Kacprzak G. G., Péroux C., Contini T., Martin C. L., Dessauges-Zavadsky M., 2013, Science, 341, 50
- Bournaud et al. (2011) Bournaud F., et al., 2011, ApJ, 730, 4
- Bower et al. (2017) Bower R. G., Schaye J., Frenk C. S., Theuns T., Schaller M., Crain R. A., McAlpine S., 2017, MNRAS, 465, 32
- Bresolin (2013) Bresolin F., 2013, ApJ, 772, L23
- Brown et al. (2013) Brown J. S., Valluri M., Shen J., Debattista V. P., 2013, ApJ, 778, 151
- Brüns et al. (2000) Brüns C., Kerp J., Staveley-Smith L., 2000, in Kraan-Korteweg R. C., Henning P. A., Andernach H., eds, Astronomical Society of the Pacific Conference Series Vol. 218, Mapping the Hidden Universe: The Universe behind the Mily Way - The Universe in HI. p. 349 (arXiv:astro-ph/0011546)
- Burbidge & Burbidge (1959) Burbidge E. M., Burbidge G. R., 1959, ApJ, 129, 271
- Bureau & Athanassoula (2005) Bureau M., Athanassoula E., 2005, ApJ, 626, 159
- Burke-Spolaor et al. (2019) Burke-Spolaor S., et al., 2019, A&ARv, 27, 5
- Buson et al. (2004) Buson L. M., Bertola F., Bressan A., Burstein D., Cappellari M., 2004, A&A, 423, 965
- Caon et al. (1993) Caon N., Capaccioli M., D’Onofrio M., 1993, MNRAS, 265, 1013
- Capetti et al. (2005) Capetti A., Marconi A., Macchetto D., Axon D., 2005, A&A, 431, 465
- Carollo et al. (2001) Carollo C. M., Stiavelli M., de Zeeuw P. T., Seigar M., Dejonghe H., 2001, ApJ, 546, 216
- Carter (1978) Carter D., 1978, MNRAS, 182, 797
- Carter (1987) Carter D., 1987, ApJ, 312, 514
- Chen et al. (2019) Chen S., Sesana A., Conselice C. J., 2019, MNRAS, 488, 401
- Chen et al. (2020) Chen Y., Yu Q., Lu Y., 2020, ApJ, 897, 86
- Chen et al. (2021) Chen S., et al., 2021, MNRAS, 508, 4970
- Chilingarian et al. (2018) Chilingarian I. V., Katkov I. Y., Zolotukhin I. Y., Grishin K. A., Beletsky Y., Boutsia K., Osip D. J., 2018, ApJ, 863, 1
- Ciambur (2015) Ciambur B. C., 2015, ApJ, 810, 120
- Ciambur (2016) Ciambur B. C., 2016, Publ. Astron. Soc. Australia, 33, e062
- Ciambur & Graham (2016) Ciambur B. C., Graham A. W., 2016, MNRAS, 459, 1276
- Ciotti & Ostriker (2001) Ciotti L., Ostriker J. P., 2001, ApJ, 551, 131
- Ciotti et al. (1991) Ciotti L., D’Ercole A., Pellegrini S., Renzini A., 1991, ApJ, 376, 380
- Coelho et al. (2009) Coelho P., Mendes de Oliveira C., Cid Fernandes R., 2009, MNRAS, 396, 624
- Combes et al. (1990) Combes F., Debbasch F., Friedli D., Pfenniger D., 1990, A&A, 233, 82
- Comerón et al. (2010) Comerón S., Knapen J. H., Beckman J. E., Laurikainen E., Salo H., Martínez-Valpuesta I., Buta R. J., 2010, MNRAS, 402, 2462
- Courteau et al. (1996) Courteau S., de Jong R. S., Broeils A. H., 1996, ApJ, 457, L73
- Crane & Vernet (1997) Crane P., Vernet J., 1997, ApJ, 486, L91
- Crane et al. (1993) Crane P., et al., 1993, AJ, 106, 1371
- Croton et al. (2006) Croton D. J., et al., 2006, MNRAS, 365, 11
- Daddi et al. (2005) Daddi E., et al., 2005, ApJ, 626, 680
- Damjanov et al. (2009) Damjanov I., et al., 2009, ApJ, 695, 101
- Damjanov et al. (2011) Damjanov I., et al., 2011, ApJ, 739, L44
- Davé et al. (2019) Davé R., Anglés-Alcázar D., Narayanan D., Li Q., Rafieferantsoa M. H., Appleby S., 2019, MNRAS, 486, 2827
- Davis et al. (1995) Davis D. S., Mushotzky R. F., Mulchaey J. S., Worrall D. M., Birkinshaw M., Burstein D., 1995, ApJ, 444, 582
- Davis et al. (2017) Davis B. L., Graham A. W., Seigar M. S., 2017, MNRAS, 471, 2187
- Davis et al. (2019) Davis B. L., Graham A. W., Cameron E., 2019, ApJ, 873, 85
- Davis et al. (2020) Davis T. A., et al., 2020, MNRAS, 496, 4061
- De Loore et al. (1977) De Loore C., De Greve J. P., Lamers H. J. G. L. M., 1977, A&A, 61, 251
- Debattista et al. (2013) Debattista V. P., Kazantzidis S., van den Bosch F. C., 2013, ApJ, 765, 23
- Dekel et al. (2009) Dekel A., et al., 2009, Nature, 457, 451
- Devereux (2018) Devereux N., 2018, MNRAS, 473, 2930
- Di Matteo et al. (2005) Di Matteo T., Springel V., Hernquist L., 2005, Nature, 433, 604
- Di Matteo et al. (2007) Di Matteo P., Combes F., Melchior A. L., Semelin B., 2007, A&A, 468, 61
- Ding et al. (2020) Ding X., et al., 2020, ApJ, 888, 37
- Dressler & Richstone (1988) Dressler A., Richstone D. O., 1988, ApJ, 324, 701
- Dullo & Graham (2012) Dullo B. T., Graham A. W., 2012, ApJ, 755, 163
- Dullo & Graham (2013) Dullo B. T., Graham A. W., 2013, ApJ, 768, 36
- Dullo & Graham (2014) Dullo B. T., Graham A. W., 2014, MNRAS, 444, 2700
- Ebisuzaki et al. (1991) Ebisuzaki T., Makino J., Okumura S. K., 1991, Nature, 354, 212
- El-Zant et al. (2001) El-Zant A., Shlosman I., Hoffman Y., 2001, ApJ, 560, 636
- Erwin (2015) Erwin P., 2015, ApJ, 799, 226
- Erwin et al. (2003) Erwin P., Beltrán J. C. V., Graham A. W., Beckman J. E., 2003, ApJ, 597, 929
- Erwin et al. (2015) Erwin P., et al., 2015, MNRAS, 446, 4039
- Faber (1973) Faber S. M., 1973, ApJ, 179, 423
- Faber et al. (1997) Faber S. M., et al., 1997, AJ, 114, 1771
- Fedorova et al. (2016) Fedorova E., Vasylenko A., Hnatyk B. I., Zhdanov V. I., 2016, Astronomische Nachrichten, 337, 96
- Ferrarese & Merritt (2000) Ferrarese L., Merritt D., 2000, ApJ, 539, L9
- Ferrarese et al. (1994) Ferrarese L., van den Bosch F. C., Ford H. C., Jaffe W., O’Connell R. W., 1994, AJ, 108, 1598
- Ferrarese et al. (2006) Ferrarese L., et al., 2006, ApJ, 644, L21
- Ferré-Mateu et al. (2017) Ferré-Mateu A., Trujillo I., Martín-Navarro I., Vazdekis A., Mezcua M., Balcells M., Domínguez L., 2017, MNRAS, 467, 1929
- Ferré-Mateu et al. (2021) Ferré-Mateu A., Mezcua M., Barrows R. S., 2021, MNRAS, 506, 4702
- Feruglio et al. (2010) Feruglio C., Maiolino R., Piconcelli E., Menci N., Aussel H., Lamastra A., Fiore F., 2010, A&A, 518, L155
- Fort et al. (1986) Fort B. P., Prieur J. L., Carter D., Meatheringham S. J., Vigroux L., 1986, ApJ, 306, 110
- Gadotti (2011) Gadotti D. A., 2011, MNRAS, 415, 3308
- Gadotti & Kauffmann (2009) Gadotti D. A., Kauffmann G., 2009, MNRAS, 399, 621
- Gadotti & de Souza (2005) Gadotti D. A., de Souza R. E., 2005, ApJ, 629, 797
- Gadotti et al. (2015) Gadotti D. A., Seidel M. K., Sánchez-Blázquez P., Falcón-Barroso J., Husemann B., Coelho P., Pérez I., 2015, A&A, 584, A90
- Gebhardt et al. (2000) Gebhardt K., et al., 2000, ApJ, 539, L13
- Gebhardt et al. (2003) Gebhardt K., et al., 2003, ApJ, 583, 92
- Goerdt et al. (2010) Goerdt T., Moore B., Read J. I., Stadel J., 2010, ApJ, 725, 1707
- Goncharov et al. (2021) Goncharov B., et al., 2021, ApJ, 917, L19
- Goncharov et al. (2022) Goncharov B., et al., 2022, ApJ, 932, L22
- Goudfrooij et al. (2004) Goudfrooij P., Gilmore D., Whitmore B. C., Schweizer F., 2004, ApJ, 613, L121
- Graham (2002) Graham A. W., 2002, ApJ, 568, L13
- Graham (2007a) Graham A., 2007a, in American Astronomical Society Meeting Abstracts. p. 13.27
- Graham (2007b) Graham A. W., 2007b, MNRAS, 379, 711
- Graham (2008) Graham A. W., 2008, ApJ, 680, 143
- Graham (2012a) Graham A. W., 2012a, MNRAS, 422, 1586
- Graham (2012b) Graham A. W., 2012b, ApJ, 746, 113
- Graham (2013) Graham A. W., 2013, in Oswalt T. D., Keel W. C., eds, Planets, Stars and Stellar Systems Vol. 6, Extragalactic Astronomy and Cosmology. Springer Science+Business Media, Dordrecht, pp 91–140, doi:10.1007/978-94-007-5609-0_2
- Graham (2014) Graham A. W., 2014, in Seigar M. S., Treuthardt P., eds, Astronomical Society of the Pacific Conference Series Vol. 480, Structure and Dynamics of Disk Galaxies. p. 185 (arXiv:1311.7207)
- Graham (2016) Graham A. W., 2016, in Meiron Y., Li S., Liu F. K., Spurzem R., eds, IAU Symposium Vol. 312, Star Clusters and Black Holes in Galaxies across Cosmic Time. pp 269–273 (arXiv:1412.5715), doi:10.1017/S1743921315008017
- Graham (2019a) Graham A. W., 2019a, Publ. Astron. Soc. Australia, 36, e035
- Graham (2019b) Graham A. W., 2019b, MNRAS, 487, 4995
- Graham (2020) Graham A. W., 2020, MNRAS, 492, 3263
- Graham & Driver (2005) Graham A. W., Driver S. P., 2005, Publ. Astron. Soc. Australia, 22, 118
- Graham & Guzmán (2003) Graham A. W., Guzmán R., 2003, AJ, 125, 2936
- Graham & Sahu (2022) Graham A. W., Sahu N., 2022, MNRAS, submitted
- Graham & Scott (2013) Graham A. W., Scott N., 2013, ApJ, 764, 151
- Graham & Scott (2015) Graham A. W., Scott N., 2015, ApJ, 798, 54
- Graham & Soria (2019) Graham A. W., Soria R., 2019, MNRAS, 484, 794
- Graham & Spitler (2009) Graham A. W., Spitler L. R., 2009, MNRAS, 397, 2148
- Graham & de Blok (2001) Graham A. W., de Blok W. J. G., 2001, ApJ, 556, 177
- Graham et al. (2003) Graham A. W., Erwin P., Trujillo I., Asensio Ramos A., 2003, AJ, 125, 2951
- Graham et al. (2011) Graham A. W., Onken C. A., Athanassoula E., Combes F., 2011, MNRAS, 412, 2211
- Graham et al. (2012) Graham A. W., Spitler L. R., Forbes D. A., Lisker T., Moore B., Janz J., 2012, ApJ, 750, 121
- Graham et al. (2015) Graham A. W., Dullo B. T., Savorgnan G. A. D., 2015, ApJ, 804, 32
- Graham et al. (2016a) Graham A. W., Ciambur B. C., Soria R., 2016a, ApJ, 818, 172
- Graham et al. (2016b) Graham A. W., Durré M., Savorgnan G. A. D., Medling A. M., Batcheldor D., Scott N., Watson B., Marconi A., 2016b, ApJ, 819, 43
- Graham et al. (2016c) Graham A. W., Ciambur B. C., Savorgnan G. A. D., 2016c, ApJ, 831, 132
- Graham et al. (2017) Graham A. W., Janz J., Penny S. J., Chilingarian I. V., Ciambur B. C., Forbes D. A., Davies R. L., 2017, ApJ, 840, 68
- Graham et al. (2019) Graham A. W., Soria R., Davis B. L., 2019, MNRAS, 484, 814
- Graham et al. (2021) Graham A. W., Soria R., Ciambur B. C., Davis B. L., Swartz D. A., 2021, ApJ, 923, 146
- Grillmair et al. (1994) Grillmair C. J., Faber S. M., Lauer T. R., Baum W. A., Lynds R. C., O’Neil Earl J. J., Shaya E. J., 1994, AJ, 108, 102
- Gültekin et al. (2009a) Gültekin K., et al., 2009a, ApJ, 695, 1577
- Gültekin et al. (2009b) Gültekin K., et al., 2009b, ApJ, 698, 198
- Gunn & Gott (1972) Gunn J. E., Gott J. Richard I., 1972, ApJ, 176, 1
- Gutiérrez et al. (2004) Gutiérrez C. M., Trujillo I., Aguerri J. A. L., Graham A. W., Caon N., 2004, ApJ, 602, 664
- Habouzit et al. (2021) Habouzit M., et al., 2021, MNRAS, 503, 1940
- Häring & Rix (2004) Häring N., Rix H.-W., 2004, ApJ, 604, L89
- Harris et al. (2020) Harris C. R., et al., 2020, Nature, 585, 357
- Hartmann et al. (2014) Hartmann M., Debattista V. P., Cole D. R., Valluri M., Widrow L. M., Shen J., 2014, MNRAS, 441, 1243
- Hawarden et al. (1993) Hawarden T. G., Sandell G., Matthews H. E., Friberg P., Watt G. D., Smith P. A., 1993, MNRAS, 260, 844
- Hernquist (1989) Hernquist L., 1989, Nature, 340, 687
- Hernquist (1990) Hernquist L., 1990, ApJ, 356, 359
- Hernquist & Mihos (1995) Hernquist L., Mihos J. C., 1995, ApJ, 448, 41
- Hilker & Kissler-Patig (1996) Hilker M., Kissler-Patig M., 1996, A&A, 314, 357
- Hon et al. (2022a) Hon D. S. H., Graham A. W., Davis B. L., Marconi A., 2022a, MNRAS, 514, 3410
- Hon et al. (2022b) Hon D. S. H., Graham A. W., Sahu N., 2022b, MNRAS, submitted, arxiv:2209.01550
- Hood et al. (2018) Hood C. E., Kannappan S. J., Stark D. V., Dell’Antonio I. P., Moffett A. J., Eckert K. D., Norris M. A., Hendel D., 2018, ApJ, 857, 144
- Hu (2008) Hu J., 2008, MNRAS, 386, 2242
- Hui et al. (1995) Hui X., Ford H. C., Freeman K. C., Dopita M. A., 1995, ApJ, 449, 592
- Hunter (2007) Hunter J. D., 2007, Computing in Science & Engineering, 9, 90
- Ilić et al. (2017) Ilić D., et al., 2017, Frontiers in Astronomy and Space Sciences, 4, 12
- Into & Portinari (2013) Into T., Portinari L., 2013, MNRAS, 430, 2715
- Ivison et al. (2012) Ivison R. J., et al., 2012, MNRAS, 425, 1320
- Jaffe et al. (1994) Jaffe W., Ford H. C., O’Connell R. W., van den Bosch F. C., Ferrarese L., 1994, AJ, 108, 1567
- Jarrett et al. (2006) Jarrett T. H., et al., 2006, AJ, 131, 261
- Jarvis (1986) Jarvis B. J., 1986, AJ, 91, 65
- Jedrzejewski (1987) Jedrzejewski R. I., 1987, MNRAS, 226, 747
- Jensen et al. (2021) Jensen J. B., et al., 2021, ApJS, 255, 21
- Joseph & Wright (1985) Joseph R. D., Wright G. S., 1985, MNRAS, 214, 87
- Kandrup & Mahon (1992) Kandrup H. E., Mahon M. E., 1992, Phys. Rev. D, 45, 1013
- Karachentsev et al. (2015) Karachentsev I. D., Nasonova O. G., Karachentseva V. E., 2015, Astrophysical Bulletin, 70, 1
- Kauffmann & Haehnelt (2000) Kauffmann G., Haehnelt M., 2000, MNRAS, 311, 576
- Kereš et al. (2005) Kereš D., Katz N., Weinberg D. H., Davé R., 2005, MNRAS, 363, 2
- Kim et al. (2012) Kim T., et al., 2012, ApJ, 753, 43
- Kim et al. (2017) Kim M., Ho L. C., Peng C. Y., Barth A. J., Im M., 2017, ApJS, 232, 21
- King (1962) King I., 1962, AJ, 67, 471
- King & Kiser (1973) King I. R., Kiser J., 1973, ApJ, 181, 27
- King & Minkowski (1966) King I. R., Minkowski R., 1966, ApJ, 143, 1002
- King & Minkowski (1972) King I. R., Minkowski R., 1972, in Evans D. S., Wills D., Wills B. J., eds, IAU Symposium Vol. 44, External Galaxies and Quasi-Stellar Objects. p. 87
- Komossa (2015) Komossa S., 2015, Journal of High Energy Astrophysics, 7, 148
- Kormendy (1985) Kormendy J., 1985, ApJ, 295, 73
- Kormendy (2001) Kormendy J., 2001, in Funes J. G., Corsini E. M., eds, Astronomical Society of the Pacific Conference Series Vol. 230, Galaxy Disks and Disk Galaxies. pp 247–256 (arXiv:astro-ph/0007401)
- Kormendy & Ho (2013) Kormendy J., Ho L. C., 2013, ARA&A, 51, 511
- Kormendy & Richstone (1995) Kormendy J., Richstone D., 1995, ARA&A, 33, 581
- Kormendy et al. (1994) Kormendy J., Dressler A., Byun Y. I., Faber S. M., Grillmair C., Lauer T. R., Richstone D., Tremaine S., 1994, in European Southern Observatory Conference and Workshop Proceedings. p. 147
- Kormendy et al. (2011) Kormendy J., Bender R., Cornell M. E., 2011, Nature, 469, 374
- Krajnović et al. (2011) Krajnović D., et al., 2011, MNRAS, 414, 2923
- Krajnović et al. (2013) Krajnović D., et al., 2013, MNRAS, 432, 1768
- Kroupa (2002) Kroupa P., 2002, Science, 295, 82
- Kuo et al. (2008) Kuo C.-Y., Lim J., Tang Y.-W., Ho P. T. P., 2008, ApJ, 679, 1047
- Laor (1998) Laor A., 1998, ApJ, 505, L83
- Laor (2001) Laor A., 2001, ApJ, 553, 677
- Laurikainen et al. (2011) Laurikainen E., Salo H., Buta R., Knapen J. H., 2011, MNRAS, 418, 1452
- Ledo et al. (2010) Ledo H. R., Sarzi M., Dotti M., Khochfar S., Morelli L., 2010, MNRAS, 407, 969
- Liller (1966) Liller M. H., 1966, ApJ, 146, 28
- Lommen & Backer (2001) Lommen A. N., Backer D. C., 2001, ApJ, 562, 297
- López-Cruz et al. (2014) López-Cruz O., Añorve C., Birkinshaw M., Worrall D. M., Ibarra-Medel H. J., Barkhouse W. A., Torres-Papaqui J. P., Motta V., 2014, ApJ, 795, L31
- Lotz et al. (2008) Lotz J. M., Jonsson P., Cox T. J., Primack J. R., 2008, MNRAS, 391, 1137
- Lynden-Bell (1969) Lynden-Bell D., 1969, Nature, 223, 690
- Madrid & Donzelli (2016) Madrid J. P., Donzelli C. J., 2016, ApJ, 819, 50
- Magorrian et al. (1998) Magorrian J., et al., 1998, AJ, 115, 2285
- Makarov & Karachentsev (2011) Makarov D., Karachentsev I., 2011, MNRAS, 412, 2498
- Mapelli et al. (2012) Mapelli M., Ripamonti E., Vecchio A., Graham A. W., Gualandris A., 2012, A&A, 542, A102
- Marconi & Hunt (2003) Marconi A., Hunt L. K., 2003, ApJ, 589, L21
- Martín-Navarro et al. (2015) Martín-Navarro I., La Barbera F., Vazdekis A., Ferré-Mateu A., Trujillo I., Beasley M. A., 2015, MNRAS, 451, 1081
- Martin et al. (2022) Martin G., et al., 2022, MNRAS, 513, 1459
- Martínez-Delgado et al. (2001) Martínez-Delgado D., Aparicio A., Gómez-Flechoso M. Á., Carrera R., 2001, ApJ, 549, L199
- Martinez-Valpuesta et al. (2007) Martinez-Valpuesta I., Knapen J. H., Buta R., 2007, AJ, 134, 1863
- McAlpine et al. (2018) McAlpine S., Bower R. G., Rosario D. J., Crain R. A., Schaye J., Theuns T., 2018, MNRAS, 481, 3118
- McConnell & Ma (2013) McConnell N. J., Ma C.-P., 2013, ApJ, 764, 184
- McLure & Dunlop (2002) McLure R. J., Dunlop J. S., 2002, MNRAS, 331, 795
- Mehrgan et al. (2019) Mehrgan K., Thomas J., Saglia R., Mazzalay X., Erwin P., Bender R., Kluge M., Fabricius M., 2019, ApJ, 887, 195
- Merluzzi et al. (2013) Merluzzi P., et al., 2013, MNRAS, 429, 1747
- Merritt & Milosavljević (2005) Merritt D., Milosavljević M., 2005, Living Reviews in Relativity, 8, 8
- Mezcua & Domínguez Sánchez (2020) Mezcua M., Domínguez Sánchez H., 2020, ApJ, 898, L30
- Moore et al. (1996) Moore B., Katz N., Lake G., Dressler A., Oemler A., 1996, Nature, 379, 613
- Morales et al. (2018) Morales G., Martínez-Delgado D., Grebel E. K., Cooper A. P., Javanmardi B., Miskolczi A., 2018, A&A, 614, A143
- Naab & Burkert (2003) Naab T., Burkert A., 2003, ApJ, 597, 893
- Naab et al. (2006a) Naab T., Jesseit R., Burkert A., 2006a, MNRAS, 372, 839
- Naab et al. (2006b) Naab T., Khochfar S., Burkert A., 2006b, ApJ, 636, L81
- Naab et al. (2014) Naab T., et al., 2014, MNRAS, 444, 3357
- Negroponte & White (1983) Negroponte J., White S. D. M., 1983, MNRAS, 205, 1009
- Nguyen et al. (2017) Nguyen D. D., et al., 2017, ApJ, 836, 237
- Nieto & Bender (1989) Nieto J. L., Bender R., 1989, A&A, 215, 266
- Nieto et al. (1988) Nieto J. L., Capaccioli M., Held E. V., 1988, A&A, 195, L1
- Nieto et al. (1991) Nieto J. L., Bender R., Arnaud J., Surma P., 1991, A&A, 244, L25
- Oort (1940) Oort J. H., 1940, ApJ, 91, 273
- Osmond & Ponman (2004) Osmond J. P. F., Ponman T. J., 2004, MNRAS, 350, 1511
- Pellegrini (2005) Pellegrini S., 2005, MNRAS, 364, 169
- Peng et al. (2010) Peng C. Y., Ho L. C., Impey C. D., Rix H.-W., 2010, AJ, 139, 2097
- Peters (1964) Peters P. C., 1964, Physical Review, 136, 1224
- Peterson (1993) Peterson B. M., 1993, PASP, 105, 247
- Pietrzyński et al. (2019) Pietrzyński G., et al., 2019, Nature, 567, 200
- Ponman et al. (1994) Ponman T. J., Allan D. J., Jones L. R., Merrifield M., McHardy I. M., Lehto H. J., Luppino G. A., 1994, Nature, 369, 462
- Querejeta et al. (2015) Querejeta M., et al., 2015, ApJS, 219, 5
- Rajagopal & Romani (1995) Rajagopal M., Romani R. W., 1995, ApJ, 446, 543
- Randall et al. (2015) Randall S. W., et al., 2015, ApJ, 805, 112
- Rathore et al. (2022) Rathore H., Kumar K., Mishra P. K., Wadadekar Y., Bait O., 2022, MNRAS, 513, 389
- Rees (1988) Rees M. J., 1988, Nature, 333, 523
- Rees (1989) Rees M. J., 1989, Reviews in Modern Astronomy, 2, 1
- Roche (1850) Roche E. A., 1850, Montpellier Academy of Sciences and Letters. Mémoires de la section des sciences, 1, 333
- Rood (1965) Rood H. J., 1965, AJ, 70, 689
- Rosse (1850a) Rosse T. E. O., 1850a, MNRAS, 10, 21
- Rosse (1850b) Rosse T. E. O., 1850b, Philosophical Transactions of the Royal Society of London Series I, 140, 499
- Rusli et al. (2011) Rusli S. P., Thomas J., Erwin P., Saglia R. P., Nowak N., Bender R., 2011, MNRAS, 410, 1223
- Rusli et al. (2013) Rusli S. P., Erwin P., Saglia R. P., Thomas J., Fabricius M., Bender R., Nowak N., 2013, AJ, 146, 160
- Saglia et al. (2016) Saglia R. P., et al., 2016, ApJ, 818, 47
- Saha et al. (2018) Saha K., Graham A. W., Rodríguez-Herranz I., 2018, ApJ, 852, 133
- Sahu et al. (2019a) Sahu N., Graham A. W., Davis B. L., 2019a, ApJ, 876, 155
- Sahu et al. (2019b) Sahu N., Graham A. W., Davis B. L., 2019b, ApJ, 887, 10
- Sahu et al. (2020) Sahu N., Graham A. W., Davis B. L., 2020, ApJ, 903, 97
- Sahu et al. (2021) Sahu N., Graham A. W., Davis B. L., 2021, arXiv e-prints, p. arXiv:2110.05037
- Sahu et al. (2022) Sahu N., Graham A. W., Hon D. S.-H., 2022, MNRAS, in press, (arxiv:2210.02641)
- Salo et al. (2015) Salo H., et al., 2015, ApJS, 219, 4
- Sandage & Tammann (1981) Sandage A., Tammann G. A., 1981, A Revised Shapley-Ames Catalog of Bright Galaxies. Carnegie Institution, Washington
- Savorgnan & Graham (2016a) Savorgnan G. A. D., Graham A. W., 2016a, ApJS, 222, 10
- Savorgnan & Graham (2016b) Savorgnan G. A. D., Graham A. W., 2016b, MNRAS, 457, 320
- Savorgnan et al. (2016) Savorgnan G. A. D., Graham A. W., Marconi A., Sani E., 2016, ApJ, 817, 21
- Schlafly & Finkbeiner (2011) Schlafly E. F., Finkbeiner D. P., 2011, ApJ, 737, 103
- Schombert et al. (2022) Schombert J., McGaugh S., Lelli F., 2022, AJ, 163, 154
- Schulze & Gebhardt (2011) Schulze A., Gebhardt K., 2011, ApJ, 729, 21
- Scorza & Bender (1995) Scorza C., Bender R., 1995, A&A, 293, 20
- Scott & Graham (2013) Scott N., Graham A. W., 2013, ApJ, 763, 76
- Scott et al. (2013) Scott N., Graham A. W., Schombert J., 2013, ApJ, 768, 76
- Seigar et al. (2007) Seigar M. S., Graham A. W., Jerjen H., 2007, MNRAS, 378, 1575
- Sérsic (1963) Sérsic J. L., 1963, Boletin de la Asociacion Argentina de Astronomia La Plata Argentina, 6, 41
- Sesana et al. (2004) Sesana A., Haardt F., Madau P., Volonteri M., 2004, ApJ, 611, 623
- Shannon et al. (2013) Shannon R. M., et al., 2013, Science, 342, 334
- Shaw (1987) Shaw M. A., 1987, MNRAS, 229, 691
- Shlosman et al. (1989) Shlosman I., Frank J., Begelman M. C., 1989, Nature, 338, 45
- Silk (2013) Silk J., 2013, ApJ, 772, 112
- Silk (2017) Silk J., 2017, ApJ, 839, L13
- Smith et al. (2021) Smith M. D., et al., 2021, MNRAS, 503, 5984
- Soria et al. (2006) Soria R., Graham A. W., Fabbiano G., Baldi A., Elvis M., Jerjen H., Pellegrini S., Siemiginowska A., 2006, ApJ, 640, 143
- Spavone et al. (2018) Spavone M., et al., 2018, ApJ, 864, 149
- Strubbe & Quataert (2009) Strubbe L. E., Quataert E., 2009, MNRAS, 400, 2070
- Tal et al. (2009) Tal T., van Dokkum P. G., Nelan J., Bezanson R., 2009, AJ, 138, 1417
- Tarafdar et al. (2022) Tarafdar P., et al., 2022, arXiv e-prints, p. arXiv:2206.09289
- Thornton et al. (2008) Thornton C. E., Barth A. J., Ho L. C., Rutledge R. E., Greene J. E., 2008, ApJ, 686, 892
- Tillman et al. (2022) Tillman M. T., Wellons S., Faucher-Giguère C.-A., Kelley L. Z., Anglés-Alcázar D., 2022, MNRAS, 511, 5756
- Tonry et al. (2001) Tonry J. L., Dressler A., Blakeslee J. P., Ajhar E. A., Fletcher A. B., Luppino G. A., Metzger M. R., Moore C. B., 2001, ApJ, 546, 681
- Toomre (1977) Toomre A., 1977, in Tinsley B. M., Larson Richard B. Gehret D. C., eds, Evolution of Galaxies and Stellar Populations. p. 401
- Toomre & Toomre (1972) Toomre A., Toomre J., 1972, ApJ, 178, 623
- Trujillo et al. (2014) Trujillo I., Ferré-Mateu A., Balcells M., Vazdekis A., Sánchez-Blázquez P., 2014, ApJ, 780, L20
- Tubbs (1980) Tubbs A. D., 1980, ApJ, 241, 969
- Vagshette et al. (2021) Vagshette N. D., Naik S., Kumari N., Patil M. K., 2021, Journal of Astrophysics and Astronomy, 42, 34
- Virtanen et al. (2020) Virtanen P., et al., 2020, Nature Methods, 17, 261
- Walsh et al. (2015) Walsh J. L., van den Bosch R. C. E., Gebhardt K., Yildirim A., Gültekin K., Husemann B., Richstone D. O., 2015, ApJ, 808, 183
- Wandel (1999) Wandel A., 1999, ApJ, 519, L39
- Wang et al. (2020) Wang J., Hammer F., Rejkuba M., Crnojević D., Yang Y., 2020, MNRAS, 498, 2766
- Wehner & Harris (2006) Wehner E. H., Harris W. E., 2006, ApJ, 644, L17
- Whitmore et al. (1993) Whitmore B. C., Schweizer F., Leitherer C., Borne K., Robert C., 1993, AJ, 106, 1354
- Williams et al. (2010) Williams B. F., Dalcanton J. J., Gilbert K. M., Stilp A., Dolphin A., Seth A. C., Weisz D., Skillman E., 2010, ApJ, 716, 71
- Wu et al. (2010) Wu X., Roby T., Ly L., 2010, in Silva D. R., Peck A. B., Soifer B. T., eds, Society of Photo-Optical Instrumentation Engineers (SPIE) Conference Series Vol. 7737, Observatory Operations: Strategies, Processes, and Systems III. p. 773716, doi:10.1117/12.857728
- Yagi et al. (2010) Yagi M., et al., 2010, AJ, 140, 1814
- Yang et al. (2017) Yang X., et al., 2017, MNRAS, 464, L70
- Yıldırım et al. (2015) Yıldırım A., van den Bosch R. C. E., van de Ven G., Husemann B., Lyubenova M., Walsh J. L., Gebhardt K., Gültekin K., 2015, MNRAS, 452, 1792
- de Francesco et al. (2006) de Francesco G., Capetti A., Marconi A., 2006, A&A, 460, 439
- de Vaucouleurs (1948) de Vaucouleurs G., 1948, Annales d’Astrophysique, 11, 247
- de Vaucouleurs (1974) de Vaucouleurs G., 1974, in Shakeshaft J. R., ed., IAU Symposium Vol. 58, The Formation and Dynamics of Galaxies. Dordrecht; Boston: Reidel, p. 335
- de Vaucouleurs et al. (1991) de Vaucouleurs G., de Vaucouleurs A., Corwin Herold G. J., Buta R. J., Paturel G., Fouque P., 1991, Third Reference Catalogue of Bright Galaxies. Springer, New York
- van Albada & van Gorkom (1977) van Albada T. S., van Gorkom J. H., 1977, A&A, 54, 121
- van den Bosch & de Zeeuw (2010) van den Bosch R. C. E., de Zeeuw P. T., 2010, MNRAS, 401, 1770
- van der Marel & van den Bosch (1998) van der Marel R. P., van den Bosch F. C., 1998, AJ, 116, 2220
Appendix A Appendix
A.1 New multicomponent decompositions of the galaxy light
We provide new decompositions of the galaxy light for seven galaxies imaged with the Spitzer Space Telescope. The data and process were described in our past papers (Davis et al., 2019; Sahu et al., 2019a). The new IRAF task Isofit (Ciambur, 2015) was used to extract the equivalent-axis light profile, which we modelled with Profiler (Ciambur, 2016). The results are shown here, in AB mag, while the spheroid and galaxy masses, and the spheroid size, are reported in Graham & Sahu (2022, their Table 1).
A.1.1 NGC 821
Savorgnan et al. (2016) modelled the major- and equivalent-axis light profiles independently of each other. On the one hand, this offered insight into some of the systematic errors involved in the quantitative structural analysis of galaxies. On the other hand, the reader was occasionally left uncertain which decomposition was optimal. In general, fits to the major-axis are desirable for obtaining the disc scalelength, while fits to the equivalent-axis are preferable for obtaining the spheroid size, . This was the case for NGC 821. Savorgnan et al. (2016) additionally modelled this galaxy, and some 60 others with directly measured black hole masses, using the two-dimensional fitting code Imfit (Erwin, 2015). However, as explained there (see also Ciambur, 2015, for the pros and cons of two-dimensional modelling), it was found that the two-dimensional modelling was not as reliable as our preferred approach which captures the (symmetrical) two-dimensional information in a series of one-dimensional profiles, including the ellipticity profile, the position angle profile, and Fourier harmonic terms describing deviations in the isophotes from pure ellipses. This approach allows for, for example, position angle twists in triaxial bulges.
We use the iraf task Isofit (Ciambur, 2015) to analyse a 3.6 m image of NGC 821 taken from the Spitzer Heritage Archive (SHA: Wu et al., 2010)212121https://sha.ipac.caltech.edu/. We obtain and show in Fig. 8 an equivalent-axis light profile and decomposition similar to that presented in Savorgnan et al. (2016). Our spheroid parameters from the equivalent-axis light profile are: , (AB) and . Included are the formal/random errors determined from the decomposition software (Profiler Ciambur, 2016). Systematic errors can be larger, and we, therefore, adopt the (quality of fit) grading scheme established by Savorgnan et al. (2016) and tweaked in Sahu et al. (2019a). In doing so, we report an apparent magnitude mag (AB) for the dominant spheroidal component of NGC 821.222222For reference, Savorgnan et al. (2016) obtained (7.85+2.76=) 10.61 mag (AB) from the one-dimensional approach and (7.78+2.76=) 10.54 mag (AB) from the two-dimensional approach. This is 0.20–0.27 mag fainter than found here because our more extended light profile yielded a fainter disc. The galaxy magnitude is 10.24 mag (AB).

A.1.2 NGC 1320


In Fig. 9, we have remodelled NGC 1320, paying attention to the rapid rise in the ellipticity profile from 0 to 0.5 over 2 to 6 (Davis et al., 2019). This does not appear to be the result of a bar in the image, nor does the light profile display the characteristic bump arising from the light at the end of a bar. Instead, this elongated feature seems more associated with the disc, which has an observed outer ellipticity of 0.6 due to its inclination angle relative to our sight line. However, in passing, we speculate that we may have discovered an example of an early formation phase of a bar (), although, if this were the case, then perhaps the observed ellipticity of this feature should be 0.7 rather than 0.5. We measure an apparent bulge magnitude, at 3.6 m, of 12.990.25 (AB mag). The galaxy’s apparent magnitude is 11.58 (AB mag).
A.1.3 NGC 1399
NGC 1399 is the cD galaxy in the Fornax cluster. Rusli et al. (2013) fit the starlight with a core-Sérsic function for the central galaxy and a Sérsic plus exponential function for the intracluster light. They found an index for the Sérsic function and a scalelength of over 1000 for their exponential model, effectively mimicking a sky-subtraction adjustment. This result broadly resonates with Seigar et al. (2007), who observed a preference for the ICL to be well described with a (single) exponential function, i.e., an Sérsic model. Here, we adopt a simple approach by fitting a core-Sérsic model for the galaxy plus an exponential model for the ICL. The apparent magnitude of the galaxy232323Adding our ICL component brightens the total magnitude by just 0.10 mag. is found to be 8.58 mag (AB) in the 3.6 m band. The geometric mean-axis light profile is shown in Fig. 10.
In passing, we note that there may be more to this galaxy. We have not sampled any ICL-dominated radii, and Savorgnan & Graham (2016a, their Fig. 37) thought there might be a faint inner (undigested or unrelaxed) component which they modelled with an exponential function.

A.1.4 NGC 2787

NGC 2787 is the S0 galaxy with the lowest spheroid mass in our sample. We considered it prudent to revisit the decomposition. However, with a bar, ansae at the ends of the bar, and a prominent barlens/(inner part of the bar)242424An example of the inner part of a bar appearing disc-like can be seen in the simulation shown by Bureau & Athanassoula (2005, their Fig. 1). If they become unstable, they may form the nuclear bar of a double-barred galaxy (Shlosman et al., 1989). roughly half the length of the (full bar)/ansae, NGC 2787 is not the easiest galaxy to model. Previously modelled by Erwin et al. (2003), the barlens+bar+(large scale disc) was lumped together there, modelled with an exponential function, and referred to as a pseudobulge. Within this ‘pseudobulge’ is an additional bulge component plus a nuclear disc. Although an isolated galaxy, it displays a prominent series of nested inner dust rings, somewhat suggestive of a past accretion event. Savorgnan & Graham (2016a) had some success decomposing the galaxy when they approximated the bar and ansae (e,g., Martinez-Valpuesta et al., 2007; Saha et al., 2018) as a single component. Sahu et al. (2019a) advanced the decomposition using a Gaussian ring model for the ansae and a slightly truncated, i.e., double, exponential disc model. Such behaviour, where the disc bends down beyond the bar/ansae, is also observed in simulations (Saha et al., 2018). The galaxy components in NGC 2787 are also reminiscent of that seen in NGC 4762 (Sahu et al., 2019a, their Fig. 3). In Fig. 11, we present what we consider to be a slightly improved fit over that shown in Sahu et al. (2019a) for NGC 2787. Here, the prominence of the barlens is reduced, no longer forming a dominant bridge between the bar and ansae.252525We did find a solution with a bulge having a Sérsic index around 2.5; however it also resulted in what was considered an unphysical ‘bridge’ pushing the bar and ansae apart. From the equivalent-axis, we find the following spheroid parameters: , mag arcsec-2 (AB) and , giving mag (AB). This is 0.3 mag brighter than reported in Sahu et al. (2019a).
A.1.5 NGC 3377

The ETG NGC 3377 has been remodelled (see Fig. 12). Although the use of an anti-truncated (up-bending) disc was found to iron the residual profile flat, we considered this too speculative and opted for the more traditional components used by Savorgnan et al. (2016). Our 3.6 m spheroid parameters from the equivalent-axis are: , mag arcsec-2 (AB), , and mag (AB). In addition to the nuclear disc, an intermediate-scale disc is required but appears short (given the ellipticity profile) with a scalelength of just 7 — perhaps a clue that an anti-truncated disc does exist.262626Using an anti-truncated disc reduces the spheroid magnitude by just 0.1 mag. The galaxy magnitude is 9.76 mag (AB).
A.1.6 NGC 4699


NGC 4699 is the spiral galaxy with the highest spheroid mass in Graham & Sahu (2022). However, there are two clues in Davis et al. (2019) that something may be amiss with their fit, which treats NGC 4699 like a bulge-dominated system. The first is that the fitted ansae — which captured an inner set of ring-like spirals — are not at the end of the bar. The second clue is that a core-Sérsic model was used for the spheroidal component, yet depleted cores are not known to exist in spiral galaxies, and Davis et al. (2019) remarked that Hubble Space Telescope imaging showed no core. We have remodelled the galaxy in Fig. 13.272727Davis et al. (2019) also required a core-Sérsic model for the spiral galaxy NGC 3031 (M81), but this was due to the saturation of the inner 3. A core-Sérsic model was also required for NGC 4594 (M104, Sombrero galaxy) due in part to saturation within the inner 2.
Salo et al. (2015) and Erwin et al. (2015) fit the inner data for NGC 4699 with a Sérsic function for the bulge plus two exponential functions for everything else. In Fig. 13, we fit a Sérsic-bulge, a Ferrers-bar, an (anti-truncated exponential)-disc plus a broad-Gaussian to capture the bands of spiral arms. The galaxy has two broad sets of ring-like spiral arms at 15–40 and 60–90 arcseconds (equivalent-axis). We found that the simple Gaussian function could account for both of these, albeit at the expense of introducing an unlikely transition region (which we are not interested in) for the anti-truncated disc model. The 3.6 m bulge magnitude is 11.37 (AB mag). Using (i) a luminosity distance of 23.7 Mpc, (ii) (AB mag) and (iii) , based on the (Galactic Extinction)-corrected colour and Equation 4 from Graham & Sahu (2022), we obtain a stellar mass for the bulge of dex. This general procedure was used to obtain the stellar masses used here and reported in Graham & Sahu (2022).
NGC 4699 is found to have a surprisingly low bulge-to-total stellar mass ratio of 0.10 given its big stellar mass of M⊙. Arguably, the inner portion of our disc model is too bright with this decomposition, but reducing this (Fig. 14, right-hand panel) leads to a brightening of the bar component, and thus there is little effect on the bulge magnitude. Removing the broad Gaussian, and using three components to fit just the inner 30, yields a spheroid magnitude of 11.46 (AB mag), amounting to a small 0.04 dex reduction in the stellar mass that we do not apply.
A.1.7 NGC 5419
Following Sahu et al. (2019a), we remodel NGC 5419 (Abell S0753) in Fig. 15 with a core-Sérsic function for the spheroid plus an exponential function for the ICL. However, we obtain a notably fainter contribution from the ICL and reduce the ‘snake-like’ pattern in the residual profile over the (smaller) radial range where the spheroid previously dominated (). The central surface brightness ( mag arcsec-2) of the exponential model (with equivalent-axis scalelength ) describing the ICL also now matches well with that seen around other BCG (Seigar et al., 2007). For the spheroid, we find: , and mag (AB).
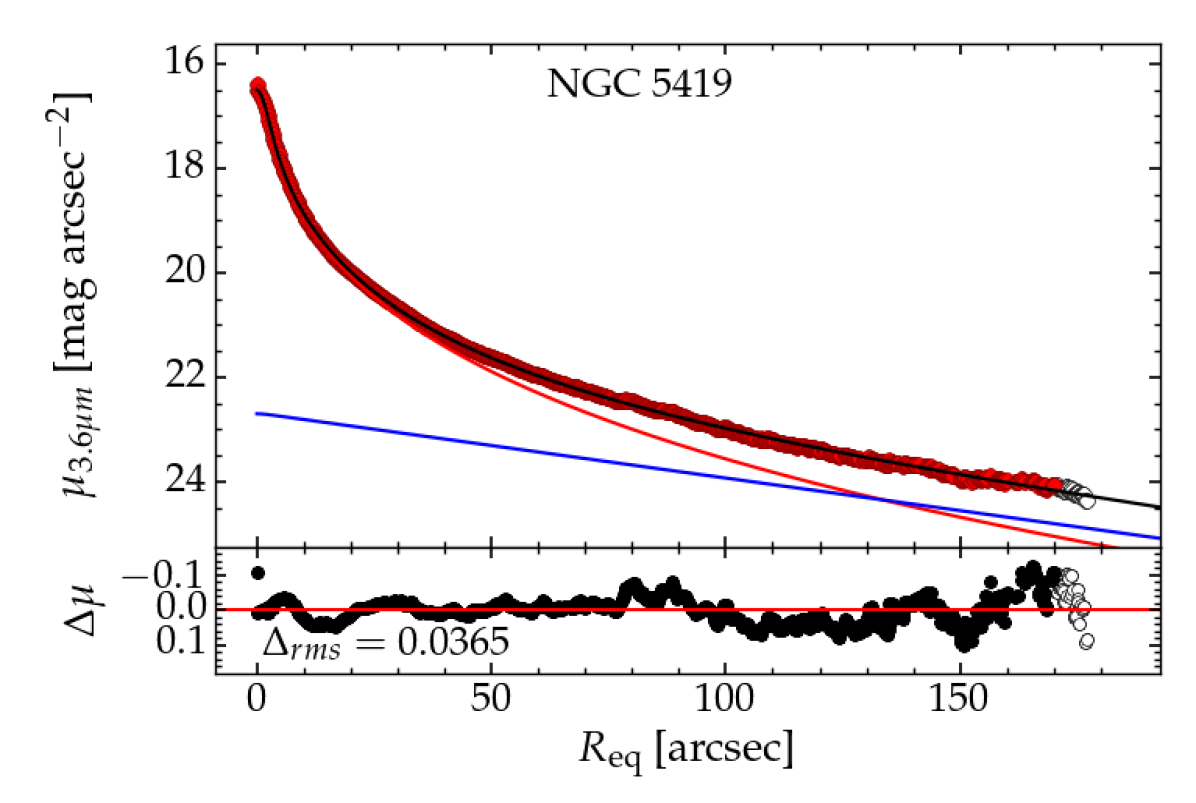
A.2 Notes on individual galaxies
A table with references to track down all the measurements of the spheroids’ stellar masses and sizes is given in Graham & Sahu (2022). It also includes the galaxies’ stellar masses and the black hole masses. Here, we provide additional notes on some of these individual galaxies to help fellow researchers follow and appreciate specific changes since KH13. This builds on the end of Section 3.3 and Section 3.3.1, which mentioned why we include systems excluded by KH13
NGC 221 (M32). KH13 consider this an elliptical galaxy. However, it displays a bulge/disc light profile Graham (2002) and has been interpreted as a heavily stripped S0 galaxy (Bekki et al., 2001b). Furthermore, its low Sérsic index bulge has structural parameters consistent with the location of bulges in the size-mass diagram Graham (2013). We treat it as a stripped disc galaxy and use the spheroid mass described in Graham & Sahu (2022).
NGC 1316, NGC 5128, NGC 2960. As noted in Section 3.1, KH13 consider these elliptical galaxies with overly bright spheroid magnitudes for their BH mass. However, they are S0 galaxies, with NGC 2960 an Sa? galaxy modelled in Davis et al. (2019), and have bulge masses much less than the galaxy masses that KH13 plotted in their - diagram (their Fig. 14).
NGC 2778. KH13 exclude NGC 2778 (which they mislabel in their Fig. 14, assigning the NGC 2778 label to NGC 4486A) because Schulze & Gebhardt (2011) report an upper limit of M⊙. We have used a distance of 22.1 Mpc and M⊙ (Gebhardt et al., 2003). KH13 also considered the galaxy to be an E rather than an S0 galaxy and consequently over-estimated the spheroid brightness by a factor of 4, making it appear somewhat offset in their sample-restricted scaling diagram.
NGC 3607. KH13 consider NGC 3607 to be an E galaxy; however, it is an ES galaxy with an embedded intermediate-scale disc (Krajnović et al., 2011; Savorgnan & Graham, 2016a). KH13 exclude NGC 3607 due to the potential impact on the measurement of the BH mass due to dark matter in galaxies with depleted cores. However, the strong dust lanes at the centre of NGC 3607 and the dust rings extending to 15 make identifying a depleted core problematic in this galaxy (Dullo & Graham, 2013). A somewhat similar situation, with nuclear dust rings creating a false core, occurred in NGC 4552 (Bonfini et al., 2018). We elect to retain this galaxy.
NGC 4261. A new BH mass has been reported for NGC 4261 in Boizelle et al. (2021), with , based on a luminosity distance of 31.6 Mpc (Tonry et al., 2001). We slightly reduced this mass by 0.02 dex using an updated distance of 30.42.7 Mpc. This arises from a reduction in the distance modulus for NGC 4261 by 0.06 mag after a recalibration by (Blakeslee et al., 2002, their Section 4.6)282828We do not use the line from Fig. 7 in Blakeslee et al. (2010). and a further reduction of 0.023 mag arising from a reduced distance modulus for the Large Magellanic Cloud (Pietrzyński et al., 2019) used by Tonry et al. (2001).
NGC 4459. KH13 speculate that the black hole mass in NGC 4459 may be low, having been measured using ionised gas rotation curves which did not take broad emission line widths into account. It appears on the right-hand edge, i.e., possibly low BH mass, of the distribution of points in the absolute magnitude versus black hole mass diagram of KH13 (their Fig. 15, see also their Fig. 12) because they considered it to be an elliptical galaxy rather than a rotating S0 galaxy (Krajnović et al., 2011; Savorgnan & Graham, 2016a). Our bulge mass is a factor of 2 times less than their galaxy mass and is located squarely in the midst of things in the - diagram. The galaxy also displays no sign of an offset in the - diagram, suggesting the BH mass may be fine.
NGC 4596. KH13 advocates excluding this S0 galaxy because it is also among the set with ionised gas kinematics that did not take broad emission line widths into account, but it also resides right in the midst of things in both the - and - diagrams. Therefore, as with NGC 4459, its exclusion or inclusion makes no difference.
NGC 5576. KH13 adjusted the BH mass for NGC 5576, measured by Gültekin et al. (2009a), in an attempt to counter the influence of dark matter in galaxies with central “loss cones” (in phase space) that yield cores depleted of stars. However, this is not a core-Sérsic galaxy; there is no central deficit of starlight relative to the spheroid’s outer light profile (Dullo & Graham, 2012). The increased BH mass in KH13 is 50 per cent larger but also has an increased uncertainty range keeping it consistent with the original mass we use. All elliptical galaxies like NGC 5576 are, however, built by mergers, as Fig. 3 in Tal et al. (2009) shows for NGC 5576.
NGC 7052. This galaxy has a new BH mass in Smith et al. (2021), based on molecular gas, which is an order of magnitude larger, at (D=66.4 Mpc), than the previous estimate based on the ionised gas (van der Marel & van den Bosch, 1998). It highlights how the small errors reported on black hole masses only capture the statistical error rather than the likely more dominant systematic error due to, for example, the non-gravitational motion of the gas. Based on our preferred distance of 61.9 Mpc (Jensen et al., 2021), this yields .