Rapid Climate Model Downscaling to Assess
Risk of Extreme Rainfall in Bangladesh in a Warming Climate
Abstract
As climate change drives an increase in global extremes, it is critical for Bangladesh, a nation highly vulnerable to these impacts, to assess future risks for effective adaptation and mitigation planning. Downscaling coarse-resolution climate models to finer scales is essential for accurately evaluating the risk of extremes. In this study, we apply our downscaling method, which integrates data, physics, and machine learning, to quantify the risks of extreme precipitation in Bangladesh. The proposed approach successfully captures the observed spatial patterns and risks of extreme rainfall in the current climate while generating risk and uncertainty estimates by efficiently downscaling multiple models under future climate scenarios. Our findings project that the risk of extreme rainfall rises across the country, with the most significant increases in the northeastern hilly and southeastern coastal areas. Projections show that the daily maximum rainfall for a 100-year return period could increase by approximately 50 mm/day by mid-century and around 100 mm/day by the end of the century. However, substantial uncertainties remain due to variations across multiple climate models and scenarios.
I Introduction
Bangladesh, a densely populated developing nation, is highly vulnerable to climate extremes. Over the past several decades, it has faced significant economic losses and human casualties from extreme events such as tropical cyclones, floods, and heat waves. With the global increase in extreme weather events driven by climate change, policymakers in Bangladesh need to understand how these risks may evolve in the coming decades to inform adaptation and mitigation strategies. Accurately assessing future risks and associated uncertainties is crucial for ensuring food security, water availability, and the protection of public infrastructure in Bangladesh.
State-of-the-art climate models, such as those from Coupled Model Intercomparison Project Phase 6 (CMIP6), are too coarse to represent the finer-scale geophysical processes essential to quantifying risk. Coupled with model biases, they typically underestimate extremes and, thus, risks. Running these models in high resolution is computationally expensive, which has driven substantial interest in downscaling coarse model outputs to achieve finer resolutions.
Downscaling methods typically fall into two broad approaches: theory-driven (physics-based) and data-driven strategies. Both approaches have inherent limitations. Physics-based numerical techniques (i.e., dynamical downscaling) are computationally intensive, and the often employed process parameterizations also produce bias. In contrast, data-driven approaches, such as statistical and machine learning techniques, are rapid and efficient but are usually limited by data scarcity and may not adhere to geophysical principles. In Saha and Ravela (2024a), we introduced a rapid large-ensemble downscaling framework that integrates statistics, simplified physics, and adversarial learning to address some of these limitations Saha and Ravela (2024a). This approach performs better than purely physics-based or data-driven models while being computationally efficient.
In a subsequent study, we applied this methodology to assess future extreme precipitation risk in Bangladesh, focusing on the HighResMIP experiment, which is limited to a single climate-socioeconomic scenario (SSP5-8.5) up to the mid-21st century Saha and Ravela (2024b). However, it is crucial to account for uncertainties across multiple scenarios and capture model errors for effective policy planning. In this study, we extend the previous work by downscaling outputs from thirteen climate models within the Scenario-MIP experiment of CMIP6, covering four scenarios through the end of the 21st century. This provides a comprehensive assessment of Bangladesh’s projected changes in extreme precipitation risk and associated uncertainties across models and scenarios. The findings suggest a nationwide increase in risk, particularly in the northeastern hilly region and southeastern coastal areas. However, significant uncertainties remain in model projections, highlighting the need to communicate these uncertainties for better-informed adaptation and mitigation strategies in Bangladesh.
The rest of the manuscript is structured as follows: Section II briefly outlines the data and methodology, while Section III presents the results. Finally, Section IV discusses the study’s implications, limitations, and future directions. For a more comprehensive description of the methodology and prior research, refer to Saha and Ravela (2024a, 2024b) Saha and Ravela (2024a, b).
| Models | Resolution |
|---|---|
| BCC-CSM2-MR | 112.5 Km |
| CMCC-ESM2 | 100125 Km |
| GFDL-ESM4 | 100125 Km |
| KACE-1-0-G | 125187.5 Km |
| MPI-ESM1-2-HR | 100 Km |
| MRI-ESM2-0 | 112.5 Km |
| ACCESS-ESM1-5 | 125187.5 Km |
| CMCC-CM2-SR5 | 100125 Km |
| EC-Earth3 | 70 Km |
| IITM-ESM | 187.5 Km |
| IPSL-CM6A-LR | 125250 Km |
| MIROC6 | 140 Km |
| MPI-ESM1-2-LR | 187.5 Km |
| SSP | Forcing |
Adaptation
Challenge |
Mitigation
Challenge |
|---|---|---|---|
| SSP1-2.6 | Low | Low | Low |
| SSP2-4.5 | Medium | Medium | Medium |
| SSP3-7.0 | High | High | High |
| SSP5-8.5 | High | Low | High |


(c) reference high-resolution () rainfall from ERA5-Land, (e) rainfall upscaled from CHIRPS,
(f) downscaled rainfall from GAN-2 at resolution , (g) original high-resolution () reference rainfall from CHIRPS. A comparison of the middle and right columns highlights the effectiveness of our downscaling model. (From Saha and Ravela, 2024b, Figure 2 Saha and Ravela (2024b))


II Data and Methods
We downscale low-resolution ( to ) model-simulated data to high-resolution () rainfall fields that are comparable to the gridded daily rainfall fields from Climate Hazards Group InfraRed Precipitation with Station data (CHIRPS). CHIRPS is a quasi-global rainfall dataset incorporating rainfall estimates from rain gauges and satellite observations Funk et al. (2015). Our downscaling model trains using low-resolution data from the European Centre for Medium-Range Weather Forecasts (ECMWF) Reanalysis (ERA5), which is available at resolution Hersbach et al. (2020).
Due to biases in ERA5 and CHIRPS, their rainfall fields do not align daily, presenting a challenge in training a downscaling function. A two-stage downscaling process addresses this. Following the downscaling approach developed in SR24 Saha and Ravela (2024a), in the first stage (GAN-1), ERA5 data () downscales to ERA5-Land resolution (). ERA5-Land is a high-resolution replay of the land surface component of ERA5, providing finer spatial detail Muñoz-Sabater et al. (2021). In the second stage (GAN-2), upscaled CHIRPS rainfall fields become predictors for the original CHIRPS rainfall fields () as predictands. Figure 1 presents a schematic representation of our downscaling approach. The approach consists of the following steps:
- 1.
-
2.
A simplified physics-based model (spectral method) to estimate orography-induced precipitation Smith and Barstad (2004).
-
3.
an adversarial network (GAN-1) that combines these two fields and produces an improved downscaled rainfall field at resolution Saha and Ravela (2024a).
-
4.
Another adversarial network (GAN-2) that downscales the rainfall field to resolution Saha and Ravela (2024b).
-
5.
An optimal estimation-based bias correction Saha and Ravela (2024b).
Priming the downscaling model with statistics and physics-derived rainfall fields Smith and Barstad (2004) improves the physical consistency and alleviates data paucity issues. Two-step adversarial learning addresses the lack of correspondence between model and data and captures high-frequency details in the downscaled field. Biases between the model and data are corrected with optimal estimation Rodgers (1976) to ensure that the downscaled rainfall captures the observed risk of extremes in the present climate.
All the aforementioned datasets were obtained for the years 1981 to 2019 and split into three groups: training (1981-1999), validation (2000-2009), and testing (2010-2019). Additionally, simulated outputs of thirteen models from the Scenario Model Intercomparison Project (ScenarioMIP) O’Neill et al. (2016) from CMIP6 are obtained for one historical scenario (1951-2014) and four tier-1 future scenarios (2015-2100), namely SSP5-8.5, SSSP3-7.0, SSP2-4.5, and SSP1-2.6. Table I lists the ScenarioMIP CMIP6 models used, and Table I lists additional details on the SSP scenarios. The CMIP6 models are coarser than ERA5; a bicubic interpolation brings them to the exact resolution as ERA5 before applying the conditional Gaussian process. The same downscaling function is used for present and future climate projections, assuming that the downscaling function remains unchanged in the warming scenario. To assess the changes between historical and future periods, we define 1985-2014 as the present climate, 2031-2050 as the future climate mid-century, and 2081-2100 as the future climate end-century.
III Results
Figure 2 provides a qualitative comparison of our downscaling model’s performance against reference rainfall fields (”truth”). Specifically, Figure 2a shows an extreme rainfall event from the ERA5 dataset at resolution, which GAN-1 subsequently downscales to , see Figure 2b, compared with the corresponding rainfall field produced by ERA5-Land () in Figure 2c. Similarly, a rainfall event from the CHIRPS dataset (), shown in Figure 2f, is upscaled in Figure 2d, and then downscaled to Figure 2e by GAN-2. Comparing the outcomes of both GAN-1 and GAN-2 with their respective references demonstrates that our model sufficiently captures the spatial pattern and heterogeneity of the high-resolution rainfall.
Figure 3 showcases downscaling applied to different coarse-resolution climate model outputs of varying resolutions. A direct comparison with a reference rainfall field is impossible here due to a lack of correspondence between the model and observation on a daily scale. However, we observe that the downscaled rainfall exhibits a strong resemblance to high-frequency CHIRPS rainfall data, indicating the effectiveness of our approach. The downscaling method remains robust, even when applied to climate models at resolutions coarser than the data used for training.
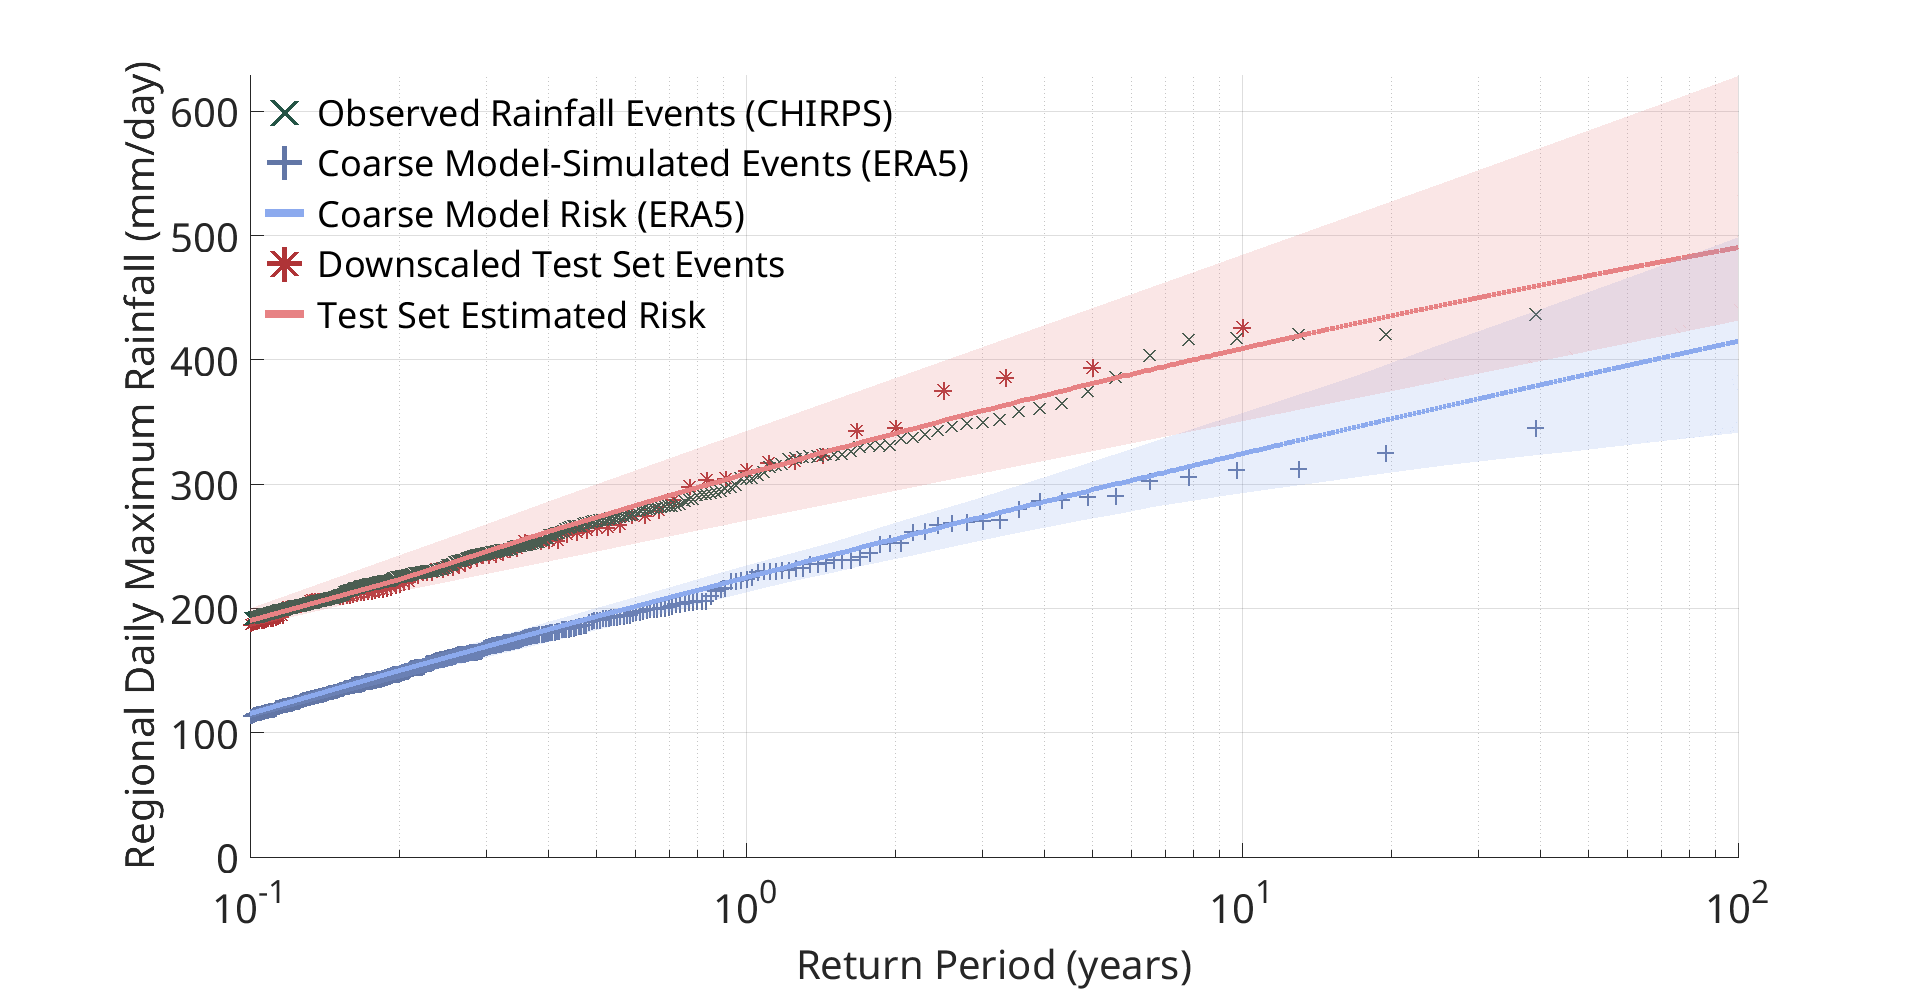
Figure 4 assesses the ability of downscaled rainfall data to reflect observed risk in the present climate. This figure presents the daily maxima of extreme events from CHIRPS, ERA5, and downscaled ERA5 rainfall against their return periods. Solid lines show the two-parameter Generalized Pareto distributions fit through them, with uncertainty around these lines estimated through bootstrapping. Notably, the coarse-resolution ERA5 model underestimates the risk of extremes, highlighting the necessity for downscaling. The results demonstrate that our downscaling approach reliably captures the observed risk. Given the model’s effectiveness in representing both spatial patterns and extreme event risks in the current climate, we extend its application to both present and future climate projections from CMIP6 models under the assumption that the downscaling function remains invariant to changes in climate.
Figure 5 compares the extreme rainfall risks captured by downscaled rainfall from thirteen models for the present and four future climate scenarios by the mid-century (2031-2050). Similarly, Figure 6 presents the risk by the end of the century (2081-2100). Since present climate data is individually bias-corrected against observations for each model, the variation between models is minimal. However, there is less consensus among the models in the future climate, as indicated by a more extensive inter-model spread. Most models project an increase in extreme risk for the future climate. The expected rise in extreme is the lowest in the sustainability scenario (SSP1-2.6) and highest in the fossil fuel-driven development scenario (SSP5-8.5). For the SSP5-8.5 scenario, approximately 50 mm/day in the return level of a 100-year return period is expected by the mid-century and 100 mm/day by the end of the century. Note that more sustainable scenarios like SSP1-2.6 and SSP2-4.5 show little to no increase in risk from mid-century to end-century, emphasizing the importance of limiting warming to these levels.


Figure 7 and Figure 8 illustrate the spatial distribution of extreme rainfall risk captured by downscaled climate models, respectively, by the mid-century and end of the century. Comparing the mean return level for a 100-year return period between the present and future climates helps identify areas where the risk of extremes increases and the extent of this increase. The maximum rise in extreme risk will likely occur in northeast Bangladesh, a region already susceptible to extremes due to its surrounding topography, and the southeast coastal region, which is vulnerable to tropical cyclones. However, model projections and scenarios have substantial variability.
IV Discussion
Downscaling an ensemble of CMIP6 climate models shows that Bangladesh’s risk of extreme events will increase significantly by the end of the century, especially for scenarios with heavy fossil fuel-driven development. This finding aligns with the global consensus on climate change. However, climate models do not have consensus on a regional scale Saha and Ghosh (2019), and the results show substantial variability across models and warming scenarios. The spatial distribution of risk projects an increase in risk in the areas already heavily exposed to extremes.
A fundamental assumption of our method is that the downscaling function remains invariant to climate change, which allows the model to be trained on present-day data and applied to future scenarios. However, this assumption requires further validation. Training the model on low- and high-resolution simulations that cover current and future climates could address the issue. However, such simulations are not readily available due to computational cost. Additionally, investigating the risk of cascading extreme events, such as extreme rainfall accompanied by cyclones, heatwaves, or floods, is an important area for future research. Our downscaling framework extends to variables like wind, temperature, and inundation to provide a more integrated approach to future climate risk assessment. Furthermore, we are interested in the development of continuous scaling laws for model fields using geometry-coupled random field models Ravela (2014, 2015) and neural dynamics Trautner et al. (2020).
Acknowledgment
This research is part of the MIT Climate Grand Challenge Jameel Observatory CREWSNet and Weather and Climate Extremes projects. Schmidt Sciences, LLC and Liberty Mutual (029024-00020) provided support. The authors thank Dr. Jiangchao Qiu for the discussions.
Data Availability Statement
All datasets used in this study are publicly available. CHIRPS global daily rainfall dataset is available from the Climate Hazards Center, University of California, Santa Barbara, USA (https://data.chc.ucsb.edu/products/CHIRPS-2.0/). the Copernicus Climate Change Service (C3S) Climate Data Store (CDS) (https://cds.climate.copernicus.eu) provides ERA5 and ERA5-land reanalysis data. The Earth System Grid Federation (ESGF) nodes (https://aims2.llnl.gov) provide HighResMIP data. The topographic elevation data obtained by Shuttle Radar Topography Mission (SRTM) at 90 m horizontal resolution from OpenTopography (https://portal.opentopography.org/raster?opentopoID=OTSRTM.042013.4326.1).
References
- Saha and Ravela [2024a] Anamitra Saha and Sai Ravela. Statistical-physical adversarial learning from data and models for downscaling rainfall extremes. Journal of Advances in Modeling Earth Systems, 16(6):e2023MS003860, 2024a.
- Saha and Ravela [2024b] Anamitra Saha and Sai Ravela. Rapid statistical-physical adversarial downscaling reveals bangladesh’s rising rainfall risk in a warming climate. arXiv:2408.11790, 2024b.
- Funk et al. [2015] Chris Funk, Pete Peterson, Martin Landsfeld, Diego Pedreros, James Verdin, Shraddhanand Shukla, Gregory Husak, James Rowland, Laura Harrison, Andrew Hoell, et al. The climate hazards infrared precipitation with stations—a new environmental record for monitoring extremes. Scientific data, 2(1):1–21, 2015.
- Hersbach et al. [2020] Hans Hersbach, Bill Bell, Paul Berrisford, Shoji Hirahara, András Horányi, Joaquín Muñoz-Sabater, Julien Nicolas, Carole Peubey, Raluca Radu, Dinand Schepers, et al. The era5 global reanalysis. Quarterly Journal of the Royal Meteorological Society, 146(730):1999–2049, 2020.
- Muñoz-Sabater et al. [2021] J. Muñoz-Sabater, E. Dutra, A. Agustí-Panareda, C. Albergel, G. Arduini, G. Balsamo, S. Boussetta, M. Choulga, S. Harrigan, H. Hersbach, B. Martens, D. G. Miralles, M. Piles, N. J. Rodríguez-Fernández, E. Zsoter, C. Buontempo, and J.-N. Thépaut. Era5-land: a state-of-the-art global reanalysis dataset for land applications. Earth System Science Data, 13(9):4349–4383, 2021. doi: 10.5194/essd-13-4349-2021.
- Ravela and McLaughlin [2007] Sai Ravela and Dennis McLaughlin. Fast ensemble smoothing. Ocean Dynamics, 57(2):123–134, 2007.
- Trautner et al. [2020] Margaret Trautner, Gabriel Margolis, and Sai Ravela. Informative neural ensemble kalman learning. arXiv:2008.09915, 2020.
- Smith and Barstad [2004] Ronald B Smith and Idar Barstad. A linear theory of orographic precipitation. Journal of the Atmospheric Sciences, 61(12):1377–1391, 2004.
- Rodgers [1976] Clive D Rodgers. Retrieval of atmospheric temperature and composition from remote measurements of thermal radiation. Reviews of Geophysics, 14(4):609–624, 1976.
- O’Neill et al. [2016] Brian C O’Neill, Claudia Tebaldi, Detlef P Van Vuuren, Veronika Eyring, Pierre Friedlingstein, George Hurtt, Reto Knutti, Elmar Kriegler, Jean-Francois Lamarque, Jason Lowe, et al. The scenario model intercomparison project (scenariomip) for cmip6. Geoscientific Model Development, 9(9):3461–3482, 2016.
- Saha and Ghosh [2019] Anamitra Saha and Subimal Ghosh. Can the weakening of indian monsoon be attributed to anthropogenic aerosols? Environmental Research Communications, 1(6):061006, 2019.
- Ravela [2014] Sai Ravela. Spatial inference for coherent geophysical fluids by appearance and geometry. In IEEE Winter Conference on Applications of Computer Vision, pages 925–932. IEEE, 2014.
- Ravela [2015] Sai Ravela. Dynamic data-driven deformable reduced models for coherent fluids. Procedia Computer Science, 51:2464–2473, 2015.