RankSEG: A Consistent Ranking-based Framework for Segmentation
Abstract
Segmentation has emerged as a fundamental field of computer vision and natural language processing, which assigns a label to every pixel/feature to extract regions of interest from an image/text. To evaluate the performance of segmentation, the Dice and IoU metrics are used to measure the degree of overlap between the ground truth and the predicted segmentation. In this paper, we establish a theoretical foundation of segmentation with respect to the Dice/IoU metrics, including the Bayes rule and Dice-/IoU-calibration, analogous to classification-calibration or Fisher consistency in classification. We prove that the existing thresholding-based framework with most operating losses are not consistent with respect to the Dice/IoU metrics, and thus may lead to a suboptimal solution. To address this pitfall, we propose a novel consistent ranking-based framework, namely RankDice/RankIoU, inspired by plug-in rules of the Bayes segmentation rule. Three numerical algorithms with GPU parallel execution are developed to implement the proposed framework in large-scale and high-dimensional segmentation. We study statistical properties of the proposed framework. We show it is Dice-/IoU-calibrated, and its excess risk bounds and the rate of convergence are also provided. The numerical effectiveness of RankDice/mRankDice is demonstrated in various simulated examples and Fine-annotated CityScapes, Pascal VOC and Kvasir-SEG datasets with state-of-the-art deep learning architectures. Python module and source code are available on Github at https://github.com/statmlben/rankseg.
Keywords: Segmentation, Bayes rule, ranking, Dice-calibrated, excess risk bounds, Poisson-binomial distribution, normal approximation, GPU computing
1 Introduction
Segmentation is one of the key tasks in the field of computer vision and natural language processing, which groups together similar pixels/features of an input that belong to the same class (Ronneberger et al., 2015; Badrinarayanan et al., 2017). It has become an essential part of image and text understanding with applications in autonomous vehicles (Assidiq et al., 2008), medical image diagnostics (Wang et al., 2018), face/fingerprint recognition (Xin et al., 2018), and video action localization (Shou et al., 2017).
The primary aim of segmentation is to label each foreground feature/pixel of an input with a corresponding class. Specifically, for a feature vector or an image , a segmentation function yields a predicted segmentation , where represents the predicted segmentation for the -th feature , and is the index set of the segmented features of provided by . Correspondingly, is a feature-wise label of a ground truth segmentation, where indicates that the -th feature/pixel is segmented, and is the index set of the ground-truth features.
To access the performance for a segmentation function , the Dice and IoU metrics are introduced and widely used in the literature (Milletari et al., 2016), both of which measure the overlap between the ground truth and the predicted segmentation:
| (1) |
where is the cardinality of a set, and is a smoothing parameter. When , , where TP is the true positive, FP is the false positive, and FN is the false negative. Both metrics are similar and will be treated in a unified fashion; however, as to be seen in the sequel, searching for the optimal segmentation function with respect to the IoU metric may require extra computation than its Dice counterpart. Thus, for clarity of presentation, we first focus on the Dice metric and postpone the discussion on the relationships between the Dice and IoU metrics in Section 4.2.
The recent success of fully convolutional networks has enabled significant progress in segmentation. In literature, the mainstream of recent works devoted to designing and developing neural network architectures under different segmentation scenarios, including FCN (Long et al., 2015), U-Net (Ronneberger et al., 2015), DeepLab (Chen et al., 2018), and PSPNet (Zhao et al., 2017). Despite their remarkable performance, most existing models primarily focus on predicting segmentation using a classification framework, without considering the inherent disparities between classification and segmentation (as discussed in Section 1.1). We find this framework leading to an inconsistent solution and suboptimal performance with respect to the Dice/IoU metrics, and we address this pitfall by developing a novel consistent ranking-based framework, namely RankSEG (RankDice to the Dice metric and RankIoU to the IoU metric), to improve the segmentation performance.
1.1 Existing methods
Most existing segmentation methods are developed under a threshold-based framework with two types of loss functions.

As indicated in Figure 1, the existing threshold-based segmentation framework, inspired by binary classification, provides a predicted segmentation via a two-stage procedure: (i) estimating a decision function or a probability function based on a loss; (ii) predicting feature-wise labels by thresholding the estimated decision function or probabilities. Specifically, given a training dataset , the prediction provided by the threshold-based framework for a new instance can be formulated as:
| (2) |
where is an operating loss, is a candidate probability function with being the candidate probability of the -th pixel, is a class of candidate probability functions, is a regularization term, is a tuning parameter to balance the overfitting and underfitting, and is an indicator function. For ease of presentation, is specified as a probability function and a predicted segmentation is produced by thresholding at 0.5, yet it can be equally extended to a general decision function. For example, we may formulate as a decision function with range in , and the prediction is produced by thresholding at , analogous to SVMs in classification (Cortes and Vapnik, 1995). Next, under the framework (2), two different types of operating loss functions are considered, namely the classification-based losses and the Dice-approximating losses.
Classification-based losses completely characterize segmentation as a classification problem, with examples such as the cross-entropy (CE; Cox (1958)) and the focal loss (Focal; Lin et al. (2017)):
| (3) | ||||||
where is a hyperparameter for the focal loss (Lin et al., 2017). Other margin-based losses such as the hinge loss, in principle, can be included as classification-based losses with a decision function ranged in thresholding at 0, although they are less frequently used in a multiclass problem (Tewari and Bartlett, 2007). Therefore, we focus on the probability-based classification loss in the sequel.
Dice-approximating losses aim to approximate the Dice/IoU metric and conduct a direct optimization. Typical examples are the soft-Dice (Sudre et al., 2017) and the Lovasz-softmax loss (Berman et al., 2018):
where is the Lovasz extension of the mis-IoU error (Berman et al., 2018), and is the element-wise product. Specifically, the soft-Dice loss replaces the binary segmentation indicator in the Dice metric by a candidate probability function to make the computation feasible. The Lovasz-softmax directly takes a convex extension of IoU based on a softmax transformation. Moreover, other losses including the Tversky loss (Salehi et al., 2017), the Lovasz-hinge loss (Berman et al., 2018), and the log-Cosh Dice loss (Jadon, 2021) can be also categorized as Dice-approximating losses.
The threshold-based framework (2) with a classification-based loss or a Dice-approximating loss is a commonly used approach for segmentation. Although encouraging performance is delivered, we show that the minimizer from (2) (based on the cross-entropy and the focal loss) is inconsistent (or suboptimal) to the Dice metric, see Lemma 9. For Lovasz convex losses, it is still unclear if they are able to yield an optimal segmentation (convex closure is usually not enough to ensure the consistency (Bartlett et al., 2006)). Moreover, in practice, only a small number of pixel predictions are taken into account in one stochastic gradient step. Therefore, the Lovasz-softmax loss cannot directly optimize the segmentation metric (see Section 3.1 in Berman et al. (2018)).
Another line of work (Bao and Sugiyama, 2020; Nordström et al., 2020; Lipton et al., 2014) has been centered on a linear-fractional approximation of the Dice and IoU metrics which are not decomposable per instance. In particular, Bao and Sugiyama (2020) and Nordström et al. (2020) proposed to approximate the utility by tractable surrogate functions with a sample-splitting procedure and showed that their methods are consistent in optimizing the target utility. Yet, splitting the sample may undermine the efficiency. Lipton et al. (2014) indicated that the optimal threshold maximizing the metric is equal to half of the optimal value. However, their definitions of Dice and IoU metrics may overlook small instances, which is undesirable in many applications; see Appendix A for technical discussion.
To summarize, the current frameworks with existing losses may either yield a suboptimal solution or suffer from an inappropriate target metric, demanding efforts to further improve the performance, robustness and sustainability of the existing segmentation framework.
1.2 Our contribution
In this paper, we propose a novel Dice-calibrated ranking-based segmentation framework, namely RankDice, to address the inconsistency of the existing framework. RankDice is primarily inspired by the Bayes rule of Dice-segmentation. We summarize our major contribution as follows:
-
1.
To our best knowledge, the proposed ranking-based segmentation framework RankDice, is the first consistent segmentation framework with respect to the Dice metric (Dice-calibrated).
-
2.
Three numerical algorithms with GPU parallel execution are developed to implement the proposed framework in large-scale and high-dimensional segmentation.
-
3.
We establish a theoretical foundation of segmentation with respect to the Dice metric, such as the Bayes rule and Dice-calibration. Moreover, we present Dice-calibrated consistency (Lemma 10) and a convergence rate of the excess risk (Theorem 11) for the proposed RankDice framework, and indicate inconsistent results for the existing methods (Lemma 9).
- 4.
It is worth noting that the results are equally applicable to the proposed RankIoU framework in terms of the IoU metric.
2 RankDice
It is reasonable to assume that all information on a feature-wise label is solely based on input features, that is, for any . In Appendix B.3, we provide a probabilistic perspective to suggest the necessity of this assumption in segmentation tasks. Without loss of generality, we further assume that are distinct for with probability one.
2.1 Bayes segmentation rule
To begin with, we call segmentation with respect to the Dice metric as “Dice-segmentation”. Then, we discuss Dice-segmentation at the population level, and present its Bayes (optimal) segmentation rule in Theorem 1 akin to the Bayes classifier for classification.
Theorem 1 (The Bayes rule for Dice-segmentation)
A segmentation rule is a global maximizer of if and only if it satisfies that
The optimal volume (the optimum total number of segmented features) is given as
| (4) |
where is the index set of the -largest conditional probabilities with , , and are Poisson-binomial random variables, and is a Bernoulli random variable with the success probability . See the definition of the Poisson-binomial distribution in Appendix B.2.
Two remarkable observations emerge from Theorem 1. First, the Bayes segmentation operator can be obtained via a two-stage procedure: (i) ranking the conditional probability , and (ii) searching for the optimal volume of the segmented features . Second, both the Bayes segmentation rule and the optimal volume function are achievable when the conditional probability is well-estimated. Therefore, our proposed framework RankDice is directly inspired by a general plug-in rule of the Bayes segmentation rule.
Moreover, Lemma 9 (and examples provided in its proof) indicates that the segmentation rule produced by existing frameworks, such as the threshold-based framework, can significantly differ from the optimum in Theorem 1. In fact, Lemma 9 further proves that the cross-entropy loss, the focal loss, and even a general classification-calibrated loss (Zhang, 2004; Bartlett et al., 2006), are not Dice-calibrated. See the definition of Dice-calibrated (Definition 8), and the negative results for existing frameworks (Lemma 9) in Section 4.1. Besides, the Bayes rule for IoU-segmentation is presented in Lemma 13.
Remark 2 (Suboptimal of a fixed-thresholding framework)
The Bayes rule of Dice-segmentation can be also regarded as adaptive thresholding of conditional probabilities. Specifically, for each input , the optimal segmentation rule can be rewritten as:
Alternatively, Theorem 1 indicates that the Bayes rule for Dice-segmentation is unlikely to be obtained by a fixed thresholding framework, since the optimal threshold varies greatly across different inputs. Therefore, (tuning a threshold on) a fixed thresholding-based framework leads to a suboptimal solution.
Remark 2 also explains the heterogeneity of optimal thresholds in various datasets indicated in Bice et al. (2021), and the suboptimality of a fixed-thresholding framework is also empirically supported by Table 10 and Figure 7 for simulated examples, and Table 7 and Figure 4 for real datasets. Furthermore, the fact that fixed-thresholding is suboptimal for Dice-segmentation should be compared with the existing results in classification. For binary classification, the optimal threshold maximizing the metric is equal to half of the optimal value, which is fixed (Lipton et al., 2014). This disparity stems from a different definition of the Dice metric (or ) for binary classification, where -score (for binary classification) can be regard as a linear fractional utility of Dice defined in (1); see more discussion in Appendix A.
2.2 Proposed framework
Suppose a training dataset is given, where and are the input features and the true label for the -th instance. Inspired by Theorem 1, we develop a ranking-based framework RankDice for Dice-segmentation (Steps 1-3).
Step 1 (Conditional probability estimation): Estimate the conditional probability based on logistic regression (the cross-entropy loss):
| (5) |
where is a class of candidate probability functions, is a regularization for a candidate function, and is a hyperparameter to balance the loss and regularization. For example, is usually a deep convolutional neural network for image segmentation, and can be a matrix norm of weight matrices in the network.
Step 2 (Ranking): Given a new instance , rank its estimated conditional probabilities decreasingly, and denote the corresponding indices as , that is, .
Step 3 (Volume estimation): From (4), we estimate the volume by replacing the true conditional probability by the estimated one :
| (6) |
where and are Poisson-binomial random variables, and are independent Bernoulli random variables with success probabilities ; for .
Finally, the predicted segmentation is given by selecting the indices of the top- conditional probabilities:
| (7) |
The proposed RankDice framework (Steps 1-3) provides a feasible solution to the Bayes segmentation rule in terms of the Dice metric. Note that Step 1 is a standard conditional probability estimation, and Step 2 simply ranks the estimated conditional probabilities. Next, we focus on developing a scalable computing scheme for Step 3.
2.3 Scalable computing schemes
This section develops scalable computing schemes for volume estimation in (6). Note that (6) can be rewritten as:
| (8) |
The computational complexity of solving (2.3) is intimately related to the dimension of input features. Therefore, we develop numerical algorithms for low- and high-dimensional segmentation separately.
2.3.1 Exact algorithms for low-dimensional segmentation
Exact algorithm based on FFT. When the dimension is low (), we consider an exact algorithm to evaluate and . According to the definition of , it can be computed by the following recursive formula ():
| (9) |
where . On this ground, it suffices to evaluate and , which are the probability mass functions of Poisson-binomial random variables and , respectively. As indicated in Hong (2013), they can be efficiently evaluated by a fast Fourier transformation (FFT). Based on the numerical results in Hong (2013), the computing time for FFT evaluation with is generally negligible (less than ten milliseconds). Moreover, it is worth noting that our algorithm in (9) needs not store the entire auxiliary matrix , since the -th row can be computed from the previous row . Hence, only storage is required in (9). The detailed algorithm is summarized in Algorithm 1 with approx=False.
2.3.2 Approximation algorithms for high-dimensional segmentation
For high-dimensional segmentation, especially for image segmentation, it is challenging to solve (6) by a grid searching over . To address this issue, we use shrinkage and approximation techniques to reduce the computational complexity of (6). First, Lemma 3 is developed to shrink the searching range of .
Lemma 3 (Shrinkage)
If , then for all .
Lemma 3 can be viewed as an early stopping of the grid searching, which draws from the property of Poisson binomial distribution (c.f. Lemma 17). Accordingly, we can shrink the grid search in (6) from to , which significantly reduces the computational complexity. Specifically,
| (10) |
In many applications, is upper bounded by a small integer, that is, , called the well-separated segmentation. For example, there exists a small number of features/pixels whose probabilities (close to 1) are much larger than the others.
Truncated refined normal approximation (T-RNA). Note that the cumulative distribution function (CDF), and thus the probability mass function, of a Poisson-binomial random variable can be efficiently evaluated by a refined normal approximation when the dimension is large (Hong, 2013; Neammanee, 2005). For instance,
| (11) |
where and are two skew-corrected refined normal CDFs, is the CDF of the standard normal distribution, and , , are mean, variance and skewness of the Poisson-binomial random variables and , respectively. See the definitions of variance and skewness of the Poisson-binomial distribution in Appendix B.2.
On this ground, it is unnecessary to compute all and for , since they are negligibly close to zero when is too small or too large. In other words, many and can be ignored when evaluating and . Therefore, according to the refined normal approximation in (2.3.2), and can be approximated by only taking a partial sum over a subset of :
| (12) |
where , , is the quantile function of the refined normal distribution, and is a custom tolerance error. The detailed algorithm is summarized in Algorithm 1 with approx=‘T-RNA’. Moreover, the following lemma quantifies the approximation error of the proposed approximate algorithm.
Lemma 4
Note that is the variance of , which often tends to infinity as . In image segmentation, the dimension varies from 1024 (32x32) to 262144 (512x512). Therefore, the error bound is practical for high-dimensional segmentation. Moreover, is the tolerance error to balance the approximation error and computation complexity. For instance, when becomes smaller, the approximation error decreases, the computation complexity increases with an enlarged . Typically, when . Based on the approximation formula (2.3.2), the worst-case computational complexity is reduced to for general segmentation and for well-separated segmentation (). The computational complexity is summarized in Table 1 (based on ).
Although T-RNA significantly reduces the computational complexity, yet this algorithm uses recursive updates, making it difficult in parallel computing on GPUs. For example, due to the memory issues, recursive function calls are restricted in the CUDA (Compute Unified Device Architecture) kernels (Nickolls et al., 2008). Next, we propose the blind approximation algorithm to exploit GPU-computing for the proposed RankDice.
Blind approximation (BA). In high-dimensional segmentation, the difference in distributions between and is negligible. Inspired by this fact, we propose a novel approximation algorithm, namely the blind approximation, to simultaneously evaluate the score functions with a small error tolerance. Specifically, based on the refined normal approximation, we further simplify the evaluation formulas by replacing as :
where is defined in (2.3.2). Then, for any , and can be simultaneously computed over based on cross-correlation (flipped convolution (Tahmasebi et al., 2012)):
| (13) |
where and is the cumulative sum of sorted estimated probabilities, is element-wise product of two vectors, and is the cross-correlation operator (flipped convolution) of two vectors (Tahmasebi et al., 2012). Notably, the cross-correlation can be efficiently implemented by a fast Fourier transform (Bracewell and Bracewell, 1986) with time complexity . Besides, the overall time complexity with CUDA implementation on GPUs can be further reduced by parallel computing. The detailed algorithm is summarized in Algorithm 1 with approx=‘BA’. Next, Lemma 5 shows the approximation error of the proposed blind approximation algorithm.
Lemma 5
In contrast to the truncated refined normal approximation, the blind approximation algorithm significantly reduces the time complexity and enables GPU parallel execution. On the other hand, the blind approximation leads to an additional in Lemma 5 compared with that of T-RNA in Lemma 4, yet the error bound is still acceptable in practice.
Taken together, we summarize the foregoing computational schemes in Algorithm 1, and their inference (after obtaining conditional probabilities) computational complexity (worst-case) is indicated in Table 1. For the threshold-based framework, thresholding the estimated probabilities takes time complexity. For the proposed method, Step 2 takes based on the merge sort (Ajtai et al., 1983), and Step 3 takes based on T-RNA in (10) and (2.3.2), and takes based on BA in (2.3.2).
| SEG framework | Time | Time (well-separated) | Memory | ||||
|---|---|---|---|---|---|---|---|
| Threshold-based SEG | |||||||
| RankDice (our) | |||||||
| RankDice-RNA (our) | |||||||
| RankDice-BA (our) |
3 mDice-segmentation and mRankDice
In this section, we discuss the extension of the proposed RankDice framework to segmentation with multiclass/multilabel outcomes evaluated by the mDice metric. Overall, multiclass/multilabel segmentation differs from Dice-segmentation in a number of important aspects. First, a new evaluation metric called mDice is introduced. Second, multiclass/multilabel outcomes provide two different ways of probabilistic modeling. Third, whether (or not) to allow for overlapping segmentation results among different classes leads to different problem setups. These aspects will be discussed in detail in the following subsections.
3.1 The mDice metric
For multiclass/multilabel segmentation, is available, where represents a feature vector, is the total number of classes of interest, is the true feature-wise segmentation label for the -th class, where indicates that the -th feature is segmented under the -th class, and is the class-specific index set for all segmented features.
On this ground, a class-specific segmentation operator is introduced, where is the predicted segmentation for the class of the -th feature, and is the class-specific index set of features for the predicted segmentation. Then, given a segmentation operator , the multi-Dice (mDice) metric is defined as:
| (14) |
where is the Dice metric under the -th class, is a weight vector for classes with . For example, yields that each class has the same contribution to segmentation performance. More generally, can be a custom weight vector indicating the relative importance of segmentation classes. In practice, given a new instance , the weight is an average over classes excluding those are not present and not predicted, that is,
| (15) |
Following our convention, we shall call multiclass/multilabel segmentation with respect to the mDice metric as “mDice-segmentation”. As indicated in Figure 2, unlike Dice-segmentation, mDice-segmentation provides more flexibility in probabilistic modeling (multiclass or multilabel) and the decision-making in prediction (taking argmax or thresholding at 0.5), resulting in different operating losses and the construction of predictive functions.
3.2 Multilabel/multiclass outcomes
In this section, we describe two probabilistic models (multilabel or multiclass) of , where is the true label for the -th feature.
For multilabel modeling, we assume each feature could be assigned to multiple classes, that is, , for . As a result, the index sets of segmented features may overlap among classes. In this case, we formulate and estimate under a multilabel probabilistic model. For example, for deep learning models, we use the sigmoid function as the output layer activation function of a neural network with the binary cross-entropy loss.
For multiclass modeling, each feature is assigned to one and only one class, that is, for . An instance is the panoptic annotation in image segmentation. In this case, we formulate and estimate under a multiclass model with additional sum-to-one constraints for and . Specifically, for deep learning models, we use the softmax function as the output layer activation function of a neural network, which automatically enforces the sum-to-one constraints. Correspondingly, a multiclass loss is used as an operating loss, including the multiclass cross-entropy. Note that the Dice-approximating losses, such as the soft-Dice loss, can be adopted into the multilabel/multiclass modeling.
In literature, once the estimation is done, the predicted segmentation is produced by taking argmax or thresholding at 0.5 on the estimated probabilities. Indeed, argmax and thresholding are inspired by the decision-making in multiclass and multilabel classification, respectively. In segmentation, it is possible to attempt ad-hoc combinations, such as multiclass modeling + thresholding, and multilabel modeling + argmax. The major purpose of argmax is to provide non-overlapping prediction (e.g., the panoptic prediction in image segmentation). We discuss overlapping/non-overlapping segmentation in the next section.

3.3 Overlapping or non-overlapping mDice-segmentation
Specifically, whether (or not) to allow for overlapping results among distinct classes leads to different decision-making procedures, namely overlapping/non-overlapping mDice-segmentation:
| (16) |
In the overlapping setting, there is no restriction on a segmentation operator, thus the predicted segmentation for different classes may overlap. On the other hand, the overlapping is ruled out in non-overlapping formulation due the additional sum-to-one constraint. Lemma 6 presents the Bayes rule for overlapping segmentation, yielding that mDice-segmentation is reduced to class-specific Dice-segmentation subproblems if overlapping is allowed.
Lemma 6 (The Bayes rule for overlapping mDice-segmentation)
An overlapping (allowing) segmentation operator is a global maximizer of if and only if is the Bayes rule (global maximizer) of on for all .
Therefore, it suffices to consider Dice-segmentation of each class separately in overlapping mDice-segmentation, and the proposed RankDice is readily extended to mRankDice; see Section 3.4.
Next, we investigate the Bayes rule for non-overlapping mDice-segmentation. To proceed, we denote as the Bayes rule (global maximizer) of non-overlapping mDice-segmentation in (16), and as the volume function of the Bayes segmentation rule:
Lemma 7
Suppose is pre-known, then solving the Bayes rule for non-overlapping mDice-segmentation in (16) is equivalent to an assignment problem.
As indicated in Lemma 7, even when the optimal volume function is pre-given, solving the Bayes rule for non-overlapping segmentation is nontrivial. For example, the most successful assignment algorithms, including the Hungarian method (Kuhn, 1955; Edmonds and Karp, 1972; Tomizawa, 1971) and its variants Jonker-Volgenant algorithm (Crouse, 2016), generally achieves an running time complexity in our content, which is time-consuming for high-dimensional segmentation. In sharp contrast, for the overlapping case, when is given, the Bayes rule is simply ranking all the conditional probabilities with . Moreover, when is unknown, the optimization for non-overlapping segmentation becomes a nonlinear integer optimization which is NP-hard in general (Murty and Kabadi, 1985; D’Ambrosio et al., 2020). Therefore, a fast greedy approximation algorithm is more feasible in practical implementation. We leave pursuing this topic as future work.
Next, we summarize the proposed mRankDice framework under three scenarios.
3.4 mRankDice
In this section, we present the proposed mRankDice framework for mDice-segmentation. Before we proceed, we highlight the different roles of multiclass/multilabel modeling and the overlapping/non-overlapping constraint. Multiclass/multilabel modeling determines the probabilistic models (say the softmax or the sigmoid activation in a neural network) and an operating loss in probability estimation (say the cross-entropy or the binary cross-entropy). Meanwhile, the overlapping/non-overlapping constraint affects the segmentation prediction after the probabilities are estimated.
Therefore, we consider following segmentation three cases: “multilabel + overlapping”, “multiclass + overlapping”, and “multilabel/multiclass + non-overlapping”.
mRankDice (multilabel + overlapping segmentation) is a straightforward extension of RankDice in Dice-segmentation (inspired by Lemma 6). Given a training dataset , with the same manner, the conditional probability function is estimated under a multilabel logistic regression (the binary cross-entropy loss):
| (17) |
where is a matrix function, and is a candidate estimator of . Then, given a new instance , the class-specific segmentation is generated based on Steps 2-3 in Section 2.2 with the estimated conditional probabilities (the -th column of ). We summarize the foregoing computational scheme in Algorithm 2.
mRankDice (multiclass + overlapping segmentation) yields a different probability estimation procedure, where the conditional probability function is estimated under a multiclass logistic regression (the multiclass cross-entropy loss):
| (18) |
where is a matrix function, and is a candidate estimator of . Although the probability estimation (18) differs from (17), the downstream ranking and volume estimation remain the same according to Lemma 6. We also summarize the foregoing computational scheme in Algorithm 2.
mRankDice (multiclass/multilabel + non-overlapping segmentation) is a quite difficult scenario for developing mRankDice from RankDice in Dice-segmentation. As indicated in Lemma 7, searching for an optimal non-overlapping mDice-segmentation operator is NP-hard in general. We leave pursuing this topic as future work.
4 Theory
In this section, we establish a theoretical foundation of segmentation, including the concept of Dice-calibration, the excess risk of the Dice metric, and the rate of convergence with respect to the excess risk of the proposed RankDice framework. For illustration, we focus on Dice-segmentation, and the results can be extended to mDice-segmentation, and RankIoU in terms of the IoU metric.
4.1 Dice-calibrated segmentation
In Theorem 1, the Bayes rule of Dice-segmentation is obtained. To carry this agenda further, we propose concept of “Dice-calibrated”, following the same philosophy of Fisher consistency or classification-calibration in Lin (2004); Zhang (2004); Bartlett et al. (2006). Intuitively, Dice-calibration is the weakest possible condition on a consistent segmentation method with respect to the Dice metric, this is, at population level, a method ultimately searches for the Bayes rule that achieves the optimal Dice metric. Figure 3 indicates the overview and logical relations among the theoretic results in this section.

To proceed, let be the class of all probability measures on (Borel) measurable subsets of such that , , and for . Denote as the class of all (Borel) measurable segmentation operators . The definition of Dice-calibrated segmentation is given as follows.
Definition 8 (Dice-calibrated segmentation)
Given , a (population) segmentation method is Dice-calibrated if, for any ,
where is the Bayes rule for Dice-segmentation defined in Theorem 1.
Now, we show that most existing loss functions, under the framework (2), are not Dice-calibrated.
Lemma 9
Given a loss function , define under the framework (2), that is,
Then, is not Dice-calibrated for when is any classification-calibrated loss, including the cross-entropy loss and the focal loss.
Lemma 9 indicates that the existing framework (2) with most losses ultimately yields a suboptimal solution to Dice-segmentation, even if a “classification-calibrated” loss, such as the cross-entropy loss or the focal loss (Charoenphakdee et al., 2021), is used. Meanwhile, as indicated in Bertels et al. (2019), the optimization with the soft-Dice loss can introduce a volumetric bias for tasks with high inherent uncertainty. In sharp contrast, the proposed RankDice method is Dice-calibrated (Lemma 10) and its asymptotic convergence rate in terms of the Dice metric is provided in Theorem 11.
To proceed, we give the definition of RankDice at population level in Appendix B.1, which replaces the average in (5) by the population expectation. Moreover, the cross-entropy loss in (5) can be extended to an arbitrary strictly proper loss (Gneiting and Raftery, 2007). The most common strictly proper losses are the cross-entropy loss and the squared error loss.
Lemma 10 (Dice-calibrated)
The proposed RankDice framework with a strictly proper loss is Dice-calibrated.
Next, we present an excess risk bound in terms of the Dice metric, that is, .
Theorem 11 (Excess risk bounds)
Given , let be an estimated probability of , and be the RankDice segmentation function defined in (7) based on , then
| (19) |
where is a universal constant depending only on .
As indicated in Theorem 11, the excess risk of the Dice metric for the proposed RankDice framework is upper bounded by the total variation (TV) distance between the estimated probability and the true probability . Note that the Kullback-Leibler divergence (the excess risk for the cross-entropy) dominates the TV distance. It follows that if the KL divergence between and goes to 0, then converges to in the TV sense, and so does to .
Taken together, we present the rate of convergence for the empirical estimator obtained from the proposed RankDice framework (Steps 1-3) in Section 2.2.
Corollary 12 (Convergence rate)
Note that is the excess risk of the cross-entropy loss or the negative conditional log-likelihood in (5), and its asymptotics as well as a rate of convergence can be established based on statistical learning theory of empirical risk minimization (Pollard, 1984; Shen, 1997; Bartlett et al., 2005; Giné and Koltchinskii, 2006; Cucker and Zhou, 2007), which depends on the sample size and the complexity of the probability class. Then, the rate of convergence of the excess risk in terms of the Dice metric is obtained via (20). Note that both (19) and (20) are derived for a fixed dimension, and the upper bounds can be extended and improved when the dimension of segmentation grows with the sample size.
Finally, we briefly discuss the connections of the developed theory (i.e., Lemma 10, Theorem 11 and Corollary 12) with the existing results. For example, Popordanoska et al. (2021) derived an upper bound for the volume bias in terms of the TV distance. It is worth noting that the volume bias focuses on conditional probability estimation and a small volume bias may not necessarily yield a consistent segmentation rule in terms of the Dice metric. In contrast, our result on the excess risk characterizes the performance of segmentation rule . Besides, Bao and Sugiyama (2020) proved the consistency of their method under a linear fractional approximation of Dice metric (see Appendix A), which seems not directly comparable to ours.
4.2 Relation between Dice and IoU metrics
In this section, we consider the relation and difference between Dice and IoU metrics, and present the Bayes rule for IoU-segmentation.
Lemma 13
A segmentation rule is a global maximizer of if and only if it satisfies that
The optimal volume is given as
| (21) |
where is the index set of the -largest conditional probabilities with , and is a Poisson-binomial random variable, and is a Bernoulli random variable with the success probability .
In view of Lemma 13, IoU-segmentation shares a substantial similarity with Dice-segmentation in terms of the Bayes rule. On this ground, a consistent RankIoU framework is also developed based on a plug-in rule by replacing as . Specifically, RankIoU comprises three steps, where Steps 1-2 are the same as in RankDice; see Section 2.2.
Step 3′ (IoU volume estimation): From (4), we estimate the volume by replacing the true conditional probability with the estimated one :
where is a Poisson-binomial random variable, and are independent Bernoulli random variables with success probabilities ; for .
Similar to RankDice, the predicted IoU-segmentation is produced by taking the top- conditional probabilities:
For multiclass/multilabel segmentation, the conditional probability estimation (17) and (18) are carried over into mRankIoU and the subsequent ranking and volume estimation remain the same as Step 2 and Step 3′ in binary segmentation.
Computationally, RankIoU involves the evaluation of in Step 3′. The FFT algorithm and the truncated refined normal approximation (T-RNA) are applicable after minor modifications; however, the blind approximation (BA) may not be appropriate due to the discrepancy of and , especially when the size of is large; see Section 2.3. Thus, the computation scheme of RankIoU might be relatively expensive in high-dimensional segmentation. Here, we present a parallel result of Lemma 3 to narrow down the searching range in Step 3′ of RankIoU.
Lemma 14
If
then for all , where
Theoretically, the concept of “IoU-calibrated” can be established (by replacing Dice as IoU in Definition 8) and the excess risk bounds can be derived in parallel to Dice-segmentation.
Theorem 15
Given , let be an estimated probability of , and be the RankIoU segmentation function based on , then
where is a universal constant depending only on . Consequently, if , then
5 Numerical experiments
This section describes a set of simulations and real datasets that demonstrate the segmentation performance of the proposed RankDice and mRankDice frameworks compared with the existing argmax- and thresholding-based frameworks using various loss functions and network architectures. For illustration, the segmentation performances for all numerical experiments are evaluated by empirical Dice/IoU metrics with , see Appendix A. For the mDice/mIoU metric, the class-specific weight is defined as in (15). All experiments are conducted using PyTorch and CUDA on an NVIDIA GeForce RTX 3080 GPU. All Python codes are available for download at our GitHub repository (https://github.com/statmlben/rankseg).
5.1 Simulation
In this section, we mainly compare the proposed RankDice framework with the thresholding-based framework (2) in various simulated examples. Note that for Dice-segmentation with binary outcomes, threshold- and argmax-based frameworks yield the same solution. Both frameworks require an estimation of conditional probability function in the first stage. Therefore, in order to convincingly demonstrate the difference between two frameworks, in our simulation, we assume the true conditional probabilities are perfectly estimated, and report the Dice metric of the downstream segmentation produced by two different frameworks.
Example 1. To mimic the spatial smoothness in practical segmentation problem, especially for image segmentation, the simulated dataset based on matrix response () is generated as follows. First, the true probability matrix are generated by two patterns:
-
•
Step decay: , if and ; , otherwise.
-
•
Exponential decay: , as visualized in the upper panel of Figure 6.
-
•
Linear decay: , as visualized in the lower panel of Figure 6.
Here is a decay parameter, is the uniform distribution, and is the truncated normal distribution with mean and standard deviation 0.1. In our simulation, we consider with for step decay, for exponential decay, and for linear decay. For each case, four different dimensions are considered: , and therefore increases from 784 to 65,536. Then, the proposed RankDice framework and the thresholding-based framework (at 0.5) are conducted on the true probability matrix . Both decay scenarios are replicated 100 times, and the averaged Dice metrics and its standard errors are summarized in Table 9.
Example 2. As indicated in Theorem 1 and Remark 2, the optimal segmentation volume (or the optimal threshold) varies significantly across different inputs. This example aims to illustrate the suboptimality of (tuning a threshold of) a fixed thresholding based on step decay in Example 1. To this end, the conditional probability matrices of inputs are generated as follows. First, to mimic the different segmentation scales/patterns over images in real applications. Next, is generated by step decay based on and . Then, the proposed RankDice framework and the fixed thresholding-based framework (at 0.1. , 0.9) are applied as the same manner in Example 1. All methods are applied with and , and the averaged Dice metrics and its standard errors are summarized in Table 10. In this example, the heterogeneous conditional probabilities yield different optimal segmentation volumes (or thresholds) for images, thus (tuning a threshold on) a fixed thresholding leads to a suboptimal solution. To better illustrate the adaptiveness over optimal thresholds, we also present the optimal thresholds for different images with various generating parameters on segmentation patterns of Example 2 in Figure 7, and similar results are demonstrated in Figure 4 for Pascal VOC 2012 dataset.
The major conclusions on the simulated examples are listed as follows.
-
•
It is evident that RankDice significantly outperforms the thresholding-based (at 0.5) framework in both decay scenarios with various dimensions (Table 9). The substantial improvement is consistent with the findings of Lemma 1, which indicates that segmentation and classification are entirely distinct problems.
-
•
Interestingly, the amount of improvement is gradually increased when the decay of probabilities becomes progressively faster (for exponential decay and linear decay). This suggests that the proposed RankDice might be even more advantageous in well-separated segmentation.
-
•
As suggested in Table 10, the proposed RankDice generally outperforms a fixed thresholding framework (with any threshold). This because that the optimal threshold can vary greatly across inputs, as indicated in Figure 7. Moreover, tuning the threshold may improve the performance of the thresholding-based framework, yet it still leads to a suboptimal solution compared with the proposed RankDice.

5.2 Real datasets
This section examines the performance of the proposed RankDice framework in the PASCAL VOC 2012 (Everingham et al., 2012), the fine-annotated CityScapes semantic segmentation benchmark (Cordts et al., 2016), and Kvasir SEG dataset polyp segmentation dataset (Ajtai et al., 1983). Three different neural network architectures are considered: DeepLab-V3+ (Chen et al., 2018) with resnet101 as the backbone, PSPNet with resnet50 as the backbone, and FCN8 with resnet101 as the backbone. We report both mDice and mIoU metrics of the segmentation produced by Threshold, Argmax and RankDice on the same estimated network/probability. Note that only overlapping segmentation is considered.
Fine-annotated Cityscapes dataset contains 5,000 high quality pixel-level annotated images. For all methods, we employ SGD on the learning rate (lr) schedule lr_schedule=‘poly’, and the initial learning rate initial_lr=0.01, weight_decay=100, momentum=0.9, crop size 512x512, batch size 6, and 300 epochs. The performance on validation set is measured in terms of the mDice and mIoU averaged across 19 object classes (Table 2).
Pascal VOC 2012 dataset contains 20 foreground object classes and one background class. The dataset contains 1,464 training and 1,449 validation pixel-level annotated images. We augment the dataset by using the additional annotations provided by Hariharan et al. (2011). For all methods, we employ SGD on lr_schedule=‘poly’, and the initial learning rate initial_lr=0.01, weight_decay=100, momentum=0.9, crop size 480x480, batch size 8, and an early stop with patient 10 based on validation loss. The performance on validation set is measured in terms of the mDice and mIoU averaged across the 20 object classes (Table 3). In this dataset, we also present a heatmap (Figure 4) for averaged minimal estimated probabilities for segmented features (i.e. ) by the proposed RankDice, to highlight its difference to the thresholding-based framework.
Kvasir SEG dataset contains 1000 polyp images and their ground truth segmentation (a single class) from the Kvasir dataset. The scale of the images varies from 332x487 to 1920x1072 pixels. For all methods, we employ SGD on lr_schedule=‘poly’, and the initial learning rate initial_lr=0.01, weight_decay=100, momentum=0.9, crop size 320x320, batch size 8, and 140 epochs. The performance on testing set is measured in terms of the Dice and IoU (Table 4).
Multiclass/multilabel loss. In both datasets, we use six loss functions (including multiclass and multilabel losses) in the implementation, including the cross-entropy (CE), the focal loss (Focal), the binary cross-entropy (BCE), the soft-Dice loss (Soft-Dice), the binary soft-Dice loss (B-Soft-Dice), and the LovaszSoftmax loss (LovaszSoftmax). For multiclass losses, including CE, Focal, Soft-Dice, and LovaszSoftmax, we use the softmax function as the output layer activation function of a neural network. For multilabel losses, including BCE and B-Soft-Dice, we use the sigmoid function as the output layer activation function of a neural network.
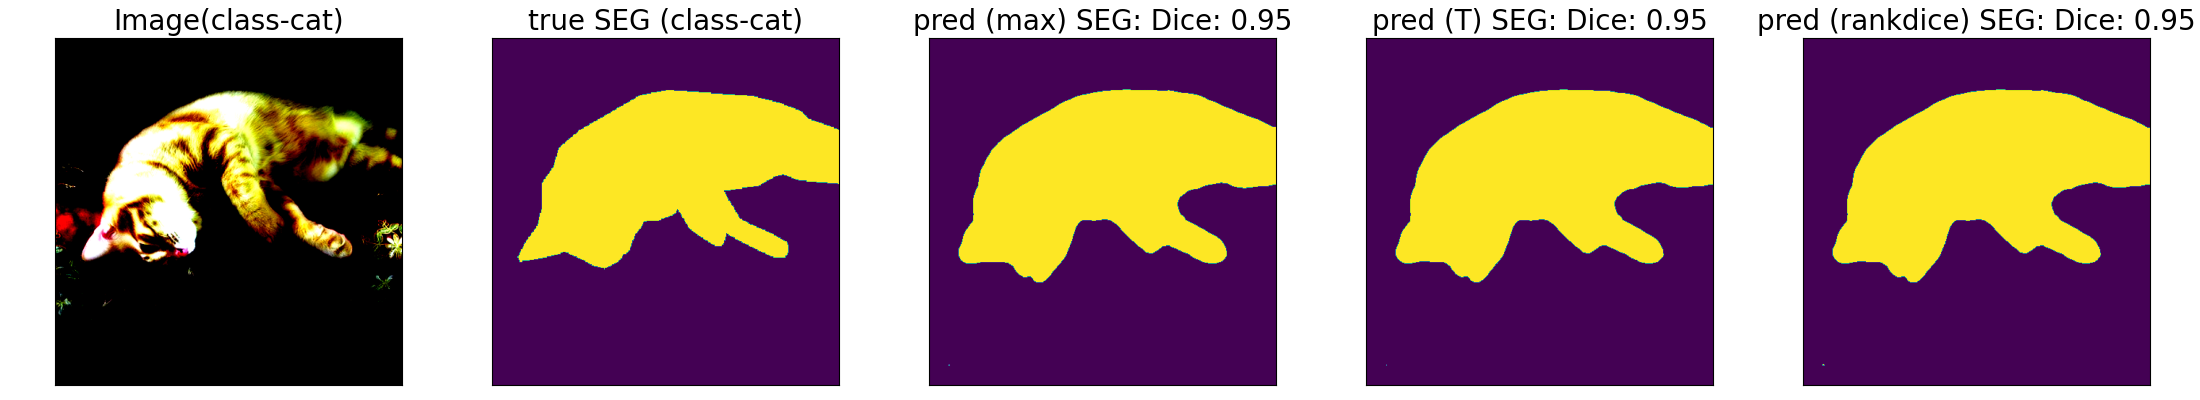
Dice-segmentation based on a single class. For the first two datasets, when we focus on a single object class, it reduces to a Dice-segmentation with binary outcomes. To examine the performance for the proposed RankDice in binary segmentation, we also report the Dice/IoU metric for each label separately. In principle, we need to train a model only on the binary label for an object class, then produce the segmentation prediction by thresholding (or argmax) and RankDice. However, based on our empirical study, a model trained from full labels is significantly better than the one trained from a single binary label. We thus train a model based the same procedure in the aforementioned segmentation with multiclass/multilabel losses on full labels, and then produce the prediction based on the estimated probability for each object class separately. The best two performances (“PSPNet + CE” and “PSPNet + BCE”) for both datasets are summarized in Tables 5 and 6. The performance for other models and losses can be found in the supplementary. In Figure 5, we present the segmentation results on illustrative examples for all methods to demonstrate the difference between the proposed RankDice and the existing methods.
The fixed-thresholding framework with different thresholds. As indicated in Remark 2 and Example 2 in Section 5.1, the optimal segmentation volume (or the optimal thresholding) varies significantly across different images, thus (tuning on) a fixed-thresholding yields a suboptimal solution. In Tables 7 and 10, we also report the numerical performance based on different thresholds for real datasets and Example 2, respectively.
Probability calibration via Temperature scaling (TS). According to Theorem 11, the consistency of the proposed method holds if the estimated conditional probabilities are calibrated. Alternatively, improving the probability calibration may improve the segmentation performance for the proposed framework. Therefore, in Table 8, we examine the numerical results of the proposed method via TS (with different tuning temperatures), which is one of the most effective probability calibration methods as suggested by Guo et al. (2017).
| Model | Loss | Threshold (at 0.5) | Argmax | mRankDice (our) | ||||
|---|---|---|---|---|---|---|---|---|
| (mDice, mIoU) () | (mDice, mIoU) () | (mDice, mIoU) () | ||||||
| DeepLab-V3+ | CE | (56.00, 48.40) | (54.20, 46.60) | (57.80, 49.80) | ||||
| (resnet101) | Focal | (54.10, 46.60) | (53.30, 45.60) | (56.50, 48.70) | ||||
| BCE | (49.80, 24.90) | (44.20, 22.10) | (54.00, 27.00) | |||||
| Soft-Dice | (39.50, 35.90) | (39.50, 35.90) | (39.50, 35.90) | |||||
| B-Soft-Dice | (41.00, 20.50) | (27.60, 13.80) | (41.10, 20.50) | |||||
| LovaszSoftmax | (55.20, 47.60) | (52.30, 45.10) | (55.50, 47.80) | |||||
| PSPNet | CE | (57.50, 49.60) | (56.50, 48.50) | (59.30, 51.00) | ||||
| (resnet50) | Focal | (56.00, 48.20) | (55.80, 47.70) | (58.20, 50.00) | ||||
| BCE | (51.40, 25.70) | (47.60, 23.80) | (55.10, 27.60) | |||||
| Soft-Dice | (49.10, 43.50) | (48.70, 43.20) | (49.30, 43.60) | |||||
| B-Soft-Dice | (46.30, 23.10) | (32.70, 16.40) | (46.20, 23.10) | |||||
| LovaszSoftmax | (56.80, 48.90) | (55.40, 47.70) | (56.70, 49.10) | |||||
| FCN8 | CE | (51.40, 43.70) | (50.50, 42.60) | (53.50, 45.30) | ||||
| (resnet101) | Focal | (48.50, 41.20) | (49.60, 41.60) | (51.50, 43.70) | ||||
| BCE | (39.40, 19.70) | (39.40, 19.70) | (41.30, 20.60) | |||||
| Soft-Dice | (28.30, 24.30) | (28.30, 24.30) | (28.30, 24.80) | |||||
| B-Soft-Dice | (29.10, 14.60) | (29.10, 14.60) | (29.10, 14.60) | |||||
| LovaszSoftmax | (48.10, 40.40) | (42.90, 35.80) | (48.90, 40.90) |
| Model | Loss | Threshold (at 0.5) | Argmax | mRankDice (our) | ||||
|---|---|---|---|---|---|---|---|---|
| (mDice, mIoU) () | (mDice, mIoU) () | (mDice, mIoU) () | ||||||
| DeepLab-V3+ | CE | (63.60, 56.70) | (61.90, 55.30) | (64.01, 57.01) | ||||
| (resnet101) | Focal | (62.70, 55.01) | (60.50, 53.20) | (62.90, 55.10) | ||||
| BCE | (63.30, 31.70) | (59.90, 29.90) | (64.60, 32.30) | |||||
| Soft-Dice | — | — | — | |||||
| B-Soft-Dice | — | — | — | |||||
| LovaszSoftmax | (57.70, 51.60) | (56.20, 50.30) | (57.80, 51.60) | |||||
| PSPNet | CE | (64.60, 57.10) | (63.20, 55.90) | (65.40, 57.80) | ||||
| (resnet50) | Focal | (64.00, 56.10) | (63.90, 56.10) | (66.60, 58.50) | ||||
| BCE | (64.20, 32.10) | (65.20, 32.60) | (67.10, 33.50) | |||||
| Soft-Dice | (59.60, 54.00) | (58.80, 53.20) | (60.00, 54.30) | |||||
| B-Soft-Dice | (63.30, 31.60) | (54.00. 27.00) | (64.30, 32.20) | |||||
| LovaszSoftmax | (62.00, 55.20) | (60.80, 54.10) | (62.20, 55.40) | |||||
| FCN8 | CE | (49.50, 41.90) | (45.30, 38.40) | (50.40, 42.70) | ||||
| (resnet101) | Focal | (50.40, 41.80) | (47.20, 39.30) | (51.50, 42.50) | ||||
| BCE | (46.20, 23.10) | (44.20, 22.10) | (47.70, 23.80) | |||||
| Soft-Dice | — | — | — | |||||
| B-Soft-Dice | — | — | — | |||||
| LovaszSoftmax | (39.80, 34.30) | (37.30, 32.20) | (40.00, 34.40) |
| Model | Loss | Threshold/Argmax | mRankDice (our) | |||
|---|---|---|---|---|---|---|
| (Dice, IoU) () | (Dice, IoU) () | |||||
| DeepLab-V3+ | CE | (87.9, 80.7) | (88.3, 80.9) | |||
| (resnet101) | Focal | (86.5, 87.3) | (83.1, 73.2) | |||
| Soft-Dice | (85.7, 77.8) | (85.8, 77.9) | ||||
| LovaszSoftmax | (84.3, 77.3) | (84.5, 77.4) | ||||
| PSPNet | CE | (86.3, 79.2) | (87.1, 79.8) | |||
| (resnet50) | Focal | (83.8, 75.4) | (81.8, 72.4) | |||
| Soft-Dice | (83.5, 75.9) | (83.7, 76.1) | ||||
| LovaszSoftmax | (86.0, 79.2) | (86.0, 79.2) | ||||
| FCN8 | CE | (81.9, 73.5) | (82.1, 73.6) | |||
| (resnet101) | Focal | (78.5, 69.0) | (70.3, 58.3) | |||
| Soft-Dice | — | — | ||||
| LovaszSoftmax | (82.0, 73.4) | (82.0, 73.4) |
Overall, the empirical results show that the proposed RankDice/mRankDice framework yields good performance in three segmentation benchmarks. The major empirical conclusions on the proposed RankDice are listed as follows.
-
•
As suggested in Tables 2 and 3, the proposed RankDice framework consistently outperforms the threshold-based and argmax-based frameworks based on the same trained model/network. The percentage of improvement on the best performance (for each framework) are 3.13% (over threshold) and 4.96% (over argmax) for CityScapes dataset (PSPNet + CE), and 3.87% (over threshold) and 2.91% (over argmax) for Pascal VOC 2012 dataset (PSPNet + CE/BCE), and 0.926% for Kvasir SEG dataset (PSPNet + CE).
-
•
For Dice-segmentation based on a single class, as suggested in Tables 5 and 6, the proposed RankDice framework consistently outperforms the threshold-/argmax-based framework for each class. The largest percentage of class-specific improvement in terms of the Dice metric on the best performance (for each framework) is 23.6% for CityScapes dataset, and 26.9% for Pascal VOC 2021 dataset.
-
•
The proposed RankDice works significantly better in “difficult” segmentation. As indicated in Tables 5 and 6, the improvements by RankDice are negatively correlated with the resulting Dice/IoU metrics. It is also suggested by Figure 5, where we illustrate three images from classes cat (no improvement) and chair (26.9% improvement). As presented in all examples of chair and the last example of cat, the improvement is significant when segmentation is difficult (the target object is either occluded or similar with other objects).
-
•
As suggested in Table 7, the empirical results are in line with Remark 2 (theoretically) and Table 10 (numerically), suggesting that the proposed RankDice generally outperforms a fixed thresholding framework (with any threshold). This because that the optimal threshold can vary greatly across images, as indicated in Figure 4. Moreover, tuning the threshold may improve the performance of the fixed-thresholding framework, yet it still leads to a suboptimal solution compared with the proposed RankDice.
-
•
As suggested in Table 8, the segmentation performance can be potentially improved by TS probability calibration method, especially 4.59% improvement for CE loss and 3.28% improvement for BCE in Pascal VOC 2021 dataset. Yet, the TS demands an additional validation dataset to tune the optimal temperature, thus more numerical experiments are required to suggest the effectiveness of this promising method. We leave pursuing this topic as future work.
-
•
As expected, the proposed RankDice/mRankDice performs well for strictly proper loss functions, including CE and BCE. In addition, we show that the performance is continuously improved compared with existing frameworks for some classification calibrated (only) losses, such as the focal loss. It is possible that this phenomenon is due to the relationship between the estimated scores (from focal loss) and the true conditional probabilities (cf. Charoenphakdee et al. (2021); Liu et al. (2021)). We leave this topic as future work.
-
•
Although the RankDice/mRankDice framework is developed for Dice/mDice optimization, the performance in terms of the IoU/mIoU metric is also consistently improved.
Moreover, we also present some important observations based on our experiments about losses, frameworks, and models.
-
•
CE, Focal and BCE are the top three losses for Dice-segmentation. While some Dice approximating losses, such as Soft-Dice and binary Soft-Dice, usually lead to suboptimal solutions.
-
•
It seems that the multiclass modeling and multiclass losses are more preferred for both datasets. Moreover, the threshold-based framework usually outperforms the argmax-based framework for both multiclass and multilabel losses.
-
•
For multiclass losses, including CE Focal, Soft-Dice, and LovaszSoftmax, the Dice and IoU metrics are consistent, i.e., a higher Dice yields a higher IoU score. For multilabel losses, including BCE and B-Soft-Dice, there is a significant difference between Dice and IoU metrics.
| Object class | Threshold/Argmax | RankDice (our) | imps. | |||||||
|---|---|---|---|---|---|---|---|---|---|---|
| (Dice, IoU) () | (Dice, IoU) () | (best vs. best) | ||||||||
| CE | Focal | BCE | CE | Focal | BCE | (Dice) | ||||
| road | (85.7, 77.2) | (86.1, 77.9) | (92.2, 46.1) | (85.6, 77.1) | (86.0, 77.7) | (92.2, 46.1) | ||||
| sidewalk | (57.3, 47.8) | (53.6, 43.8) | (43.8, 21.9) | (60.8, 50.8) | (58.7, 48.4) | (54.0, 27.0) | 6.1% | |||
| building | (84.6, 76.2) | (83.4, 74.8) | (79.4, 39.7) | (85.1, 76.7) | (83.6, 74.7) | (82.1, 41.0) | ||||
| wall | (17.4, 13.6) | (16.1, 12.4) | (04.9, 02.4) | (21.0, 16.4) | (21.5, 16.8) | (08.3, 04.2) | 23.6% | |||
| fence | (14.7, 10.9) | (12.4, 08.9) | (15.2, 07.6) | (15.8, 11.7) | (13.7, 09.8) | (19.1, 09.5) | 25.7% | |||
| pole | (41.9, 29.0) | (34.7, 23.4) | (27.1, 13.5) | (46.0, 31.7) | (35.6, 23.1) | (36.4, 18.2) | 9.8% | |||
| traffic light | (34.9, 26.5) | (31.5, 24.0) | (18.7, 09.4) | (37.4, 28.3) | (33.5, 24.7) | (21.3, 10.6) | 7.2% | |||
| traffic sign | (49.9, 39.0) | (45.9, 35.1) | (35.3, 17.6) | (51.4, 40.1) | (46.6, 35.1) | (39.6, 19.8) | 3.0% | |||
| vegetation | (90.2, 84.1) | (90.2, 83.8) | (89.0, 44.5) | (90.3, 84.1) | (89.6, 82.8) | (89.4, 44.7) | ||||
| terrain | (25.7, 20.1) | (24.1, 18.5) | (19.8, 09.9) | (29.4, 23.1) | (28.7, 22.7) | (25.3, 12.7) | 14.4% | |||
| sky | (83.6, 77.0) | (82.0, 75.2) | (80.1, 40.0) | (84.5, 77.8) | (83.1, 76.2) | (80.7, 40.3) | 1.1% | |||
| person | (45.1, 36.3) | (42.6, 34.1) | (32.8, 16.4) | (49.5, 40.0) | (47.6, 38.2) | (38.6, 19.3) | 9.8% | |||
| rider | (35.1, 27.3) | (31.2, 24.0) | (18.6, 09.3) | (37.2, 29.2) | (33.9, 26.3) | (24.0, 12.0) | 6.0% | |||
| car | (84.1, 76.9) | (83.4, 76.2) | (80.8, 40.4) | (84.0, 76.6) | (81.8, 74.0) | (81.2, 40.6) | ||||
| truck | (24.7, 21.9) | (25.6, 22.7) | (21.8, 10.9) | (26.6, 23.3) | (28.1, 24.8) | (26.8, 13.4) | 9.8% | |||
| bus | (46.8, 42.2) | (48.8, 43.8) | (36.3, 18.2) | (51.3, 46.5) | (51.5, 46.8) | (39.2, 19.6) | 5.5% | |||
| train | (34.9, 30.7) | (36.3, 31.0) | (33.8, 16.9) | (35.8, 31.5) | (37.3, 32.2) | (34.7, 17.4) | 2.8% | |||
| motorcycle | (19.7, 15.8) | (20.4, 16.1) | (07.0, 03.5) | (22.2, 17.7) | (21.1, 16.8) | (08.7, 04.4) | 8.8% | |||
| bicycle | (41.4, 32.5) | (42.1, 32.9) | (32.9, 16.5) | (41.9, 32.6) | (42.0, 32.5) | (36.7, 18.4) | ||||
| Object class | Threshold/Argmax | RankDice (our) | imps. | |||||||
|---|---|---|---|---|---|---|---|---|---|---|
| (Dice, IoU) () | (Dice, IoU) () | (best vs. best) | ||||||||
| CE | Focal | BCE | CE | Focal | BCE | (Dice) | ||||
| Aeroplane | (71.2, 63.4) | (68.4, 59.2) | (72.9, 36.5) | (71.3, 63.4) | (72.7, 64.1) | (75.3, 37.6) | 3.3% | |||
| Bicycle | (37.1, 25.9) | (19.6, 12.4) | (14.6, 7.30) | (38.7, 27.3) | (30.5, 20.6) | (23.1, 11.5) | 4.3% | |||
| Bird | (76.0, 68.2) | (74.3, 65.2) | (74.2, 37.1) | (76.6, 68.7) | (75.8, 66.4) | (76.3, 38.1) | ||||
| Boat | (51.1, 42.7) | (59.5, 49.1) | (55.5, 27.8) | (51.3, 42.9) | (61.9, 51.5) | (61.0, 30.5) | 4.0% | |||
| Bottle | (42.8, 35.8) | (36.2, 30.0) | (39.1, 19.6) | (44.2, 36.8) | (37.6, 31.4) | (41.1, 20.6) | 3.3% | |||
| Bus | (72.8, 68.3) | (72.3, 67.5) | (74.8, 37.4) | (74.1, 69.6) | (73.5, 68.8) | (75.9, 37.9) | 1.5% | |||
| Car | (53.5, 47.5) | (51.1, 45.6) | (48.9, 24.4) | (55.0, 49.0) | (53.6, 47.9) | (51.7, 25.9) | 2.7% | |||
| Cat | (75.0, 69.2) | (74.1, 67.9) | (73.1, 36.6) | (75.5, 69.7) | (75.4, 68.7) | (75.1, 37.6) | ||||
| Chair | (17.5, 12.8) | (16.7, 11.6) | (10.2, 5.10) | (19.6, 14.4) | (22.2, 16.1) | (14.5, 7.30) | 26.9% | |||
| Cow | (65.3, 58.6) | (60.1, 53.7) | (64.9, 32.4) | (66.5, 59.9) | (62.3, 56.0) | (68.4, 34.2) | 4.8% | |||
| Diningtable | (32.9, 27.5) | (33.6, 27.4) | (31.7, 15.9) | (34.5, 29.2) | (38.6, 32.4) | (35.3, 17.6) | 14.9% | |||
| Dog | (64.6, 57.9) | (71.0, 63.4) | (71.7, 35.9) | (65.5, 58.7) | (72.5, 64.9) | (74.4, 37.2) | 3.8% | |||
| Horse | (63.9, 55.3) | (67.3, 58.3) | (67.0, 33.5) | (65.3, 56.6) | (69.5, 60.1) | (70.9, 35.4) | 5.4% | |||
| Motorbike | (69.7, 60.6) | (65.5, 56.7) | (66.9, 33.5) | (71.6, 62.6) | (67.0, 57.9) | (70.1, 35.1) | 2.7% | |||
| Person | (67.0, 57.7) | (65.0, 55.4) | (67.4, 33.7) | (67.4, 58.1) | (67.2, 57.6) | (69.7, 34.8) | 3.4% | |||
| Pottedplant | (26.9, 20.2) | (22.4, 17.3) | (25.5, 12.8) | (29.1, 22.0) | (26.9, 20.7) | (28.6, 14.3) | 8.2% | |||
| Sheep | (53.9, 47.4) | (62.8, 55.4) | (62.1, 31.1) | (54.3, 47.9) | (66.0, 58.6) | (66.9, 33.4) | 6.5% | |||
| Sofa | (29.8, 25.0) | (29.8, 24.4) | (33.7, 16.8) | (32.0, 26.9) | (34.6, 29.0) | (38.9, 19.4) | 14.5% | |||
| Train | (77.7, 71.0) | (75.8, 68.9) | (80.3, 40.1) | (77.9, 71.1) | (77.3, 70.4) | (82.1, 41.1) | 2.2% | |||
| Tvmonitor | (48.4, 41.4) | (50.7, 41.6) | (53.7, 26.8) | (49.2, 42.0) | (54.1, 45.4) | (56.4, 28.2) | 5.0% | |||


| Framework | Thold | (Dice, IoU) () | ||
|---|---|---|---|---|
| threshold-based | 0.1 | (49.10, 24.60) | ||
| 0.2 | (53.00, 26.50) | |||
| 0.3 | (53.60, 26.80) | |||
| 0.4 | (52.90, 26.50) | |||
| 0.5 | (51.40, 25.70) | |||
| 0.6 | (49.60, 24.80) | |||
| 0.7 | (47.00, 23.50) | |||
| 0.8 | (43.40, 21.70) | |||
| 0.9 | (37.40, 18.70) | |||
| RankDice(our) | — | (55.10, 27.60) |
| Framework | Thold | (Dice, IoU) () | ||
|---|---|---|---|---|
| threshold-based | 0.1 | (56.80, 28.40) | ||
| 0.2 | (63.90, 32.00) | |||
| 0.3 | (65.70, 32.80) | |||
| 0.4 | (65.60, 32.80) | |||
| 0.5 | (64.20, 32.10) | |||
| 0.6 | (62.30, 32.00) | |||
| 0.7 | (59.30, 29.60) | |||
| 0.8 | (54.20, 27.10) | |||
| 0.9 | (43.40, 21.70) | |||
| RankDice(our) | — | (67.10, 33.50) |
| Dataset | Temp | Threshold | RankDice (our) | ||||
| (Dice, IoU) () | (Dice, IoU) () | ||||||
| CE | BCE | CE | BCE | ||||
| CityScapes | 1.0 | (57.50, 49.60) | (51.40, 25.70) | (59.30, 51.00) | (55.10, 27.60) | ||
| 1.2 | (57.40, 49.60) | / | (59.40, 51.20) | (54.70, 26.30) | |||
| 1.5 | (56.90, 49.20) | / | (59.40, 51.20) | (50.60, 25.30) | |||
| 1.7 | (56.20, 48.50) | / | (59.10, 51.00) | (47.20, 23.60) | |||
| 2.0 | (54.40, 46.90) | / | (58.00, 50.10) | (47.20, 23.60) | |||
| 2.2 | (52.80, 45.40) | / | (57.10, 49.30) | (44.70, 22.40) | |||
| 2.5 | (49.80, 42.50) | / | (55.40, 48.00) | (41.50, 20.70) | |||
| VOC 2012 | 1.0 | (64.60, 57.10) | (64.20, 32.10) | (65.40, 57.80) | (67.10, 33.50) | ||
| 1.2 | (64.50, 57.50) | / | (66.10, 58.30) | (68.80, 34.40) | |||
| 1.5 | (65.30, 57.70) | / | (66.90, 59.10) | (69.30, 34.60) | |||
| 1.7 | (65.30, 57.70) | / | (67.60, 59.80) | (69.00, 34.50) | |||
| 2.0 | (64.80, 57.10) | / | (68.30, 60.50) | (68.00, 34.00) | |||
| 2.2 | (63.80, 56.00) | / | (68.40, 60.60) | (67.00, 33.50) | |||
| 2.5 | (61.30, 53.40) | / | (67.90, 60.20) | (65.10, 32.50) | |||
6 Conclusions and future work
Summary. In this paper, we proposed a ranking-based framework for segmentation called RankSEG that comprises three steps: conditional probability estimation, ranking, and volume estimation. Specifically, we have focused on the Dice metric and developed RankDice, a version of RankSEG for optimal Dice-segmentation. We introduced a key concept “Dice-calibrated” and demonstrated that RankDice is able to recover the optimal segmentation rule, as opposed to the existing fixed-thresholding frameworks that are suboptimal with respect to the Dice metric. Computationally, we have developed efficient exact/approximate numerical methods, including GPU-enabled algorithms, to carry out RankDice. Moreover, we established general theoretical results, including excess risk bounds and a rate of convergence for RankDice, showing that RankDice is consistent when the conditional probability estimation is well-calibrated. Empirical experiments suggested that the proposed framework performs consistently well on a variety of segmentation benchmarks and state-of-the-art deep learning architectures. In parallel to RankDice, we also developed the framework RankIoU for the IoU metric. The theoretical results are similar, while the computation for the optimal IoU-segmentation could be more expensive in high-dimensional situation.
Limitation and future work. (i) For multiclass/multilabel segmentation, our results in this paper cover the overlapping (allowing) case; however, computing the optimal segmentation for the non-overlapping case is NP-hard. Thus, it would be interesting to develop a scalable approximating algorithm to utilize the proposed framework in the non-overlapping setting. (ii) The conditional independence, for any , is crucial for Theorem 1 and subsequent theorems in Section 4. In some segmentation applications, it is of interest to extend the proposed frameworks and theorems with locally dependent outcomes. (iii) When given the testing features, the proposed method can be extended to maximize the F1-score in classification tasks.
Acknowledgments and Disclosure of Funding
We would like to acknowledge support for this project from the HK RGC-ECS 24302422 and the CUHK direct fund. Ben Dai developed the main framework (RankDice), theory, algorithms and experiments. Chunlin Li mainly extended RankDice to RankIoU (Section 4.2), and partly contributed to the proof of Lemma 3 and Theorem 11. We would like to thank the referees and the Action Editor for constructive feedback which greatly improved this work.
Appendix A Empirical evaluation of the Dice metric
Recall the definition of the Dice and IoU metrics in (1), their empirical evaluation based on a validation/testing dataset , can be written as:
| (22) |
where , and are defined at the instance level. In general, the empirical Dice and IoU metrics are not equal to the evaluation criteria used in some literature:
| (23) |
Here denotes convergence in probability following from the law of large numbers and Slutsky’s theorem. Clearly, both empirical and population evaluations in (23) do not match with the empirical verisons in (22) and the population Dice in (1). Although the empirical evaluation in (23) is widely used, it inherently discounts the effects of instances with small segmented features/pixels, leading to bias in the empirical evaluation. The issues of and are also indicated in some recent literature, including Cordts et al. (2016) and Berman et al. (2018).
Appendix B Auxiliary definitions
B.1 Population RankSEG
In this section, we present the definition of population RankSEG, including the proposed frameworks RankDice and RankIoU. In other words, we work with population of . Denote as the class of all measurable functions .
Step 1 (Conditional probability estimation): Estimate the conditional probability based on a strictly proper loss :
| (24) |
Step 2 (Ranking): Given a new instance , sort its estimated conditional probabilities decreasingly, and denote the corresponding indices as , that is, .
Step 3 (Volume estimation): From (4), we estimate the volume by replacing the true conditional probability by the estimated one :
where , , and denote Poisson-binomial random variables, and is a Bernoulli random variable with the success probability ; for .
B.2 Poisson-binomial distribution
The Poisson binomial distribution is the discrete probability distribution of a sum of independent non-identical Bernoulli trials. Specifically, suppose are independent Bernoulli random variables, with probabilities of success , then is a Poisson-Binomial random variable with parameter , denoted as , and its probability mass function is:
where . Moreover, the mean, variance, and skewness for are listed as follows.
B.3 Conditional independence in segmentation
In this section, we adopt a probabilistic perspective on the likelihood of the segmentation task, to suggest that the conditional independence ( for ) is implicitly assumed to ensure the validity of the cross-entropy (CE) loss, and widely accepted due to the high dimensional nature of segmentation data.
Suppose , the negative conditional log-likelihood function of for the probabilistic model is:
where the second equality follows from the conditional independence assumption for , which connects the CE loss to the negative conditional log-likelihood function. In this sense, the conditional independence is naturally (and implicitly) assumed by CE to presuppose the probabilistic interpretation of its estimator.
Moreover, the conditional independence is widely accepted due to the high dimensional nature of segmentation data. For example, given a 512x512 image, it is infeasible to consider pairs of label-dependence, which can even be adaptive with respect to .
Appendix C Simulation results and Implementation details
C.1 Simulation setting and results
This subsection includes the simulation setting demonstration (Figure 6) and the numerical results (Tables 9 and 10, and Figure 7).


| Decay | Shape | Threshold (at 0.5) | RankDice (our) | |||
|---|---|---|---|---|---|---|
| step(0.1) | 28x28 | 0.049(.000) | 0.274(.001) | |||
| 64x64 | 0.083(.000) | 0.279(.000) | ||||
| 128x128 | 0.081(.000) | 0.278(.000) | ||||
| 256x256 | 0.089(.000) | 0.279(.000) | ||||
| step(0.3) | 28x28 | 0.022(.001) | 0.499(.001) | |||
| 64x64 | 0.038(.000) | 0.517(.001) | ||||
| 128x128 | 0.036(.000) | 0.518(.000) | ||||
| 256x256 | 0.040(.000) | 0.518(.000) | ||||
| step(0.5) | 28x28 | 0.708(.000) | 0.708(.000) | |||
| 64x64 | 0.707(.000) | 0.707(.000) | ||||
| 128x128 | 0.708(.000) | 0.708(.000) | ||||
| 256x256 | 0.708(.000) | 0.708(.000) | ||||
| exp(1.01) | 28x28 | 0.870(.000) | 0.870(.000) | |||
| 64x64 | 0.669(.000) | 0.714(.000) | ||||
| 128x128 | 0.410(.000) | 0.551(.000) | ||||
| 256x256 | 0.286(.000) | 0.450(.000) | ||||
| exp(1.05) | 28x28 | 0.427(.001) | 0.551(.001) | |||
| 64x64 | 0.296(.001) | 0.446(.001) | ||||
| 128x128 | 0.276(.001) | 0.427(.001) | ||||
| 256x256 | 0.274(.001) | 0.427(.001) | ||||
| exp(1.10) | 28x28 | 0.332(.002) | 0.467(.002) | |||
| 64x64 | 0.301(.001) | 0.439(.002) | ||||
| 128x128 | 0.300(.002) | 0.438(.002) | ||||
| 256x256 | 0.298 (.002) | 0.436(.002) |
| Decay | Shape | Threshold (at 0.5) | RankDice (our) | |||
|---|---|---|---|---|---|---|
| linear(1.00) | 28x28 | 0.679(.001) | 0.717(.001) | |||
| 64x64 | 0.672(.000) | 0.711(.000) | ||||
| 128x128 | 0.669(.000) | 0.709(.000) | ||||
| 256x256 | 0.668(.000) | 0.707(.000) | ||||
| linear(2.00) | 28x28 | 0.578(.001) | 0.647(.001) | |||
| 64x64 | 0.575(.001) | 0.642(.001) | ||||
| 128x128 | 0.573(.000) | 0.638(.000) | ||||
| 256x256 | 0.573(.000) | 0.637(.000) | ||||
| linear(4.00) | 28x28 | 0.588(.003) | 0.663(.002) | |||
| 64x64 | 0.580(.001) | 0.646(.001) | ||||
| 128x128 | 0.575(.001) | 0.642(.001) | ||||
| 256x256 | 0.574(.000) | 0.639(.000) |
| Framework | Threshold | Dice | ||
|---|---|---|---|---|
| threshold-based | 0.1 | 0.481(.005) | ||
| 0.2 | 0.560(.005) | |||
| 0.3 | 0.560(.005) | |||
| 0.4 | 0.560(.005) | |||
| 0.5 | 0.560(.005) | |||
| 0.6 | 0.528(.005) | |||
| 0.7 | 0.471(.005) | |||
| 0.8 | 0.377(.005) | |||
| 0.9 | 0.230(.004) | |||
| RankDice(our) | — | 0.601(0.005) |
![[Uncaptioned image]](https://cdn.awesomepapers.org/papers/a11cf2ef-6f5b-4b39-ac78-824a2a581a9d/sim_step_heat.png)
C.2 Implementation details
The experiment protocol of our numerical sections basically follows a well-developed Github repository pytorch-segmentation (Ouali, 2022). The major difference lies in the empirical evaluation of the Dice and IoU metrics. In our experiments, we report the unbiased evaluations and , yet the biased evaluations and are usually used for existing literature, see more discussion and definitions in Appendix A.
To justify the effectiveness of our experiment protocol, we also report and under our setting based on the argmax-based framework and compare the performance with the existing benchmarks. Specifically, in our setting, the performance is, DeepLab: (i) CityScapes: 63.20%; 76.10%; (ii) VOC: 74.40%; 84.30%; PSPNet: (i) CityScapes: 65.20%; 77.60%; (ii) VOC test: 79% (which is provided by Ouali (2022) with the same configuration expect batch_size=16); FCN8: VOC: 55.60%; 70.40%.
The experiment protocol, including learning_rate, crop_size, backbone, and batch_size, on the existing networks are summarized as follows.
DeepLab (Chen et al., 2018). The experiment on the Fine-annotated CityScapes dataset is set as follows: backbone is “Xception-65”. The final is 79.14%; The experiment on the PASCAL VOC 2012 dataset is set as follows: learning_rate is 0.007 with poly schedule; crop_size is 513x513, backbone is “resnet101”, batch_size is 16. The final is 78.21%;
PSPNet (Zhao et al., 2017). The experiment on the Fine-annotated CityScapes dataset is set as follows: learning_rate is 0.01. The final is 78.4%; The experiment on the PASCAL VOC 2012 dataset is set as follows: learning_rate is 0.01, batch_size is 16. The final based on the VOC test datset is 82.6%;
FCN8 (Long et al., 2015). The experiment on the PASCAL VOC 2012 dataset is set as follows: learning_rate is 0.0001, batch_size is 20, backbone is “VGG16”. The final is 62.2%;
Note that the suboptimal performance of our experiment may be caused by a small batch/crop size, different specified backbone models, and other fitting hyperparameters. The current experiment can be further improved by carefully tuning the hyperparameters, yet it provides a fair numerical comparison of all frameworks (threshold-based, argmax-based, and the proposed RankDice).
Appendix D Technical proofs
D.1 Proof of Theorem 1
Proof It suffices to consider the point-wise maximization:
Let , be the index set of segmented features by , and , we have
Note that the second term is only related to , and the first term can be rewritten as:
| (25) |
As indicated in (D.1), when is given, is an additive function with respect to . Therefore, maximizing suffices to find the indices of top largest . Toward this end, we consider the differenced score function:
| (26) |
where is removing and , the second last equality follows from the conditional independence of and given for any pair and . According to (D.1), we have
thus sorting is equivalent to sorting for any given . Let be the index set of the -largest conditional probabilities, it suffices to solve
where is a Poisson-binomial random variable with success probabilities , since () is an independent Bernoulli random variable given . The desirable result then follows.
D.2 Proof of Lemma 3
Proof To proceed, we denote , and , and . For simplicity in presentation, we assume that . Then, for any , since , and
where the second inequality follows from Lemma 17 with and , and , and the third inequality follows from the condition that . The desirable result then follows. The upper bound provided by Lemma 3 is illustrated in Figure 8 based on a random example of Example 1.

D.3 Proof of Lemma 4
Proof Without loss of generality, assume . Denote and , , , , , we treat and separately. First,
Next, we turn to bound - separately.
where the last inequality follows from Lemma 16. For , we have
where the last inequality follows from Lemma 16. Next, according to Theorem 1.1 in Neammanee (2005),
and
where is a random variable following the refined normal distribution. For ,
where is the harmonic number, and the last inequality follows from the fact that . Taken together,
Similarly, for ,
This completes the proof.
D.4 Proof of Lemma 5
Proof With the same argument in the proof of Lemma 4, it suffices to consider
Denote and , we have
Next, we turn to treat and separately. Without loss generalization, we assume , then
where the last inequality follows the fact that and . For , let , we have
where the last inequality follows from the fact that , and . Taken together, using the same argument in the proof of Lemma 4, we have
Combining Lemma 4, the desirable result then follows.
D.5 Proof of Lemma 6
Proof Denote . We first prove the necessity. Suppose is a global minimizer of , for . Then for any , we have
yields that is a global minimizer of . We next prove the sufficiency by contradiction. Suppose is a global minimizer of , yet there exists such that is not a minimizer of . Thus, there exists a segmentation rule such that , then let
which leads to contradiction of that is a global minimizer of . The desirable result then follows.
D.6 Proof of Lemma 7
Proof Given a segmentation rule , can be rewritten as
Similarly, it is equivalent to consider the point-wise minimization conditional on :
where is the -th column of . According to (D.1), we have
where is the segmentation indicator of the -th feature under the class-, and is a reward function defined as:
Now, suppose the optimal volume function is given, then becomes a constant, and the point-wise maximization on is equivalent to:
| subject to | ||||
| (28) |
where is the reward under . Note that (D.6) is the formulation for the assignment problem (Kuhn, 1955). This completes the proof.
D.7 Proof of Lemma 9
Proof For simplicity, we construct a counter example based on and , that is, and . Without loss generality, we assume .
First, we derive the Bayes rule in Theorem 1 for this case. Note that it suffices to compare the scores for () and .
Therefore, the Bayes rule for Dice optimal segmentation is:
Now, we check the Dice-calibrated for classification-calibrated losses. For example, and , then
where the first equality follows from the definition of a classification-calibrated loss: the decision rule must agree with the conditional probabilities. Therefore, yields that a classification-calibrated loss with thresholding at 0.5 is not Dice-calibrated.
D.8 Proof of Lemma 10
D.9 Proof of Theorem 11
Proof First, we consider point-wise approximation of the Dice metric under probabilities and . For any , such that for , and otherwise. Define
Now, we have
where the second inequality follows from the triangle inequality, if , if . Therefore,
where the first inequality follows from the definition of such that . This completes the proof.
D.10 Proof of Corollary 12
D.11 Proof of Lemma 13
Proof Denote , , and let be a segmentation index set, and . Again, consider the point-wise maximization:
where is defined as
where the last equality follows from the fact that . Fix . The first term is maximized at with
and the maximum value is . The second term is
Given , we have and , where and are independent Bernoulli variables with success probability , respectively, for . By Theorem 2.2.9 of Belzunce et al. (2015), is stochastically greater than , namely
for any . Thus,
As a result, the second term is also maximized at . Therefore, maximizes for a fixed . The desired result follows.
D.12 Proof of Lemma 14
Proof Without loss of generality, assuming are fixed, then for any ,
whenever
This completes the proof.
D.13 Proof of Theorem 15
Proof Similar to the proof of Theorem 11, we consider point-wise approximation of IoU metric under and . For any such that for and otherwise. Define
We have
where is a constant that may depend on . Then the rest of the proof follows from the same arguments for Theorems 11 and 12 with Dice replaced by IoU, and is omitted.
Appendix E Auxiliary Lemmas
Lemma 16
Suppose is a Poisson binomial random variable, and are independent Bernoulli trials with success probabilities . Then, for any , we have
where .
Proof Note that , then
where the last equality follows from the fact that for . The desirable result then follows since .
Lemma 17
Suppose is a Poisson binomial random variable, and are independent Bernoulli trials with success probabilities . Then, for an arbitrary positive non-decreasing sequence ,
is a non-increasing function with respect to .
Proof Note that for any , . Denote , we have
Then,
where the first equality follows from the fact that , and the last equality follows from the fact that for or . Hence, we have has the same sign with , and the desirable result then follows.
Lemma 18
Let be a Poisson-binomial random variable with the success probability , then for any , we have
Proof According to the corollary in Chao and Strawderman (1972), we have
where , the first inequality follows from the inequality of arithmetic and geometric means, the last equality follows from Section 3.1 of Chao and Strawderman (1972), and the last inequality follows from (25) in Wooff (1985). This completes the proof.
References
- Ajtai et al. (1983) Miklós Ajtai, János Komlós, and Endre Szemerédi. An () sorting network. In Proceedings of the Fifteenth Annual ACM Symposium on Theory of Computing, pages 1–9, 1983.
- Assidiq et al. (2008) Abdulhakam AM Assidiq, Othman O Khalifa, Md Rafiqul Islam, and Sheroz Khan. Real time lane detection for autonomous vehicles. In 2008 International Conference on Computer and Communication Engineering, pages 82–88. IEEE, 2008.
- Badrinarayanan et al. (2017) Vijay Badrinarayanan, Alex Kendall, and Roberto Cipolla. Segnet: A deep convolutional encoder-decoder architecture for image segmentation. IEEE Transactions on Pattern Analysis and Machine Intelligence, 39(12):2481–2495, 2017.
- Bao and Sugiyama (2020) Han Bao and Masashi Sugiyama. Calibrated surrogate maximization of linear-fractional utility in binary classification. In International Conference on Artificial Intelligence and Statistics, pages 2337–2347. PMLR, 2020.
- Bartlett et al. (2005) Peter L Bartlett, Olivier Bousquet, and Shahar Mendelson. Local rademacher complexities. Annals of Statistics, 33(4):1497–1537, 2005.
- Bartlett et al. (2006) Peter L Bartlett, Michael I Jordan, and Jon D McAuliffe. Convexity, classification, and risk bounds. Journal of the American Statistical Association, 101(473):138–156, 2006.
- Belzunce et al. (2015) Felix Belzunce, Carolina Martinez Riquelme, and Julio Mulero. An Introduction to Stochastic Orders. Academic Press, 2015.
- Berman et al. (2018) Maxim Berman, Amal Rannen Triki, and Matthew B Blaschko. The lovász-softmax loss: A tractable surrogate for the optimization of the intersection-over-union measure in neural networks. In Proceedings of the IEEE Conference on Computer Vision and Pattern Recognition, pages 4413–4421, 2018.
- Bertels et al. (2019) Jeroen Bertels, David Robben, Dirk Vandermeulen, and Paul Suetens. Optimization with soft dice can lead to a volumetric bias. In International MICCAI Brainlesion Workshop, pages 89–97. Springer, 2019.
- Bice et al. (2021) Noah Bice, Neil Kirby, Ruiqi Li, Dan Nguyen, Tyler Bahr, Christopher Kabat, Pamela Myers, Niko Papanikolaou, and Mohamad Fakhreddine. A sensitivity analysis of probability maps in deep-learning-based anatomical segmentation. Journal of Applied Clinical Medical Physics, 22(8):105–119, 2021.
- Bracewell and Bracewell (1986) Ronald Newbold Bracewell and Ronald N Bracewell. The Fourier Transform and Its Applications, volume 31999. McGraw-hill New York, 1986.
- Chao and Strawderman (1972) Min-Te Chao and WE Strawderman. Negative moments of positive random variables. Journal of the American Statistical Association, 67(338):429–431, 1972.
- Charoenphakdee et al. (2021) Nontawat Charoenphakdee, Jayakorn Vongkulbhisal, Nuttapong Chairatanakul, and Masashi Sugiyama. On focal loss for class-posterior probability estimation: A theoretical perspective. In Proceedings of the IEEE/CVF Conference on Computer Vision and Pattern Recognition, pages 5202–5211, 2021.
- Chen et al. (2018) Liang-Chieh Chen, Yukun Zhu, George Papandreou, Florian Schroff, and Hartwig Adam. Encoder-decoder with atrous separable convolution for semantic image segmentation. In Proceedings of the European Conference on Computer Vision (ECCV), pages 801–818, 2018.
- Cordts et al. (2016) Marius Cordts, Mohamed Omran, Sebastian Ramos, Timo Rehfeld, Markus Enzweiler, Rodrigo Benenson, Uwe Franke, Stefan Roth, and Bernt Schiele. The Cityscapes dataset for semantic urban scene understanding. In Proceedings of the IEEE Conference on Computer Vision and Pattern Recognition, pages 3213–3223, 2016.
- Cortes and Vapnik (1995) Corinna Cortes and Vladimir Vapnik. Support-vector networks. Machine Learning, 20(3):273–297, 1995.
- Cox (1958) David R Cox. The regression analysis of binary sequences. Journal of the Royal Statistical Society: Series B (Methodological), 20(2):215–232, 1958.
- Crouse (2016) David F Crouse. On implementing 2d rectangular assignment algorithms. IEEE Transactions on Aerospace and Electronic Systems, 52(4):1679–1696, 2016.
- Cucker and Zhou (2007) Felipe Cucker and Ding Xuan Zhou. Learning theory: an approximation theory viewpoint, volume 24. Cambridge University Press, 2007.
- D’Ambrosio et al. (2020) Claudia D’Ambrosio, Silvano Martello, and Michele Monaci. Lower and upper bounds for the non-linear generalized assignment problem. Computers & Operations Research, 120:104933, 2020.
- Edmonds and Karp (1972) Jack Edmonds and Richard M Karp. Theoretical improvements in algorithmic efficiency for network flow problems. Journal of the ACM (JACM), 19(2):248–264, 1972.
- Everingham et al. (2012) M. Everingham, L. Van Gool, C. K. I. Williams, J. Winn, and A. Zisserman. The PASCAL Visual Object Classes Challenge 2012 (VOC2012) Results. http://www.pascal-network.org/challenges/VOC/voc2012/workshop/index.html, 2012.
- Giné and Koltchinskii (2006) Evarist Giné and Vladimir Koltchinskii. Concentration inequalities and asymptotic results for ratio type empirical processes. Annals of Probability, 34(3):1143–1216, 2006.
- Gneiting and Raftery (2007) Tilmann Gneiting and Adrian E Raftery. Strictly proper scoring rules, prediction, and estimation. Journal of the American Statistical Association, 102(477):359–378, 2007.
- Guo et al. (2017) Chuan Guo, Geoff Pleiss, Yu Sun, and Kilian Q Weinberger. On calibration of modern neural networks. In International Conference on Machine Learning, pages 1321–1330. PMLR, 2017.
- Hariharan et al. (2011) Bharath Hariharan, Pablo Arbeláez, Lubomir Bourdev, Subhransu Maji, and Jitendra Malik. Semantic contours from inverse detectors. In 2011 International Conference on Computer Vision, pages 991–998. IEEE, 2011.
- Hong (2013) Yili Hong. On computing the distribution function for the poisson binomial distribution. Computational Statistics & Data Analysis, 59:41–51, 2013.
- Jadon (2021) Shruti Jadon. Semsegloss: A python package of loss functions for semantic segmentation. Software Impacts, 9:100078, 2021.
- Kuhn (1955) Harold W Kuhn. The hungarian method for the assignment problem. Naval Research Logistics Quarterly, 2(1-2):83–97, 1955.
- Lin et al. (2017) Tsung-Yi Lin, Priya Goyal, Ross Girshick, Kaiming He, and Piotr Dollár. Focal loss for dense object detection. In Proceedings of the IEEE International Conference on Computer Vision, pages 2980–2988, 2017.
- Lin (2004) Yi Lin. A note on margin-based loss functions in classification. Statistics & Probability Letters, 68(1):73–82, 2004.
- Lipton et al. (2014) Zachary C Lipton, Charles Elkan, and Balakrishnan Naryanaswamy. Optimal thresholding of classifiers to maximize F1 measure. In Machine Learning and Knowledge Discovery in Databases: European Conference, ECML PKDD 2014, Nancy, France, September 15-19, 2014. Proceedings, Part II 14, pages 225–239. Springer, 2014.
- Liu et al. (2021) Sheng Liu, Aakash Kaku, Weicheng Zhu, Matan Leibovich, Sreyas Mohan, Boyang Yu, Haoxiang Huang, Laure Zanna, Narges Razavian, Jonathan Niles-Weed, et al. Deep probability estimation. arXiv preprint arXiv:2111.10734, 2021.
- Long et al. (2015) Jonathan Long, Evan Shelhamer, and Trevor Darrell. Fully convolutional networks for semantic segmentation. In Proceedings of the IEEE Conference on Computer Vision and Pattern Recognition, pages 3431–3440, 2015.
- Milletari et al. (2016) Fausto Milletari, Nassir Navab, and Seyed-Ahmad Ahmadi. V-net: Fully convolutional neural networks for volumetric medical image segmentation. In 2016 Fourth International Conference on 3D Vision (3DV), pages 565–571. IEEE, 2016.
- Murty and Kabadi (1985) Katta G Murty and Santosh N Kabadi. Some np-complete problems in quadratic and nonlinear programming. Technical report, 1985.
- Neammanee (2005) Kritsana Neammanee. A refinement of normal approximation to poisson binomial. International Journal of Mathematics and Mathematical Sciences, 2005(5):717–728, 2005.
- Nickolls et al. (2008) John Nickolls, Ian Buck, Michael Garland, and Kevin Skadron. Scalable parallel programming with cuda: Is cuda the parallel programming model that application developers have been waiting for? Queue, 6(2):40–53, 2008.
- Nordström et al. (2020) Marcus Nordström, Han Bao, Fredrik Löfman, Henrik Hult, Atsuto Maki, and Masashi Sugiyama. Calibrated surrogate maximization of Dice. In Medical Image Computing and Computer Assisted Intervention–MICCAI 2020: 23rd International Conference, Lima, Peru, October 4–8, 2020, Proceedings, Part IV 23, pages 269–278. Springer, 2020.
- Ouali (2022) Yassine Ouali. Github repository: pytorch-segmentation. https://github.com/yassouali/pytorch-segmentation, 2022.
- Pollard (1984) David Pollard. Convergence of Stochastic Processes. Springer Science & Business Media, 1984.
- Popordanoska et al. (2021) Teodora Popordanoska, Jeroen Bertels, Dirk Vandermeulen, Frederik Maes, and Matthew B Blaschko. On the relationship between calibrated predictors and unbiased volume estimation. In Medical Image Computing and Computer Assisted Intervention–MICCAI 2021: 24th International Conference, Strasbourg, France, September 27–October 1, 2021, Proceedings, Part I 24, pages 678–688. Springer, 2021.
- Ronneberger et al. (2015) Olaf Ronneberger, Philipp Fischer, and Thomas Brox. U-net: Convolutional networks for biomedical image segmentation. In International Conference on Medical Image Computing and Computer-Assisted Intervention, pages 234–241. Springer, 2015.
- Salehi et al. (2017) Seyed Sadegh Mohseni Salehi, Deniz Erdogmus, and Ali Gholipour. Tversky loss function for image segmentation using 3d fully convolutional deep networks. In International Workshop on Machine Learning in Medical Imaging, pages 379–387. Springer, 2017.
- Shen (1997) Xiaotong Shen. On methods of sieves and penalization. Annals of Statistics, 25(6):2555–2591, 1997.
- Shou et al. (2017) Zheng Shou, Jonathan Chan, Alireza Zareian, Kazuyuki Miyazawa, and Shih-Fu Chang. Cdc: Convolutional-de-convolutional networks for precise temporal action localization in untrimmed videos. In Proceedings of the IEEE Conference on Computer Vision and Pattern Recognition, pages 5734–5743, 2017.
- Sudre et al. (2017) Carole H Sudre, Wenqi Li, Tom Vercauteren, Sebastien Ourselin, and M Jorge Cardoso. Generalised dice overlap as a deep learning loss function for highly unbalanced segmentations. In Deep Learning in Medical Image Analysis and Multimodal Learning for Clinical Decision Support, pages 240–248. Springer, 2017.
- Tahmasebi et al. (2012) Pejman Tahmasebi, Ardeshir Hezarkhani, and Muhammad Sahimi. Multiple-point geostatistical modeling based on the cross-correlation functions. Computational Geosciences, 16(3):779–797, 2012.
- Tewari and Bartlett (2007) Ambuj Tewari and Peter L Bartlett. On the consistency of multiclass classification methods. Journal of Machine Learning Research, 8(5), 2007.
- Tomizawa (1971) Nobuaki Tomizawa. On some techniques useful for solution of transportation network problems. Networks, 1(2):173–194, 1971.
- Wang et al. (2018) Guotai Wang, Maria A Zuluaga, Wenqi Li, Rosalind Pratt, Premal A Patel, Michael Aertsen, Tom Doel, Anna L David, Jan Deprest, Sébastien Ourselin, et al. Deepigeos: a deep interactive geodesic framework for medical image segmentation. IEEE Transactions on Pattern Analysis and Machine Intelligence, 41(7):1559–1572, 2018.
- Wooff (1985) David A Wooff. Bounds on reciprocal moments with applications and developments in stein estimation and post-stratification. Journal of the Royal Statistical Society: Series B (Methodological), 47(2):362–371, 1985.
- Xin et al. (2018) Yang Xin, Lingshuang Kong, Zhi Liu, Chunhua Wang, Hongliang Zhu, Mingcheng Gao, Chensu Zhao, and Xiaoke Xu. Multimodal feature-level fusion for biometrics identification system on iomt platform. IEEE Access, 6:21418–21426, 2018.
- Zhang (2004) Tong Zhang. Statistical behavior and consistency of classification methods based on convex risk minimization. Annals of Statistics, 32(1):56–85, 2004.
- Zhao et al. (2017) Hengshuang Zhao, Jianping Shi, Xiaojuan Qi, Xiaogang Wang, and Jiaya Jia. Pyramid scene parsing network. In Proceedings of the IEEE Conference on Computer Vision and Pattern Recognition, pages 2881–2890, 2017.