Raman-scattered O VI Features in the Symbiotic Nova RR Telescopii 111This paper includes data gathered with the 6.5 meter Magellan Telescopes located at Las Campanas Observatory, Chile.
Abstract
RR Tel is an interacting binary system in which a hot white dwarf (WD) accretes matter from a Mira-type variable star via gravitational capture of its stellar wind. This symbiotic nova shows intense Raman-scattered O VI 1032 and 1038 features at 6825 Å and 7082 Å. We present high-resolution optical spectra of RR Tel taken in 2016 and 2017 with the Magellan Inamori Kyocera Echelle (MIKE) spectrograph at Magellan-Clay telescope, Chile. We aim to study the stellar wind accretion in RR Tel from the profile analysis of Raman O VI features. With an asymmetric O VI disk model, we derive a representative Keplerian speed of , and the corresponding scale . The best-fit for the Raman profiles is obtained with a mass loss rate of the Mira and a wind terminal velocity . We compare the MIKE data with an archival spectrum taken in 2003 with the Fibre-fed Extended Range Optical Spectrograph (FEROS) at the MPG/ESO 2.2 m telescope. It allows us to highlight the profile variation of the Raman O VI features, indicative of a change in the density distribution in the last two decades. We also report the detection of O VI recombination lines at 3811 Å and 3834 Å, which are blended with other emission lines. Our profile decomposition suggests that the recombination of O VII takes place nearer to the WD than the O VI 1032 and 1038 emission region.
1 Introduction
Symbiotic stars are interacting binary systems consisting of an evolved giant transferring mass to a hot compact object, in most cases a white dwarf (WD) (e.g., Kenyon, 1986). In the general case, it is believed that the accretion occurs via the stellar wind from the primary, known as Bondi-Hoyle-Lyttleton (BHL) wind accretion.
RR Telescopii is a Dusty-type symbiotic nova comprising a Mira component and a WD. A nova-like outburst occurred in 1944 when RR Tel brightened by 7 mag in the visual band (Mayall, 1949). In 1949, the extended atmosphere started to shrink and entered a nebular phase. Subsequently, its luminosity has been slowly fading for several decades (e.g., Mürset et al., 1991; Nussbaumer & Dumm, 1997). Recent light curve from the ASAS-SN photometric database shows that the overall V magnitude is still in the steady decline trend. It changed from 11.7 to 11.9 during the last four years (Shappee et al., 2014; Kochanek et al., 2017). Meanwhile, the effective temperature of the WD has continued to rise from in May 1949 (Pottasch & Varsavsky, 1960) and it has exceeded after 1978 (e.g., Hayes & Nussbaumer, 1996; Jordan et al., 1994). Based on the recent X-ray observations with XMM-Newton, González-Riestra et al. (2013) estimated its temperature and luminosity assuming a distance of . The orbital period of this object is still quite uncertain but it is believed to exceed several decades (Lee & Park, 1999; Schmid & Schild, 2002).
From time-series spectroscopic observations of RR Tel between 1950 and 1960, Thackeray & Webster (1974) reported a strong, unidentified emission band at 6825 Å having a broad width of Å with a double-peaked profile. They noted that whenever the 6825 band appeared, the rest of the spectrum showed lines of high ionization, which implied that the origin of the band is related to high-ionized species. A second, weaker band at 7082 Å was also detected, whose profile bears a striking similarity to 6825 feature (Allen, 1979). Because of their observational properties, including abnormally broad width and the double-peaked profile, Allen (1979) proposed that both emissions come from the same atomic or molecular species.
The identification of the two bands was made by Schmid (1989), who proposed that the two broad bands at 6825 Å and 7082 Å are due to the Raman scattering of O VI 1032 and 1038 doublet by atomic hydrogen H I. Synchronous far-UV and optical observations for symbiotic stars including RR Tel provided support to his identification of the Raman O VI features (Espey et al., 1995; Birriel et al., 2000). In this scattering process, an O VI 1032 photon is incident on H I in the ground state, and de-excitation into 2s state produces an optical Raman-scattered photon with 6825 Å. A similar process with an O VI 1038 photon results in an optical photon at 7082 Å. Figure 1 shows the scattering process in symbiotic star. The heterogeneous environment in symbiotic binaries includes the nebular region photoionized by intense far-UV radiation from the hot source and the dense neutral region around the donor star, providing an excellent laboratory to study Raman scattering by H I (e.g., Schmid, 1989; Nussbaumer et al., 1989).

The inelasticity of Raman scattering requires that the wavelength of an emergent Raman photon is almost solely determined by the relative motion between the far-UV O VI emission region and the H I scattering region and negligibly dependent of the observer’s line of sight. This unique property allows us to investigate the mass transfer process with an edge-on view of the cool star. Follow-up spectropolarimetric observations revealed that the Raman O VI bands of RR Tel are strongly polarized and show complicated line structures with a polarization flip in the red wing (Schmid & Schild, 1994; Harries & Howarth, 1996; Schmid et al., 1999). The spectropolarimetric properties were explained by a very extended scattering region responsible for a large mass loss rate. Another model was suggested by Lee & Park (1999), who adopted an accretion disk around a WD with an asymmetric matter distribution, resulting in the asymmetric double-peak profiles of the Raman O VI in RR Tel. Previous research works on line formation of Raman O VI features in other symbiotic stars show that their profiles provide valuable kinematic information on the accretion disk. In particular, the main peak separation of Raman O VI features indicates a representative velocity scale of the accretion disk around the WD (e.g., Lee & Kang, 2007; Heo & Lee, 2015; Heo et al., 2016).
Further interesting point of Raman O VI is that the two profiles, as usual, are not identical in a given object, even though the O VI 1032 and 1038 photons are formed in the same region. The difference in flux between the two peaks is more evident in 7082 feature than 6825 profile. O VI 1032 and 1038 resonance doublet lines arise from transitions. Since the oscillator strength of transition is twice larger than that of transition, it is expected that the flux ratio , in the optically thin region. In accordance with the ratio of oscillator strength, O VI 1032 is twice more optically thick than O VI 1038, , which makes it more difficult for an O VI 1032 line photon to escape from the site. We, therefore, expect that the flux ratio may deviate from the optically thin limit of 2 and approach unity in an optically very thick medium. Heo & Lee (2015) adopted the local variation of the flux ratio in the accretion disk to account for the profile disparity of the Raman O VI features in a symbiotic nova V1016 Cyg. As demonstrated by these results, Raman O VI features can be an ideal spectroscopic tool to investigate the vicinity of the WD and further probe the mass transfer process associated with stellar wind accretion in symbiotic stars.
Although RR Tel is a well-studied symbiotic nova, there is a lack of optical studies for the past two decades. The most recent observation in the literature was conducted in 2000, analyzed by Young (2012). In this paper, we present and discuss our high-resolution spectroscopic observations of the Raman O VI features in RR Tel, conducted in 2016 and 2017 using the Magellan Inamori Kyocera Echelle (MIKE) spectrograph installed on the 6.5 m Magellan-Clay telescope, Chile. we investigate the Raman O VI features comparing the archival far-UV data taken in 2002 with the Far-Ultraviolet Spectroscopic Explorer (FUSE) satellite and the almost contemporary optical spectrum taken in 2003 with the Fibre-fed Extended Range Optical Spectrograph (FEROS) at the MPG/ESO 2.2 m telescope. A detailed profile analysis of the Raman O VI features based on the accretion disk model was performed, and the results are shown in Section 3. Our finding of the O VI 3811 and 3834 doublets from our profile decomposition is described in Section 4. Discussion and summary follow in Sections 5 and 6.
2 Observations
2.1 MIKE Spectrum
We obtained high-resolution optical spectra of RR Tel using the MIKE spectrograph (Bernstein et al., 2003). The double echelle spectrograph MIKE covers the wavelength range of 3350-5000 Å (blue) and 4900-9500 Å (red) in its normal configuration. A slit width of was used, resulting in resolving power and on the blue and red sides, respectively. To increase the signal-to-noise ratio (S/N), a binning was applied in both the spectral and spatial directions. Observations were carried out on 2016 July 30 and 2017 July 26, for total exposure times of 2000 sec and 2400 sec, respectively. With these integration times, the spectra have significant for strong lines suitable for profile analysis. ThAr spectra were taken for wavelength calibration.
We reduced the MIKE data using the Carnegie Python Distribution (CarPy) pipeline (Kelson et al., 2000; Kelson, 2003) and NOAO.onedspec package of the Image Reduction and Analysis Facility (IRAF).222IRAF is distributed by the National Optical Astronomy Observatory, which is operated by the Association of Universities for Research in Astronomy (AURA) under cooperative agreement with the National Science Foundation. The data are overscan-corrected, bias-subtracted, extracted, wavelength calibrated, and flat-fielded with quartz lamps within the pipeline. Individual exposures were then combined using the IRAF task scombine. Due to the poor weather condition of the night 2016 July 30, flux calibration was not possible. For the observing night 2017 July 26, we observed the spectrophotometric standard star HR 7950 under photometric condition. Flux calibration was performed with the IRAF tasks standard, sensfunc, and calibrate.


The left and right panels of Fig. 2 show the Raman-scattered O VI features at 6825 Å and 7082 Å. To make quantitative profile comparisons of the two Raman O VI features, we transform the observed wavelengths into the O VI Doppler factor as shown by the upper horizontal axis. First, we convert the observed wavelength to the vacuum wavelength using the refractive index of air . By measuring the center wavelengths of the strong emission lines (e.g., He I7065 and 6678, [N II] 6583 and 6548, [O III] 4959, H and H), we obtain the systemic velocity of , and , respectively, for the 2016 and 2017 data. We correct for the systemic velocity and calculate the corresponding far-UV wavelength of incident O VI photon using the energy conservation principle. Adopting the O VI center wavelengths of Å and Å, we finally compute the O VI parent Doppler factor . More detailed information about the transformation between the wavelength and the Doppler factor is available in Heo et al. (2016).
We fit the Raman O VI features with two Gaussian components, from which we derive the peak separation of the Raman O VI 6825 feature and in the data of 2016 and 2017, respectively. For the Raman O VI 7082 features, the peak separations are measured to be and in 2016 and 2017, respectively. The Gaussian fitting parameters are presented in Table 3.
We overplot the MIKE data in Fig. 2, whose medium grey lines represent the 2016 data and black lines show the 2017 data. The vertical axes show flux density in units of . Since the 2016 data is not flux calibrated, we multiplied an artificial factor to match the continuum value with the 2017 data. As shown in Fig. 3, the continuum around the bands is virtually flat with a constant value of due to the dust obscuration. The Mira in RR Tel is heavily obscured and so no trace of photospheric absorptions is visible (e.g. Kotnik-Karuza et al., 2006). Dust obscuration in RR Tel is also supported by its optical light curves, which do not show any pulsation of Mira, whereas the Near-IR light curves show a clear periodicity (Gromadzki et al., 2009).

To measure the total line fluxes for the Raman O VI features, we assume that the emission having the Doppler factor between to is a Raman O VI feature. In these regions, the contributions of other spectral lines, including TiO or VO absorption lines from the Mira and telluric lines, are negligible. There is telluric -B band between 6870 - 6950 Å, but not affecting both Raman O VI features (Groppi & Hanson, 1996). Few unknown emission lines with FWHM Å are also detected at the wavelength range of Raman O VI features. However, their contribution to the total line fluxes are negligible due to the relatively small intensities compared with the Raman features. Therefore we obtain the total line fluxes of the Raman O VI features and for the 2017 data.
The Raman line fluxes of RR Tel were studied in previous observations between 1993 and 1996 (e.g., Espey et al., 1995; Crawford et al., 1999; Schmid et al., 1999). A steady decrease was found over the period, and the same behavior is shown for the far-UV O VI 1032 and 1038 emissions. We note that the fluxes of both Raman O VI in the MIKE data have decreased by about 30 % from 1996 October. The measurements are summarized in Table 1. The decrease in the line intensity is consistent with the trend of general slow fading started in 1949 after its outburst (e.g., Nussbaumer & Dumm, 1997; Contini & Formiggini, 1999).
2.2 FUSE Spectrum
RR Tel was observed on June 14, 2002 with the FUSE satellite as part of the Cycle 3 program C141 ( PI: P.R. Young). The FUSE spectrum of RR Tel was taken for an exposure time of 128 sec through the low-resolution aperture (LWRS: 30 30 arcsec) using TTAG (Photon Address) mode. The SiC2 channel covers a wavelength range of 917 - 1104 Å at a spectral resolution of 12000 - 20000 (Moos et al., 2000; Sahnow et al., 2000). The data were re-processed and archived at MAST with the CalFUSE pipeline version 3.2.1. The extracted data is binned in wavelength with a bin size of 0.013 Å (Dixon et al., 2007). Considering that the observation was made under low-resolution mode, we binned the data by a spectral resolution of 0.362 Å.

| Date | O VI 1032 | O VI 1038 | F(1032)/F(1038) | ref. |
|---|---|---|---|---|
| () | () | |||
| 1993-09-16 | 1.70 | Schmid et al. (1999) | ||
| 1995-03-12 | 1.64 | Birriel et al. (2000) | ||
| 2002-06-14 | 1.70 | This work |
In Fig. 4, we present a zoom-in of the FUSE spectrum centered on the two strongest emission lines, O VI 1032 and 1038. The light grey line represents the raw data, whereas the black line shows the binned spectrum. The O VI emissions have line fluxes of and , respectively, yielding the flux ratio of . There has been a steady decrease in line fluxes of both O VI emissions from and in 1993 (Schmid et al., 1999) - a drop of 22 %. We summarize the observed values of O VI lines and compare them with previous measurements from other research works in Table. 2. We note that the flux ratio has remained almost constant at 1.7 throughout this period.
2.3 FEROS Spectrum
| (Å) | () | (Å) | () | () | () | |||
|---|---|---|---|---|---|---|---|---|
| Raman 6825 | ||||||||
| 2003-11-13 | 6822.75 | -10.0 | 6829.75 | 36.5 | 46.5 | 1.96 | ||
| 2016-07-30 | 6823.10 | -8.2 | 6830.25 | 39.3 | 47.5 | 2.43 | ||
| 2017-07-26444 flux-calibrated | 6822.90 | -9.2 | 6830.20 | 39.5 | 48.7 | 2.37 | ||
| Raman 7082 | ||||||||
| 2003-11-13 | 7978.70 | -15.1 | 7086.60 | 33.7 | 48.8 | 4.00 | ||
| 2016-07-30 | 7079.90 | -8.3 | 7087.30 | 37.4 | 0.98 | 45.7 | 5.76 | |
| 2017-07-264 | 7079.70 | -9.3 | 7087.20 | 37.1 | 46.4 | 5.76 | ||
RR Tel was observed with FEROS installed on the MPG/ESO 2.2 m telescope for a total exposure time of 600 sec on November 13, 2003. The spectrum spans the wavelength region 3527 - 9216 Å and has a spectral resolution of (Kaufer et al., 1999). The data were reduced automatically using the FEROS Data Reduction Software (DRS) pipeline version fern/1.0 and archived at the European Southern Observatory (ESO) database. 555http://archive.eso.org/scienceportal/home The data are overscan-corrected, bias-subtracted, extracted and flat-fielded. The extracted, flat-fielded data are wavelength calibrated and rebinned in wavelength with a bin size of 0.3 Å. The reduced spectra are not flux calibrated. 666http://www.eso.org/rm/api/v1/public/releaseDescriptions/94 In Fig. 2, the light grey lines correspond to the FEROS data. Not being flux calibrated, the FEROS data is multiplied by an artificial factor to compare their profiles with that of the flux calibrated MIKE data.
Following the same method used for the MIKE data, we measure the center of the strong emission lines (He I7065 and 6678, [O III] 5007 and 4959), and obtain the systemic velocity of . Through two-component Gaussian modeling of the Raman features, we find that the two peaks of the Raman O VI 6825 are Å and Å. These correspond to a Doppler factor of and resulting in the peak separation . For the Raman O VI 7082, the peak separation is obtained. We summarize the Gaussian fitting parameters for the Raman features in Table 3.
2.4 Profile Variation of Raman O VI
In previous studies, it was found that the Raman O VI features of RR Tel show an asymmetric double-peaked profile, where the red peak is stronger than the blue one (e.g., Allen, 1980; Schmid et al., 1999). Harries & Howarth (1996) investigated the temporal variation of Raman O VI 6825 feature between 1992 and 1994, from which they found a slight decrease in (normalized) line intensity while the overall profiles remained unchanged (see Fig. 8-d in Harries & Howarth (1996)).
By comparing the data obtained in the years of 2003, 2016, and 2017, we find that both Raman O VI profiles show significant variations. In Fig. 2, we overplot the FEROS spectrum taken in 2003 and the MIKE data observed in 2016 and 2017. It is obvious that the asymmetry of both Raman profiles has grown for the last two decades, whereas there is no significant change between 2016 and 2017. To describe the profile asymmetry in a given Raman feature, we use parameter , the ratio between the peak values of the two Gaussian components. We find that the asymmetry parameter of Raman O VI 6825 increased from in 2003 to in 2016. This change is even more apparent in the 7082 feature, a increase from in 2003 to in 2016.
3 Line formation of Raman O VI
We introduce our line formation modeling via a Monte Carlo approach to compute the flux and the profiles of Raman-scattered O VI features. The Monte Carlo simulation starts with a generation of a far-UV O VI photon at a random place in an accretion disk. The O VI photon enters the H I region where is Rayleigh scattered. It escapes the region if the photon has an optical depth larger than , the scattering optical depth to an observer at infinity, or becomes an optical photon through Raman scattering. A full description of the simulations, including the escape condition and the scattering process, can be found in Lee & Lee (1997).
It is worth remembering once again that the line profiles of Raman-scattered features are almost independent of the observer’s line of sight and are almost solely determined by the relative motion between the far-UV O VI emission region and the H I scattering region. Because the H I region around the Mira commands an almost perfect edge-on view of the accretion around the WD, the profile analysis of Raman-scattered features provides crucial information, including physical extent, density distribution, and kinematics of the O VI 1032 and 1038 emission region around the WD (Lee & Kang, 2007; Heo et al., 2016; Lee et al., 2019).
3.1 Stellar Wind and the STB Ionization Front
First of all, to model the density distribution of H I around the Mira, it is assumed that the stellar wind from the Mira follows a beta law, where the radial wind velocity is given by
| (1) |
Here, is the launching site of the wind, is the wind terminal velocity (e.g., Lamers et al., 1999). We choose the parameter for simplicity in our Monte Carlo simulations.
The slow stellar wind around the Mira is illuminated by intense far-UV radiation from the hot component, and hence some parts facing the WD are photoionized. Seaquist, Taylor & Button (1984) presented their photoionization calculation to find the ionization front, known as the STB model. In the STB model, the ionization front in the stellar wind region is determined by the balance of photoionization rate by the H-ionizing luminosity from the hot component and recombination rate set by the mass-loss rate.
In the STB geometry, the ionization front is specified by the ionization parameter , which is given by
| (2) |
Here, is the binary separation, is the H-ionizing photon number luminosity, is the case B recombination coefficient for H I, and is the proton mass. In this work, we adopt the values of , that were used in previous works (Hinkle et al., 2013; González-Riestra et al., 2013).
3.2 An Asymmetric O VI Accretion Disk
In view of the fact that the Raman O VI profiles are dependent exclusively on the relative motion between the emitter and scatterer, the double-peak profiles of Raman O VI strongly imply that the far-UV O VI emission lines are formed in regions that move toward the H I region and recede from it. In this work, the far-UV O VI 1032 and 1038 emission regions are identified as a part of the accretion disk formed around the WD.
We, therefore, attribute the red-peak enhanced profiles to asymmetry of the matter distribution in the O VI disk (e.g., Heo & Lee, 2015). The part of the accretion disk on the entering side is moving away from the Mira and hence is characterized by positive Doppler factors for Raman-scattered O VI: we call this region the red emission region (RER) and the opposite side the blue emission region (BER).
It is noteworthy that the profiles of the two Raman O VI features are not identical: specifically, the ratio of the red and blue peak fluxes is 2.4 for the Raman 6825 whereas it is 5.8 for the Raman 7082 as shown in Section. 2.4. The disparate profiles of the two Raman O VI features can be explained by the local variation of the ratio in the O VI emission region, which decreases from 2 to 1 as optical depth increases (Heo & Lee, 2015). The RER, assumed to be of high density, is characterized by the flux ratio , whereas the BER is much more sparse, resulting in .
3.3 Monte Carlo Results


To reproduce the peak separation of the Raman O VI features, the Keplerian velocity is set to . It corresponds to the physical size of au when we adopt as the mass of the WD (González-Riestra et al., 2013). The asymmetry of the matter distribution in the accretion disk is given as a function of the azimuthal angle measured from the line toward the Mira. The best-fit is made using the following density function,
| (3) |
In the right panel, the solid line represents the O VI density profile as a function of . The O VI emissivity is dominant in the RER (), whose peak is at around .
Considering the disparate profiles of the two Raman O VI, we use the flux ratio , varying from 1.5 to 2, as a function of
| (4) |
which is schematically illustrated in the middle panel and represented by the dotted line in the right panel of Fig. 5.
Adopting the asymmetric O VI accretion disk model supplemented by the locally varying , Monte Carlo simulations were carried out under various parameters, a mass loss rate ranging from to with a step width of and terminal velocities of the Mira wind with , , and . These parameter sets give the ionization parameter X from 0.2 to 80.


We find that the double-peak structure of Raman O VI features in RR Tel is diluted if the stellar wind velocity exceeds or the ionization parameter . With the maximum velocity of , we, therefore, constraint , which gives . The corresponding ionization front is presented in Fig. 1. The best-fit result is obtained with and . In Fig. 6, we present our best-fit profiles for the Raman O VI features. The black lines show the MIKE data, while the light grey lines represent the results of our simulations.
Raman scattering efficiency, , is defined as the number ratio of the incident and Raman-scattered photons. The conversion rate for Raman-scattered O VI features was derived from direct measurement of the O VI far-UV emissions in far-UV spectra and O VI Raman features in optical spectra (Schmid et al., 1999; Birriel et al., 2000). Those authors suggested that and , respectively. From our Monte Carlo simulations, we obtained for the conversion and for conversion, respectively.
| Line | |||||
|---|---|---|---|---|---|
| (Å) | () | () | () | ||
| O VI 1032 | 1031.928 | ||||
| O VI 1038 | 1037.618 |
For our best-fit results, we obtain the total line flux and , respectively. Adopting a distance of (González-Riestra et al., 2013; Whitelock, 1988), the corresponding number luminosities of Raman-scattered photons emitted per unit time are and . Taking the conversion efficiency for O VI, we deduce the far-UV number flux densities and . The corresponding line fluxes are obtained and , yielding the flux ratio of 1.8. This result does not deviate much from the observed value of 1.7, as shown in Section 2.2. In Table 4, we summarize the intrinsic far-UV O VI parameters including, center wavelength, Raman scattering efficiency , calculated number flux density , expected line flux , and the observed flux in FUSE data.
4 O VI 3811 and 3834 Doublet

The O VI 3811 and 3834 lines arise from transitions between the level and , respectively. We present a partial Grotrian diagram for O VI in Fig. 7. O VI 3811 appears in the optical line list of RR Tel by McKenna et al. (1997), who obtained a high-resolution spectrum in a wavelength range from 3430 Å to 9320 Å with a spectral resolution of R. In their spectrum, they found an emission line feature at 3811.35 Å with and suggested its identification as a blend of O III 3810.96 and O VI 3811.36. Crawford et al. (1999) extended the line list using data with a higher spectral resolution of R. They proposed that the O VI 3834 line could contribute to the emission at 3833.96 Å, which is detected with and blended with He II 3833.80 and He I 3833.57. Young (2012) performed an extensive study of O VI recombination lines in RR Tel, from which 19 lines, including O VI 3811 and 3834, were identified. They suggested that a highly ionized region, producing the lines by recombination onto O VII, is situated in the inner structure nearer to the hot WD than the O VI emitting region.
| Line | FWHM | FWHM | Peak | Flux | ||
|---|---|---|---|---|---|---|
| (Å) | (Å) | (Å) | () | () | () | |
| N V 4603 | 4603.33 | 4602.85 | 0.74 | 48 | ||
| N V 4620 | 4619.78 | 4619.14 | 0.78 | 50 | ||
| C IV 5801 | 5801.33 | 5800.22 | 0.83 | 43 | ||
| C IV 5812 | 5811.98 | 5810.90 | 0.80 | 42 | ||
| O VI 3811 | 3811.35 | 3810.74 | 0.57 | 44 | ||
| O VI 3834 | 3834.24 | 3833.67 | 0.57 | 44 |


In this work, we perform a detailed profile decomposition of the emission features at 3811 Å and 3834 Å with our MIKE data and confirm the identification of O VI 3811, 3834 doublet. The first step to isolate the O VI doublet from the blended profiles is to infer the profile width of the O VI doublet. It is expected that the profile width of the O VI doublet is comparable to that of N V 4603, 4619 and C IV 5801, 5812 doublets, which have similarly high ionization potential and isoelectronic configurations with O VI. With a single Gaussian function, the N V doublet lines are located at 4602.85 Å and 4619.14 Å with FWHM and , respectively. The C IV doublets are found at 5800.22 Å and 5810.90 Å with FWHM and , respectively. Our fitting parameters with a single Gaussian function for the N V and C IV doublets are summarized in Table 5.
Our MIKE data shows that the 3811 emission feature has a single-peak profile with FWHM . To decompose it into O VI 3811 and O III 3810, the profile width of O III 3810 is derived from the adjacent O III emission line at 3791 Å, whose profile width is measured to be . Within the expected FWHM of for O VI 3811 and for O III 3810, we find that O VI 3811 is centered at 3810.74 Å with a line flux . The fitting result is shown in the left panel of Fig. 8.
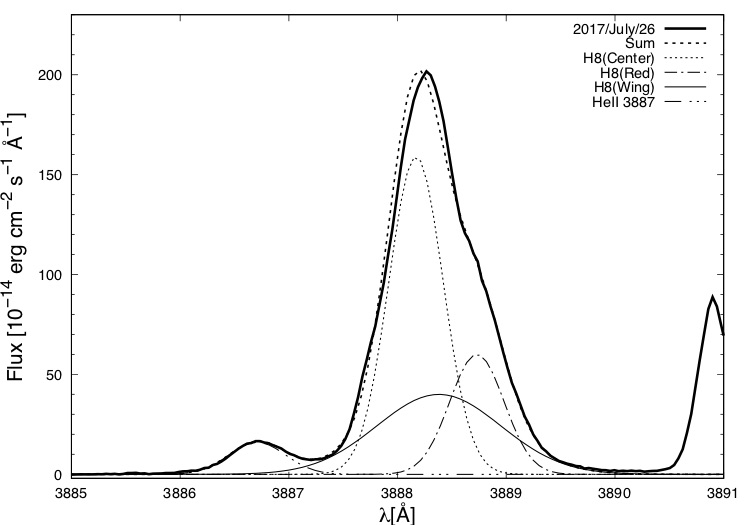
As shown in the right panel of Fig. 8, the blended emission feature at 3834 Å has a complicated profile consisting of strong Balmer H9 3835, two peaks and a blue shoulder, implying that the 3834 blend comprises at least four emission lines. For decomposition, we first analyze Balmer H9 3835 and He II 3833 lines by taking H8 3888 & He II 3887, and H7 3969 & He II 3967 as reference lines. The Balmer line profiles are well fitted using 3 emission components: a central main part, broad wings and a red bump. The Balmer line fluxes are measured to be , and . The flux ratio deviates from the case B recombination, which yields a declining trend .
He II 3887 and 3967 lines are fitted with a single Gaussian function with FWHM Å. Considering the flux ratio of Balmer lines and He II emissions, the blue shoulder located at around 3833 Å is plausibly identified with He II emission so that we use the term ‘He II 3833’. The multi-Gaussian fitting results for the Balmer and He II emission lines are presented in Fig. 9 and Table 6.

| Line | Wavelength | FWHM | Peak | Flux | |
| (Å) | (Å) | () | () | ||
| H7 3969 | Center | 3869.20 | 0.56 | ||
| Wing | 3969.23 | 1.53 | |||
| Red | 3969.65 | 0.54 | |||
| He II 3968 | 3967.70 | 0.54 | |||
| H8 3888 | Center | 3888.17 | 0.59 | ||
| Wing | 3888.38 | 1.34 | |||
| Red | 3888.73 | 0.59 | |||
| He II 3887 | 3886.71 | 0.61 | |||
| H9 3835 | Center | 3834.56 | 0.56 | ||
| Wing | 3834.57 | 1.53 | |||
| Red | 3834.99 | 0.54 | |||
| He II 3833 | 3833.01 | 0.54 | |||
| He I 3833 | 3833.29 | 0.35 |
We find one narrow peak with a small flux at 3833.29 Å. Using a single Gaussian, the FWHM is measured to be , which is smaller than the O VI 3811 line (). In this regard, we suggest that the narrow peak at 3833.29 Å is mainly contributed by He I 3833 line.
Taking these three emission lines into account, we finally isolate O VI 3834 with a Gaussian function having the same FWHM () as that of O VI 3811. We locate the line center at 3833.67 Å and measure a flux of , resulting in .
5 Discussion
The results obtained from our simulations are based on simple kinematics with Keplerian disk with an asymmetric matter distribution. The density distribution yielding the best-fit profiles is depicted in Fig. 5, where we note that the highest density on the entering side is 3.5 times that of the most sparse region on the opposite side. In reality, the high contrast of density profile can be made by the elliptical shape of the accretion disk or clumpy, irregular structures in the flow, which should be general features because of the shock front, accretion wake, or the unstable behavior in the wind accretion process. A number of numerical works of wind accretion in symbiotic stars produced a strong spiral shock and eccentric stream flow, supporting the local density enhancement (e.g., de Val-Borro et al., 2009, 2017).
In comparison with the FEROS spectrum taken in 2003, we note that the profiles of Raman O VI features have changed, their red peaks in the MIKE data being stronger. The variation of the Raman O VI profiles implies that the density distribution of the accretion disk has been more asymmetric in the last two decades. The increasing asymmetry of the matter distribution could be related to the dust obscuration episode that occurred between 1996 and 2000, which is associated with the enhancement of the mass-loss rate (Kotnik-Karuza et al., 2006; Jurkic & Kotnik-Karuza, 2012).
We also found O VI doublet at 3811 Å and 3834 Å, which are blended with other emission lines. Our profile decomposition leads us to investigate that the O VI 3811, 3834 doublet have a single Gaussian profile with a width of , . It is worth bearing in mind that the emission region of O VI 1032 and 1038 doublet has a representative scale of . This result is consistent with the idea that the O VI recombination lines are produced in the inner part closer to the WD than the O VI resonance lines proposed by Young (2012).
The identification of O VI 3811 and 3834 doublet strongly supports the presence of the EUV doublet at 150.09 Å and 150.13 Å, originating from transitions, as shown in Fig. 7. Because of a small separation of between two wavelengths, we expect a blended emission at 150.1 Å with a spectrograph having a spectral resolution . O VII is one of the highest observed stages of ionization in the RR Tel spectrum, and thus can provide a reliable diagnostic of high-temperature plasma. With future EUV observations, our analysis for the O VI and O VII groups could reveal important information on the ionization state and nebular physics in RR Tel.
6 Summary
RR Tel is a symbiotic nova, consisting of a Mira variable and a hot WD. It is known as one of the objects having broad emission features at 6825 Å and 7082 Å, which originate from Raman scattering of O VI 1032 and 1038 by neutral hydrogen atoms. In this work, we present optical high-resolution spectra of RR Tel obtained with MIKE and FEROS and the far-UV FUSE spectrum. We have performed Monte Carlo simulations for the profiles of the Raman O VI features, assuming a Keplerian disk. It allows us to map the O VI disk and estimates the representative scale of . The best-fit profiles are obtained with a mass loss rate of the Mira and a wind terminal velocity . Comparison with FEROS data provides evidence of a change in the density asymmetry of the O VI disk, which can be associated with the mass transfer history of RR Tel in the last two decades. We also identify O VI 3811 and 3834 doublet from detailed profile decomposition, from which the physical scale of the O VII region is estimated to be . It is emphasized again that Raman profiles provide essential information regarding the matter distribution and kinematics of the H I and O VI components leading to the advancement of our knowledge on the stellar wind accretion in symbiotic stars. Combining 3D hydrodynamical modeling might improve our overall understanding of the WRLOF mode and the accretion phenomena in D-type symbiotic systems.
References
- Allen (1979) Allen, D. A. 1979, Proc. I.A.U. Coll., 46, 125
- Allen (1980) Allen, D. A. 1980, ApL, 20, 131
- Bernstein et al. (2003) Bernstein, R., Shectman, S. A., Gunnels, S. M., Mochnacki, S., & Athey, A. E. 2003, Proc. SPIE, 4841, 1694
- Birriel et al. (2000) Birriel, J., Espey, B. R., & Schulte-Ladbeck, R. E. 2000, ApJ, 545, 1020
- Contini & Formiggini (1999) Contini, M., & Formiggini, L. 1999, ApJ, 517, 925
- Crawford et al. (1999) Crawford, F. L., McKenna, F. C., Keenan, F. P., et al. 1999, A&AS, 139, 135
- de Val-Borro et al. (2009) de Val-Borro, M., Karovska, M., & Sasselov, D. 2009, ApJ, 700, 1148
- de Val-Borro et al. (2017) de Val-Borro, M., Karovska, M., Sasselov, D. D., & Stone, J. M. 2017, MNRAS, 468, 3408
- Dixon et al. (2007) Dixon, W. V., Sahnow, D. J., Barrett, P. E., et al. 2007, PASP, 119, 527
- Espey et al. (1995) Espey, B. R., Schulte-Ladbeck, R. E., Kriss, G. A., et al. 1995, ApJ, 454, L61
- Ferland et al. (2017) Ferland, G. J., Chatzikos, M., Guzmán, F., et al. 2017, RMxAA, 53, 38
- González-Riestra et al. (2013) González-Riestra, R., Selvelli, P., & Cassatella, A. 2013, A&A, 556, 85
- Gromadzki et al. (2009) Gromadzki, M., Mikołajewska, J., Whitelock, P., & Marang, F. 2009, Acta Astronomica, 59, 169
- Groppi & Hanson (1996) Groppi, C. E., & Hanson, M. M. 1996, PASP, 108, 575
- Harries & Howarth (1996) Harries, T. J., & Howarth, I. D. 1996, A&AS, 119, 61
- Hayes & Nussbaumer (1996) Hayes, M. A., & Nussbaumer, H. 1996, A&A, 161, 287
- Heo et al. (2016) Heo, J.-E., Angeloni, R., Di Mille, F., Palma, T., & Lee, H.-W. 2016, ApJ, 833, 286
- Heo & Lee (2015) Heo, J.-E., & Lee, H.-W. 2015, JKAS, 48, 105
- Hillman & Kashi (2021) Hillman, Y. & Kashi, A. 2021, MNRAS, 501, 201
- Hinkle et al. (2013) Hinkle, K. H., Fekel, F. C., Joyce, R. R., & Wood, P. 2013, ApJ, 770, 28
- Huarte-Espinosa et al. (2013) Huarte-Espinosa, M., Carroll-Nellenback, J., Nordhaus, J., Frank, A., & Blackman, E. G. 2013, MNRAS, 433, 295
- Iłkiewicz et al. (2019) Iłkiewicz, K., Mikołajewska, J., Belczyński, K., Wiktorowicz, G., & Karczmarek, P. 2019, MNRAS, 485, 5468
- Jordan et al. (1994) Jordan S., Mürset U., Werner K. 1994, A&A, 283, 475
- Jurkic & Kotnik-Karuza (2012) Jurkic, T., & Kotnik-Karuza, D. 2012, A&A, 544, 25
- Kaufer et al. (1999) Kaufer, A., Stahl, O., Tubbesing, S., et al. 1999, Msngr, 95, 8
- Kelson (2003) Kelson, D. D. 2003, PASP, 115, 668
- Kelson et al. (2000) Kelson, D. D. Illingworth, G. D., van Dokkum, P. G., & Franx, M. 2000, ApJ, 531, 159
- Kenyon (1986) Kenyon, S. J. 1986, The Symbiotic Stars (New York: Cambridge Univ. Press)
- Kochanek et al. (2017) Kochanek, C. S., Shappee, B. J., Stanek, K. Z., et al. 2017, PASP, 129, 104502
- Kotnik-Karuza et al. (2006) Kotnik-Karuza, D., Friedjung, M., Whitelock, P. A., et al. 2006, A&A, 452, 503
- Lamers et al. (1999) Lamers, H. J. G. L. M., & Cassinelli, J. P. 1999, in Introduction to Stellar Winds, ed. J. G. L. M. L. Henny & P. C. Joseph (Cambridge: Cambridge Univ. Press), 452
- Lee & Kang (2007) Lee, H.-W., & Kang, S. 2007, ApJ, 669, 1156
- Lee & Park (1999) Lee, H.-W., & Park, M.-G. 1999, ApJ, 515, 89
- Lee & Lee (1997) Lee, K. W., & Lee, H.-W. 1997, MNRAS, 292, 573
- Lee et al. (2019) Lee, Y.-M., Lee, H.-W., Lee, H.-G., & Angeloni, R. 2019, MNRAS, 487, 2166
- Mastrodemos & Morris (1998) Mastrodemos, N., & Morris, M. 1998, ApJ, 497, 303
- Mayall (1949) Mayall, M. W. 1949, BHarO, 919, 15
- McKenna et al. (1997) McKenna, F. C., Keenan, F. P., Hambly, N. C., et al. 1997, ApJS, 109, 225
- Mohamed & Podsiadlowski (2012) Mohamed S. & Podsiadlowski P., 2012, Balt. Astron., 21, 88
- Moos et al. (2000) Moos, H. W., Cash, W. C., Cowie, L. L., et al. 2000, ApJ, 538, L1
- Munari & Zwitter (2000) Munari, U. & Zwitter, T. 2002, A&A, 388, 188
- Mürset et al. (1991) Mürset U., Nussbaumer H., Schmid H. M., Vogel M. 1991, A&A, 248, 458
- Nussbaumer & Dumm (1997) Nussbaumer, H., & Dumm, T. 1997, A&A, 323, 387
- Nussbaumer et al. (1989) Nussbaumer, H., Schmid, H. M., & Vogel, M. 1989, A&A, 211, L27
- Pottasch & Varsavsky (1960) Pottasch S. R., & Varsavsky C. M. 1960, Ann. Astrophys. 23, 516
- Sahnow et al. (2000) Sahnow, D. J., Moos, H. W., Ake, T. B., et al. 2000, ApJ, 538, L7
- Saladino et al. (2018) Saladino, M. I., Pols, O. R., van der Helm, E., Pelupessy, I., & Portegies Zwart, S. 2018, A&A, 618, 50
- Schmid (1989) Schmid, H. M. 1989, A&A, 211, L31
- Schmid et al. (1999) Schmid, H. M., Krautter, J., Appenzeller, I., et al. 1999, A&A, 348, 950
- Schmid & Schild (1994) Schmid, H. M., & Schild, H. 1994, A&A, 281, 145
- Schmid & Schild (2002) Schmid, H. M., & Schild, H. 2002, A&A, 395, 117
- Seaquist, Taylor & Button (1984) Seaquist, E. R., Taylor, A. R., & Button, S. 1984, ApJ, 284, 202
- Shappee et al. (2014) Shappee, B. J., Prieto, J. L., Grupe, D., et al. 2014, ApJ, 788, 48
- Thackeray & Webster (1974) Thackeray, A. D., & Webster, L. 1974, MNRAS, 168, 101
- Tody (1986) Tody, D. 1986, Proc. SPIE, 627, 733
- Tody (1993) Tody, D. 1993, in ASP Conf. Ser. 52, Astronomical Data Analysis Software and Systems II, ed. R. J. Hanisch, R. J. V. Brissenden, & J. Barnes (San Francisco, CA: ASP), 173
- Whitelock (1988) Whitelock, P. 1988, in The Symbiotic Phenomenon, ASSL, 145, 47
- Young (2012) Young, P. R. 2012, ApJ, 749, 1