Quantifying Bounds of Model Gap for Synchronous Generators
Abstract
In practice, uncertainties in parameters and model structures always cause a gap between a model and the corresponding physical entity. Hence, to evaluate the performance of a model, the bounds of this gap must be assessed. In this paper, we propose a trajectory-sensitivity–based approach to quantify the bounds of the gap. The trajectory sensitivity is expressed as a linear time-varying system. We thus first derive several bounds for a general linear time-varying system in different scenarios. The derived bounds are then applied to obtain bounds of the model gap for generator plant models with different types of structural information, e.g., models of different orders. Case studies are carried out to show the efficacy of the bounds through synchronous generator models on different accuracy levels.
Index Terms:
linear time-varying systems; model validation; model structure difference; trajectory sensitivity.I Introduction
Integrity of plant models in power systems is crucial for a reliable and robust power grid, which is key to economical electricity delivery to power consumers. Also, long-term planning and short-term operational decisions depend heavily on studies and investigations using plant models. Imprecise models will result in conclusions that deviate from reality, which jeopardizes system designs and affects decision-making. Model mismatch has been an important cause of a few blackouts in North America, e.g., the 1996 Western States outage and the 2011 blackout in San Diego. In the study on these blackouts, simulations with imprecise models show that systems are stable and well-damped, but these systems eventually collapse, which contradicts the simulation study with mismatched models. Thus, investigating the mismatch between models and plants is important for a reliable, robust, and economical grid. Much effort has been devoted to such investigation, to improve model quality.
Model calibration has been a hot research topic in the last decade. The basic idea is to inject measurement data, e.g., voltage magnitude and frequency/phase angle, into the power plant terminal bus in dynamic simulation and compare the simulated response with the actual measured data, as in [1, 2]. Such a method is called ”event playback” and has been included in major software vendor tools, e.g., GE PSLF, Siemens PTI PSS/E, Powertech Labs TSAT, and PowerWorld Simulator [3]. Once model discrepancy is observed with event playback or another method, model identification and calibration are needed. Methods and tools to calibrate models are developed using linear or nonlinear curve fitting techniques, either for power plants as in [4, 5] or for general plants, as in [6], in which the methods can be applied to power plants. But it has been reported that multiple solutions may exist for the same model performance with the methods and tools in [3, 5, 6], making it difficult to identify the true parameters of the model. Simultaneous perturbation stochastic approximation methods based on particle swarm optimization approaches are developed in [7, 8]. Such methods are reliable and sufficiently precise, but they are time-consuming, for they require extensive iterations of simulations to obtain good performance. A probabilistic collocation method is used to evaluate the uncertainty in power systems with a few uncertain parameters in [9]. Feature-based searching algorithms are investigated in [10, 11, 12], which help identify the problematic parameters but lack calibration accuracy. A dynamic-state-estimation-based generator parameter identification algorithm is proposed in [13] with good results for the test case, but it has been shown to be very sensitive to measurement noise. A rule-based approach is reported in [14], which classifies parameters based on their effects on simulation responses. But this approach requires extensive trial and error and knowledge of the physics of the system, which may not be acquired with enough precision. A method and a tool suite are developed to validate and calibrate models based on trajectory sensitivity analysis and advanced ensemble Kalman filters in [15].
The latest results show that most existing approaches can handle parameter errors well but model structure errors are very difficult to be calibrated. For example, if one uses a second-order model to approximate a fourth-order model’s response. No matter how to tune the parameters of the second-order model, their response curves won’t match. This motivates us to study the bound of model structures (model gap). Such quantification will enable us to know the range of the gap in advance and be prepared to take precautions to ensure power systems run reliably, robustly, and economically. This is important for both long-term planning and short-term operational decisions.
Quantifications of the model gap are investigated based on trajectory sensitivity in this paper. Two bounds for model gaps are derived via analysis of trajectory sensitivity with respect to imprecise structural information. Because imprecise information probably results from changes of parameters and unmodeled dynamics, the first bound quantifies model gaps caused by imprecise parameters and the second one by unmodeled dynamics. Scenarios for model gaps caused by changes of parameters and unmodeled dynamics are both simulated to show the efficacy of the derived bounds. Unlike existing results on using trajectory sensitivity for model gaps in power systems in the literature, e.g., [16], explicit bounds of the trajectory sensitivity are obtained in this paper.
The rest of this paper is organized in a generic-to-specific way. That is, we first present the results for trajectory sensitivity for general models and then apply those general results to quantify the model gaps of synchronous generators. Some preliminary information is introduced in Section II. Several bounds for linear time-varying (LTV) systems are derived in Section III. We apply the bounds to quantify the model gaps of synchronous generator models on different accuracy levels in Section IV. In Section V, it comes to the conclusions.
II Preliminary Groundwork
This section provides preliminary development on trajectory sensitivity, integral inequality, and other necessary background.
The trajectory sensitivity of a system of general ordinary differential equations (ODEs) is as follows.
Lemma 1.
[17] Consider a system of ordinary differential equations
| (1) | ||||
Suppose is continuous and has continuous partial derivatives with respect to and in the region . Then the solution of (1) is continuously differentiable with respect to in the region , where and Let be the solution of (1). Let and be the partial derivatives of with respect to and , respectively, at . Let , , and be the derivatives, which are also called sensitivities, of the solution with respect to , , and , respectively. Then the sensitivities obey the following ODEs:
| (2) | ||||||
| (3) | ||||||
| (4) |
Remark 1.
Remark 2.
For a scalar integral inequality, Grönwall’s inequality applies, as follows.
Lemma 2 (Grönwall’s Lemma).
[18] Let be a real continuous function defined in . If
and , then
| (5) |
If, in addition, the function is non-decreasing, then
An ODE can be equivalently converted to an integral equation, and then transformed into an integral inequality. Thus, Grönwall’s Lemma can be used to compute bounds of the states of the trajectory sensitivity equations (2), (3), and (4).
Matrix exponentials are important for linear systems. We have the following lemma on the norm of matrix exponentials.
Lemma 3.
[19] Let be a stable matrix, (i.e., the real parts of its eigenvalues are negative), and be the symmetric and positive-definite matrix such that , represents the maximum eigenvalue of and the minimum one. Then, , where and .
From Lemma 3, the norm of the exponential of a stable matrix can be upper-bounded by a vanishing exponential function. Such a result is useful to investigate the steady state of a linear system.
The following lemma may be helpful for investigation of a linear system with vanishing input.
Lemma 4.
| (6) |
where is a positive constant, and .
The proof of Lemma 4 may be found in a calculus textbook. We re-prove it in the appendix of this paper.
III Bounds of Linear Time-Varying Systems
Model gaps are caused by imprecise parameters and unmodeled dynamics. Bounds of model gaps resulting from these two causes can be captured by analyzing the bound of trajectory sensitivity of the model. Since the trajectory sensitivity of a model is described by LTV systems, bounds of LTV systems are derived in this section.
Consider an LTV system
| (7) | ||||
The following assumption is imposed on the state matrix of the LTV system (7):
Assumption 1.
exists and is a constant matrix, and the eigenvalues of have negative real parts.
Remark 3.
Assumption 1 is reasonable because practical power plants usually reach a steady state, which results in constant-limit matrices in its trajectory sensitivity.
In this section, we consider two cases: 1. the input to an LTV system is known, and 2. the input to an LTV system is not known but bounded.
The first case can be used to quantify model gaps caused by imprecise parameters and the second one can be applied to obtaining model gaps arising from unmodeled dynamics.
III-A Bounds of LTV Systems with Known Input
When the input of the LTV system (7) of which the state matrix has a constant limit as stated in Assumption 1 can be accurately known, bounds of the state of the LTV system can be obtained by decomposing the LTV system into a linear time-invariant (LTI) system of which the state matrix is as in Assumption 1 and an additional term. The result is stated as follows.
Theorem 1.
Consider the LTV system in (7) which satisfies Assumption 1. Let
| (8) |
let be an upper bound of
and let be an upper bound of
Then, the bounds of the state of the LTV system (7) can be estimated in the following two ways:
-
Bound 1)
The distance between and can be bounded as follows:
(9) Thus, the lower bound of the th entry of is
and the upper bound is
where is the th entry of .
-
Bound 2)
The norm of can be bounded as follows:
(10) Thus, the lower bound of the th entry of is
and the upper bound is
Proof.
It can be obtained from (7) that
Let Then
Then
| (11) | ||||
-
Proof of Bound 1):
We first derive the upper bound of the distance between and . From (11), it can be deduced that
(12) Then
Applying Lemma 2, we find that
(13) In (13),
Therefore,
Let and denote the th entries of and , respectively. It can be deduced that and thus
Therefore, the lower bound of is
and the upper bound is
- Proof of Bound 2):
∎
Remark 4.
With the derived bounds, the behavior of can be approximated by that of when is sufficiently large, as shown below.
Corollary 1.
Proof.
Since is bounded and is stable, is also bounded. Let be a bound of . in Theorem 1 can be selected as
and as
Then,
From Lemma 3, , where and are selected as in Lemma 3. Thus,
Note that . Then, from Lemma 4,
It can be determined that
Also, as and thus ,
So, . As , Also, from the fact that
it can be shown that . From Bound 1), ∎
III-B Bounds of LTV Systems with Unknown but Bounded Input
When the disturbance to the ODEs in (1) is constant, the bounds derived in Theorem 1 can be directly applied to quantifying the bound of the trajectory sensitivity of (1). In this subsection, we thus focus on the case in which the disturbance varies with time.
Let be an arbitrary continuous function such that and let be a small positive number. can represent an arbitrary continuous signal of which the magnitude is . The time-varying disturbance of the parameter in (1) can be expressed as . Let . Then when , and there is no disturbance. Let be the solution of the following ODE:
Then is the sensitivity of with respect to . Then from Lemma 1,
| (15) |
and has initial values .
If we know the mathematical form of , then we can apply the bounds in Theorem 1 to obtain the bounds of the trajectory sensitivity of (1) when the disturbance varies with time. However, the mathematical form of is unknown or cannot be accurately known in many cases. Therefore, a bound of LTV systems for bounded disturbances is necessary in those cases. Such a bound is derived as follows.
Theorem 2.
Consider an LTV system (7) with Assumption 1. Also, assume that is a vector of which every entry is a continuous function. Let , where is the th entry of . Let , , and be defined as in Theorem 1 and be an upper bound of . Then, the bound of the state of the LTV system can be estimated as follows:
where is a constant such that . (It is easy to see that , where is the dimension of . ) Thus, the lower bound of every entry of is
and the upper bound is
Proof.
Remark 5.
The bound in Theorem 2 is derived for all bounded inputs. It might be very large for some types of bounded inputs.
IV Case Studies
In this section, the bounds obtained in Section III are applied to quantifying a generator model gap caused by mismatch of mechanical power via simulation. The bound in Theorem 1 is applied to quantifying the gap caused by imprecise parameters, while the bound in Theorem 2 is applied to quantifying the gap caused by unmodeled dynamics. Both causes are regarded as disturbances to the model. For a generator, the gap of the rotor angle is more important than angular frequency because it is related to the gap of the electrical power output of the generator. In this section, the generator response without any disturbance is referred to as nominal response, while that with disturbance as disturbed response. Assume a generator is represented by the second-order generator model shown below:
The physical meanings, values, and units of these parameters are collected in Table I and .
| Variable Name | Physical Meaning | Value | Unit |
|---|---|---|---|
| mechanical starting time | 13 | kWs/kVA | |
| frequency rating | 60 | Hz | |
| d-axis transient reactance | 0.2 | p.u. | |
| q-axis transient reactance | 0.4 | p.u. | |
| leakage reactance | 0.15 | p.u. | |
| voltage rating | 1 | p.u. | |
| d-axis transient potential | 0.1 | p.u. | |
| q-axis transient potential | 0.9 | p.u. | |
| armature resistance | 0.0005 | p.u. | |
| mechanical power | 1 | p.u. | |
| damping coefficient | 100 |
By solving as a function of and substituting the last two equations into it, we can express as a function of . We denote the function . Let . The generator model can be simplified to the following:
| (16) | ||||
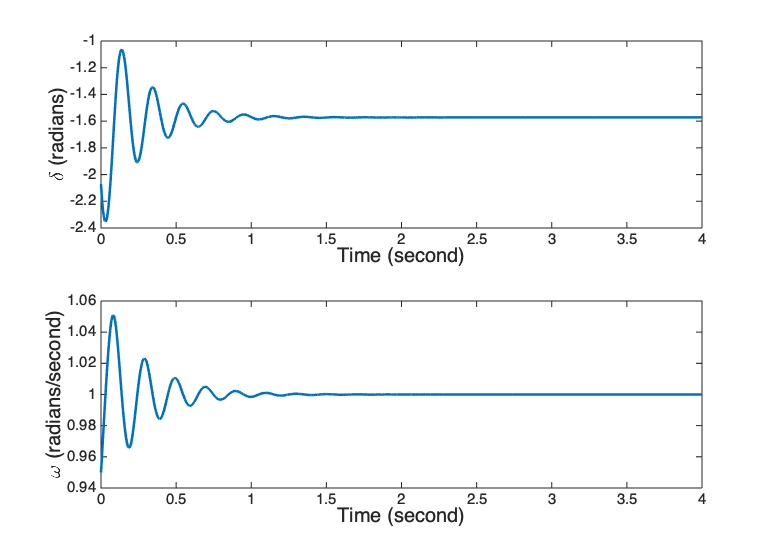
The nominal response of the generator with parameter values being collected in Table I is presented in Fig. 1. The initial values of and are selected to be and , respectively. The generator model is stable with this pair of initial values.
Let represent the state of the generator and be the right-hand side of the generator model. Next, we only simulate the model gap caused by uncertainty of . If we let , then
| (17) | ||||
where
and
The trajectory sensitivity equations in (17) are LTV, and its state matrix is convergent as is convergent, which can be observed in Fig. 1. When is substituted into , is stable and the imaginary parts of its eigenvalues are nonzero. As a result, instead of the upper bound of matrix exponentials from Lemma 3, the upper bound of is selected to be . Note that the bound obtained from Lemma 3 will result in bounds of a model gap that is too large to make sense. The upper bound of is selected to be . The way vanishes is determined by the way converges to zero in (16). The generator model represented by (16) is nonlinear. It is thus difficult to tell whether and converge in a way similar to . However, we can always find such an upper bound of .
Next, the bounds of LTV systems derived in Section III are applied to (17) to estimate the model gap caused by imprecise parameters and unmodeled dynamics. It should be noted that the bounds of the trajectory sensitivity equations in (17) can only be applied when the disturbance is small.
IV-A Bounds with imprecise Parameters
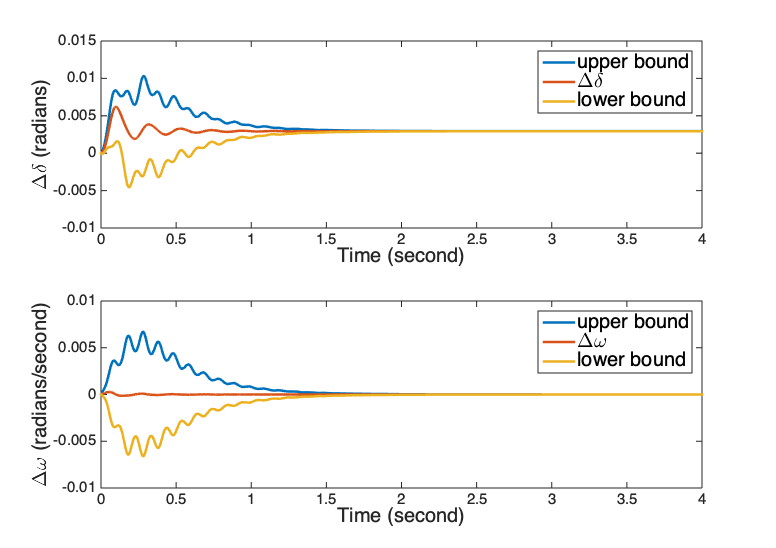
The constant disturbance to is selected to be p.u. The difference between the nominal response and the disturbed response is shown in Fig. 2, which also shows the upper bound and the lower bound corresponding to those in Bound 1) in Theorem 1. Note that the upper bound and the lower bound are expressed as and they are not symmetric about the x-axis.
The quantification of the model gap caused by constant disturbance is quite tight for the phase angle . The obtained bounds have the same steady-state value as the actual model gap, and the upper bound is very close to the actual model gap at the beginning. In the middle of the response, when the time is around second, there is mismatch between the obtained bounds and the actual response gap. That is because the upper bound estimates of and that are used in the simulation are larger than the actual and . The quantification of the model gap obtained here is quite accurate for the phase angle .
Note that the bounds of the model gap are obtained for the state vector of the system, which is in this example. If one state plays a major role in the gap, the obtained bounds may be tight for this state and very loose for other states. This is why the quantification is not accurate for , which can be observed in the plot at the bottom of Fig. 2. However, because the phase angle determines the power output of the generator and is more important than , the quantification of model gaps works well enough for the generator model.
IV-B Bounds with Unmodeled Dynamics
In this subsection, two time-varying disturbance signals are adopted, representing unmodeled dynamics. The first one is a sine wave while the second one is the difference between the generator model in (16) and a more complex one.
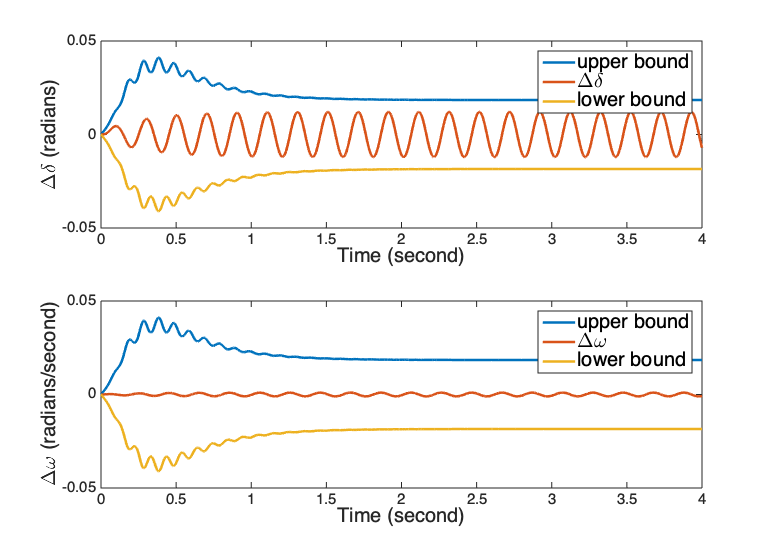
The magnitude of the sine wave is selected to be p.u. and the frequency to be the resonant frequency of the system, . The disturbance signal at the resonant frequency is amplified to the largest degree by the LTI system of which the state matrix is . Combined with Corollary 1, which states that the behavior of the LTV system of sensitivity equations in (17) satisfying Assumption 1 can be approximated by the LTI system , a sine signal at the generator’s resonant frequency results in a larger model gap than other signals with the same magnitude. The model gap caused by this sine signal is presented in Figure 3, in which the upper bound and the lower bound are those in Theorem 2 and are symmetric about the x-axis. The bound is close for the disturbance of , which shows that the bounds of model gaps are tight for this case.
The second signal for unmodeled dynamics originates from the difference between (16) and a higher-order model. The higher-order model of the generator has the following definitions in addition to (16),
| (18) | ||||
where the physical meanings and values of the variables are presented in Table II.
| Variable Name | Physical Meaning | Value | Unit |
|---|---|---|---|
| reference speed | 1 | p.u. | |
| droop | 0.02 | p.u. | |
| maximum turbine output | 1.2 | p.u. | |
| minimum turbine output | 0.3 | p.u. | |
| governor time constant | 0.1 | s | |
| servo time constant | 0.45 | s | |
| transient gain time constant | 0 | s | |
| power fraction time constant | 12 | s | |
| reheat time constant | 50 | s |
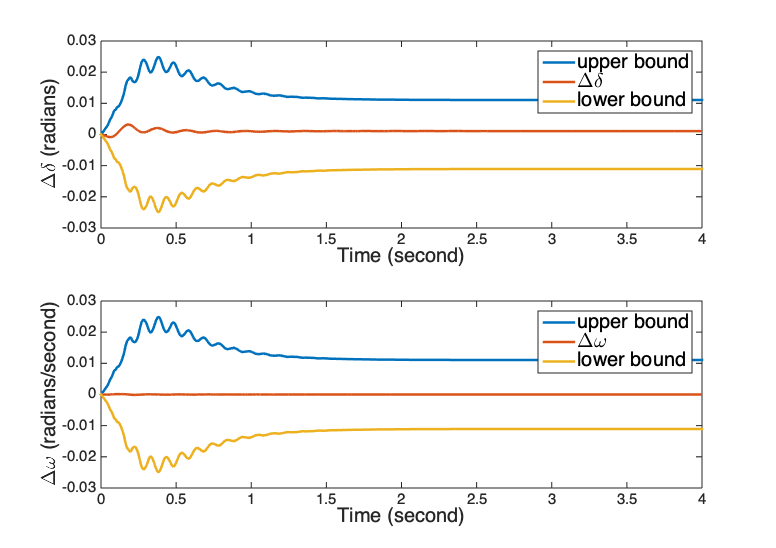
Note that in (16) is regarded as a constant, while it is dynamic in (18). in (18) is an output of an LTI system with saturated input. The gap between the higher-order model and the second-order model is presented in Fig. 4, in which the upper bound and the lower bound are those in Theorem 2 and are symmetric about the x-axis. It can be observed that the gap between the second-order model in (16) and the higher-order model is within the bound developed in Theorem 2.
It should be noted that the bounds used in this subsection are developed for model gaps caused by all unmodeled dynamics. Thus, the bounds may be very loose for some specific disturbance, such as that resulting from a higher-order model, as presented in Fig. 4. But results for the sine signal selected for Fig. 3 show that the developed bounds are tight for the class of bounded dynamics.
V Conclusions
Bounds of model gaps were quantified by estimating the bounds of trajectory sensitivity. First, bounds for responses of general linear time-varying systems were obtained with both constant input and dynamic input. Then, the bounds for linear time-varying systems were applied to quantifying the model gaps. Simulations with a generator model showed the efficacy of the quantification. Future work may include investigation of more general models and online quantification.
[Proof of Lemma 4] As , is finite. And for any , there exists , such that for all , ; there also exists , such that for all , . Let . Then, for all ,
As a result,
References
- [1] D. Kosterev, “Hydro turbine-governor model validation in Pacific Northwest,” IEEE Transactions on Power Systems, vol. 19, no. 2, pp. 1144–1149, 2004. [Online]. Available: https://ieeexplore.ieee.org/document/1295026
- [2] Z. Huang, P. Du, D. Kosterev, and S. Yang, “Generator dynamic model validation and parameter calibration using phasor measurements at the point of connection,” IEEE Transactions on Power Systems, vol. 28, no. 2, pp. 1939–1949, 2013. [Online]. Available: https://ieeexplore.ieee.org/document/6487426
- [3] North American SynchroPhasor Initiative (NASPI), “Technical workshop - model verification tools,” 2016. [Online]. Available: https://naspi.org/node/528
- [4] P. Pourbeik, R. Rhinier, S. Hsu, B. L. Agrawal, and R. Bisbee, “Semiautomated model validation of power plant equipment using online measurements,” IEEE Transactions on Energy Conversion, vol. 28, no. 2, pp. 308–316, 2013. [Online]. Available: https://ieeexplore.ieee.org/document/6459572
- [5] Electric Power Research Institute (EPRI), “Power plant parameter derivation (PPPD),” 2015. [Online]. Available: https://www.epri.com/research/products/1022543
- [6] MathWorks, “Model-based calibration toolbox,” 2017. [Online]. Available: https://www.mathworks.com/products/mbc/
- [7] N. Nayak, H. Chen, W. Schmus, and R. Quint, “Generator parameter validation and calibration process based on PMU data,” 2016 IEEE/PES Transmission and Distribution Conference and Exposition (T&D), Dallas, TX, pp. 1–5, 2016. [Online]. Available: https://ieeexplore.ieee.org/abstract/document/7519886
- [8] C. Tsai, L. Changchien, I. Chen, C. Lin, W. Lee, C. Wu, and H. Lan, “Practical considerations to calibrate generator model parameters using phasor measurements,” IEEE Transactions on Smart Grid, vol. 8, no. 5, pp. 2228–2238, 2017. [Online]. Available: https://ieeexplore.ieee.org/document/7401126
- [9] J. R. Hockenberry and B. C. Lesieutre, “Evaluation of uncertainty in dynamic simulations of power system models: The probabilistic collocation method,” IEEE Transactions on Power Systems, vol. 19, no. 3, pp. 1483–1491, 2004. [Online]. Available: https://ieeexplore.ieee.org/document/1318685
- [10] A. R. Borden and B. C. Lesieutre, “Determining power system modal content of data motivated by normal forms,” in 2012 North American Power Symposium (NAPS), Champaign, IL, 2012, pp. 1–6. [Online]. Available: https://ieeexplore.ieee.org/document/6336387
- [11] A. R. Borden, B. C. Lesieutre, and J. Gronquist, “Power system modal analysis tool developed for industry use,” in 2013 North American Power Symposium (NAPS), Manhattan, KS, 2013, pp. 1–6. [Online]. Available: https://ieeexplore.ieee.org/document/6666956
- [12] A. R. Borden and B. C. Lesieutre, “Variable projection method for power system modal identification,” IEEE Transactions on Power Systems, vol. 29, no. 6, pp. 2613–2620, 2014. [Online]. Available: https://ieeexplore.ieee.org/document/1318685
- [13] R. Huang, E. Farantatos, G. J. Cokkinides, and A. P. Meliopoulos, “Physical parameters identification of synchronous generators by a dynamic state estimator,” 2013 IEEE Power & Energy Society General Meeting, Vancouver, BC, pp. 1–5, 2013. [Online]. Available: https://ieeexplore.ieee.org/document/6672882
- [14] A. A. Hajnoroozi, F. Aminifar, and H. Ayoubzadeh, “Generating unit model validation and calibration through synchrophasor measurements,” IEEE Transactions on Smart Grid, vol. 6, no. 1, pp. 441–449, 2015. [Online]. Available: https://ieeexplore.ieee.org/document/696561
- [15] R. Huang, R. Diao, Y. Li, J. J. Sanchez-Gasca, Z. Huang, B. Thomas, P. V. Etingov, S. Kincic, S. Wang, R. Fan, et al., “Calibrating parameters of power system stability models using advanced ensemble Kalman filter,” IEEE Transactions on Power Systems, vol. 33, no. 3, pp. 2895–2905, 2018. [Online]. Available: https://ieeexplore.ieee.org/document/8068956.
- [16] I. A. Hiskens and J. Alseddiqui, “Sensitivity, approximation, and uncertainty in power system dynamic simulation,” IEEE Transactions on Power Systems, vol. 21, no. 4, pp. 1808–1820, 2006. [Online]. Available: https://ieeexplore.ieee.org/document/1717585
- [17] T. Ding and C. Li, A Course on Ordinary Differential Equations. Beijing: Higher Education Press, 2004.
- [18] S. S. Dragomir, Some Gronwall type inequalities and applications. Nova Science, 2003. [Online]. Available: https://papers.ssrn.com/sol3/papers.cfm?abstract_id=3158353
- [19] G. Hu and M. Liu, “The weighted logarithmic matrix norm and bounds of the matrix exponential,” Linear Algebra and its Applications, vol. 390, pp. 145–154, 2004. [Online]. Available: https://doi.org/10.1016/j.laa.2004.04.015.