Programming Mechanics in Knitted Materials, Stitch by Stitch
Krishma Singal1,+Michael S. Dimitriyev2,3,+Sarah E. Gonzalez1,+Alexander P. Cachine1Sam Quinn1Elisabetta A. Matsumoto1,4,*1School of Physics, Georgia Institute of Technology, Atlanta, Georgia 30332, USA
2Department of Polymer Science and Engineering, University of Massachusetts, Amherst, Massachusetts 01003, USA
3Department of Materials Science and Engineering, Texas A&M University, College Station, Texas 77843, USA
4 International Institute for Sustainability with Knotted Chiral Meta Matter (WPI-SKCM), Hiroshima University, Boulder, Higashihiroshima 739-8526, Japan
*[email protected]; +these authors contributed equally to this work
Abstract
Knitting turns yarn, a 1D material, into a 2D fabric that is flexible, durable Warren2018 , and can be patterned to adopt a wide range of 3D geometriesNarayanan2018 .
Like other mechanical metamaterialsBertoldi2017 , the elasticity of knitted fabrics is an emergent property of the local stitch topology and pattern that cannot solely be attributed to the yarn itself.
Thus, knitting can be viewed as an additive manufacturing technique that allows for stitch-by-stitch programming of elastic properties and has applications in many fields ranging from soft roboticsAbel2012 ; Albaugh2019 ; Sanchez2021 and wearable electronicsZeng2014 ; Cherenack2012 to engineered tissueMagnan2020 and architected materialsThomsen2016 ; Scott2018 .
However, predicting these mechanical properties based on the stitch type remains elusive.
Here we untangle the relationship between changes in stitch topology and emergent elasticity in several types of knitted fabrics.
We combine experiment and simulation to construct a constitutive model for the nonlinear bulk response of these fabrics.
This model serves as a basis for composite fabrics with bespoke mechanical properties, which crucially do not depend on the constituent yarn.
Knitting has long been regarded as an art that turns natural fibers into garments.
Recently, engineers have begun to use knitting as an additive manufacturing technique to construct textiles with bespoke mechanical properties and geometries from ‘yarns’ made from a myriad of materials.
Textiles research has traditionally been housed in both textile engineering and computer graphics; however, the growing interest of textiles as metamaterials in other fields creates the need for cross-disciplinary pollination.
From that viewpoint, knitted textiles are mechanical metamaterials whose properties are imbued by the pattern of stitches, which exists irrespective of the choice of particular yarn.
By choosing the appropriate stitches and their ordering, one can sculpt the local mechanical response of a textile using a yarn of their choice.
Tunable compliance and tensile strength of knitted and braided structures made from bio-compatible yarns are used for medical bandagesMagnan2020 , surgical graftsFreeman2009 ; Goyal2019 , and mesh implantsMikolajczyk2016 ; Shuang2019 ; Liu2019 ; Yu2019 .
The mechanical properties of knitted textiles make them ideal for strainMattmann2008 ; Seyedin2019 and pressureVu2020 ; Yan2022 ; mcdonald_knitted_2020 sensors used in medical monitoring and therapeuticsFan2020 ; Tian2021 ; Chen2021 as well as soft actuatorsScott2013 ; Abel2013 ; Albaugh2019 ; Han2017 ; Rivera2020 .
Likewise, knitted textiles can harvest energy from human movementWang2016 ; Kwak2017 ; Choi2017 and even store energy as wearable supercapacitorsBao2012 ; Jost2013 .
By spatially varying the pattern of stitches, we can generate textiles with high or low stiffnesses (Fig. 1).
With the aid of computerized knitting machines, we can on-the-fly program regions of variable stiffness into a larger textile.
Unlike other composites, the entangled microstructure that gives rise to a knitted fabric’s variable rigidity also holds it together along seamless interfaces.
Continuously modifying the in-plane rigidity of a textile across a region can mitigate the damage often associated with large stresses at interfacesSuresh2001 .
To facilitate the rational design of textiles, we need to understand the fundamental mechanics of knitted materials.
Here, inspired by the design of hand-knit garments, we study how the mechanical behavior of weft knitted fabrics is encoded by the topology of their stitches as a first step towards creating a design tool for programmable textile metamaterials.
The stitch pattern and mechanical properties of the constituent yarn are quasi-independent knobs we can fine tune.
A consequence of our model is that knitting can be used to program mechanics at any lengthscale, from polymeric and colloidal assembliesGoodrich2017 to light-weight tensile support in building constructionThomsen2016 .
The computer graphics community has made great strides in creating knit fabric simulations with visual fidelitykaldor8 ; kaldor_efficient_2010 ; cirio_yarn-level_2017 , often with the goal of modeling entire sheetssperl_estimation_2022 of fabric and garmentsliu_knitting_2021 . There has not yet been a systematic study of how changes in stitch topology affect the fabric elasticitytekerek_experimental_2020 – even modeling stockinette (sometimes called jersey or plain-knit) fabric is quite complex Choi2006 ; Postle2002 ; Poincloux2018PRX .
In this work, our goal is to study knit fabrics from three different types of models: a minimal model of yarn-level simulation at the microscopic level, a constitutive model at the textile level, and our “Reduced-Symmetry” model at the intermediate level to unite these two points of view.
Traditionally elastic response in knitted textiles is achieved by modifying the properties of the yarn often using blends of natural (wool and cotton) and synthetic fibers (polyester, nylon, or other plastics) which contribute to microplastic pollutiongrandview .
To maximise extensibility, manufacturers reduce the amount of natural fibers used in the fabric and increase the amount of elastane and/or other elastomeric fibers.
Our goal is to use stitch type as a way of modulating the bulk elasticity of fabrics made of inelastic yarn, irregardless of fiber composition, so that the desired elastic response of a textile can be achieved with natural and/or biodegradable fibers and without synthetic materials. Recent research has shown that a broad range of synthetic materials can degrade when in contact with skin secretions, which increases the potential for dermal absorption of compounds within those fibersAbafe2023 .
Supplementary Fig. 1: Knitted materials have elastic responses that can be programmed by the pattern of Ks and Ps. (a) A schematic of the knitting process where a knitting machine converts a code of Ks and Ps into a textile such as the Issey Miyake IsseyMiyake sweater shown in (b). The knitting machine manipulates a bed of latch needles that pull new loops of yarn through existing loops to build the knitted fabric. An entangled region of the stitch is identified by the red circle in the inset of (a). (c) Knitted fabrics with a mix of both Ks and Ps are markedly more extensible (under the same applied stress) than ones with only a single type of stitch. (d-g) Close up images (left), line diagrams (center), and simulation results (right) of four fabrics: (d) stockinette, (e) garter, (f) rib, and (g) seed.
Topology and Elasticity
Knitted textiles are composed from a rectangular lattice of slip knots.
The two foundational stitches in knitting are the knit stitch (denoted K, also known as a front stitch) and the purl stitch (denoted P, also known as a back stitch).
These two stitches form the bulk of a textile’s structure, although many more complicated stitches exist Markande2020 .
The knit stitch is formed by passing a loop of yarn from the back to the front of the textile through an existing loop, while the purl stitch pulls the new loop from the front to the back.
Therefore, knits and purls are fundamentally the same object, just related by a rotation about the -direction of the fabric (Fig. 1a).
A schematic of the knitting process is shown in Fig. 1a,b.
Combining Ks and Ps in different patterns generates textiles with markedly different linear elastic responses (Fig. 1c).
Our goal is to untangle this relationship between stitch pattern and mechanical response using four common knitted fabrics: stockinette (Fig. 1d), garter (Fig. 1e, also known as links-links), rib (Fig. 1f), and seed (Fig. 1g).
The combination of entangled elastic segments and confinement makes knitted fabrics different from many mechanical metamaterials.
The microstructure of a knitted fabric has entangled regions whose contact interactions dictate the stiffness and unconstrained regions that enable extensibility.
Changing the ordering of yarn in an entangled region changes the topology of the fabric.
Therefore, the topological method of knot theory is used to study textiles Markande2020 ; Grishanov2009 .
Previous studies have shown that the ordering of crossings within a knot can have a major impact on its strengthPatil2020 , indicating a strong relationship between topology and mechanics.
We measured the elastic response of each of the four common knitted fabrics (Fig. 1d-g) in a series of uniaxial stretching experimentsquaglini_experimental_2008 and simulations (see Methods; Supplementary Fig. 1; Supplementary Fig. 3; Supplementary Tables 7, 9, and 11; and Supplementary Notes 1-7).
We fabricated and characterized samples made from two types of yarn, an acrylic yarn (Fig. 2) and a pearlized-cotton (Supplementary Fig. 2), which have different mechanical properties (see Methods).
With the fabric under fixed uniaxial loading, we measured the bulk fabric deformation using computer visionErshov2022 ; Schindelin2012 (see Methods and Supplementary Fig. 1).
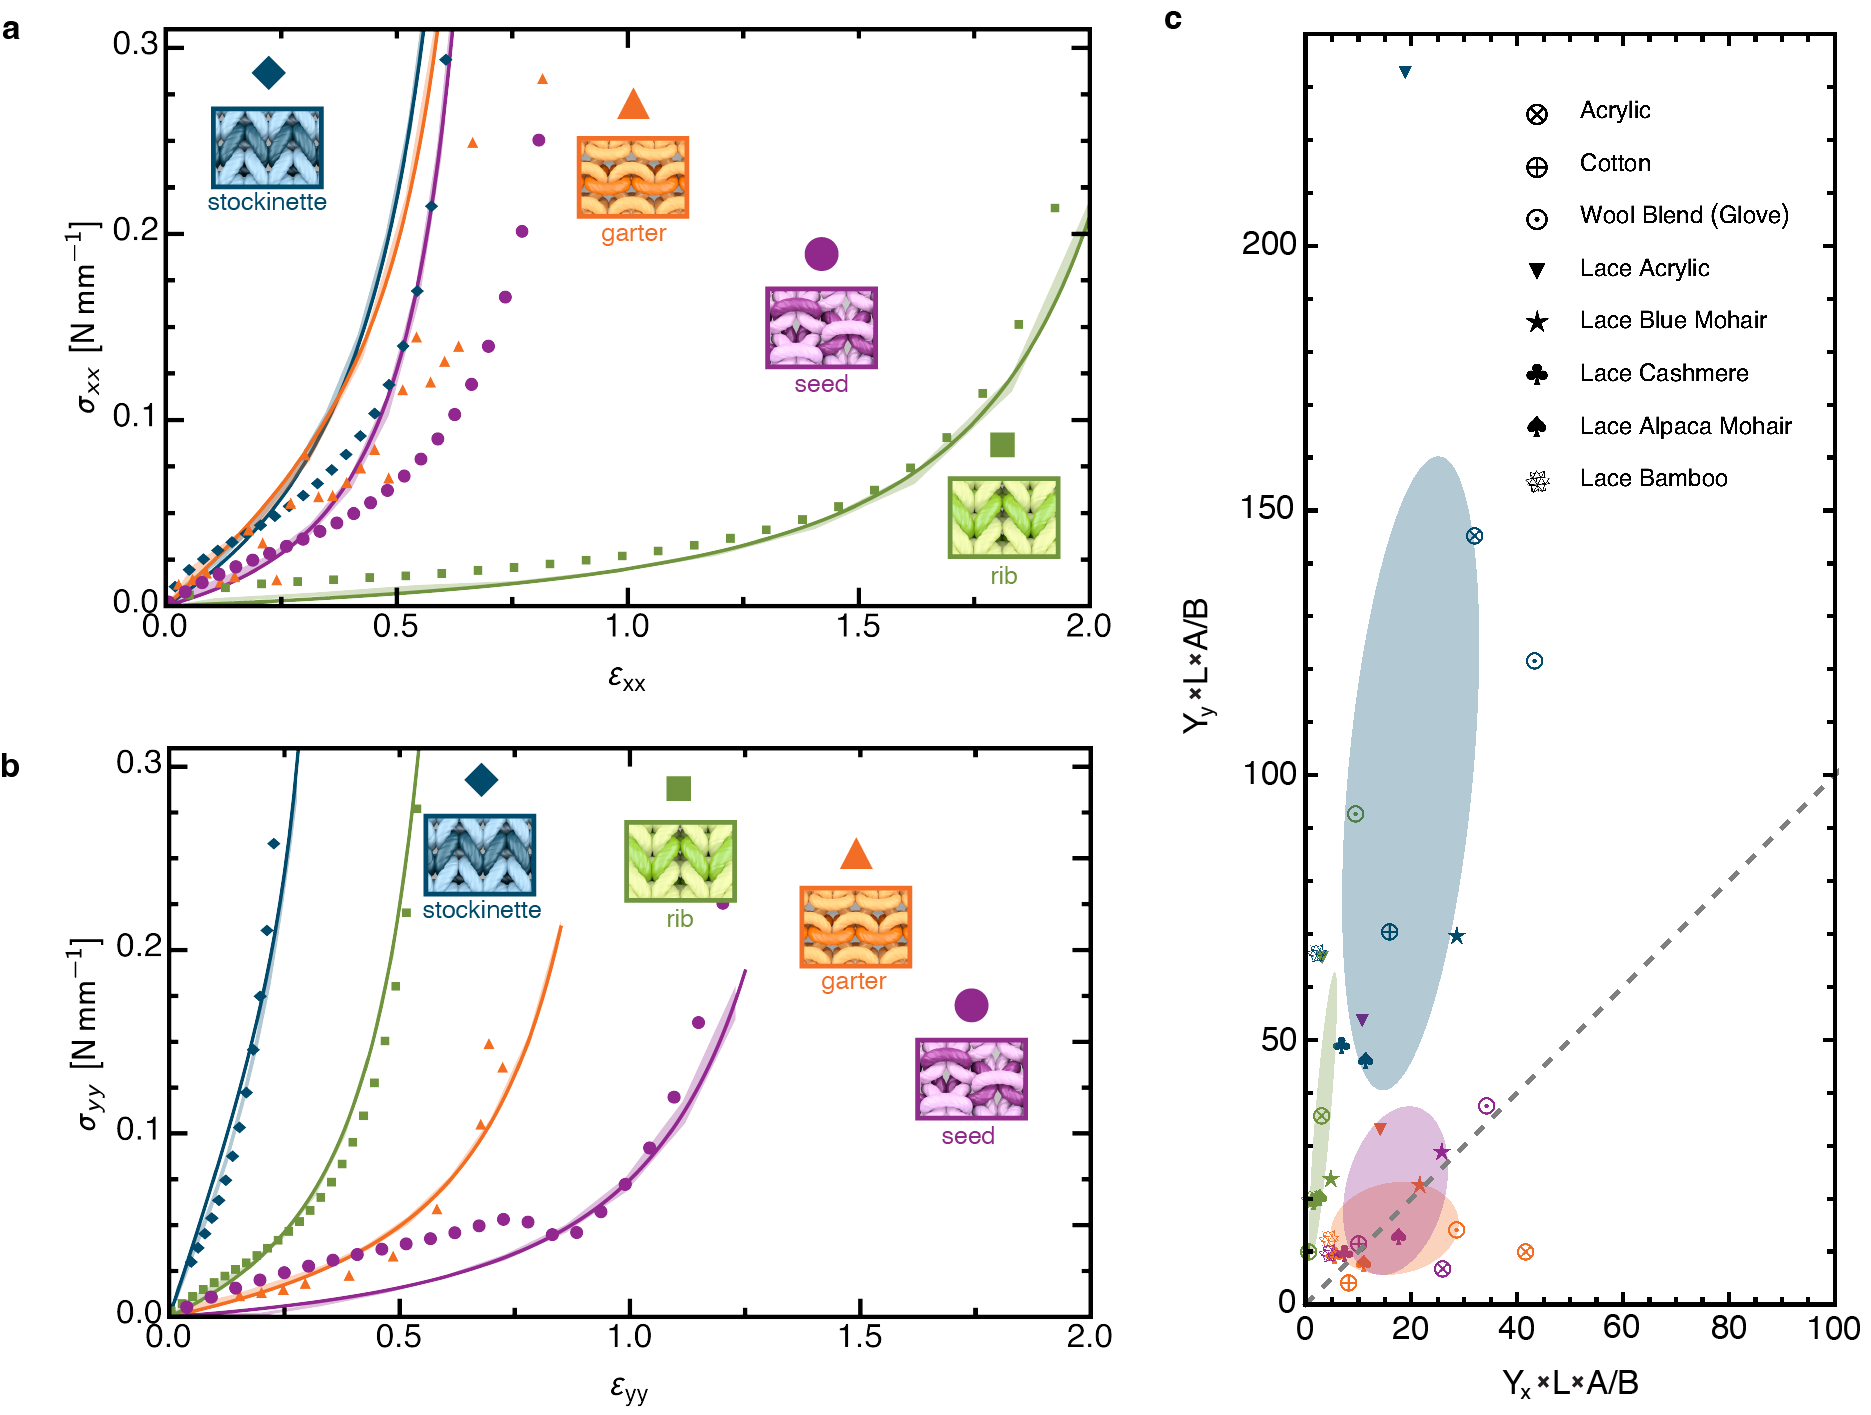
The maximal longitudinal components of the average stress versus strain measurements are shown in Fig. 2, where the - and -directions are along the rows and columns of the fabric (Fig. 1d).
Supplementary Fig. 2: Experimental and simulated results of uniaxial stretching.
The stress-versus-strain relations for the four fabrics made from the acrylic yarn in the (a) - and (b) -directions.
All of the data for each type of fabric is displayed by a different color: stockinette in blue, garter in orange, rib in green, and seed in purple.
The experimental data is shown in the translucent regions where the width of the region is one standard deviation of the four experiment runs.
The simulation data is shown with solid symbols.
The solid curves are fits to the constitutive relations.
This is a system where the linear response for each fabric is significantly different despite only small differences in the stitch configuration, whereas the nonlinear parts are quite similar.
Experiments applying force in the -direction show the extreme extensibility of the rib pattern compared with the other three.
Garter and seed dominate in the -direction.
Note, the experimental measurements for seed fabric differ from that of simulations due to a compression-related buckling instability in the computation, investigated in Supplementary Note 4 and Supplementary Fig. 8. (c) Normalized rigidity plot of all fabric samples, where is the Young’s modulus in the th direction in N/mm (Supplementary Tables 10, 12, 14, and 20), is the length of yarn per stitch in mm (Supplementary Tables 2, 3, and 6), is the area of one stitch in mm2 (Supplementary Tables 5 and 6), and is the bending modulus in N mm2 (Supplementary Table 1). The colored ellipses represent one standard deviation for each of the four fabric types and are oriented along the principal axes. The gray dashed line represents an isotropic mechanical response. The same analysis was conducted on the un-normalized rigidities, shown in Supplementary Fig. 11.
Under small stresses, the responses of all the fabrics are linear, and the Young’s moduli are given by the slopes of the stress-vs-strain curves (Fig. 2, Supplementary Tables 10 and 12).
Under high stresses, their responses become nonlinear, displaying strain-stiffening behavior as the yarn within the stitch becomes taut.
Of the four fabrics, rib is by far the softest in the -direction while stockinette is the stiffest (Fig. 2a).
Similarly, the garter and seed fabrics are softer in the -direction (Fig. 2b).
In Figure 2c, we have plotted the normalized Young’s modulus in the -direction by the normalized Young’s modulus in the -direction for samples made from eight different types of yarn of varying sizes and constituent fibers.
The clusters of data confirm that the relative anisotropy is fairly consistent across each type of fabric, regardless of the constituent fiber (Supplementary Fig. 11).
Numerical Model
Simulations help us unravel the effect that stitch topology and microstructure have on the macroscopic elasticity of the fabric.
Stitch-level simulations (also known as loop modeling) have been of interest to a variety of fields, including textile engineering and metamaterials.
Current simulations typically have at least one of three primary limiting constraints: they do not consider compressible yarn abghary1026 ; Poincloux2018PRX ; Duhovic2006 , they only consider one fabric typeDuhovic2006 ; Abel2012 ; abghary1026 ; htoo_3-dimension_2017 ; Poincloux2018PRX , or they only compare simulation to experimental results for visual fidelity and not mechanical responsekaldor8 ; ru_modeling_2023 .
Our simulation method considers all three of these factors to investigate the role of stitch topology on the mechanical behavior of knit fabrics.
Yarn is an inherently hierarchical material with short staple fibers spun into indefinitely long yarn.
To model the complex mechanics of yarn, we use yarn characterization experiments to measure the dominant energetic contributions: bending and compression (Supplementary Notes 2 and 3, Supplementary Tables 1 and 4).
The torsional rigidity of a balanced, spun yarn is comparatively negligible, and the stretching energy is so large that we consider the yarn to be inextensible.
We simulate the yarn as a space curve subject to a bending energy that is quadratic in the curvature, , where is the arclength parameter, is the unit tangent vector of the curve at each point, and the yarn parameters (the yarn length per stitch , also known as loop length, and the bending modulus ) are measured experimentally (see Methods; Supplementary Note 2; Supplementary Fig. 4; Supplementary Fig. 9; and Supplementary Tables 1, 2, and 3).
To capture yarn-yarn interactions, we use an elastic core-shell model informed by experiments (see Methods, Supplementary Fig. 5, and Supplementary Note 3). This also prevents yarn segments from passing through one another.
By implementing a minimal model in simulations, we can determine the key ingredients that contribute to the different mechanical behavior of different fabric types so that our results can be efficiently utilized in the fields of mechanical metamaterials and extreme mechanics.
The periodic nature of knitted textiles enables us to reduce the system to a closed segment of yarn in a box with boundaries identified (Supplementary Fig. 6).
We numerically minimize the total yarn energy, while varying simulation box dimensions (see Methods and Supplementary Note 4).
Through our model, we effectively capture not only the geometry of knitted fabrics (Fig. 1d-g) Choi2006 ; Knittel2020 ; Wadekar2020 but the emergent elastic response as well (Fig. 2).
The simulations reproduce the key features of the experiments: (i) the differences between the extensional rigidities of each fabric resulting from their unique topologies in the low-tension regime and (ii) the divergent strain-stiffening behavior corresponding to the maximum extensibility of each stitch in the high-tension regime.
The simulations enable us to disentangle the ways in which contact energy and bending energy individually contribute to the local deformations of the yarn.
In the low stress regime, bending energy is the dominant contributor to elastic response.
In the high stress regime, compression energy shows a marked increase, as shown in Supplementary Fig. 7 and Supplementary Table 8.
Microstructure and Modulus
Knit stitches and purl stitches have fundamentally the same mechanical behavior.
However, if we encode them – like binary bits – into a full textile, we see additional emergent behavior.
In this way, we can view knit fabrics as a composite where each stitch has a fundamental elasticity and the yarn that connects each pair of stitches modifies the behavior based on its local symmetry.
When two knit or two purl stitches are next to each other, they are joined by a connecting yarn segment which has even symmetry (Fig. 3a).
When a knit stitch is joined to a purl stitch, however, the connecting yarn segment has odd symmetry (Fig. 3b).
In the linear regime, the even and odd segments act as springs with different stiffnesses, as diagrammed in Supplementary Fig. 10c-f.
We approximate the effective stiffness of the connecting yarn segments by taking its shape (from a fabric that has no forced applied to it) and calculate the work required to deform it infinitesimally (Supplementary Note 8, Supplementary Tables 15 and 16).
When we do this to linear order, we find that the symmetric region has a stiffness that approximately scales as , where is the length of the segment (shown in Supplementary Fig. 10a,b) and is a geometry-dependent factor.
The odd connecting yarn segment effectively acts as a moment arm where the two neighboring stitches apply a torque that causes it to rotate.
To linear order, the stiffness is approximately .
Therefore, odd connecting yarn segments can be of order ten times softer compared to even connecting yarn segments (see Supplementary Note 8).
It is consequently harder to extend fabrics with identical neighboring stitches (K-K or P-P) than alternating neighboring stitches (K-P).
This explains the relative stiffness of stockinette fabric, consisting only of even connecting yarn segments (Fig. 3c,g), compared with seed fabric, consisting only of odd connecting yarn segments (Fig. 3f,j).
Garter (Fig. 3d,h) and rib (Fig. 3e,i) fabrics each contain a mixture of segments but are much easier to stretch along the directions containing odd connecting yarn segments.
A pair of similar stitches (K-K or P-P) joined in the -direction are in general stiffer than a pair of equivalent stitches joined in the -direction because the -direction has two connecting yarn segments in parallel between every pair of stitches (Supplementary Fig. 10c-f).
Supplementary Fig. 3: Symmetry in the yarn segments between stitches.
Two similar stitches (K-K or P-P) are joined by a yarn segment with even symmetry, highlighted in pink (a top). Extensional deformations cause curvature deformations of the yarn segment (a bottom). Alternating stitches (K-P) are joined by a yarn segment with odd symmetry, highlighted in cyan (b top). These segments are able to rotate to accommodate extensional deformation (b bottom).
Symmetries of stitches are shown in the -direction (c-f) and the -direction (g-j).
(c,g) Stockinette fabric has only even connecting yarn segments in both - (c) and -directions (g).
(d,h) Garter fabric has even connecting yarn segments in -direction (d) and odd connecting yarn segments in the -direction (h).
(e,i) Rib fabric has odd connecting yarn segments in the -direction (e) and even connecting yarn segments in the -direction (i).
(f,j) Since seed fabric is based on a checkerboard pattern, it only has odd connecting yarn segments.
The renderings in (a-j) are repeated unit cells of sample stitch-level simulation outputs.
A comparison of Young’s moduli measured in experimental samples with those computed in the reduced-symmetry (RS) model (Supplementary Tables 17 and 18) is shown in (k).
Dark and light symbols indicate extensional rigidity in the -direction and -direction, respectively, filled symbols indicate acrylic yarn, and open symbols indicate cotton yarn. This demonstrates that our simple composite model has both qualitative and quantitative agreement with our experimental measurements.
Using the “rule of mixtures” from the theory of fiber composites Hill1964 , we build an effective elastic model for fabrics consisting of knit or purl stitches alternating with connecting yarn segments of the appropriate symmetry.
We call this the Reduced Symmetry (RS) model.
In the low stress regime, we are treating the fabrics as a composite of geometries, rather than a composite of materials.
This allows for a direct estimate of the linear elastic rigidity using yarn geometry informed by simulations and bending modulus alone.
To establish the dependence of the fabrics’ anisotropic elastic response on stitch symmetry, we compare RS model estimates (using geometric parameters shown in Supplementary Tables 8 and 9) of the Young’s moduli to those measured in experiments while varying stitch pattern, direction of extension, and type of yarn (Fig. 3k) (Supplementary Note 8).
Young’s moduli estimated from our RS model closely agree with those measured in experiments, yet are systematically slightly stiffer.
In the high-tension limit, all yarn segments between neighboring entangled regions straighten along their mid-lengths and are forced to curve sharply as they enter the entangled regions due to contact confinement.
This localization of curvature to entangled regions under increasing stress represents a transition from the low-stress, linear elasticity dictated by stitch topology, , to high-stress, strain-stiffening elasticity, , where is a Young’s modulus and and are parameters characterizing the non-linear response. Each of these three parameters depend on the direction of extension.
With this reasoning, we arrive at a stress-strain constitutive relationship (Supplementary Note 6).
Figs. 2a,b and Supplementary Figures 2 and 12 show self-consistent fits of this model to our data. This model is able to describe all knitted fabrics made from inextensible spun fibers (Supplementary Tables 9, 11, 13, and 19).
This form of constitutive model resembles the force-extension relationship for stiff, DNA-like polymers Marko1995 as well as amorphous fiber networks Broedersz2011 .
Applications
While our measurements and models capture the bulk constitutive properties of knitted fabric, the presence of boundaries can give rise to significant inhomogeneous response.
The bulk constitutive model can nonetheless well-approximate the full deformation of a finite swatch of knitted fabric, as illustrated in Fig. 4a,b, where we compare the -component of the displacement field of a sample of garter fabric stretched in the -direction (measured using digital image correlation, DIC) against a finite element analysis (FEA) that applies our constitutive model to a two-dimensional sheet with more realistic boundary conditions without directly considering the local microstructure (Supplementary Note 9). We used garter experiments to directly obtain fits to our constitutive model for use in the FEA, without homogenizing the yarn level simulations liu_multiscale_2019 ; sperl_estimation_2022 .
Notably, our constitutive model – derived from microscopic fabric properties – accurately captures the non-affine deformation of the fabric near its corners (where the principal stretch directions are no longer purely along the - and -axes) and reproduces the shape of the free boundary.
Emergent elasticity sets knitting apart from other additive manufacturing techniques, because merely dictating the local topology by interchanging knits and purls (not changing the constituent yarn) programs the fabric’s local elastic response.
We can take advantage of the local anisotropic response of each different type of fabric by combining them into a seamless garment, in this example a prototype for a therapeutic glove (Supplementary Note 10 and Supplementary Fig. 13).
The goal of our prototype is to direct the stiff elastic response to support the wrist joint in cases of repetitive stress injury, while enabling natural motion for the rest of the hand (Fig. 4c-e).
In Fig. 4d, the local extensibility field is represented with rectangles oriented along the principal directions with side lengths given by the extensibility in the -direction, , and -direction, (see Methods, Supplementary Fig. 12, and Supplementary Tables 19 and 20). This shows that the stiffest region (stockinette fabric in dark blue) is designed to support the radiocarpal joints and to help keep the carpal and metacarpal bones aligned. Isotropic material (seed fabric in pink) still allows the carpometacarpal joint connecting the thumb to the wrist to move freely. Rib (green) and garter (orange) fabrics enable the fingers to extend and contract for natural motion (Fig. 4e and Supplementary Video 1). Importantly, knitted textiles can easily be crafted to fit any anatomy.
Supplementary Fig. 4: The anisotropic and nonaffine global response of knitted textiles and an application of them.
(a,b) Large applied stresses result in nonaffine deformations to a knitted fabric. (a) The -component of the displacement field (), obtained from DIC measurements, is shown overlaid on an image of garter fabric.
The color represents the magnitude of , in units of fabric width .
(b) Finite element analysis (FEA) of our constitutive model reproduce the (left) displacement field seen in experiments and (right) the crosses show the principal directions and magnitudes of the local strain tensor. The values of local principal strains (scale bars in orange for and blue for ) show the degree of local extension and transverse compression.
(c) Therapeutic glove prototype uses all four types of fabrics to generate anisotropic elastic response to motion of the hand. (d) The extensibility field of each type of fabric, shown as an overlay of rectangles, are oriented along the principal stiffness directions. The edge lengths are given by and respectively. (e) The stiffest stitch pattern, stockinette (blue), supports the wrist joint, while the isotropic seed (pink) grants mobility to the thumb. Highly anisotropic rib (green) and garter (orange) enable the wrist and fingers to flex along their easy direction.
Discussion
We present a picture of knitted fabric mechanics that is based on a micromechanical model of yarn.
Drawing from composite theory, we have developed a mesoscale model for the relationship between bulk elastic response and local topology, entanglement, and symmetry.
Our experiments and simulations demonstrate that changing the topology of stitches in a knitted fabric leads to remarkably different elastic responses, as seen in four standard types of knitted fabric.
The stitch micromechanics forms the basis of a nonlinear constitutive relation that models the behavior of textiles as 2D continuous materials.
The non-affine deformation of fabrics measured using digital image correlation (Fig. 4a) matches qualitatively and quantitatively with finite element simulations using our constitutive model (Fig. 4b) (see Methods and Supplementary Note 9).
Our long-term goal is to automate textile metamaterial production via a pipeline that takes desired mechanical performance and, using a computational model, generates a textile with compatible local properties.
This work can advance creation of non-proprietary software for designing fabric, as well as using mechanics to inform design, enabling textile engineers to tailor bespoke materials for a wide range of applications from performance sportswear Chen2021 ; Kanakaraj2015 to biomedical devices Zeng2014 .
With new developments in cost-effective methods to automate Narayanan2018 ; Kaspar2019 and program Hofmann2019 industrial knitting machines, we can build towards an open-source computational design platform that combines aspects of aesthetic, functional, and mechanical design.
Acknowledgments
We thank Ali Dahaj, Daria Atkinson, James McCord, Michael Czajkowski, Paul Loveman, Peter Yunker, Robin Selinger, and Timothy Atherton for useful conversations. Funding: KS was supported in part by the Research Corporation for the Advancement of Science Cottrell Scholar Award. MSD, SG and EAM were supported by National Science Foundation Grant No. DMR-1847172. This work was supported in part by the National Science Foundation Grant No. DMS-1439786 and the Alfred P. Sloan Foundation award G-2019-11406 while the authors were in residence attending ICERM’s Illustrating Mathematics program.
Author contributions statement
EAM designed the study, KS performed the uniaxial stretching and yarn compression experiments, KS and APC performed bending modulus experiments, KS, SQ, MSD, and SEG analyzed the data, MSD and SEG performed the simulations, and KS, MSD, SEG, and EAM wrote the manuscript.
Additional information
Data and materials availability: Will be made available. Competing interests: The authors declare no competing interests.
References
(1)
Warren, P. B., Ball, R. C. &
Goldstein, R. E.
Why clothes don’t fall apart:
Tension transmission in staple yarns.
Phys. Rev. Lett.120, 158001,
DOI: 10.1103/PhysRevLett.120.158001 (2018).
(2)
Narayanan, V., Albaugh, L.,
Hodgins, J., Coros, S. &
Mccann, J.
Automatic machine knitting of 3d
meshes.
ACM Trans. Graph.37, DOI: 10.1145/3186265
(2018).
(3)
Bertoldi, K., Vitelli, V.,
Christensen, J. & van Hecke, M.
Flexible mechanical
metamaterials.
Nature Reviews Materials2, 17066,
DOI: 10.1038/natrevmats.2017.66 (2017).
(4)
Abel, J., Luntz, J. &
Brei, D.
A two-dimensional analytical model
and experimental validation of garter stitch knitted shape memory alloy
actuator architecture.
Smart Materials and Structures21, 085011,
DOI: 10.1088/0964-1726/21/8/085011 (2012).
(5)
Albaugh, L., Hudson, S. &
Yao, L.
Digital fabrication of soft
actuated objects by machine knitting.
Proceedings of the 2019 CHI Conference on Human
Factors in Computing Systems 1–13,
DOI: 10.1145/3290605.3300414 (2019).
(6)
Sanchez, V., Walsh, C. J. &
Wood, R. J.
Soft robotics: Textile technology
for soft robotic and autonomous garments.
Advanced Functional Materials31, 2170041,
DOI: https://doi.org/10.1002/adfm.202170041
(2021).
(7)
Zeng, W. et al.Fiber-based wearable electronics: A
review of materials, fabrication, devices, and applications.
Advanced Materials26, 5310–5336,
DOI: 10.1002/adma.201400633 (2014).
(8)
Cherenack, K. & van Pieterson, L.
Smart textiles: Challenges and
opportunities.
Journal of Applied Physics112, 091301,
DOI: 10.1063/1.4742728 (2012).
(9)
Magnan, L. et al.Human textiles: A cell-synthesized
yarn as a truly “bio” material for tissue engineering applications.
Acta Biomaterialia105, 111 – 120,
DOI: https://doi.org/10.1016/j.actbio.2020.01.037
(2020).
(10)
Ramsgaard Thomsen, M. et al.Knit as bespoke material practice for architecture.
In Proceedings of the 36th Annual
Conference of the Association for Computer Aided Design in Architecture
(ACADIA), 280–289 (ACADIA,
2016).
Acadia 2016 ; Conference date: 27-10-2016 Through
29-10-2016.
(11)
Scott, J.
Responsive Knit: the evolution of a programmable
material system.
In Storni, C. et al. (eds.)
Design as a catalyst for change - DRS International
Conference 2018, DOI: 10.21606/drs.2018.566
(2018).
(12)
Freeman, J. W.
Tissue Engineering Options for
Ligament Healing.
Bone and Tissue Regeneration Insights2, BTRI.S2826,
DOI: 10.4137/BTRI.S2826 (2009).
(13)
Goyal, D., Yadav, S. &
Jvs, V.
Clinical experience with woven and
parallel hamstring-tendon anterior cruciate ligament reconstruction.
Knee Surgery & Related Research31, 4,
DOI: 10.1186/s43019-019-0002-6 (2019).
(14)
Mikołajczyk, Z. & Walkowska, A.
Design methodology of the strength
properties of medical knitted meshes.
IOP Conference Series: Materials Science and
Engineering141, 012012,
DOI: 10.1088/1757-899x/141/1/012012 (2016).
(15)
Yu, S., Ma, P., Cong, H.
& Jiang, G.
Preparation and performances of
warp-knitted hernia repair mesh fabricated with chitosan fiber.
Polymers11,
DOI: 10.3390/polym11040595 (2019).
(16)
Liu, P., Chen, N., Jiang,
J. & Wen, X.
New surgical meshes with patterned
nanofiber mats.
RSC Adv.9,
17679–17690, DOI: 10.1039/C9RA01917K
(2019).
(17)
Yu, S., Ma, P., Cong, H.
& Jiang, G.
Preparation and performances of
warp-knitted hernia repair mesh fabricated with chitosan fiber.
Polymers11,
DOI: 10.3390/polym11040595 (2019).
(18)
Mattmann, C., Clemens, F. &
Tröster, G.
Sensor for Measuring Strain in
Textile.
Sensors8,
3719–3732, DOI: 10.3390/s8063719
(2008).
(19)
Seyedin, S. et al.Textile strain sensors: a review of
the fabrication technologies, performance evaluation and applications.
Materials Horizons6, 219–249,
DOI: 10.1039/C8MH01062E (2019).
(20)
Vu, C. C. & Kim, J.
Highly elastic capacitive pressure
sensor based on smart textiles for full-range human motion monitoring.
Sensors and Actuators A: Physical314, 112029,
DOI: 10.1016/j.sna.2020.112029 (2020).
(21)
Yan, W. et al.Single fibre enables acoustic
fabrics via nanometre-scale vibrations.
Nature603,
616–623, DOI: 10.1038/s41586-022-04476-9
(2022).
(22)
McDonald, D. Q., Vallett, R.,
Solovey, E., Dion, G. &
Shokoufandeh, A.
Knitted sensors: Designs and novel
approaches for real-time, real-world sensing.
4, 1–25,
DOI: 10.1145/3432201.
(23)
Fan, W. et al.Machine-knitted washable sensor
array textile for precise epidermal physiological signal monitoring.
Science Advances6, eaay2840,
DOI: 10.1126/sciadv.aay2840 (2020).
(24)
Tian, X. et al.Wireless body sensor networks based
on metamaterial textiles.
Nature Electronics2, 243–251,
DOI: 10.1038/s41928-019-0257-7 (2019).
(25)
Chen, G., Fang, Y., Zhao,
X., Tat, T. & Chen, J.
Textiles for learning tactile
interactions.
Nature Electronics4, 175–176,
DOI: 10.1038/s41928-021-00560-6 (2021).
(26)
Scott, J.
Hierarchy in knitted forms: Environmentally
responsive textiles for architecture.
In ACADIA 2013: Adaptive Architecture
(2013).
(27)
Abel, J., Luntz, J. &
Brei, D.
Hierarchical architecture of active
knits.
Smart Materials and Structures22, 125001,
DOI: 10.1088/0964-1726/22/12/125001 (2013).
(29)
Rivera, M. L., Forman, J.,
Hudson, S. E. & Yao, L.
Hydrogel-Textile Composites: Actuators for
Shape-Changing Interfaces.
In Extended Abstracts of the 2020 CHI
Conference on Human Factors in Computing Systems,
1–9, DOI: 10.1145/3334480.3382788
(ACM, Honolulu HI USA,
2020).
(30)
Wang, J. et al.Sustainably powering wearable
electronics solely by biomechanical energy.
Nature Communications7, 12744,
DOI: 10.1038/ncomms12744 (2016).
(31)
Kwak, S. S. et al.Fully Stretchable Textile
Triboelectric Nanogenerator with Knitted Fabric Structures.
ACS Nano11,
10733–10741, DOI: 10.1021/acsnano.7b05203
(2017).
(32)
Choi, A. Y., Lee, C. J.,
Park, J., Kim, D. &
Kim, Y. T.
Corrugated Textile based
Triboelectric Generator for Wearable Energy Harvesting.
Scientific Reports7, 45583,
DOI: 10.1038/srep45583 (2017).
(33)
Bao, L. & Li, X.
Towards Textile Energy
Storage from Cotton T-Shirts.
Advanced Materials24, 3246–3252,
DOI: 10.1002/adma.201200246 (2012).
(34)
Jost, K. et al.Knitted and screen printed
carbon-fiber supercapacitors for applications in wearable electronics.
Energy & Environmental Science6, 2698,
DOI: 10.1039/c3ee40515j (2013).
(35)
Suresh, S.
Graded materials for resistance to
contact deformation and damage.
Science292,
2447–2451, DOI: 10.1126/science.1059716
(2001).
(36)
Goodrich, C. P. & Brenner, M. P.
Using active colloids as machines
to weave and braid on the micrometer scale.
Proceedings of the National Academy of
Sciences114, 257–262,
DOI: 10.1073/pnas.1608838114 (2017).
(37)
Kaldor, J. M., James, D. L. &
Marschner, S.
Simulating knitted cloth at the yarn level.
In ACM SIGGRAPH 2008 Papers, SIGGRAPH
’08, DOI: 10.1145/1399504.1360664 (Association
for Computing Machinery, New York, NY, USA,
2008).
(38)
Kaldor, J. M., James, D. L. &
Marschner, S.
Efficient yarn-based cloth with
adaptive contact linearization.
29, 1–10,
DOI: 10.1145/1778765.1778842.
(39)
Cirio, G., Lopez-Moreno, J. &
Otaduy, M. A.
Yarn-level cloth simulation with
sliding persistent contacts.
23, 1152–1162,
DOI: 10.1109/TVCG.2016.2592908.
(40)
Sperl, G., Sánchez-Banderas, R. M.,
Li, M., Wojtan, C. &
Otaduy, M. A.
Estimation of yarn-level simulation
models for production fabrics.
41, 1–15,
DOI: 10.1145/3528223.3530167.
(41)
Liu, Z. et al.Knitting 4d garments with
elasticity controlled for body motion.
40, 1–16,
DOI: 10.1145/3450626.3459868.
(42)
Tekerek, E. et al.Experimental investigation of the
multiscale mechanical behavior of knitted textiles.
Material Design & Processing Communications2, DOI: 10.1002/mdp2.106
(2020).
(43)
Choi, K. F. & Lo, T. Y.
The shape and dimensions of plain
knitted fabric: A fabric mechanical model.
Textile Research Journal76, 777–786,
DOI: 10.1177/0040517507069030 (2006).
(44)
Postle, R.
Structural mechanics of knitted
fabrics for apparel and composite materials.
International Journal of Clothing Science and
Technology14, 257–268,
DOI: 10.1108/09556220210437239 (2002).
(45)
Poincloux, S., Adda-Bedia, M. &
Lechenault, F.
Geometry and elasticity of a
knitted fabric.
Phys. Rev. X8,
021075, DOI: 10.1103/PhysRevX.8.021075
(2018).
(46)
Global Textile Market Size & Share Report,
2022-2030.
(47)
Abafe, O. A., Harrad, S. &
Abdallah, M. A.-E.
Novel insights into the dermal
bioaccessibility and human exposure to brominated flame retardant additives
in microplastics.
Environmental Science & Technology57, 10554–10562,
DOI: 10.1021/acs.est.3c01894 (2023).
(48)
Image of “SPONGY-28 Top” (manufactured by Issey
Miyake™).
(49)
Markande, S. G. & Matsumoto, E.
Knotty knits are tangles in tori.
Proceedings of Bridges 2020: Mathematics, Art,
Music, Architecture, Education, Culture 103–112
(2020).
(50)
Grishanov, S., Meshkov, V. &
Omelchenko, A.
A topological study of textile
structures. part i: An introduction to topological methods.
Textile Research Journal79, 702–713,
DOI: 10.1177/0040517508095600 (2009).
(51)
Patil, V. P., Sandt, J. D.,
Kolle, M. & Dunkel, J.
Topological mechanics of knots and
tangles.
Science367,
71–75, DOI: 10.1126/science.aaz0135
(2020).
(52)
Quaglini, V., Corazza, C. &
Poggi, C.
Experimental characterization of
orthotropic technical textiles under uniaxial and biaxial loading.
Composites Part A: Applied Science and
Manufacturing39, 1331–1342,
DOI: 10.1016/j.compositesa.2007.07.008 (2008).
(53)
Ershov, D. et al.Trackmate 7: integrating
state-of-the-art segmentation algorithms into tracking pipelines.
Nature Methods19,
829–832, DOI: 10.1038/s41592-022-01507-1
(2022).
(54)
Schindelin, J. et al.Fiji: an open-source platform for
biological-image analysis.
Nature Methods9,
676–682, DOI: 10.1038/nmeth.2019
(2012).
(55)
Abghary, M. J., Hasani, H. &
Nedoushan, R. J.
Numerical simulating the tensile
behavior of 1×1 rib knitted fabrics using a novel geometrical model.
Fibers and Polymers17, 795–800
(2016).
Copyright - The Korean Fiber Society and Springer
Science+Business Media Dordrecht 2016; Last updated - 2023-07-18.
(56)
Duhovic, M. & Bhattacharyya, D.
Simulating the deformation
mechanisms of knitted fabric composites.
Composites Part A: Applied Science and
Manufacturing37, 1897–1915,
DOI: 10.1016/j.compositesa.2005.12.029 (2006).
(57)
Htoo, N. N., Soga, A.,
Wakako, L., Ohta, K. &
Kinari, T.
3-dimension simulation for loop
structure of WeftKnitted fabric considering mechanical properties of
yarn.
73, 105–113,
DOI: 10.2115/fiberst.2017-0015.
(58)
Ru, X., Wang, J. C., Peng,
L., Shi, W. & Hu, X.
Modeling and deformation simulation
of weft knitted fabric at yarn level.
93, 2437–2448,
DOI: 10.1177/00405175221134934.
_eprint: https://doi.org/10.1177/00405175221134934.
(59)
Knittel, C. E. et al.Modelling textile structures using
bicontinuous surfaces.
Journal of Mathematics and the Arts14, 331–344,
DOI: 10.1080/17513472.2020.1787936 (2020).
(60)
Wadekar, P. et al.Geometric modeling of knitted
fabrics using helicoid scaffolds.
Journal of Engineered Fibers and Fabrics15, 1558925020913871,
DOI: 10.1177/1558925020913871 (2020).
(61)
Hill, R.
Theory of mechanical properties of
fibre-strengthened materials: I. elastic behaviour.
Journal of the Mechanics and Physics of
Solids12, 199–212,
DOI: https://doi.org/10.1016/0022-5096(64)90019-5
(1964).
(62)
Marko, J. F. & Siggia, E. D.
Stretching DNA.
Macromolecules28,
8759–8770, DOI: 10.1021/ma00130a008
(1995).
(63)
Broedersz, C. P., Mao, X.,
Lubensky, T. C. & MacKintosh, F. C.
Criticality and isostaticity in
fibre networks.
Nature Physics7,
983–988, DOI: 10.1038/nphys2127
(2011).
(64)
Liu, D., Koric, S. &
Kontsos, A.
A Multiscale Homogenization
Approach for Architectured Knitted Textiles.
Journal of Applied Mechanics86, 111006,
DOI: 10.1115/1.4044014 (2019).
(65)
Kanakaraj, P. & Ramachandran, R.
Active knit fabrics-functional
needs of sportswear application.
JTATM9,
1–11 (2015).
(66)
Kaspar, A., Oh, T.-H.,
Makatura, L., Kellnhofer, P. &
Matusik, W.
Neural inverse knitting: From images to manufacturing
instructions.
In Chaudhuri, K. & Salakhutdinov,
R. (eds.) Proceedings of the 36th International
Conference on Machine Learning, vol. 97 of
Proceedings of Machine Learning Research,
3272–3281 (PMLR,
2019).
(67)
Hofmann, M. et al.Knitpicking textures: Programming and modifying
complex knitted textures for machine and hand knitting.
UIST ’19, 5–16,
DOI: 10.1145/3332165.3347886 (Association for
Computing Machinery, New York, NY, USA,
2019).
(68)
Landau, L. D., Lifshitz, E. M.,
Kosevich, A. M. & Pitaevskii, L. P.
Theory of Elasticity.
Course of theoretical physics
(Butterworth-Heinemann, 1986).
(69)
Cornelissen, B. & Akkerman, R.
Analysis of yarn bending
behaviour.
IEEE Transactions on Biomedical Engineering -
IEEE TRANS BIOMED ENG (2009).
(70)
Park, J.-W. & Oh, A.-G.
Bending Rigidity of Yarns.
Textile Research Journal76, 478–485,
DOI: 10.1177/0040517506063915 (2006).
(71)
Vassiliadis, S., Kallivretaki, A. &
Provatidis, C.
Mechanical simulation of the plain
weft knitted fabrics.
International Journal of Clothing Science and
Technology19, 109–130,
DOI: 10.1108/09556220710725711 (2007).
(72)
Liu, D. et al.On the role of material
architecture in the mechanical behavior of knitted textiles.
International Journal of Solids and
Structures109, 101–111,
DOI: https://doi.org/10.1016/j.ijsolstr.2017.01.011
(2017).
(73)
Liu, D., Shakibajahromi, B.,
Dion, G., Breen, D. &
Kontsos, A.
A Computational Approach to Model
Interfacial Effects on the Mechanical Behavior of Knitted Textiles.
Journal of Applied Mechanics85, DOI: 10.1115/1.4039046
(2018).
(74)
Postle, R. & Munden, D. L.
24—ANALYSIS OF THE
DRY-RELAXED KNITTED-LOOP CONFIGURATION: PART i:
TWO-DIMENSIONAL ANALYSIS.
58, 329–351,
DOI: 10.1080/00405006708629880.
(75)
Semnani, D., Latifi, M.,
Hamzeh, S. & Jeddi, A.
A new aspect of geometrical and
physical principles applicable to the estimation of textile structures: An
ideal model for the plain-knitted loop.
94, 202–211,
DOI: 10.1080/00405000308630609.
(76)
Ramgulam, R.
3 - modelling of knitting.
In Au, K. (ed.) Advances
in Knitting Technology, Woodhead Publishing Series in Textiles,
48–85,
DOI: https://doi.org/10.1533/9780857090621.1.48
(Woodhead Publishing, 2011).
(77)
Kyosev, Y. K.
6 - the finite element method (FEM) and its
application to textile technology.
In Veit, D. (ed.)
Simulation in Textile Technology, Woodhead
Publishing Series in Textiles, 172–222e,
DOI: https://doi.org/10.1533/9780857097088.172
(Woodhead Publishing).
(78)
Sha, S. et al.Review on the 3-d simulation for
weft knitted fabric.
Journal of Engineered Fibers and Fabrics16, 15589250211012527,
DOI: 10.1177/15589250211012527 (2021).
eprint https://doi.org/10.1177/15589250211012527.
(79)
Eck, M. & Lasser, D.
B-spline-bézier representation of
geometric spline curves: Quartics and quintics.
23, 23–39,
DOI: 10.1016/0898-1221(92)90066-Q.
(80)
DeBenedictis, A. & Atherton, T. J.
Shape minimisation problems in
liquid crystals.
Liquid Crystals43, 2352–2362,
DOI: 10.1080/02678292.2016.1209699 (2016).
(81)
Duhovic, M. & Bhattacharyya, D.
Simulating the deformation
mechanisms of knitted fabric composites.
37, 1897–1915,
DOI: 10.1016/j.compositesa.2005.12.029.
(82)
Pieranski, P., Strzelecki, L. &
Pansu, B.
Thin colloidal crystals.
50, 900–903,
DOI: 10.1103/PhysRevLett.50.900.
(83)
Sokolnikoff, I.
Mathematical theory of elasticity,
mcgraw-hill book company.
Inc., New York/London
(1956).
(84)
Sperl, G., Narain, R. &
Wojtan, C.
Homogenized yarn-level cloth.
ACM Trans. Graph.39, DOI: 10.1145/3386569.3392412
(2020).
(85)
Lim, C. S. & Davies, A. H.
Graduated compression stockings.
CMAJ186,
E391–E398, DOI: 10.1503/cmaj.131281
(2014).
eprint https://www.cmaj.ca/content/186/10/E391.full.pdf.
Methods
Materials and Fabrication
We performed experiments on eight types of yarn that are classified in three categories: (1) two are large-gauge yarns (9-12 wraps per inch, WPI), (2) five are fine-gauge yarn (30-40 WPI) , and (3) the yarn used for the therapeutic glove prototype (14-18 WPI) (see the Knitted Glove Prototype section).
We used Brava worsted yarn (28455-White) from KnitPicks™, which is 100% acrylic yarn, hereafter referred to as the “acrylic yarn” and 082L Pearl cotton 3/2 (color 1800-13 sapphire) from Halcyon Yarn™, which is 100% cotton yarn, hereafter referred to as the “cotton yarn.”
For each of the types of fabrics, we recorded the average yarn diameter within the fabric stitches as well as the average yarn lengths per stitch. Supplementary Tables 2 and 3 display the measurements for the acrylic and cotton yarn, respectively.
We measured the bending rigidity, an approximate interaction potential, and the stress versus strain relationship for both types of yarn. We perform four uniaxial experiment runs on the samples to obtain the stress versus strain relationship.
We used a Taitexma™ Industrial Knitting Machine to create four types of fabrics with both the acrylic and cotton yarn: stockinette, garter, rib, and seed. Each fabric sample consisted of 31 rows and columns and were made at equal tensions and stitch size settings on the machine (Supplementary Note 11).
For an accurate model development, we obtained finer details of the fabric stitches. We created smaller copies of the experimental samples. We used a caliper to measure the average diameter of the yarn in situ. We then dissected them to obtain average yarn lengths per stitch for the four types of fabric.
We additionally fabricated five sets of samples (where each set contained the four types of fabrics) made from different lace weight yarns. Of the five, three yarns were from ColourMart™: heavy lace weight alpaca mohair silk mokka 811 ecru, heavy lace weight kid mohair and silk special celeste, and 2/28NM lace weight cashmere 8l brume (beige) each referred to as “lace-weight alpaca mohair”, “lace-weight blue mohair”, and “lace-weight cashmere” respectively. The other two lace weights were Bambu 12 Gauge 100% Bamboo in the color 010 Rice from Silk City Fibers™, hereafter referred to as “lace-weight bamboo”, and Tamm Petit 2/30 T4201 White 100% acrylic yarn from The Knit Knack Shop™, hereafter referred to as “lace-weight acrylic.” These samples were fabricated on a STOLL CMS 530 HP Industrial Knitting Machine and each contained 32 rows and 32 columns. Stockinette and garter were made with a stitch size setting of 12 while rib and seed were made at size 11 (Supplementary Note 11 and Supplementary Fig. 14). All other machine parameters were kept the same. Each sample was fabricated twice with buffer regions either along its vertical or horizontal axis to aid with the uniaxial stretching experiments.
Similar to the acrylic and cotton yarns mentioned above, we measured the bending rigidity for each of these yarns and extract the stress versus strain relationship via uniaxial experiments. Five experiment runs were performed on each sample.
To obtain the length of yarn per stitch for the lace weight samples, each sample was weighed and, using the mass density for the yarn types, the average length of yarn per stitch was estimated.
Uniaxial Stretching Experiments
To perform the uniaxial stretching experiments, we designed a setup such that fabric samples had external forces uniformly applied to the boundary. We 3D printed clamps to use on both ends of the fabric samples and then had a dynamometer hooked on to one of the clamps that could be moved with a threaded rod. All components of the experiment were designed to move on guiding rails to keep everything level and prevent lateral and torsional motion. We designed the clamps with several teeth to effectively hold down both ends of the fabric sample and prevent slipping.
For each sample, we clamped the fabric on opposite ends. During the experiments, we positioned and leveled a camera above the sample. Colored pins were placed in the fabric and red points were painted on the clamps to aid with tracking during the analysis. The dynamometer was zeroed before the experiment and then incrementally moved by turning the threaded rod, applying the external force (or ) to the sample boundary until reaching its maximum force (30 N). Experiments were performed slowly, to approximate a quasistatic regime, stretching from a relaxed configuration to maximum extension over 1-3 minutes. An initialization is done for each sample where they are run through the entire experiment. This run is not included in the presented data as it is meant to break apart initial fiber connections and handling bias. Between subsequent experiment runs, the fabrics were reset to their initial resting length and briefly stretched in their transverse direction. We then waited five minutes before the next experiment run. We performed experiments along both axes of the fabrics (along its - and -direction).
We looked at the uniaxial response by tracking the length and waist dimensions as the external force is exerted on the boundary.
For the overall bulk response, we used Fiji (https://imagej.net/Fiji) image processing software with the TrackMate plugin to track the pins and clamps on each of the sample videos and analyzed the position change of the coordinates (see Supplementary Fig. 1).
The dynamometer reading was recorded using optical character recognition (OCR) on its seven segment display, ensuring stress and strain data were synchronized.
Raw experimental data for the experimental runs on the acrylic, cotton, and therapeutic glove fabric samples can be found in Supplementary Fig. 3.
For the uniaxial experiments on the lace weight samples and the therapeutic glove swatches, we use an Instron Universal Testing Machine (UTM) Model 68SC-1. We 3D printed unique clamps with teeth to fit into the machine grips and ensure no slip boundary conditions during testing. A camera is focused on the sample while stretching and two pins are placed along the transverse direction. The clamp separation is measured and the displacement is tracked by the Instron software. The samples are stretched at a rate of 0.5 mm/sec and the lace weights are stretched to 25 N while the glove samples are stretched to 30 N. The remaining experimental procedure and analysis is the same as detailed previously except that the force data was synced by matching time steps from the tracked transverse data (acquired with Fiji) and the force data (acquired with the UTM).
For one uniaxial experiment, we captured the nonaffine displacement fields throughout the entire sample under stress. We clamped the acrylic garter sample and dusted graphite powder to create a speckle pattern for tracking aid. The camera was again leveled above the sample but positioned closer to capture more detailed deformation. To analyze and track the displacement fields we use the 2D digital image correlation (DIC) MATLAB software, Ncorr (https://www.ncorr.com/).
Yarn bending modulus measurement
Yarn has a hierarchical filamentous structure with internal stresses and friction arising from the manufacturing process that complicates determining a bending modulus through cantilever experiments.
Since probe-based measurements, such as the three-point flexural test, inevitably lead to compression of the yarn’s cross-section, we find that cantilever experiments yield the most consistent results, using simple approximations to the yarn shape.
A schematic of the setup is shown in Supplementary Fig. 4.
Looking at four increments of yarn length ranging from 10 cm to 25 cm, we cut out five samples at each length and perform bending experiments on the yarn. For the lace weight yarns, the lengths cut were 6 cm, 9 cm, 10.5 cm, 12 cm, and 15 cm. Each sample is cut with an additional 10 cm of yarn that is adhered on a flat surface with double-sided tape. The yarn is hung off the edge of the platform and bends under its own weight due to gravity, adopting an approximately parabolic shape. A camera is positioned level to the setup and images the yarns’ behavior. We apply a blur and binarize filter to the images to isolate the yarn. Taking the points that compose the yarn shape, we fit a 4th degree polynomial to find the approximate centerline of the yarn (see Supplementary Note 2).
Yarn compressibility measurement
We used a Zwick/Roell Z010 Universal Testing Machine (UTM) to perform compression experiments on the yarn. Three yarn samples of length 20 mm (for the acrylic yarn) and 30 mm (for the cotton yarn) were compressed between a probe tip of 5 mm in diameter and a custom acrylic stage also 5 mm in diameter. The UTM probe tip was slowly lowered onto the yarn, resulting in quasistatic measurements of the restoring force as a function of probe height.
A schematic of the setup is shown in Supplementary Fig. 5.
Elastica-model simulations
To simulate the equilibrium configurations of knitted stitches, we modeled yarn as inextensible elastica with bending modulus and fixed total length per stitch.
Interactions between overlapping yarn were treated with a hard-core, soft-shell model with a functional form derived from experimental measurements.
Equilibrium configurations were determined by numerically minimizing the total yarn energy, given by the sum of the bending energy and the core-shell interaction energy , with a fixed total length constraint.
To perform this numerical minimization, we represented yarn configurations as degree-5 Bézier spline curves with degrees of freedom encoded by a collection of Bézier curve control points.
The resulting space curves are twice continuously differentiable with respect to its arclength parameter , and thus have continuous curvature.
For more details, see Supplementary Note 4.
Knitted Glove Prototype
To craft the knitted glove prototype, we used Rowan™ Baby Cashsoft Merino which is composed of 57% wool, 33% acrylic, and 10% cashmere. We used four different colors to knit the four types of fabric in the glove: blue for stockinette, orange for garter, green for rib, and pink for seed.
The fabric was knit by hand (see Supplementary Note 11) on US size 2 needles (2.75 mm in diameter) except for the stockinette regions which were knit on US size 0 needles (2 mm in diameter).
Miniature test swatches were made of each type of fabric to assist with glove design and to perform uniaxial stretching experiments on. A stockinette sample was knitted on US size 2 needles for comparison. Each sample underwent five experimental runs on the UTM. Each sample has 25 columns and 34 rows.
From the uniaxial stretching experiments, we extracted the average fabric response by expressing the applied force (or ) in terms of stress components (or ), where and are fabric widths measured at the clamped edges.
To obtain the average strain response of the fabric, we focused on the displacement of four points placed on the axes of symmetry of the fabric. Two points were marked with pins located on the transverse axis and the other two points were marked by painted dots on the clamps along the direction of stretching.
In the case where the fabric is stretched along the -direction, two red points painted on the clamps are aligned such that the line connecting them lies along the y-axis and has length .
The other two pins were positioned close to the waist of the fabric such that the line connecting them lies along the -axis and has length .
For the lace weight and the glove prototype samples, there are only two pins along the transverse axis. The clamp displacement is tracked via the UTM.
The principal components of the strain tensor are then and , where and are the respective pin separations of the un-stretched fabric (see Supplementary Fig. 5).
Figure Supplementary Fig. 6 shows the results of the stress-strain analysis for the cotton yarn.
Supplementary Fig. 5: (a) Top view of the experimental setup. During experiments we control displacement while measuring force. We perform uniaxial stress-strain experiments with forces applied along the rows (b) and columns (c). A rib fabric being stretched along its (b) - and (c) -directions. The four points we tracked to characterize the bulk response of the fabric are circled in red. The initial pin separation along the -axis is and along the -axis is . The values and are the widths of the fabric held down at the clamps. The lace weight and the therapeutic glove prototype samples underwent uniaxial stretching experiments on an Instron UTM. A bamboo garter sample stretched along its (c) - and (d) -axis. These tests only require two red pins to be tracked while the displacement between the clamps is tracked by the UTM software. Supplementary Fig. 6: The stress-versus-strain relations for the four fabrics made from the cotton yarn in the (a) - and (b) -directions.
All of the data for each type of fabric is displayed by a different color: stockinette in blue, garter in orange, rib in green, and seed in purple.
The experimental data is shown in the translucent regions where the width of the region is one standard deviation of the four experiment runs.
The simulation data is shown with solid symbols.
The solid curves are fits to the constitutive relations.
Dashed lines depict the linear response at zero stress.
Experiments applying force in the -direction show the extreme extensibility of the rib pattern compared with the other three.
Garter and seed dominate in the -direction.
Supplementary Fig. 7: The raw stress-versus-strain experimental data for the (a) acrylic, (b) cotton, and (c), therapeutic glove samples. All of the data for each type of fabric is displayed by a different color: stockinette in blue, garter in orange, rib in green, and seed in purple. For the therapeutic glove, there is an additional experimental data set shown in gray for a stockinette sample made with 2.75mm knitting needles.
SUPPLEMENTARY NOTE 2 Measuring the bending modulus
Supplementary Fig. 8: Depiction of the method used to determine yarn bending rigidity. The acrylic yarn bending procedure and results are shown in (a-d) while the cotton yarn in (e-h). (a,e) A segment of yarn is allowed to hang off of a table, with the left end held in place by double sided tape (not shown). The image of the hanging yarn’s shape is then binarized with a chosen cutoff intensity to yield the region shown in (b,f). The curvature near the taped end is found by fitting a quartic polynomial to the binarized image, with (c,g) showing a close-up view of the clamped end. (d,h) shows the mean and standard deviation of the measured bending modulus for yarn samples of lengths 10 mm - 25 mm.
The yarn of linear mass density and length is adhered to the edge of a flat surface at and and the free end is allowed to drape under gravity.
Equilibrium distributions of the internal moment and force are governed by the Kirchhoff rod equations LandauLifshitz1986 ,
where is the -component of the center of mass of the hanging yarn, recovering the basic result that the total gravitational torque applied to the yarn at the fixed boundary is simply the total gravitational force of the yarn, , times its lever arm .
Finally, assuming the linear constitutive relationship , we solve for the bending modulus of the yarn, viz.
(Supplementary Equation 4)
where is the curvature discontinuity of the yarn at the clamping point. We perform experiments on yarn samples of varying length (see Supplementary Fig. 8).
In order to extract the curvature discontinuity at the suspension point, we must determine the shape of the yarn in space. After an image is taken and cropped to the suspended yarn, the exposure is adjusted to maximize contrast between the yarn and the background.
We apply a blur and binarize filter to the yarn images and fit the white pixels in the domain to the 4th-order polynomial curve . This is reminiscent of how Cornelissen and Akkerman corn used a polynomial fit to study yarn deflection during cantilever experiments.
Images are blurred based on how many pixels out we can see stray fibers.
For yarns containing certain fibers, stray filaments will inhomogeneously extend many yarn-radii from the spun center of the yarn. For these exceptionally fuzzy yarn types (alpaca mohair and blue mohair), the blur required to erase stray fibers is so great that a reliable fit to the core of the yarn is not feasible. In these cases, a simple blur filter is not sufficient in isolating the core and, after adjusting the exposure, the outer halo of the yarn was manually painted out before filtering the image.
Using the polynomial fit, we extract the curvature discontinuity .
The -component of the center of mass, , is approximated by the average over all -coordinates of the binarized image of the yarn.
The results of these fits for all yarn types used in this study are reported in Supplementary Table 1.
Yarn Type
(mN mm2)
Acrylic Yarn
Cotton Yarn
Wool blend (glove)
Lace-Weight Alpaca Mohair
Lace-Weight Blue Mohair
Lace-Weight Cashmere
Lace-Weight Bamboo
Lace-Weight Acrylic
Supplementary Table 1: List of yarn bending moduli obtained from cantilever experiments for all yarns used in this study.
SUPPLEMENTARY NOTE 3 Measuring the yarn compressibility and effective interaction potential
Supplementary Fig. 9: Depiction of the method used to determine the restoring force of the yarn under compression. (a) shows the experimental setup with the UTM probe pressing down on yarn that is supported by three rigid pillars. The center pillar has width equal to the probe diameter to best approximate the symmetric deformation illustrated in (b). (c) and (d) show the measured restoring force as a function of probe-to-midline distance for acrylic and cotton samples, respectively. The dashed curve is a fit of the data to the assumed function form given in Supplementary Equation 5.
Using force vs. probe height compression measurements from the yarn compression experiments (see Supplementary Fig. 9), we find an effective yarn interaction potential energy for use in the simulations.
The yarn compression data show nonlinear behavior of the yarn’s resisting force as a function of probe height, exhibiting a soft regime for low compression that stiffens as the constituent fibers are forced to pack into a small volume for high compression.
Noting that the stress versus strain measurements of the fabric attain maximum stresses of approximately 1 N/mm, we argue that it is sufficient to find an approximate force versus compression depth that follows the yarn compression data up to 1 N.
We fit the compression data to a model force law given by
(Supplementary Equation 5)
for forces between N and 1 N, where the lower bound was chosen to cut out fluctuations on the measured force presumably due to the corona of wispy fibers sticking out of the yarn.
Note that this form is similar to the contact interaction assumed by Kaldor 2008 kaldor8 , except that the exponent is left as a fitting parameter.
Here, is the thickness of the yarn when the probe is at depth , where is a cutoff depth, modeling an effective incompressible “core” of the yarn.
We use the probe depth at 3 N as the cutoff height.
This model was chosen because it captures the compression-stiffening behavior of the yarn for low to moderate compression, where is a fitting parameter that encodes this nonlinear behavior.
Furthermore, as , where is the uncompressed thickness of the yarn, where is the probe depth at the edge of the yarn (here taken to be when N).
The fitting parameter sets the scale of the yarn’s compressional rigidity per area, with representing the compressed area of the yarn, which we approximate as the diameter of the UTM tool (5 mm) times the diameter of the yarn being compressed.
For small compressions, where , the compression force is approximately and measures an effective spring constant.
The results of these fits are shown in Supplementary Table 4.
In the simulations, two yarn segments in contact mutually compress each other.
We approximate the compression in terms of the centerline-to-centerline distance of two yarn segments, , where and are two centerline points.
For fixed centerline points, the compressed thickness is taken to be , where is an effective “core radius” of the yarn, representing the hard core cutoff radius, and , where is the outer radius of the yarn.
This type of soft-shell, hard-core model has been used previously in the simulation method of Sperl 2022 sperl_estimation_2022 .
The interaction potential energy density is given by
(Supplementary Equation 6)
where is a non-dimensional measure of compressed thickness.
For a more physically accurate model of compression in the future, we would like to study compression in the method that Park and Oh park_bending_2006 developed for bending, which takes into account the hierarchical structure of spun yarn.
Method
Measurement
Stockinette
Garter
Rib
Seed
Machine Knit
Yarn per
stitch (mm)
Yarn diameter
(mm)
Hand Knit
Yarn per
stitch (mm)
Yarn diameter
(mm)
Supplementary Table 2: The average yarn per stitch and yarn diameter within the stitches for the four types of fabrics made with acrylic yarn. The diameters were measured while the fabrics were in their relaxed (force-free) state. We created samples both by hand and with the knitting machine and note the significant changes in the range of values between the two methods.
Measurement
Stockinette
Garter
Rib
Seed
Yarn per
stitch (mm)
Yarn diameter
(mm)
Supplementary Table 3: The average yarn per stitch and relaxed yarn diameter within the stitches for the four types of fabrics made with the cotton yarn. The diameters were measured while the fabrics were in their relaxed (force-free) state. All of the samples were made using the knitting machine.
(mN mm2)
(mN mm-2)
Acrylic yarn (3 samples)
Cotton yarn (4 samples)
Supplementary Table 4: List of yarn bending moduli (), obtained from cantilever experiments, and compression model parameters ( and ), obtained by fitting to UTM data.
Yarn Type
Stockinette
Garter
Rib
Seed
Acrylic Yarn
Cotton Yarn
Supplementary Table 5: The average area per stitch (in mm2) for the four types of fabrics made with acrylic and cotton yarn. The caliper used to measure the stitch areas had a measurement precision of 0.01 mm.
Yarn Type
Measurement
Stockinette
Garter
Rib
Seed
Lace-WeightAlpaca Mohair
Yarn per
stitch (mm)
Stitch Area
(mm2)
Lace-WeightBlue Mohair
Yarn per
stitch (mm)
Stitch Area
(mm2)
Lace-WeightCashmere
Yarn per
stitch (mm)
Stitch Area
(mm2)
Lace-WeightBamboo
Yarn per
stitch (mm)
Stitch Area
(mm2)
Lace-WeightAcrylic
Yarn per
stitch (mm)
Stitch Area
(mm2)
Wool Blend(glove)
Yarn per
stitch (mm)
Stitch Area
(mm2)
Supplementary Table 6: The average yarn per stitch and stitch area for the lace weight samples and the therapeutic glove prototype samples. The lace weight samples were fabricated with a STOLL Industrial Knitting Machine and the glove samples were hand knit. The glove sample that is starred was made on 2.00 mm knitting needles (US size 0) and all remaining glove sample data was knit on 2.75 mm knitting needles (US size 2). The caliper used to measure the stitch areas had a measurement precision of 0.01 mm.
SUPPLEMENTARY NOTE 4 Simulation method
4.1 General Methodology
There have been a number of prior studies on yarn-level mechanics of knit stitches, including full 3D continuum elasticity models of yarn Vassiliadis2007 ; Liu2017 , as well as reduced-order models cirio_yarn-level_2017 ; Liu2018 .
Our simulation method was developed to examine stitch mechanics in a way that retains sufficient detail to explore the impact of stitch geometry (including clasp geometry in the entangled regions, as well as yarn sliding effects), while involving a coarse set of yarn properties (e.g., bending modulus, resistance to compression) to enable a materials-agnostic study. Considering knit stitches as elastica – a continuous curve with bending energy – is a well-established method to consider knit fabric geometry postle_24analysis_1967 ; semnani_new_2003 ; kaldor8 ; RAMGULAM201148 ; Abel2012 . Elastica methods are the middle ground between full three-dimensional continuum elastic models (FEA of the yarn itself) kyosevFEM2012 ; abghary1026 and simplified bead-spring models htoo_3-dimension_2017 ; sha2021 , originally designed for molecular dynamics of polymers and a method that imposes a non-realistic contact geometry between clasped yarns.
We approximated the yarn as an arclength-parametrized space curve embedded in Euclidean .
Equilibrium configurations of the yarn balance stresses due to the (i) bending rigidity of the yarn, (ii) contact interactions of the yarn against itself, and (iii) external, or applied, forces. To this end, we modeled the yarn as inextensible elastica with an interaction energy such that the total energy is given by
(Supplementary Equation 7)
where the unit tangent vector is given by , is a Lagrange multiplier describing an overall tension that maintains the curve at a constant length , and the interaction energy is given by
(Supplementary Equation 8)
The interaction energy density , with is derived from the contact force model with .
Note that we must be careful when integrating the total interaction energy to only count interactions with a minimum separation along the arclength of the yarn.
This prevents nearby points from adding divergent contributions to the interaction energy.
Refer to Supplementary Table 7 for a list of parameters used in the simulations.
In order to handle the complicated geometry of a knit stitch, we decompose the curve into a sequence of curve segments with identified endpoints .
To numerically minimize the total energy, we represented the curve as a Bézier curve, expanding in the Bernstein polynomial basis, namely
(Supplementary Equation 9)
where are the control points of the curve and
(Supplementary Equation 10)
are Bernstein polynomials.
The parameter is a re-parametrization of the arclength parameter for each segment of the resulting Bézier spline curve.
However, merely requiring the global curve to be continuous allows for kinks to be introduced into the joints between curve segments.
In order to generate realistic results, we additionally require that the unit tangent vector and its derivative are continuous in space, where is the curvature and is the unit normal vector at each point along the curve.
These joining conditions between curve segments ensure that the global curve lies within the continuity class, where is continuous everywhere along the spline.
We chose to represent each curve segment by degree-5 () Bézier curves, each specified by six control points.
The choice of degree-5 Bézier curves simultaneously gives sufficient flexibility for our simulations whilst maintaining a relatively small number of degrees of freedom and ensuring that the simulated curves remain in the continuity class eck_b-spline-bezier_1992 .
Supplementary Fig. 10: Depictions of the individual stitch cell construction of each of the four fabrics. These diagrams were created using sample outputs of the stitch-level simulations. The yarn radius shown is reduced significantly for clarity. The left-most panels show the geometry of a single relaxed knit stitch contained in a box that outlines the spatial extent of the cell. The center panels show a single relaxed purl stitch, obtained from the knit stitch via the mirror operation through the plane, depicted by the colored plane cutting through each of the boxes. The right-most panels show the construction of (a) stockinette, (b) garter, (c) rib, and (d) seed fabrics. Each fabric is generated by the repeated action of a combination of mirror operations , as well as translation operations and , on the knit stitch shown in the left-most panels.
Even though this representation allows control over curve smoothness, variations in control parameters give non-local control over curve shape, giving rise to a large number of local energy minima.
This is particularly problematic as a curve segment approaches a straight configuration, due to a degeneracy of control point arrangements for a straight curve.
This leads to “vertex bunching,” a common problem in geometry optimization DeBenedictis2016 .
To alleviate this problem, we introduced a cost functional that penalizes such configurations, characterized by small amplitude “wiggles” in the curve shape.
We incorporated a regularizing energy of the form
(Supplementary Equation 11)
where is a constant that controls the strength of the regularizing energy.
Rather than simulating a finite swatch of knitted fabric with boundaries, we took advantage of the symmetries of an infinite fabric without boundaries.
This enabled a reduction in the scale of the simulation to a single stitch.
Since the fabric is a rectangular grid, this individual stitch cell is a rectangular region of dimensions and (Supplementary Fig. 10), with lattice positions indexed by a pair of integers , representing the position of a cell relative to a reference cell at .
The central curve then has a periodic structure given by
(Supplementary Equation 12)
where and are translation operations between stitch cells and represents a mirror operation that reflects the stitch path through the midplane of the fabric, converting knits to purls, as depicted in Supplementary Fig. 10.
The function sets the number of mirror operations that are applied at each cell and thus provides information regarding the pattern.
It is given by for stockinette fabric, for garter fabric, for rib fabric, and for seed fabric.
Within a single cell, the path obeys a form of periodic boundary conditions, where the mirror operation may be applied to the unit vector at each boundary, depending on which stitch pattern being studied.
We matched simulations to experiments by setting the length of the path within a single simulated stitch to the measured yarn length per stitch for each manufactured sample.
We simulated the effect of fabric stretching in the -direction (-direction) by numerically minimizing the total yarn energy at fixed stitch cell dimension (), while allowing the transverse dimension () to vary.
This minimization was performed using the Sequential Least Squares Programming (SLSQP) method in the scipy.optimize Python package (https://docs.scipy.org/doc/scipy/reference/optimize.html), which is a gradient-free optimization algorithm that allows a number of equality and inequality constraints to be specified; in particular, we fixed the yarn length to be constant.
To generate a 1D energy landscape (with ), we first started with a guess for an initial, un-stretched configuration, at an initial stitch dimension , and numerically minimized that configuration.
We then incremented or decremented the stitch dimension and used the result of the minimization as new initial conditions for minimizing the energy over this new cell dimension; we generated full 1D landscapes using this 0th order parametric continuation, making sure to sweep in both directions to bracket an energy minimum.
Since this minimization approach is prone to finding local, metastable energy minima, we performed this sweep on four different initial stitch configurations, accepting the lowest energy value as the accepted simulation result, in order to search for better approximations to the “true ground state” of the stitch.
Simulated annealing methods may get closer to this global minimum.
However, we found that the Bézier curve representation suffers from a large number of near-degenerate configurations, complicating the application of simulated annealing methods.
With a given energy landscape , we applied a discrete, midpoint derivative and found the force profile (or ).
The completely relaxed, force-free configuration of the stitch corresponds to the point where , which can equivalently be found in either the or the landscapes since allowing the transverse dimension to vary freely in minimization is equivalent to specifying a zero-force condition on that dimension. The force-free configuration was found with a using 3rd order polynomial interpolation on data where high-energy compression simulations were eliminated.
Denoting the stitch cell dimensions of that completely relaxed configuration as and , we converted force data to nominal stress via and , expressed as a function of the linear strain components and .
(mN mm2)
(mN mm-2)
(mm)
(mm)
(mm)
Stockinette
(acrylic)
46
0.6
2.4
0.74
0.335
11.3
0.453
Garter
(acrylic)
46
0.6
2.4
0.54
0.245
10.6
0.454
Rib
(acrylic)
46
0.6
2.4
1.18
0.415
16.1
0.352
Seed
(acrylic)
46
0.6
2.4
1.20
0.290
15.7
0.242
Stockinette
(cotton)
70
11.5
2.9
0.66
0.310
12.28
0.470
Garter
(cotton)
70
11.5
2.9
0.80
0.420
16.05
0.525
Rib
(cotton)
70
11.5
2.9
0.69
0.405
17.32
0.587
Seed
(cotton)
70
11.5
2.9
0.75
0.430
17.94
0.573
Supplementary Table 7: List of yarn material parameters used in simulations. We adjusted the hard-core radius to obtain better agreement with the stress-vs-strain curves obtained from experiments. For the acrylic yarn, the core radius averages of the yarn radius with a standard deviation of . For the cotton yarn, the core radius averages of the yarn radius with a standard deviation of . This suggests the core radius has a dependence on the yarn type and is slightly influenced by the fabric type. How the fabric manufacturing process for different fabric types affects the core radius is currently unknown. Generally, increasing the core radius in the simulation leads to a stiffer fabric for all four fabric types, but the exact dependency of the constitutive model on the core radius is a subject of further study. Existing simulations looking to replicate experimental stretching responses often have many more fitting parameters with complex optimization schemes sperl_estimation_2022 .
4.2 Restricting sliding with arclength constraints
Our simulation method of minimizing an elastica energy functional over topologically-constrained configurations of yarn does not incorporate effects of friction.
Given the wispy, corrugated texture of the yarn, we expect that friction may play an important role in reducing the ability of the yarn to slide against itself in certain configurations.
We hypothesize that this effect may be particularly relevant for seed stitch, as their cross-over regions do not clasp as completely as other stitches, which can be seen in Supplementary Fig. 10.
In particular, seed possesses relatively straight segments oriented along , even in the un-stretched configuration, allowing for a soft sliding motion that is distinct from the soft near-rigid rotation of odd connecting yarn segments (described in SUPPLEMENTARY NOTE 8).
To demonstrate the effect of contact sliding, we consider the extreme limit of quenched sliding.
This is implemented in the energy minimization through as pair of constraints that break the reptation symmetry of the yarn.
Using our decomposition of yarn into cross-overs and connections, we can approximate the arclength coordinate of the contact point, , as “half-way” between the ends of the yarn in the corresponding cross-over region, which are at points and , taking .
The slide-quenching constraints amount to ensuring that the total arclength of yarn joining two neighboring cross-over regions remains constant under deformation, i.e. , where are the corresponding arclength positions in the un-stretched state.
Within each stitch there are four such contact points, so in principle there need to be four such constraints.
However, the mirror symmetry of the stitch about the -plane passing through its middle relates two of the arclength coordinates, and the total arclength constraint implies that , leaving only two constraints that need to be enforced, namely
(Supplementary Equation 13)
Note that the addition of these constraints require that stretched stitches inherit information about the un-stretched equilibrium, namely .
This dependence on a reference configuration distinguishes the elasticity of slide-quenched fabrics from those that allow for sliding in a way reminiscent to the difference between elastomeric materials (e.g. polymer gels and rubbers) that attain rigidity via permanent cross-links, versus so-called “topological” constraints.
We leave further explorations of quenched versus annealed sliding for future studies.
4.3 Simulation energy analysis
Some of the value in the yarn-level simulations is the ability to determine the components of the energy of the yarn as given in Supplementary Equation 7. For each simulation, we can extract the components of energy due to yarn bending and yarn compression. Generally, as seen in Supplementary Fig. 11 with the cotton garter sample, the bending energy dominates at low strain. As the strain increases, the proportion of compression energy increases, finally overcoming the bending contribution at high enough strain. This transition is typically smooth, though an exception to this is discussed in SUPPLEMENTARY NOTE 4.5, for acrylic seed. Values for the total energy per stitch and energy ratios for all fabric types and both yarn types can be found in Supplementary Table 8. This simulation data supports the Reduced Symmetry model, where bending is the dominant energy contribution at low strain.
Supplementary Fig. 11: Energy breakdown for cotton garter sample stretched in the x- (a) and y-directions (b). The compression (blue) and bending (red) energies are given as percentages of the total energy at each value of strain.
(J)
Stockinette
(acrylic)
0.249
0.130
0.870
Garter
(acrylic)
0.175
0.026
0.974
Rib
(acrylic)
0.189
0.391
0.609
Seed
(acrylic)
0.288
0.459
0.541
Stockinette
(cotton)
0.401
0.233
0.767
Garter
(cotton)
0.254
0.216
0.784
Rib
(cotton)
0.139
0.044
0.956
Seed
(cotton)
0.262
0.172
0.828
Supplementary Table 8: List of total energy per stitch, the ratio of compression energy to total energy, and the ratio of bending energy to total energy as given by zero-force simulations. On average over all fabric types in both yarn types, the bending energy is of the total energy.
4.4 Observed “jamming” response in low-stress regime
At very low stresses, we sometimes observe an initial high-rigidity response before the fabric softens into a linear stress-strain response. This behavior is seen in both experimental (see acrylic garter pulled in the x-direction and rib in the y-direction (Supplementary Fig. 7a), cotton stockinette and garter pulled in the x-direction (Supplementary Fig. 7b), and the therapeutic glove test samples for stockinette in the x-direction and stockinette and rib in the y-direction (Supplementary Fig. 7c)) and simulation (see stockinette and seed in the x-direction and seed in the y-direction in Supplementary Fig. 6) data. Other groups studying knits made with incompressible yarn have seen similar low-stress, high-rigidity regions duhovic_simulating_2006 . Postle Postle2002 described this behavior as a jammed regime where forces normal to the stretching direction prevent the yarn from rearranging and the fabric from extending. Since jamming is a contact-dependent phenomenon, jamming behavior present in simulation results that is not found in experiments may be a result of our contact model.
4.5 Instability in acrylic seed
Shown in Fig. 2, the simulation stress-strain curve for acrylic seed differs from the experimental result. Further investigation into the simulation shows a buckling instability at a strain of , where the stitches move out of the -plane to reduce the compression energy as shown in Supplementary Fig. 12. Due to the checkerboard pattern of knit and purl stitches, seed fabric is uniquely able to express this out-of-plane buckling instability in comparison to other fabric types. For hard colloidal spheres, out-of-plane buckling (from two-dimensions to three-dimensions) results in a square lattice pieranski_thin_1983 . Neighboring particles want to go opposite directions out of the plane, such that a neighboring pair have one particle above the plane and one below. The stitch configuration of seed enables this transition, whereas the stitch configurations of the three other fabric types prevent it. Simulations for other stitch patterns with more limited frustration may also allow this buckling. Seed also has the highest proportion of compression energy of all the fabric types, as seen in Supplementary Table 8, which would make it more susceptible to contact-induced buckling. As seen in Supplementary Table 10, the Poisson ratio for the simulation is approximately four times larger than experiment. This larger Poisson ratio is a marker of the simulation buckling, but our current analysis is insufficient to determine causality. The non-monotonic behavior of the contact energy in Supplementary Fig. 12b indicates that there is an instability in the numerics caused by the contact model.
Supplementary Fig. 12: Energy breakdown (b) and stitch configurations (c, d) for the buckling instability in seed acrylic simulations that correlate to the abnormality in the stress-strain plot (a). The stitch configurations show a tiling of 3 by 3 stitches in the plane before (c) and after (d) the buckling instability occurs. The buckling is characterized by sudden overlaps of the entangled regions of neighboring stitches. These strain locations in the energy breakdown in b show that the onset of buckling is correlated with a decrease in the relative compression energy while the relative bending energy increases, counter to the general trends seen for each component of the energy. These renderings (c,d) were made using the outputs of the seed simulations.
4.6 Accounting for Manufacturing Tension
In the simulation, manufacturing tension is relevant during initialization of the fabric before it is stretched or deformed in any way. Others have simulated. the actual knitting process Duhovic2006 , implemented a shrinking factor that reduces the arc-length of segments of yarn until the fabric settles into a rest-state kaldor8 , or taken a picture of a physical sample and used that geometry as an input of the simulation that is then relaxed to near force-balance sperl_estimation_2022 . Many don’t consider tension at all ru_modeling_2023 . Of these initialization strategies, the method we use is closest to that of Sperl et al. sperl_estimation_2022 ; we start with a input geometry inspired by the actual geometry of the stitches within the fabric. We then impose constraints and yarn properties. The length constraint, which fixes the length of yarn per stitch, is how we control how tightly the stitches are manufactured. Once these input properties are imposed, we allow the simulation to find the minimum energy configuration that fulfills these constraints. In Supplementary Fig. 13, we show how we can control the tightness of the stitches by changing the length of yarn per stitch.
We also consider how tension may affect the yarn structure by allowing the core radius of the yarn to vary. In this way, we account for how the yarn may change its compressibility under tension without a physical model for that phenomenon, which is currently poorly understood. We also take measurements of the yarn radius in situ to represent changes in yarn radius under tension. Worsted weight yarn, such as the acrylic and cotton yarns used in our samples, often visibly change radius under tension.
Supplementary Fig. 13: Stitch configurations of simulation outputs of stockinette fabric with different length of yarn per stitch constraints, (a) 10.5 mm and (b) 12.5 mm, to represent different levels of manufacturing tension. These stitch configurations are made from multiple tilings of the stitch unit cell to create a fabric that is three stitches wide by three stitches high.
4.7 Friction
Friction is often included in dynamic simulations of knitted fabrics kaldor8 ; cirio_yarn-level_2017 ; duhovic_simulating_2006 . We do not include friction in our stitch-level simulations, primarily because our simulations are static. Friction can not be incorporated into an energy minimization scheme. Including a dissipative term such as friction into a static simulation is not supported by both the general simulation method and the specific way we minimize the energy.
For each set of stitch cell dimensions, we iteratively change the shape of the stitch to find the minimum energy configuration sokolnikoff1956mathematical , as previously described. We are not continuously stretching the stitch cell. Each set of stitch cell dimensions is a single simulation, unconnected to other simulations of different stitch cell dimensions. Static simulations of this kind well suit our purposes to use simulations to investigate the role of topology on fabric mechanics. By finding the mechanical equilibrium point of the stitch cell for each set of given dimensions, we well represent the mechanics of our experiments. Our stress-strain simulation results are able to replicate the shape of both the linear and non-linear elastic responses of knit fabrics, which has yet to be achieved for knits made of compressible yarns.
As mentioned in Supplementary Note 4.1, we use the Sequential Least Squares Programming (SLSQP) method in the scipy.optimize Python package (https://docs.scipy.org/doc/scipy/reference/optimize.html) to conduct our energy minimization. This method of optimization does not use gradients and cannot incorporate a dissapative energy term. We chose this method due to its suitability for our specific static simulations; this minimization method is able to take large steps in the energy landscape to converge faster and can often recover from divergent energy configurations. To include a dissapative energy term like friction, we would have to move to a dynamic simulation and use a different optimization scheme, such as gradient descent.
Prior research on rib fabric made of incompressible yarn shows that energy lost to friction is very small, at most the totalling the energy of the third-largest contribution for the entirety of the knit’s elastic response duhovic_simulating_2006 . Since we are using a compressible yarn with an appreciable energy contribution from yarn compression (see Supplementary Fig. 11) and stretching fabric in the quasi-static regime, we estimate that friction has a similarly small, if not smaller, contribution to our fabric.
We do not see frictional effects on the elasticity of the knit fabrics when we iteratively repeat extension experiments, as seen in Supplementary Fig. 7. This lack of measurable frictional effect on the experimental samples indicates that friction must be a very small contribution. This is supported by the fact that we can wear clothes multiple times without them losing their elasticity. Socks in particular retain their elasticity over multiple wears even though they are constantly being stretched and deformed with every step. If friction had a large role in knit fabric mechanics, socks would become single-use items.
In the uniaxial stretching experiments, the fabrics attain an hourglass-like waist as the force acting along one direction causes a response in the transverse direction.
This response is a result of the fabric’s Poisson effect, i.e. stretching the fabric in one direction thins it in transverse directions.
For example, if the fabric is stretched in the -direction so that the strain component is positive, then it thins in the -direction.
Due to the constraints on transverse deformation imposed by clamps on two of the edges, the strain field component varies along the fabric, and the magnitude of the strain reaches a maximum where the waist narrows.
The pin tracking approach we employed measures the deformation in this region.
Due to the anisotropy of each fabric, the transverse deformation is characterized by two Poisson ratios, and .
In principle, these ratios describe the linear response of the fabric under two different deformation protocols: if the fabric is stretched in the -direction (i.e. ) then the transverse response is ; if the fabric is stretched in the -direction then the transverse response is . We measured these ratios for experimental and simulation results, and they are reported in Supplementary Table 10, Supplementary Table 12 and Supplementary Table 20.
SUPPLEMENTARY NOTE 6 Nonlinear constitutive model
Supplementary Fig. 14: (a,b) Diagrams of the even (a) and odd (b) regions of stockinette and rib, respectively, with labels for the re-parameterized geometric variables used in SUPPLEMENTARY NOTE 8. These renderings we done using sample outputs of the stitch-level simulations. For (a, b), horizontal is the -direction of the fabric and into-the-plane is the -direction. (c, d, e, f) Effective spring network elements for like-stitch (K-K or P-P) neighbors in the -direction (c), unlike-stitch (K-P) neighbors in the -direction (d), like-stitch neighbors in the -direction (e), and unlike-stitch neighbors in the -direction (f). For (c, d, e, f), horizontal is the -direction of the fabric and vertical is the -direction. Circled areas indicate entangled regions.
Here, we provide a scaling rationale for the constitutive relationship.
The results presented here are consistent with the RS model of SUPPLEMENTARY NOTE 8, including the form of the strain-stiffening term.
First, consider the various lengthscales that describe a knit stitch.
These include the yarn radius , the length of yarn per stitch , and a “bending lengthscale” , where is the yarn’s bending modulus and is the tension of the yarn, which is obtained from dimensional analysis.
In fact, has a simple physical interpretation: if one considers an arc of radius , the work done in stretching the arc’s radius to under constant tension scales as , which is counteracted by a change in the bending energy, which scales as , and the two generalized forces are in equilibrium if .
Thus, can be regarded as the radius of curvature that dominates the bending energy of a curve in mechanical equilibrium under tension.
As increases, decreases, so that the bending energy of a stitch is increasingly concentrated to small regions of high curvature, which must be located at the entangled regions.
Note that in the arc approximation, the is both the radius of curvature and the arclength of the curved regions, so that .
Since the radius of the yarn represents a lower limit of the radius of curvature and the stitch length determines the periodicity of yarn shape, is bounded by these two lengths: .
The limits of this region correspond to two physical cases.
Case one, , occurs when there is little to no applied external force.
Under small strains , the bending length decreases linearly, such that changes in go as , where is the bending length at zero strain.
This results in the linear stress-strain relationship .
Case two, , occurs when the fabric is under high external load.
Here, the yarn segments within each crossover region clasp increasingly tightly around each other.
In this regime, the total length of yarn can be approximated as , where is a numerical prefactor of and , the maximal separation between crossover regions, varies linearly with the average separation between crossover regions in the unstrained case, .
Therefore, the bending length can be approximated as , where and are constants determined by the material properties of the yarn.
The bending energy scales as .
This implies that the high-stress regime scales as .
This is consistent with our elastica analysis in the preceding section, where the high-tension limit recovers the same bending energy scaling form.
While the low-stress regime is determined by topology, the high-stress regime is dominated by the material properties of the yarn.
Combining these limiting behaviors leads us to a stress-strain relationship , which fits our experimental and simulation data quite well, as shown in Fig. 2, Supplementary Fig. 16, and Supplementary Fig. 6.
SUPPLEMENTARY NOTE 7 Uniaxial constitutive model and fitting
Our constitutive model for a sample of knitted fabric under uniaxial stress is given by
(Supplementary Equation 14)
where , , , and are components of the rigidity tensor , evaluated in the low-strain, linear elastic limit wherein .
The constants and characterize the finite extensibility of knitted fabric when stretched in orthogonal directions, with and setting the stress scale of the strain-stiffening regime.
Our experimental results find significant asymmetry between and components, see Supplementary Table 9, Supplementary Table 11, and Supplementary Table 19. This is backed up by simulations showing significant asymmetry between -strain and -strain. Therefore, we do not enforce the standard symmetry in our model.
We hypothesize that this is due to changes in non-local contact interactions that occur when the fabric is strained in different directions.
We obtained values of these eight parameters for each fabric by fitting the constitutive relations to data via a least-squares scheme.
For each fabric, we obtained two independent data series from the uniaxial stretching experiments: (i) measured triplets of strain and stress in the x-direction and (ii) measured triplets of strain and stress in the y-direction.
We then minimize the functional
(Supplementary Equation 15)
with respect to the seven unknown parameters in the constitutive relation.
However, minimizing this functional alone is insufficient because it ignores constraints imposed by the boundary conditions of the fabric.
The stress-free boundary conditions couple longitudinal and transverse strains, giving rise to the Poisson effect.
In order to introduce this coupling when fitting the data, we determine the pair of Poisson ratios, and , via linear fits to data sets and , respectively. Then we minimize the functional under the constraints that the linear rigidity tensor components are consistent with these Poisson ratios via the relationships and .
Values obtained for the fitting parameters are shown in Supplementary Table 9, Supplementary Table 11, and Supplementary Table 19.
The Young’s moduli are then given by
(Supplementary Equation 16)
where we see that , yet and .
Values of the Young’s moduli, along with error estimates based on the variance obtained from least squares fitting, are shown in Supplementary Table 10 and Supplementary Table 12. These figures are plotted in Supplementary Fig. 15.
(N/mm)
(N/mm)
(N/mm)
(N/mm)
(N/mm)
(N/mm)
Stockinette
(experiment)
0.204
0.930
0.088
0.413
1.111
2.537
0.046
0.010
Stockinette
(simulation)
0.200
0.753
0.040
0.341
1.391
2.971
0.005
0.013
Garter
(experiment)
0.241
0.060
0.036
0.029
1.170
0.802
0.022
0.022
Garter
(simulation)
0.252
0.038
0.103
0.019
1.073
1.135
0.002
0.006
Rib
(experiment)
0.011
0.126
0.003
0.026
0.385
1.251
0.011
0.034
Rib
(simulation)
0.024
0.142
0.011
0.028
0.446
1.411
0.004
0.014
Seed
(experiment)
0.074
0.020
0.010
0.009
1.148
0.568
0.027
0.017
Seed
(simulation)
0.128
0.057
0.066
0.021
0.940
0.693
0.010
0.005
Supplementary Table 9: List of parameters obtained by fitting the constitutive model to experimental and simulation data representing fabric made from the acrylic yarn.
(N/mm)
(N/mm)
Stockinette
(experiment)
Stockinette
(simulation)
0.182
0.684
0.453
0.202
Garter
(experiment)
Garter
(simulation)
0.200
0.030
0.504
0.407
Rib
(experiment)
Rib
(simulation)
0.022
0.129
0.200
0.461
Seed
(experiment)
Seed
(simulation)
0.103
0.046
0.373
0.515
Supplementary Table 10: List of parameters obtained by fitting the Young’s moduli and Poisson ratios to experimental and simulation data representing fabric made from the acrylic yarn.
(N/mm)
(N/mm)
(N/mm)
(N/mm)
(N/mm)
(N/mm)
Stockinette
(experiment)
0.147
0.659
0.061
0.277
1.388
2.440
0.007
0.064
Stockinette
(simulation)
0.354
0.637
0.127
0.280
1.250
2.102
0.006
0.012
Garter
(experiment)
0.057
0.031
0.010
0.017
1.225
0.700
0.020
0.021
Garter
(simulation)
0.208
0.052
0.044
0.024
1.093
0.719
0.024
0.016
Rib
(experiment)
0.003
0.049
0.001
0.010
0.388
1.439
0.003
0.017
Rib
(simulation)
0.009
0.028
0.004
0.006
0.393
1.243
0.002
0.007
Seed
(experiment)
0.038
0.044
0.006
0.019
1.351
0.951
0.010
0.022
Seed
(simulation)
0.114
0.192
0.019
0.069
1.102
1.212
0.017
0.008
Supplementary Table 11: List of parameters obtained by fitting the constitutive model to experimental and simulation data representing fabric made from the cotton yarn.
(N/mm)
(N/mm)
Stockinette
(experiment)
Stockinette
(simulation)
0.298
0.536
0.441
0.359
Garter
(experiment)
Garter
(simulation)
0.188
0.047
0.459
0.210
Rib
(experiment)
Rib
(simulation)
0.008
0.026
0.195
0.439
Seed
(experiment)
Seed
(simulation)
0.107
0.180
0.359
0.168
Supplementary Table 12: List of parameters obtained by fitting Young’s moduli and Poisson ratios to experimental and simulation data representing fabric made from the cotton yarn.
(N/mm)
(N/mm)
(N/mm)
(N/mm)
(N/mm)
(N/mm)
Lace-Weight Acrylic
Stockinette
0.119
1.454
0.130
0.678
0.655
1.870
0.078
0.275
Garter
0.066
0.154
0.034
0.075
0.657
1.380
0.050
0.056
Rib
0.012
0.261
0.009
0.074
0.342
1.573
0.018
0.083
Seed
0.037
0.189
0.023
0.103
0.589
1.451
0.031
0.037
Lace-Weight Blue Mohair
Stockinette
0.168
0.410
0.134
0.174
0.670
1.644
0.050
0.125
Garter
0.146
0.069
0.075
0.048
0.847
1.020
0.028
0.034
Rib
0.026
0.126
0.020
0.037
0.327
1.323
0.014
0.039
Seed
0.116
0.130
0.060
0.086
0.803
0.986
0.020
0.028
Lace-Weight Cashmere
Stockinette
0.044
0.309
0.040
0.129
0.622
1.575
0.035
0.098
Garter
0.034
0.060
0.019
0.033
0.619
1.054
0.028
0.028
Rib
0.007
0.090
0.005
0.026
0.304
1.202
0.012
0.037
Seed
0.030
0.038
0.013
0.025
0.676
0.780
0.022
0.025
Lace-Weight Alpaca Mohair
Stockinette
0.099
0.399
0.870
0.181
0.633
1.721
0.044
0.116
Garter
0.092
0.064
0.044
0.038
0.769
1.032
0.034
0.0311
Rib
0.021
0.152
0.018
0.051
0.389
1.476
0.012
0.051
Seed
0.104
0.076
0.048
0.052
0.817
0.869
0.018
0.026
Lace-Weight Bamboo
Stockinette
0.015
0.432
0.016
0.186
0.605
2.095
0.012
0.103
Garter
0.023
0.068
0.015
0.037
0.638
1.542
0.018
0.022
Rib
0.005
0.100
0.004
0.030
0.323
1.787
0.008
0.028
Seed
0.019
0.043
0.010
0.025
0.669
1.019
0.014
0.021
Supplementary Table 13: List of parameters obtained by fitting the constitutive model to experimental data from samples made from lace weight yarn.
(N/mm)
(N/mm)
Lace-Weight Acrylic
Stockinette
0.058
0.714
0.466
1.092
Garter
0.049
0.115
0.488
0.518
Rib
0.010
0.208
0.284
0.723
Seed
0.025
0.126
0.545
0.610
Lace-Weight Blue Mohair
Stockinette
0.111
0.271
0.425
0.800
Garter
0.095
0.100
0.679
0.515
Rib
0.020
0.098
0.291
0.781
Seed
0.077
0.086
0.661
0.514
Lace-Weight Cashmere
Stockinette
0.027
0.192
0.417
0.912
Garter
0.024
0.041
0.552
0.552
Rib
0.006
0.072
0.286
0.695
Seed
0.021
0.027
0.652
0.445
Lace-Weight Alpaca Mohair
Stockinette
0.059
0.240
0.454
0.879
GarterGarter
0.065
0.046
0.596
0.482
Rib
0.015
0.109
0.337
0.841
Seed
0.071
0.052
0.683
0.461
Lace-Weight Bamboo
Stockinette
0.008
0.240
0.430
1.038
Garter
0.015
0.043
0.549
0.653
Rib
0.004
0.074
0.301
0.834
Seed
0.013
0.029
0.598
0.537
Supplementary Table 14: List of parameters obtained by fitting the Young’s moduli and Poisson ratios to experimental data from samples made from lace weight yarn.
Supplementary Fig. 15: Rigidity-rigidity plot for all fabric samples, where is the Young’s modulus in the th direction. The colored ellipses represent one standard deviation for each of the four fabric types and are oriented along the principal axes: stockinette in blue, garter in orange, rib in green, and seed in purple. The gray dashed line represents a isotropic mechanical response.
SUPPLEMENTARY NOTE 8 Composite elasticity from reduced-symmetry model (RS model)
To connect between the micromechanics of the yarn and the fabric’s macroscopic response, we developed a reduced-symmetry (RS) model of stitch mechanics.
This model starts with the full 3D elastica model and determines the change in bending energy due to deflecting the shape of individual yarn segments from their original shape, as they sit in an un-stretched sample of fabric.
We distill this shape-response to stretching into a dependence on the spatial symmetry of yarn joining neighboring entangled regions.
To this end, we approximate the yarn segment shapes as 2D curves, given by their projections onto either the -plane or the -plane (as shown in Supplementary Fig. 14).
We can approximate the shape of these 3D curves as the image of 2D parametric curves where , is a unit vector in the -plane and lies along the fabric’s thickness.
Translating the coordinate system such that the endpoints of a segment are at antipodal values ),
where is the separation of the endpoints.
We recognize that there are distinct curves with even symmetry (and ), and distinct curves with odd symmetry (and general ).
This follows from the mapping of knit stitches to purl stitches in 3D space induced by the action of the mirror operation on the centerline of the yarn.
The geometry of the entangled regions at the endpoints of the yarn segment constrains the shape of the curve at its endpoints by the requirement that the curve must clasp around another curve in the entangled region.
The end of the yarn is forced to deflect out of the plane, following a given tangent vector adding an additional set of boundary conditions to the parametric curve .
For even curves, this boundary condition is and for odd curves, it is .
To simplify calculations, we will express the curve as a dimensionless deflection transverse to the end-to-end orientation via
(Supplementary Equation 17)
where is the direction transverse to the end-to-end orientation.
In this representation, the deflection function obeys the boundary conditions .
We additionally take the small-deflection approximation so that the tangent vector at each point is given by .
Therefore, for even connecting yarn segments, the slope of the deflection function at the ends is given by .
For odd connecting yarn segments, the slope is given by .
In the small-deflection approximation, the elastica energy is given by
(Supplementary Equation 18)
where is a Lagrange multiplier, a tension that constrains the length of the curve to .
It is useful to rewrite the energy as
(Supplementary Equation 19)
where is a dimensionless form of the Lagrange multiplier.
The equilibrium deflection extremizes this energy function so that and therefore solves the differential equation .
Even solutions have the form and odd solutions have the form , where the constants , , , and are determined by the boundary conditions on and .
Inserting these solutions back into the energy functional, the total energy for even connecting yarn segments is given by
(Supplementary Equation 20)
and the total energy for odd connecting yarn segments is given by
(Supplementary Equation 21)
In order for the length constraint to be enforced, the dimensionless Lagrange multiplier is chosen to solve the equation .
However, to solve for , we require the solution to transcendental equations for both even and odd connecting yarn segments.
To avoid this, we find it is sufficient to Taylor expand each energy function to quartic order in , yielding
(Supplementary Equation 22)
and
(Supplementary Equation 23)
which yield approximate polynomial equations for the constraining tension .
Using the solution for , we find effective elastica energies
(Supplementary Equation 24)
and
(Supplementary Equation 25)
which include the lowest-order correction to the bending energy arising from the enforced length constraint.
The first term of the energy arises from an overall penalty from curvature, so that at fixed endpoint orientation , the internal stress of the curve pushes its endpoint separation to higher values.
This stress is countered by the second term, representing the cost of concentrating curvature to the endpoints of the curve when the endpoint separation approaches the total length of the curve.
Therefore, there is an endpoint separation that minimizes the elastica energy so at fixed endpoint orientation .
For even connecting yarn segments, , and for odd connecting yarn segments, .
We will next assume that under low applied stress, these segments have separation length that are almost the energy-minimizing length .
Expanding the elastica energy to second order in , the even connecting yarn segment energy is approximately
(Supplementary Equation 26)
and the odd connecting yarn segment energy is approximately
(Supplementary Equation 27)
where we have kept only leading-order terms in .
Note that the cost of deforming each segment diverges when the endpoint orientations approach the orientation of the endpoint separation vector, i.e. .
In this limit, the energy-minimizing length approaches the total length of the curve, , and due to the length constraint, the cost of stretching the curve beyond its total length should diverge.
Finally, the bending energy for odd connecting yarn segments is generally larger than the bending energy for even connecting yarn segments, assuming each curve has identical values of length , endpoint separation , and endpoint orientation .
This is reasonable since odd connecting yarn segments have two arches, each with a fraction of the radius of curvature of the single arch of an even connecting yarn segment.
Next, we determine the rigidity for extensile deformations of each curve along the fabric plane, where is the -axis projection of the endpoint separation.
As shown in Supplementary Fig. 14, the endpoint orientation remains effectively fixed under such deformations.
For even connecting yarn segments, the planar projection of the endpoint separation is identical to the full endpoint separation , since , so .
Therefore, the extensional rigidity for even connecting yarn segments is approximately
(Supplementary Equation 28)
where the divergence as is due to infinite energy cost for stretching the curve beyond its constrained length.
Here, is a geometric factor.
In general, odd connecting yarn segments align along an angle and deformations of the -axis projection of the endpoint separation can be achieved by changes in both the endpoint separation and the angle .
It is evident that deformations involving changes in endpoint separation are even more rigid than those for even connecting yarn segments.
Therefore, odd connecting yarn segments undergo extensile deformations by rotating into the fabric plane (as shown in Supplementary Fig. 14b), i.e. they change by changing the angle at fixed so . Therefore, the extensional rigidity for odd connecting yarn segments is approximately
(Supplementary Equation 29)
where is the out-of-plane projection of the endpoint separation , and .
Note that this energy diverges as , for which the rotational freedom of the odd connecting yarn segments saturates and the curve must increase in order to undergo extensile deformations, much like even connecting yarn segments.
However, for garter, rib, and seed stitches, values of for the un-deformed stitch are closer to , so that . In this case, we find that the ratio of even connecting yarn segments rigidity to odd connecting yarn segments rigidity can be significantly greater than one, with being typical.
8.1 Effective stitch rigidities
The RS model provides estimates for the linear stiffnesses of different yarn connecting segments, based on the “rule of mixing” from the theory of fiber composites.
To estimate the effective linear stiffness of the entire stitch, we treat each connecting segment as a spring element, either in series or in parallel with other springs comprising the stitch, as shown in Supplementary Fig. 14.
For stretching in the -direction, we consider the effective stiffness of the connecting yarn segments that are oriented in the -direction; likewise for stretching in the -direction.
Like-stitch neighbors (K-K or P-P) have a pair of spring elements, each with stiffness , that add in series in the -direction, giving an effective stiffness of ; in the -direction, two sets of in-series pairs are in parallel, giving an effective stiffness of .
Unlike-stitch neighbors (K-P) have different spring elements in the -direction and -direction.
In the -direction, there is one even connecting yarn segment in series with an odd connecting yarn segment, leading to a effective stiffness of , since .
In the -direction, the springs add similarly to the like-stitch case, giving an effective stiffness of .
(mm)
Stockinette
(; even)
2.187
-0.884
1.000
-
Stockinette
(; even)
5.289
-0.490
0.686
-
Garter
(; even)
2.120
-0.583
1.000
-
Garter
(; odd)
3.499
0.257
0.686
0.749
Rib
(; odd)
3.093
-0.156
1.000
1.181
Rib
(; even)
4.846
-0.334
0.999
-
Seed
(; odd)
3.053
0.462
0.073
0.450
Seed
(; odd)
3.776
-0.020
0.720
0.821
Supplementary Table 15: List of geometric parameters for use in RS model calculations, obtained from simulations of acrylic yarn.
(mm)
Stockinette
(; even)
2.442
-0.421
0.988
-
Stockinette
(; even)
3.559
-0.513
0.783
-
Garter
(; even)
3.488
-0.493
1.000
-
Garter
(; odd)
4.895
0.202
0.696
0.770
Rib
(; odd)
2.834
-0.565
1.000
1.355
Rib
(; even)
5.744
-0.338
1.000
-
Seed
(; odd)
3.344
0.432
0.100
0.474
Seed
(; odd)
4.181
-0.102
0.816
0.864
Supplementary Table 16: List of geometric parameters for use in RS model calculations, obtained from simulations of cotton yarn.
(N/mm)
(N/mm)
Stockinette
(experiment)
Stockinette
(simulation)
0.182
0.684
0.453
0.202
Stockinette
(RS model)
0.210
0.528
-
-
Garter
(experiment)
Garter
(simulation)
0.200
0.030
0.504
0.407
Garter
(RS model)
0.275
0.106
-
-
Rib
(experiment)
Rib
(simulation)
0.022
0.129
0.200
0.461
Rib
(RS model)
0.024
0.109
-
-
Seed
(experiment)
Seed
(simulation)
0.103
0.046
0.373
0.515
Seed
(RS model)
0.077
0.029
-
-
Supplementary Table 17: List of parameters obtained by fitting the Young’s moduli and Poisson ratios to experimental and simulation data representing fabric made from the acrylic yarn. Also included: estimates of stitch rigidity from the reduced-symmetry (RS) elastica model using geometric parameters obtained from simulations of relaxed stitches.
(N/mm)
(N/mm)
Stockinette
(experiment)
Stockinette
(simulation)
0.298
0.536
0.441
0.359
Stockinette
(RS model)
0.312
0.602
-
-
Garter
(experiment)
Garter
(simulation)
0.188
0.047
0.459
0.210
Garter
(RS model)
0.099
0.052
-
-
Rib
(experiment)
Rib
(simulation)
0.008
0.026
0.195
0.439
Rib
(RS model)
0.029
0.099
-
-
Seed
(experiment)
Seed
(simulation)
0.107
0.180
0.359
0.168
Seed
(RS model)
0.079
0.033
-
-
Supplementary Table 18: List of parameters obtained by fitting Young’s moduli and Poisson ratios to experimental and simulation data representing fabric made from the cotton yarn. Also included: estimates of stitch rigidity from the reduced-symmetry (RS) elastica model using geometric parameters obtained from simulations of relaxed stitches.
8.2 The high-tension limit
As the endpoints are brought further apart, the distribution of curvature in the elastica shifts and becomes increasingly concentrated at the endpoints, as the central segment straightens out.
Since the curve must maintain a fixed length, the force required to move these points apart increases until the distance between the points is equal to the total length of the curve.
In this pathological limit, the radius of curvature at the endpoints approaches zero and the bending energy diverges; the tension required to maintain the fixed-length constraint likewise diverges.
The nature of this strain-stiffening response can therefore be obtained in the asymptotic limit of the elastica model.
This is equivalent to taking the large- limit in the evaluation of the energies Supplementary Equation 20 and Supplementary Equation 21.
In this limit, the integrands of the energy functionals for both even and odd connecting yarn segments have the same -dependence.
Minimizing each energy with respect to , we find an identical asymptotic form to the energy,
(Supplementary Equation 30)
Thus, we recover both the expected strain-stiffening response and the observed universal strain-stiffening behavior, independent of stitch symmetry.
SUPPLEMENTARY NOTE 9 Applying the constitutive model to simulate uniaxial stretching in fabrics of finite size
To simulate the deformed shape of sample of fabric of finite extent using our constitutive model (Supplementary Equation 14), we turn to continuum elasticity theory.
There is considerable prior work on numerical homogenization of yarn level simulations that use micromechanical simulations to predict the bulk level elastic response that is then implemented in FEA Sperl2020 ; Wadekar2020 .
We emphasize here that our FEA calculation is a proof of concept demonstration that the nonlinear constitutive model captures realistic fabric-level deformations.
Rather than the micromechanical model being tied directly into the FEA calculation, we use the elastica model to derive the nonlinear form of the constitutive model, based on stitch microstructure.
Here, we use constitutive model coefficients that are found from fitting experimental (rather than simulation) data.
We will denote points inside the undeformed fabric as , where and .
The dimensions of the undeformed garter fabric made of acrylic yarn, measured prior to the stretching experiment, are and .
Under applied uniaxial displacement of the boundaries, fabric points are displaced by a vector field to new points , resulting in a linearized strain tensor
(Supplementary Equation 31)
This strain corresponds to an internal stress field via our constitutive model (Supplementary Equation 14).
The points and lie on two-dimensional triangular meshes with the same topology (no re-meshing is performed during the calculation).
The final shape adopted by the fabric under set displacements of the -boundary, , is determined by solving the continuum elasticity equilibrium equations,
(Supplementary Equation 32)
with boundary conditions on the -boundary.
To solve this boundary value problem, we turn to Finite Element Analysis (FEA), as implemented by FEniCS, an open-source finite element solver (see https://fenicsproject.org/).
Rather than directly solving the stress balance partial differential equation, the problem is cast in its “weak form,” derived from the energy functional
(Supplementary Equation 33)
Note that this energy functional requires the symmetry , whereas our fits show significant asymmetry between these components.
To continue using this form of the energy functional, we use the average of the measured values of and .
Following the standard FEA procedure, we create a meshed representation of the undeformed fabric.
The mesh elements at the top and bottom boundaries of the fabric are displaced by the fixed boundary displacement .
Next, the program calculates the variations in the total energy with respect to displacements of the mesh vertices .
Finally, the program iteratively searches for the root .
To avoid numerical issues due to the singular form of the nonlinear part of the elastic energy functional, we approximate the nonlinear part by its series expansion, truncating at quartic order (dropping terms and higher).
While we did not calculate the elastic constant in experiments or simulations, for this demonstration, we chose N mm-1, which is on a comparable scale as the other elastic constants.
Since the majority of the uniaxial deformation involves and components of strain, the simulated deformations are relatively insensitive to this one elastic constant.
SUPPLEMENTARY NOTE 10 Therapeutic Glove Prototype
We fabricated the samples of different fabrics by hand using 2.75 mm and 2.0 mm needles.
We then measured the stiffness of each test sample using the uniaxial stretching experiment protocol, described in SUPPLEMENTARY NOTE 1.
The experiment results are shown in Supplementary Fig. 16, constitutive model fits are given in Supplementary Table 19, and the Young’s moduli and Poisson ratios are given in Supplementary Table 20. The yarns used for the glove were chosen because visually they would help the reader discern which stitch patterns were implemented and where. These yarns were fairly similar to the acrylic yarn, which was unavailable in a large enough color variety for this experiment.
We took measurements of the hand, in particular the relative location of joints and other parts of the anatomy.
We used those measurements to determine where in the glove we needed rigidity and where we needed flexibility to support natural hand motion for the specific glove wearer.
This determined which type of fabric was needed in each region of the glove.
We used the stitch gauge – how many stitches comprise five centimeters of fabric, also known as the stitch density – from the test samples to determine of the number of stitches needed in each part of the glove to match the hand dimensions.
We targeted 20 - 30 mm Hg for the hand of the specific wearer but it was calculated to be approximately 3.75 kPa or 28 mm Hg. This pressure was calculated by measuring the rest, flat position of the circumference of the glove, then measuring the circumference of the glove on the the hand. From these measurements, we calculate the linear strain of the glove as it is being worn. Using Supplementary Fig. 16, we use this strain to find a correlated stress. Multiplying the stress by the width of the wrist support segment (the stockinette region around the wrist) gives a force, which is then divided by the area of the wrist support segment to estimate a pressure. The pressure provided by the theraputic glove prototype is comparable to the pressure that compression stockings are, between 30-40 mm Hg Lim2014 . We have achieved this comparable pressure without the use of elastane. The placement of the other stitch patterns was chosen ad hoc to illustrate the anisotropic behavior of the fabric to enable unrestricted motion of the human hand.
To create a seamless pattern which augments the stiffness of the stockinette fabric that supports the radiocarpal and intercarpal joints, we chose to knit the pattern as a single flat piece, starting from the thumb, wrapping the hand from the back to the front, and finally grafting the start and end of the fabric together into a glove.
Knitting this horizontally as a flat piece rather than as a tubular knit enabled us to exploit the stiffest direction of stockinette fabric to provide pressure to the wrist.
For the illustration in this paper, we chose to highlight the different types of fabric with different-colored yarn.
These were knitted together in situ using a seamless joining technique known as “intarsia.”
The pattern shown in Supplementary Fig. 17 can also be knit with a single color of yarn without using intarsia.
Supplementary Fig. 16: The experimental stress-versus-strain relations for the four fabrics made for the therapeutic glove prototype in the (a) - and (b) -directions. All of the data for each type of fabric is displayed by a different color: stockinette in blue, garter in orange, rib in green, and seed in purple.
The experimental data is shown in the translucent regions where the width of the region is one standard deviation of the data.
The solid curves are fits to the constitutive relations.
Dashed lines depict the linear response at zero stress.
Supplementary Fig. 17: Pattern for the therapeutic glove. Arrows indicate direction of knitting.
(N/mm)
(N/mm)
(N/mm)
(N/mm)
(N/mm)
(N/mm)
Stockinette
0.210
0.590
0.116
0.267
0.926
1.777
0.045
0.047
1.225∗
1.646∗
0.758∗
0.936∗
1.806∗
2.426∗
0.051∗
0.088∗
Garter
0.149
0.076
0.035
0.032
0.928
0.732
0.043
0.039
Rib
0.046
0.452
0.028
0.100
0.483
1.547
0.039
0.059
Seed
0.108
0.120
0.225
0.044
0.889
1.006
0.047
0.028
Supplementary Table 19: List of parameters obtained by fitting the constitutive model to experimental data representing test samples made for the therapeutic glove. Data that is starred was made on 2.00 mm knitting needles (US size 0) and all remaining data was knit on 2.75 mm knitting needles (US size 2).
(N/mm)
(N/mm)
Stockinette
0.157
0.442
0.452
0.554
0.793∗
1.066∗
0.569∗
0.619∗
Garter
0.134
0.068
0.419
0.236
Rib
0.040
0.392
0.222
0.599
Seed
0.100
0.111
0.362
0.208
Supplementary Table 20: List of parameters obtained by fitting the Young’s moduli and Poisson ratios to experimental data representing the test samples of the therapeutic glove. Data that is starred was made on 2.00 mm knitting needles (US size 0) and all remaining data was knit on 2.75 mm knitting needles (US size 2).
SUPPLEMENTARY NOTE 11 Knitting Machine versus Hand Knitting
In general, ensuring uniform tension and uniform stitch size between types of fabrics is challenging for knitting. We were able to uniformly craft and replicate each fabric type with an equivalent number of rows and columns with a knitting machine. The knitting machine is ideal for ensuring uniform tension throughout the sample; however, it comes at the expense of not guaranteeing uniform stitch size between types of fabrics. For the lace weight samples made with the STOLL Industrial knitting machine, stockinette and garter were made with a stitch size setting of 12 while rib and seed were made at size 11. We find that if all four types of fabric are made at size 12, rib and seed are significantly more loose (Supplementary Fig. 18). Hand knitting, in contrast, cannot guarantee uniform tension throughout the sample, but provides greater control of stitch size even while altering the pattern of the knit and purl stitches due to the fixed diameter of the knitting needle, as seen in Supplementary Table 2. Despite these differences, we do get consistent behavior of the four different types of fabric both machine made (Fig. 2 and Supplementary Fig. 6) and hand made (Supplementary Fig. 16). Supplementary Table 2 displays the differences in the yarn per stitch and the yarn diameter between machine-knit and hand-knit samples for the acrylic yarn.
Supplementary Fig. 18: Comparison of (a) rib and (b) seed fabrics made on the STOLL Industrial knitting machine at different assigned stitch sizes. On the left are fabrics made at size 11 whereas on the right they are made at size 12. The insets display a closeup on a 1 cm by 1 cm portion of the fabrics.