Picotesla magnetometry of microwave fields with diamond sensors
Abstract
Developing robust microwave-field sensors is both fundamentally and practically important with a wide range of applications from astronomy to communication engineering. The Nitrogen-Vacancy (NV) center in diamond is an attractive candidate for such purpose because of its magnetometric sensitivity, stability and compatibility with ambient conditions. However, the existing NV center-based magnetometers have limited sensitivity in the microwave band. Here we present a continuous heterodyne detection method that can enhance the sensor’s response to weak microwaves, even in the absence of spin controls. Experimentally, we achieve a sensitivity of 8.9 pTHz-1/2 for microwaves of 2.9 GHz by simultaneously using an ensemble of NV centers within a sensor volume of mm3. Besides, we also achieve scaling of frequency resolution up to measurement time of 10000 s. Our method removes the control pulses and thus will greatly benefit the practical application of diamond-based microwave sensors.
Improving the sensitivity of microwave-field detection could directly advance many modern applications, such as wireless communication Holl2017 , electron paramagnetic resonance ESRbook , high-field nuclear magnetic resonance Moser2017 , and even astronomical observations Pastor2021 . Instead of conventional inductive detection, various quantum sensors have been developed in the past decades with enhanced capabilities. For instance, Rydberg atoms Jing2020 , atomic magnetometers Gerginov2019 , superconducting quantum interference devices (SQUIDs) Couedo2019 , and nitrogen-vacancy (NV) centers in diamond Chipaux2015 ; Wang2015 ; Shao2016 ; Joas2017 ; Stark2017 ; Horsley2018 ; Meinel2021 are highly sensitive to either the electric or magnetic field of microwaves. Among them, NV centers are distinguished by their unique properties including solid-state aspect and room-temperature compatibility, which are essential for on-chip detection Kim2019 , but suffer from relatively low sensitivity.
By using NV ensembles, the diamond magnetometry has demonstrated sub-pTHz-1/2 sensitivity for low-frequency ( MHz) fields Wolf2015 . But it quickly degrades to sub-THz-1/2 level when sensing high-frequency (GHz) fields Horsley2018 . The reason is that the high-sensitivity protocols based on either pulsed or continuous dynamical decoupling are failed in the high-frequency range due to limited driving power Taylor2008 ; London2013 . Although this problem has recently been resolved by pulsed Mollow absorption Joas2017 ; Meinel2021 and concatenated continuous dynamical decoupling on single NV centers Stark2017 , generalizing those sophisticated control pulses to a larger area of NV ensembles remains challenging, due to the requirement of both strong and inhomogeneous control fields. To remove those barriers, one can directly observe the absorption of microwave by NV centers and the subsequent spin transitions via measuring either optically detected magnetic resonance (ODMR) spectra Chipaux2015 ; Shao2016 or Rabi oscillations Wang2015 ; Horsley2018 . However, the absorption becomes inefficient and even loses the first-order response to the microwave field when the corresponding Rabi frequency is smaller than the inhomogeneous transition linewidth .
Here, we propose a continuous heterodyne detection scheme to enhance the absorption of weak microwave fields by introducing a moderate (still much weaker than ) and slightly detuned reference microwave. Under the illumination of a 532 nm laser, the continuously applied reference microwave interferes with the signal microwave, resulting in an oscillation of the NV photoluminescence. The oscillation directly gives the two important information of the signal microwave, field strength and frequency. We perform the demonstration on an ensemble of NV centers within an effective sensor volume of mm3. The diamond sensor maintains linear response to weak microwave fields down to subpicotesla. Within a total measurement time of 1000 s, a microwave field of 0.28 pT is detectable, corresponding to a sensitivity of 8.9 pTHz-1/2. The frequency resolution scales as down to 0.1 mHz for s. We note that the strength of reference microwave required is just 200 nT. The removal of sophisticated control pulses makes our method applicable to larger diamond sensors with further improved sensitivity. It also greatly benefits practical applications.
The NV electron spin has a triplet ground state consisting of a bright state and two degenerate dark states (denoting as and hereinafter) with a zero-field splitting of GHz. The degeneracy can be lifted by an external magnetic field . Without loss of generality, we assume the microwave of the form is resonant with transition (Fig. 1a), and then treat the NV center as a two-level system. If the microwave field is strong enough, one can observe a Rabi oscillation between and with frequency , where is the gyromagnetic ratio of the NV electron spin. As shown in Fig. 1b, the oscillation slows down with reducing , and finally degrades to an exponential decay. In addition to the intrinsic longitudinal relaxation , the weak microwave opens an extra relaxation channel between and with rate of Hall2016 , where is the dephasing rate. In the presence of continuous laser, will be polarized to with a rate of , which competes with the relaxation. A simple rate equation can describe the evolution of NV states (see Methods). In short, the competition leads to an equilibrium state, where the population of is
| (1) |
The extra relaxation will result in decreased fluorescence (Fig. 1c). In the weak-field limit, i.e., , this decrement is , which means the NV center only preserves second-order response to the microwave.
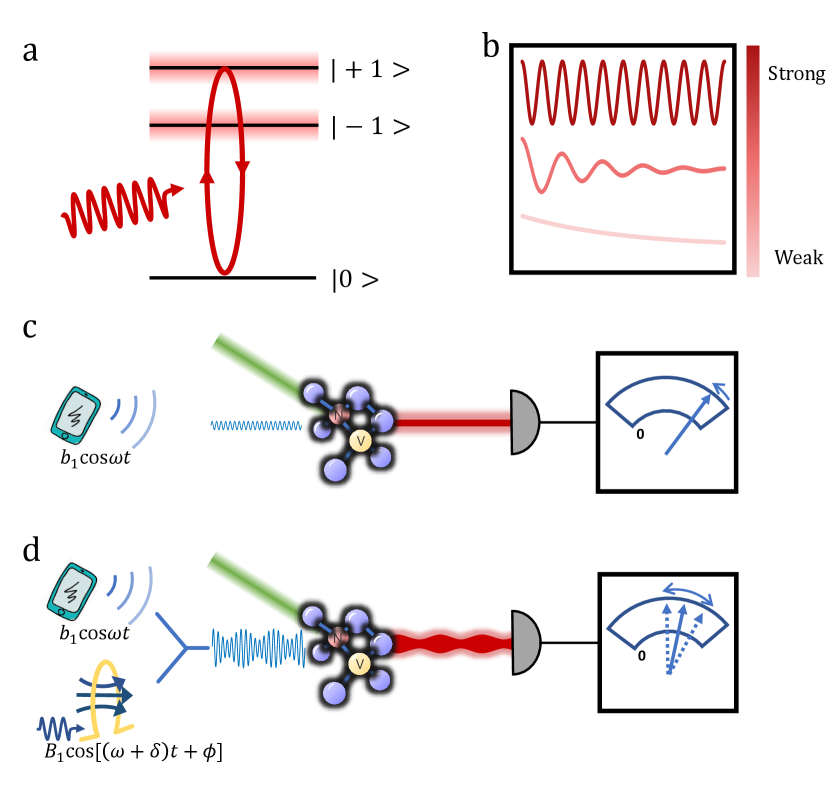
If applying a reference microwave of the form simultaneously, a microwave interference will happen resulting in a modulation of the amplitude with beat frequency , as shown in Fig. 1d. In the situation of , the amplitude can be simplified as . Here we assume both microwaves are resonant with the NV center, i.e. , and thus the two microwaves can be treated as a single one leading to a time-varying relaxation rate of , where and . The constant term induces a constant decrement of fluorescence, while the oscillating term induces an oscillation of fluorescence. The latter is predicted by the solution of rate equation (see Methods)
| (2) |
The oscillation frequency is just the heterodyne frequency , and the amplitude is . Now the NV center has linear response to the microwave. We note the relaxation between and will no longer negligible when is comparable or smaller than . Nevertheless, the linear response does not change but with a slightly different coefficient (see SI).
Benefit from the removal of complicated control pulses, we can perform the experiment on a simply-built setup (Fig. 2a). We use an optical compound parabolic concentrator (CPC) to enhance the fluorescence collection efficiency Wolf2015 . As a proof-of-principle demonstration, both the signal and reference microwaves are radiated from a 5-mm-diameter loop antenna. We apply an external magnetic field ( 12.5 G) perpendicular to the diamond surface, so that all the NV centers have the same Zeeman splittings. A common ODMR spectrum (Fig. 2b) can be obtained by sweeping microwave frequency. The triplet feature arises from the hyperfine coupling between the NV electron spin and the 14N nuclear spin. The ODMR linewidth of 482 kHz is defined by the full width at half maximum (FWHM). Here both the laser and microwave are weak enough, so that Dreau2011 .
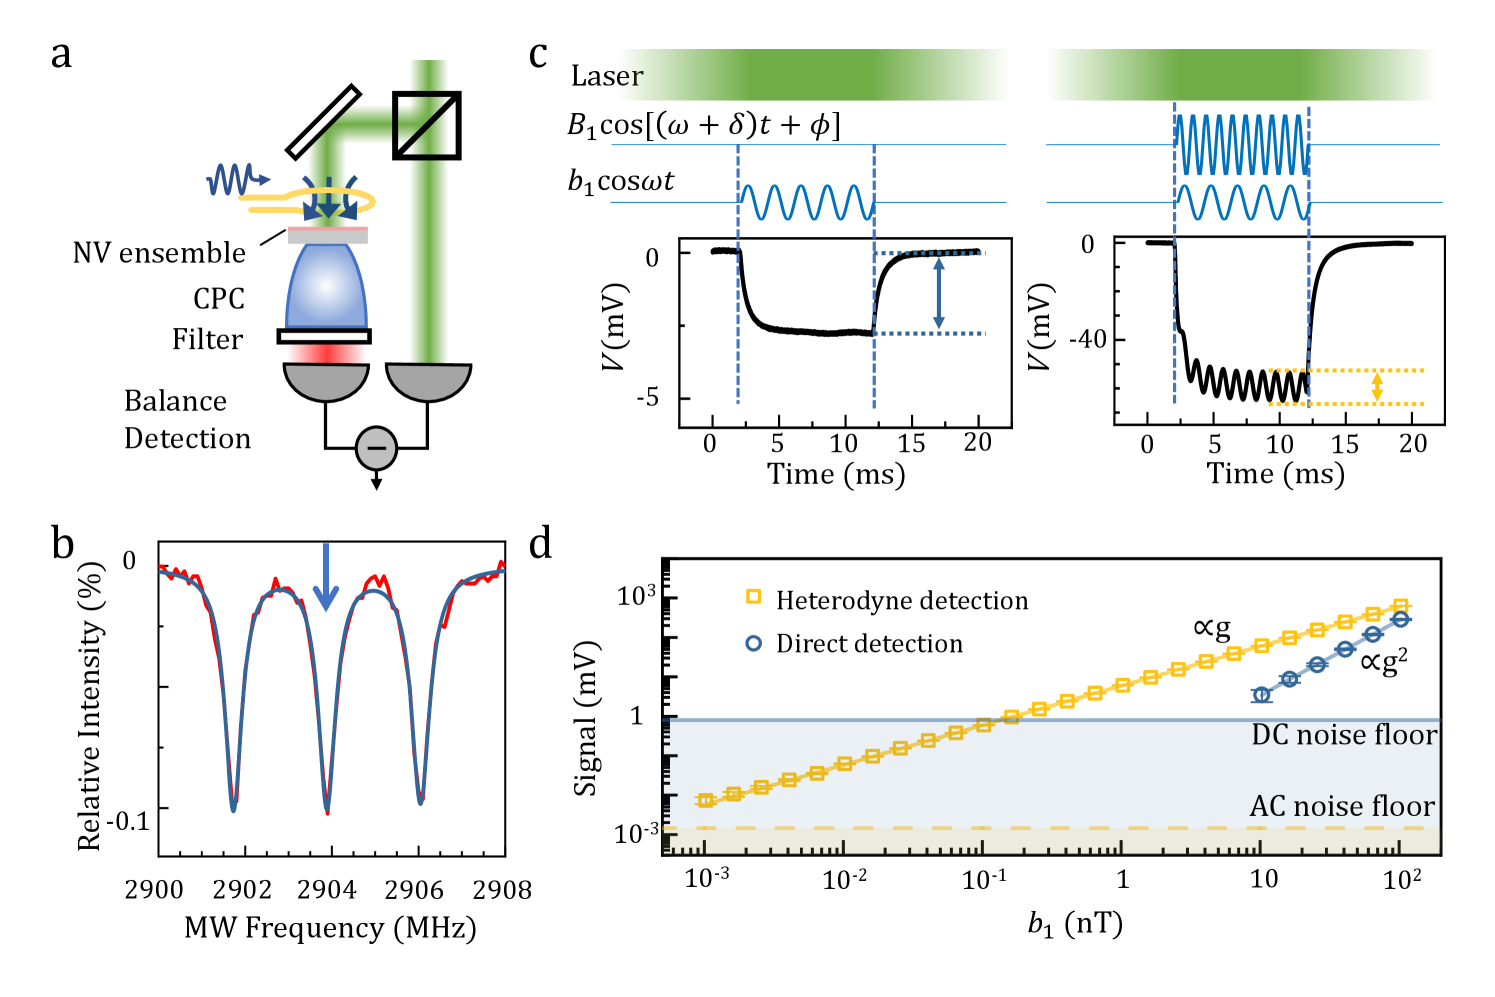
We first apply a single-channel resonant microwave. As shown in Fig. 2c, the photovoltage begins to decrease from when the microwave is turned on, and approaches to a saturation value . When the microwave is turned off, the photovoltage returns to with a slower revival rate of . Measurements of the dependence of the revival rate on the laser power (W) gives Hz and Hz (see SI), where W is much lower than the saturation power. As predicted by Eq. 1, the voltage difference shows squared dependence on the microwave field (Fig. 2d), and quickly lost in the noise. Here is calibrated according to the relation , where is the microwave power (see SI). Within a total measurement time of 1000 s, the minimum detectable is just nT. It means this direct measurement is insufficient to sensing weak fields.
We then apply a dual-channel resonant microwave. The time trace of photovoltage shows a similar behavior of decrease and revival with microwave turning on and off. Besides, it also shows an oscillation (Fig. 2c), where the frequency and amplitude can be directly extracted from the Fourier transform spectrum (not shown). is just the heterodyne frequency of the two microwaves, while is proportional to the signal field . As shown in Fig. 2d, this linear response preserves over 5 orders in amplitude. Therefore, we have constructed a well field-to-voltage sensor with a dynamical range from 1 pT to 100 nT.
To optimize the sensor’s performance, we need improve the signal-to-noise ratio (SNR). According to Eq. 2, the sensor’s responsivity depends on multiple parameters , , , and , where the last is intrinsic and nonadjustable. We first focus on the reference microwave field (i.e. ), which is the key to enhance the response of NV centers to weak fields, serving as an amplifier. As shown in Fig. 3a, the signal first grows linearly with increasing , then tends to saturate, and eventually goes down. Although this trend is consistent with the theoretical expectation, the specific experimental values still show obvious deviations from either Eq. 2 or the more accurate three-level model (SI). There are two reasons. First, the estimation of dephasing rate from the ODMR linewidth () is inaccurate, where the static or quasi-static noise, such as local inhomogeneous strain fields or couplings to 13C nuclear spins, make considerable contribution. However, this kind of noise is not captured by the master equation (see SI). It will induce static or quasi-static shift of the resonant frequency, similar to the 14N hyperfine coupling, rather than speed up the transverse relaxation. Therefore, both the effective transverse relaxation rate and the effective contrast are overestimated. It can explain the optimal is smaller than the expectation. By loosing as a free parameter, the experimental results can be fitted by Eq. 2 better, where kHz. Second, is inhomogeneous for different NV centers, which can explain the experimental curve is more flat than the fit. More accurate models are unavailable without the prior knowledge of actual distribution of . The optimal appears at 220 nT, corresponding to 4.35 kHz, well below the ODMR linewidth. We note the removal of strong control fields is the most important advantage of our method.
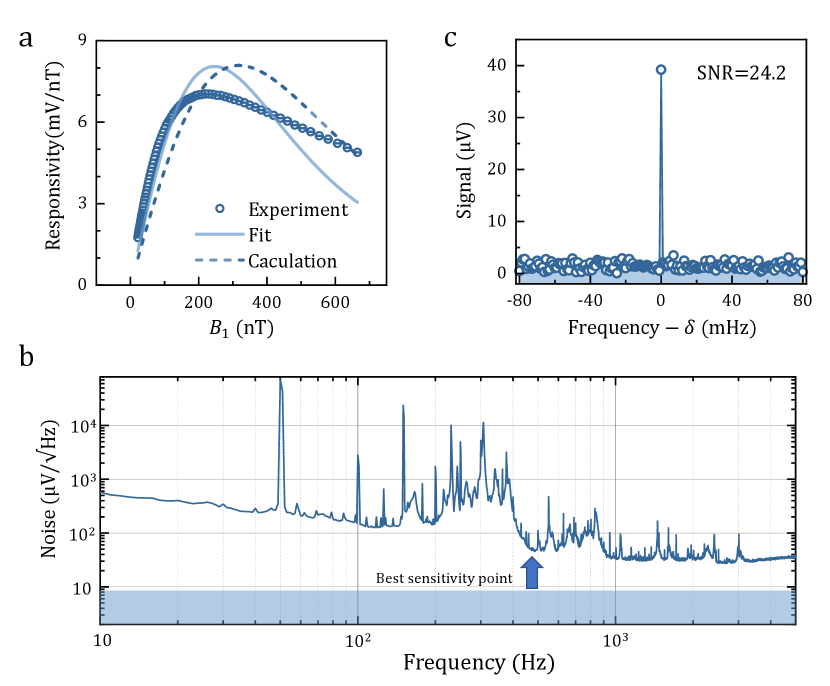
Another adjustable parameter is the laser power , which determines the spin polarization rate . In principle, larger is preferred to maximal SNR if the noise is dominated by photon shot noise (see methods). However, the increase of will introduce more experimental imperfections, such as sample heating and laser-induced photon noise. Therefore, we choose a moderate laser power W (see SI), corresponding to Hz. At this point, the temperature of the diamond increases by 31.4 K. Figure 3b shows the noise spectral density of the fluorescence, which is contributed by the laser-induced noise, the electric noise of the photodetector, and photon shot noise. The first and last terms are proportional to the photon numbers and , respectively, while the second term is independent of . Here the fluorescence is strong enough, so that only the laser-induced noise dominates.
For a constant-frequency signal microwave, we can adjust by tuning the frequency of the reference microwave. Due to the limited bandwidth, as we will discuss latter, increasing will reduce the signal, but it also brings lower noise (Fig. 3b). To maximal SNR, the optimal here is 480 Hz. Finally, we measure a microwave with frequency of 2903.9 MHz and field strength of 6.81 pT. Within a total measurement of 1000 s, the measured SNR is 24.2 (Fig. 3c), corresponding to a sensitivity of 8.9 pTHz-1/2.
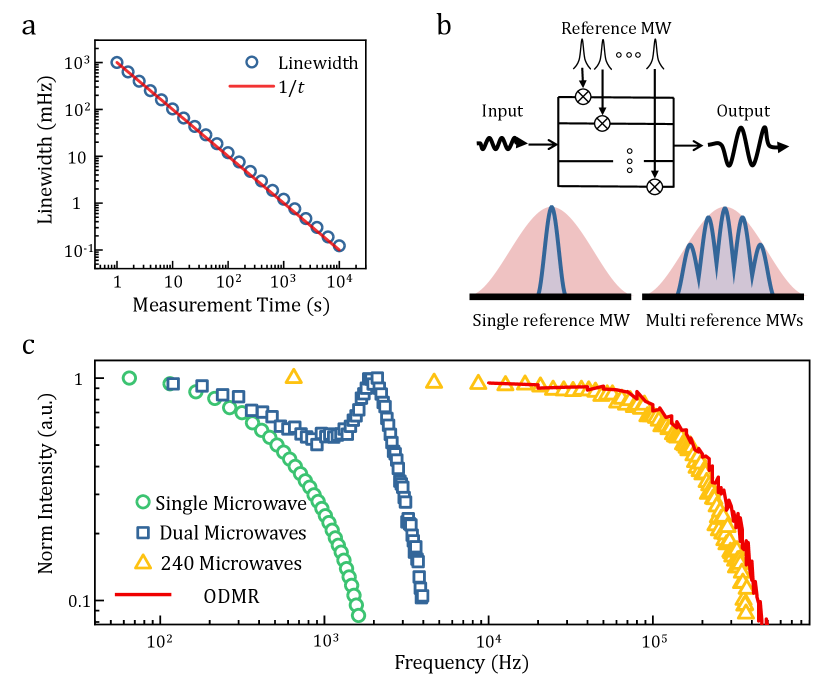
In addition to the high sensitivity, another highlight of our method is the unlimited frequency resolution, similar to previous heterodyne measurements Schmitt2017 ; Boss2017 ; Meinel2021 . As shown in Fig. 4a, the frequency resolution can be improve to 0.1 mHz by extending the total measurement time to 10000 s. Moreover, the frequency resolution do not show obvious deviations from the scaling up to 10000 s (inset of Fig. 4a). Another important figure-of-merit associated with frequency resolution is the bandwidth. According to Eq. 2, the 3-dB bandwidth is , which is on the order of 100 Hz. A intuitive picture to understand this bandwidth is that the oscillation comes from the interference between the signal and reference microwave, but the fluorescence has limited-speed response to variations of the microwave field (Fig. 2c). The limited respond in time domain corresponds to the limited bandwidth in frequency domain. The diamond sensor thus serves like a narrow-band mixer. To extend bandwidth, we can cascade multiple ‘mixers’, as shown in Fig. 4b. By simultaneously applying 240 channels of reference microwaves with frequency interval of 2 kHz, the ‘bandwidth’ extends to 190 kHz, which is limited by the ODMR linewidth. Although the sensor has response to all microwaves within the bandwidth, the measured frequency is the frequency difference between the signal microwave and the nearest reference microwave. It means frequency aliasing will happen, and thus we need repeat the measurement with different frequency interval of the reference microwaves to extract the actual frequency. We note the extension of bandwidth comes at the expense of sensitivity. When the signal microwave is interfering with one of the reference microwaves, the others serves like noise sources inducing additional longitudinal relaxation, corresponding to larger , and thus poorer sensitivity. Specifically, for channels of reference microwaves, the bandwidth scales as , while the sensitivity scales as (see Methods).
Conclusions We have shown that NV centers can be used as highly sensitive sensors for microwave magnetometry even in the absence of spin controls. Our method is based on the resonant absorption of microwaves by NV centers. We significantly improve its response to weak fields by introducing a moderate reference microwave. Furthermore, we applied the method to a diamond containing ensembles of NV centers, achieving minimum detectable microwave field of 0.28 pT and frequency resolution of 0.1 mHz.
Benefit from the simplicity of our method, the measurements can be directly reproduced on larger sensors, resulting further improved sensitivity. For example, if the diamond has a similar size as the photodiode ( mm3), the sensitivity can be directly promoted to fT level. Even so, the sensor is still far smaller than microwave wavelengths. An increase in NV density will also leads to improved sensitivity, but needs to balance the increase of relaxation rate and the accompanying laser heating problem. The current submegahertz detection bandwidth is limited by the ODMR linewidth. Improvement to gigahertz is possible by introducing a magnetic field gradient Chipaux2015 and more reference microwaves. On the other hand, the sensitive frequency band is determined by the spin transition, which is magnetically adjustable up to hundreds of GHz Fortman2021 and even to the THz range in the future. Another small-range tuning method is using the Floquet dressed states that are independent of transition frequency Meinel2021 .
Our work paves the way for practical applications of diamond sensors, for example, microwave receivers in radars Lloyd2008 , wireless communications Koenig2013 , and even radio telescopes Pastor2021 . This diamond devices can work in extreme conditions, such as high temperature Liu2019 , high pressure Hsieh2019 ; Yip2019 ; Lesik2019 . The removal of spin controls will also efficiently reduce the complexity of contracting an on-chip diamond magnetometer Kim2019 .
I MATERIALS AND METHODS
I.1 Experimental setup and diamond samples
The core of our experimental setup is a sandwich of diamond, CPC (Edmund 45DEG2.5MM) and optical filter (Semrock LP02-638RU-25), which is mounted on a photodiode (Thorlabs PDAPC2) for fluorescence detection. A high-power laser (Lighthouse Sprout-D-5W) is used for illumination. The microwaves are generated from two RF signal generators (Stanford SG386) and/or an arbitrary waveform generator(Keysight M8190a), amplified by a microwave amplifier (Mini-circuits ZHL-25W-63+) or attenuated by several attenuators, and radiated by a home-build loop antenna with a diameter of 5 mm. Another photodiode (Thorlabs PDA36A2) is used for laser detection. The photovoltage is detected by an oscilloscope (NI PXIe-5122) after a differential amplifier (Stanford SR560). For the 10000 s measurement (Fig. 4a), another oscilloscope (Keysight MSOS254A) is used. All clocks are synchronized by one of the RF signal generators. The diamond is 100-oriented with an extra high-doping layer 10 m thick growth with 99.99% 12C isotopic purity. The effective sensor volume is mm3 with estimated NV density of 4 ppm. So the total number of NV centers is .
I.2 Rate equations
Considering a two-level system consisting of and , there exists a relaxation between them of the rate and a polarization from to of the rate . So the rate equations are
| (3) |
where is the population of , and satisfies . The solution is
| (4) |
where is the equilibrium solution () given by Eq. 1. If applying two microwaves, the rate equations becomes
| (5) |
Considering that , the time-varying term is only a perturbation of the relaxation rate, so the solution should also be a perturbation of the equilibrium solution . Substituting a trail solution into Eq. 5 yields , , and
| (6) |
I.3 Shot-noise-limited sensitivity
If the laser power is much lower than the saturation power, the photon emission rate of NV centers is proportional to the polarization rate . In a sample period , the detected photons are , where is constant depending on the collection efficiency. Therefore, within a total measurement time of , the SNR of Fourier transform spectra is
| (7) |
where is the fluorescence contrast of NV centers. The noise is defined by the RMS of base line in Fourier transform spectra, so there exists a coefficient 2 in the denominator. Here one can see that larger and are preferred, and the SNR quickly saturates to when . Therefore, the shot-noise-limited sensitivity is
| (8) |
For channels of reference microwaves, only one of them interference with a specific single microwave and others induced additional longitudinal relaxation. So Eq. 7 becomes
| (9) |
It saturates to when .
Acknowledgments
We thank Liang Zhang for helpful discussions. We thank element six for providing the diamond. Funding: This work was supported by the National Natural Science Foundation of China (Grants Nos. 81788101, 31971156, T2125011), the National Key R&D Program of China (Grants Nos. 2018YFA0306600), the CAS (Grants Nos. XDC07000000, GJJSTD20200001, and YIPA2015370), and the Anhui Initiative in Quantum Information Technologies (Grant No. AHY050000). Author contributions: J.D. and F.S. supervised the entire project. F.K. and F.S. designed the experiments. Z.W., F.K., and P.Z. prepared the setup and performed the experiments. F.K. and Z.H. carried out the calculations. P.Y. and Y.W. prepared the test diamonds. F.K., Z.W., and F.S. wrote the manuscript. All authors discussed the results and commented on the manuscript. Competing interests: The authors declare no competing interests. Data and materials availability: All data needed to evaluate the conclusions in the paper are present in the paper and/or the Supplementary Materials. Additional data related to this paper may be requested from the authors.
Reference
- (1) Holl, P. M. & Reinhard, F. Holography of wi-fi radiation. Phys. Rev. Lett. 118, 183901 (2017).
- (2) Sevilla, M. D. et al. Electron Paramagnetic Resonance, vol. 19 of SPR - Electron Paramagnetic Resonance (The Royal Society of Chemistry, 2004).
- (3) Moser, E., Laistler, E., Schmitt, F. & Kontaxis, G. Ultra-high field NMR and MRI – the role of magnet technology to increase sensitivity and specificity. Front. Phys. 5, 33 (2017).
- (4) Pastor-Marazuela, I. et al. Chromatic periodic activity down to 120 megahertz in a fast radio burst. Nature 596, 505–508 (2021).
- (5) Jing, M. et al. Atomic superheterodyne receiver based on microwave-dressed Rydberg spectroscopy. Nat. Phys. 16, 911–915 (2020).
- (6) Gerginov, V., da Silva, F. C. S., Hati, A. & Nelson, C. An atomic sensor for direct detection of weak microwave signals. IEEE Trans. Microw. Theory Techn. 67, 3485–3493 (2019).
- (7) Couëdo, F. et al. High-Tc superconducting detector for highly-sensitive microwave magnetometry. Appl. Phys. Lett. 114, 192602 (2019).
- (8) Chipaux, M. et al. Wide bandwidth instantaneous radio frequency spectrum analyzer based on nitrogen vacancy centers in diamond. Appl. Phys. Lett. 107, 233502 (2015).
- (9) Wang, P. et al. High-resolution vector microwave magnetometry based on solid-state spins in diamond. Nat. Commun. 6, 6631 (2015).
- (10) Shao, L., Zhang, M., Markham, M., Edmonds, A. M. & Lončar, M. Diamond radio receiver: Nitrogen-vacancy centers as fluorescent transducers of microwave signals. Phys. Rev. Applied 6, 064008 (2016).
- (11) Joas, T., Waeber, A. M., Braunbeck, G. & Reinhard, F. Quantum sensing of weak radio-frequency signals by pulsed Mollow absorption spectroscopy. Nat. Commun. 8, 964 (2017).
- (12) Stark, A. et al. Narrow-bandwidth sensing of high-frequency fields with continuous dynamical decoupling. Nat. Commun. 8, 1105 (2017).
- (13) Horsley, A. et al. Microwave device characterization using a widefield diamond microscope. Phys. Rev. Applied 10, 044039 (2018).
- (14) Meinel, J. et al. Heterodyne sensing of microwaves with a quantum sensor. Nat. Commun. 12, 2737 (2021).
- (15) Kim, D. et al. A CMOS-integrated quantum sensor based on nitrogen-vacancy centres. Nat. Electron. 2, 284–289 (2019).
- (16) Wolf, T. et al. Subpicotesla diamond magnetometry. Phys. Rev. X 5, 041001 (2015).
- (17) Taylor, J. M. et al. High-sensitivity diamond magnetometer with nanoscale resolution. Nat. Phys. 4, 810–816 (2008).
- (18) London, P. et al. Detecting and polarizing nuclear spins with double resonance on a single electron spin. Phys. Rev. Lett. 111, 067601 (2013).
- (19) Hall, L. T. et al. Detection of nanoscale electron spin resonance spectra demonstrated using nitrogen-vacancy centre probes in diamond. Nat. Commun. 7, 10211 (2016).
- (20) Dréau, A. et al. Avoiding power broadening in optically detected magnetic resonance of single nv defects for enhanced dc magnetic field sensitivity. Phys. Rev. B 84, 195204 (2011).
- (21) Schmitt, S. et al. Submillihertz magnetic spectroscopy performed with a nanoscale quantum sensor. Science 356, 832–837 (2017).
- (22) Boss, J. M., Cujia, K. S., Zopes, J. & Degen, C. L. Quantum sensing with arbitrary frequency resolution. Science 356, 837–840 (2017).
- (23) Fortman, B. et al. Electron electron double resonance detected NMR spectroscopy using ensemble NV centers at 230 GHz and 8.3 T. J. Appl. Phys. 130, 083901 (2021).
- (24) Lloyd, S. Enhanced sensitivity of photodetection via quantum illumination. Science 321, 1463–1465 (2008).
- (25) Koenig, S. et al. Wireless sub-THz communication system with high data rate. Nat. Photon. 7, 977–981 (2013).
- (26) Liu, G.-Q., Feng, X., Wang, N., Li, Q. & Liu, R.-B. Coherent quantum control of nitrogen-vacancy center spins near 1000 kelvin. Nat. Commun. 10, 1344 (2019).
- (27) Hsieh, S. et al. Imaging stress and magnetism at high pressures using a nanoscale quantum sensor. Science 366, 1349–1354 (2019).
- (28) Yip, K. Y. et al. Measuring magnetic field texture in correlated electron systems under extreme conditions. Science 366, 1355–1359 (2019).
- (29) Lesik, M. et al. Magnetic measurements on micrometer-sized samples under high pressure using designed nv centers. Science 366, 1359–1362 (2019).